Article

Public Awareness of Drinking Water Safety and Contamination Accidents: A Case Study in Hainan Province, China

1
National Institute of Environmental Health, Chinese Center for Disease Control and Prevention, Beijing 100050, China
2
Yale School of Public Health, Yale University, New Haven, CT 06520, USA
*
Author to whom correspondence should be addressed.
Li Wang and Lan Zhang contributed equally.
Water 2018, 10(4), 446; https://doi.org/10.3390/w10040446
Submission received: 28 February 2018 / Revised: 23 March 2018 / Accepted: 4 April 2018 / Published: 9 April 2018

Abstract

:
To understand public awareness about drinking water safety and water contamination accidents in rural areas of China, two rural counties of Hainan Province were selected as pilot sites for investigation. We explored the degree of public satisfaction with drinking water quality, public trust of drinking water safety, and public awareness about drinking water problems and solutions. The results showed that 80.3% of respondents were satisfied with the quality of their drinking water. About 78.8% of respondents paid special attention or comparatively high attention to drinking water quality and contamination accidents, especially regarding potential damage to the human body and health, the influence scope, and the causes of accidents. A total 52.4% of respondents solved drinking water problems by themselves; few respondents complained to the health department or called the local telephone hotline. Age and sex did not play significant roles in the degree of public satisfaction with water quality or in the public perception of water pollution accidents; however, residents in rural areas within a drinking water quality monitoring network were more satisfied with their drinking water quality and more aware of drinking water contamination accidents than in areas outside of such a network. Respondents with higher education levels had greater awareness than those with lower education levels with respect to water quality and water pollution accidents.

1. Introduction

Access to safe drinking-water is important as a health and development issue at national, regional and local levels [1]. China has experienced many drinking water pollution accidents in the past several decades [2]. There has been great effort made from government, industry, academia, and nongovernmental organizations in China to face the challenges of drinking water pollution events [3,4]. However, owing to the governing structure of Chinese society, public participation has not been well-developed with respect to environmental protection [5]. Municipalities and educators have learned that it is not enough to just provide safe drinking water to consumers. Doria suggested the general public is an important factor in water management [6]. IWA declared standards should be based on the protection of human health and consumer acceptability [7]. Public acceptability of drinking water also forms part of the World Health Organization’s guidelines for drinking water quality [1]. Thus, the public perceptions about drinking water safety and contamination accidents must not be dismissed [8,9]. The success of public environmental participation is based upon sufficient awareness of environmental issues [10,11]. Many studies have found that increasing public environmental awareness and knowledge is crucial to the success of pollution prevention [5,12,13,14]. The public awareness of drinking water safety is relevant to promotion of household water treatment, to household choices over drinking water sources, and to the prevention of water contamination accidents [15].
In several countries, some scholars identified and evaluated the public awareness of drinking water, for example, in the Pacific Northwest, USA, Mahler et al. evaluated the drinking water issues and concerns of the urban public and found the urban public is satisfied that their home drinking water is safe [8]. In Ankara, Turkey, Calicioglu et al. used the contingent valuation method to determine the public perception and willingness to pay for improvements on water quality [16]. In Austria, Fröhler and Elmadfa investigated the public perception of drinking water quality and found 75% of respondents were completely satisfied with the quality of drinking water [17]. These studies showed that quality perception, service satisfaction and the selection of water sources were very important for evaluating public awareness of drinking water safety and accident. A better understanding of the factors that influence public awareness of drinking water can contribute to improvements in water management, consumer services and water pollution accident prevention and control. Many factors have been found to be involved in the public awareness of drinking water quality. Water sources, water treatment processes, and water supply networks can easily affect drinking water quality and safety [1]. Water quality has a close relationship with people’s livelihood, and access to safe drinking water is essential to health [1]. The awareness of water quality and risk resulted from a complex interaction of diverse factors including water taste, odor, clarity, socio-economic characteristics, demographic characteristics, water treatment, geographic location in the distribution system and information provided by the local media [15,18,19]. For operating drinking water supply systems, the quantity of water, water pressures and breakdowns could also affect drinking water quality [20]. However the recent studies of drinking water safety awareness have been particularly focused around bottled water consumption, municipal water and recycled water. There are limited studies on public awareness about drinking water safety and the relationship between public awareness and prevention of drinking water accidents in rural areas. Thus, this study was designed to investigate the facts about public awareness of drinking water safety and water pollution accidents in Hainan Province, China, and to evaluate information about public awareness and attitudes of drinking water and water pollution. The knowledge provided by this study will contribute to the prevention of drinking water contamination and improvements in water management, especially from the perspective of public participation.

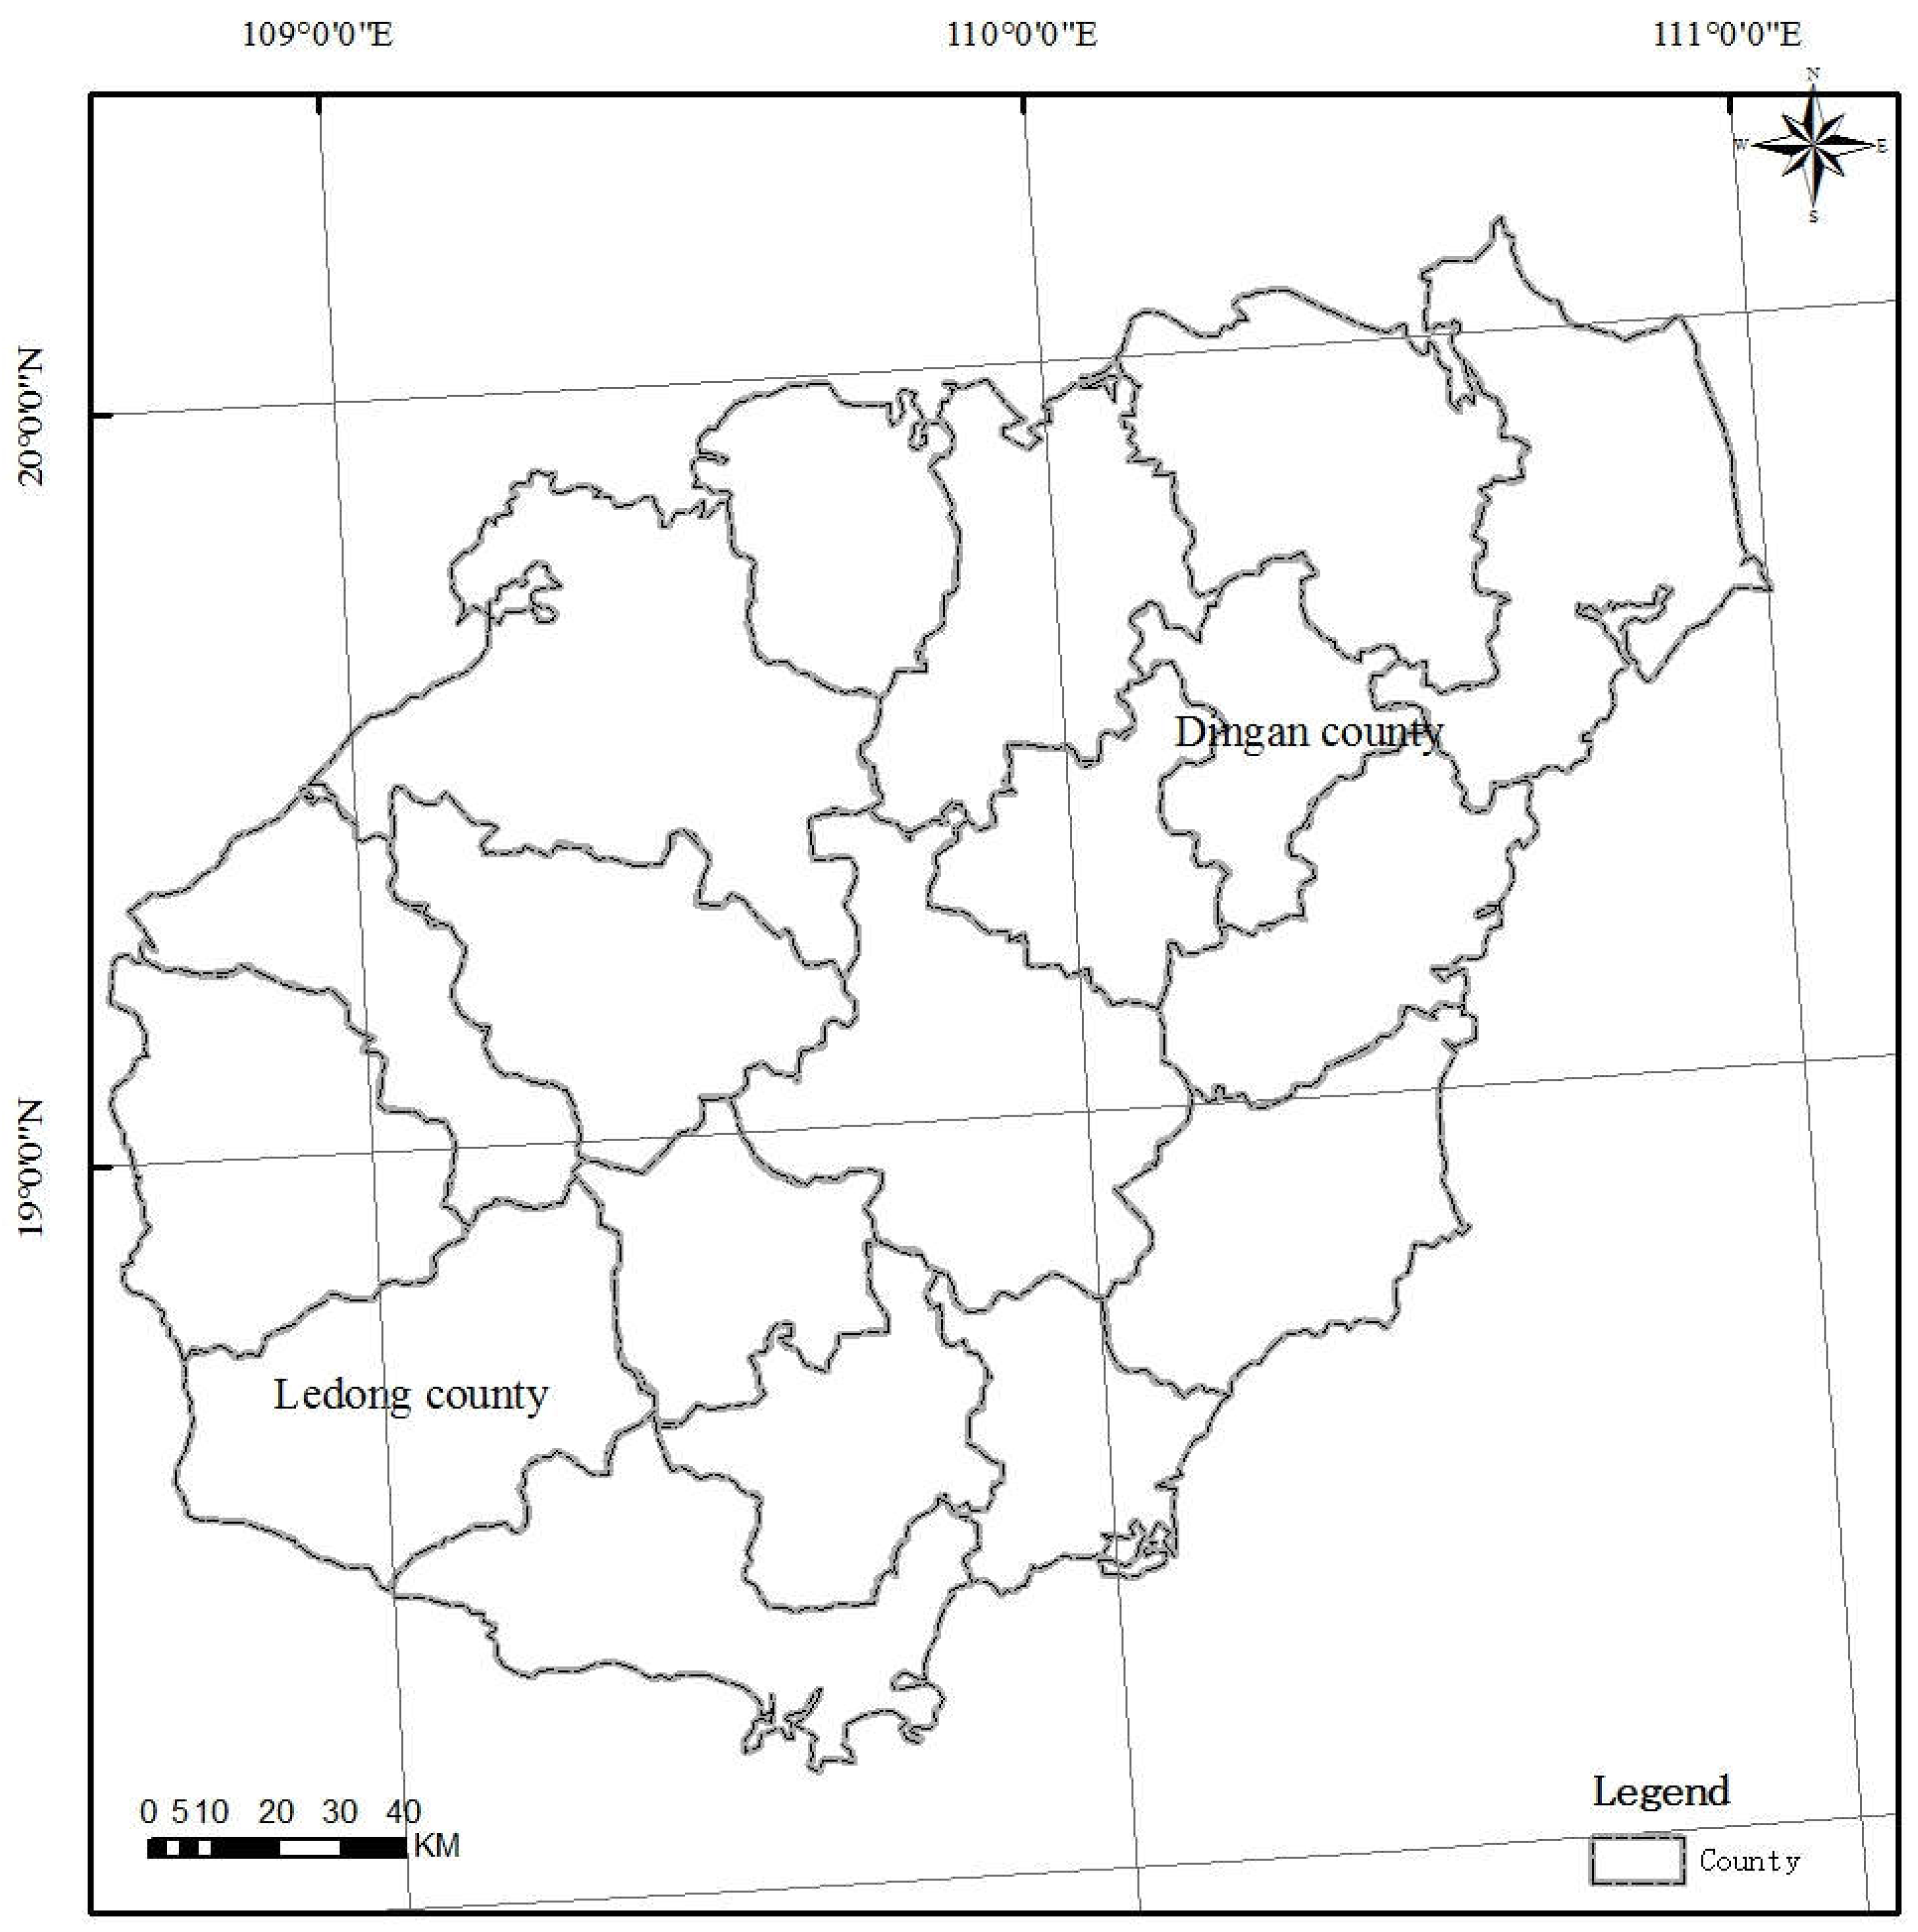
2. Materials and Methods

Hainan Province is the smallest and southernmost province of China. There are a total of nine cities and ten counties in Hainan Province. At the end of 2016, the total population in Hainan province stood at 9.17 million. Hainan’s climate is tropical monsoon, characterized by hot, humid summers and mild, pleasant winters. Temperatures usually range from 24 °C to 35 °C in summer and 19 °C to 25 °C in winter. The province is currently being promoted as “China’s Hawaii”. Water resources are abundant, with annual average precipitation 1500 mm to 2000 mm. However, many residents of Hainan have had problems with their drinking water as a result of flooding and typhoons, which destruct the water pipeline and pump house. As shown in Figure 1, two rural counties (Ding’an and Ledong) were selected as pilot sites for investigation by using simple random sampling method. Ding’an County, an agricultural region, is located in the northeast of Hainan Province, and covers an area 1189 square kilometers in size. The administrative divisions include 10 towns, and the population is 342,000. The main disaster is prone to flooding. The water resource is rich, the annual average precipitation is 1953 mm, and the total water resources are 1.59 billion cubic meters. Ledong County, located in southwest Hainan, has many activities of agriculture and fishery, with an area of 2763.2 square kilometers. The county consists of 11 towns, and the population is 520,000. The main disasters are flooding and typhoon. The water resource is also rich, and the annual average precipitation is between 1400 and 1800 mm. There are eight drainages, 115 reservoirs in the county, and the total reservoir capacity is 504.4 million cubic meters. Research into residents’ attitudes towards water safety and pollution accidents in rural areas of Hainan Province is of great importance because the results could provide a valuable reference for drinking water control and prevention in other rural areas of China as well as in other developing countries.
In order to investigate public awareness about drinking water contamination accidents, a questionnaire survey was conducted in the two pilot counties from August to September 2013. The specific survey questions covered in this questionnaire deal with responses to questions about drinking water safety and contamination accidents. These questions included the demographic information of respondents, their awareness about drinking water safety (types of household drinking water, satisfaction with drinking water quality, degree of trust in drinking water safety, common problems with tap water and solutions, and awareness about local water quality), and awareness about drinking water contamination accidents (awareness about water pollution events and measures to prevent these accidents). There are 17 questions in the questionnaire. The main questions are shown in Table 1. The demographic information including age, sex, country of residence, and level of education were also provided by respondents. Each questionnaire only takes about 5 min to finish. The responses were collected at the time of interviews.
A town to town survey was conducted in two counties. Respondents were randomly selected from both counties. All interviews were conducted face to face. About 20 residents were selected in each town. Four-hundred-and-twenty questionnaires were distributed, and 410 questionnaires were returned (97.6% response rate), with 201 from Ding’an County and 209 from Ledong County. Ding’an County is within a China drinking water quality health monitoring network (CDWQHMN) and Ledong County is out of CDWQHMN. Data from the surveys were collected, coded and entered into EpiData. The statistical analysis of data was performed using IBM SPSS Statistics for Windows (IBM Corp., Armonk, NY, USA). Significant differences in public awareness between the two groups of respondents were analyzed by multinomial logistic regression analysis.

3. Results and Discussion

3.1. Demographic Information of Respondents

The demographic composition of the sample is presented in Table 2. Respondents were predominantly female (59.3%), with age groups of 35–50 years and 20–34 years, with college and high school educational levels. These results were consistent with the demographic characteristics of gender, age and education of these two counties.

3.2. Public Awareness about Drinking Water Safety

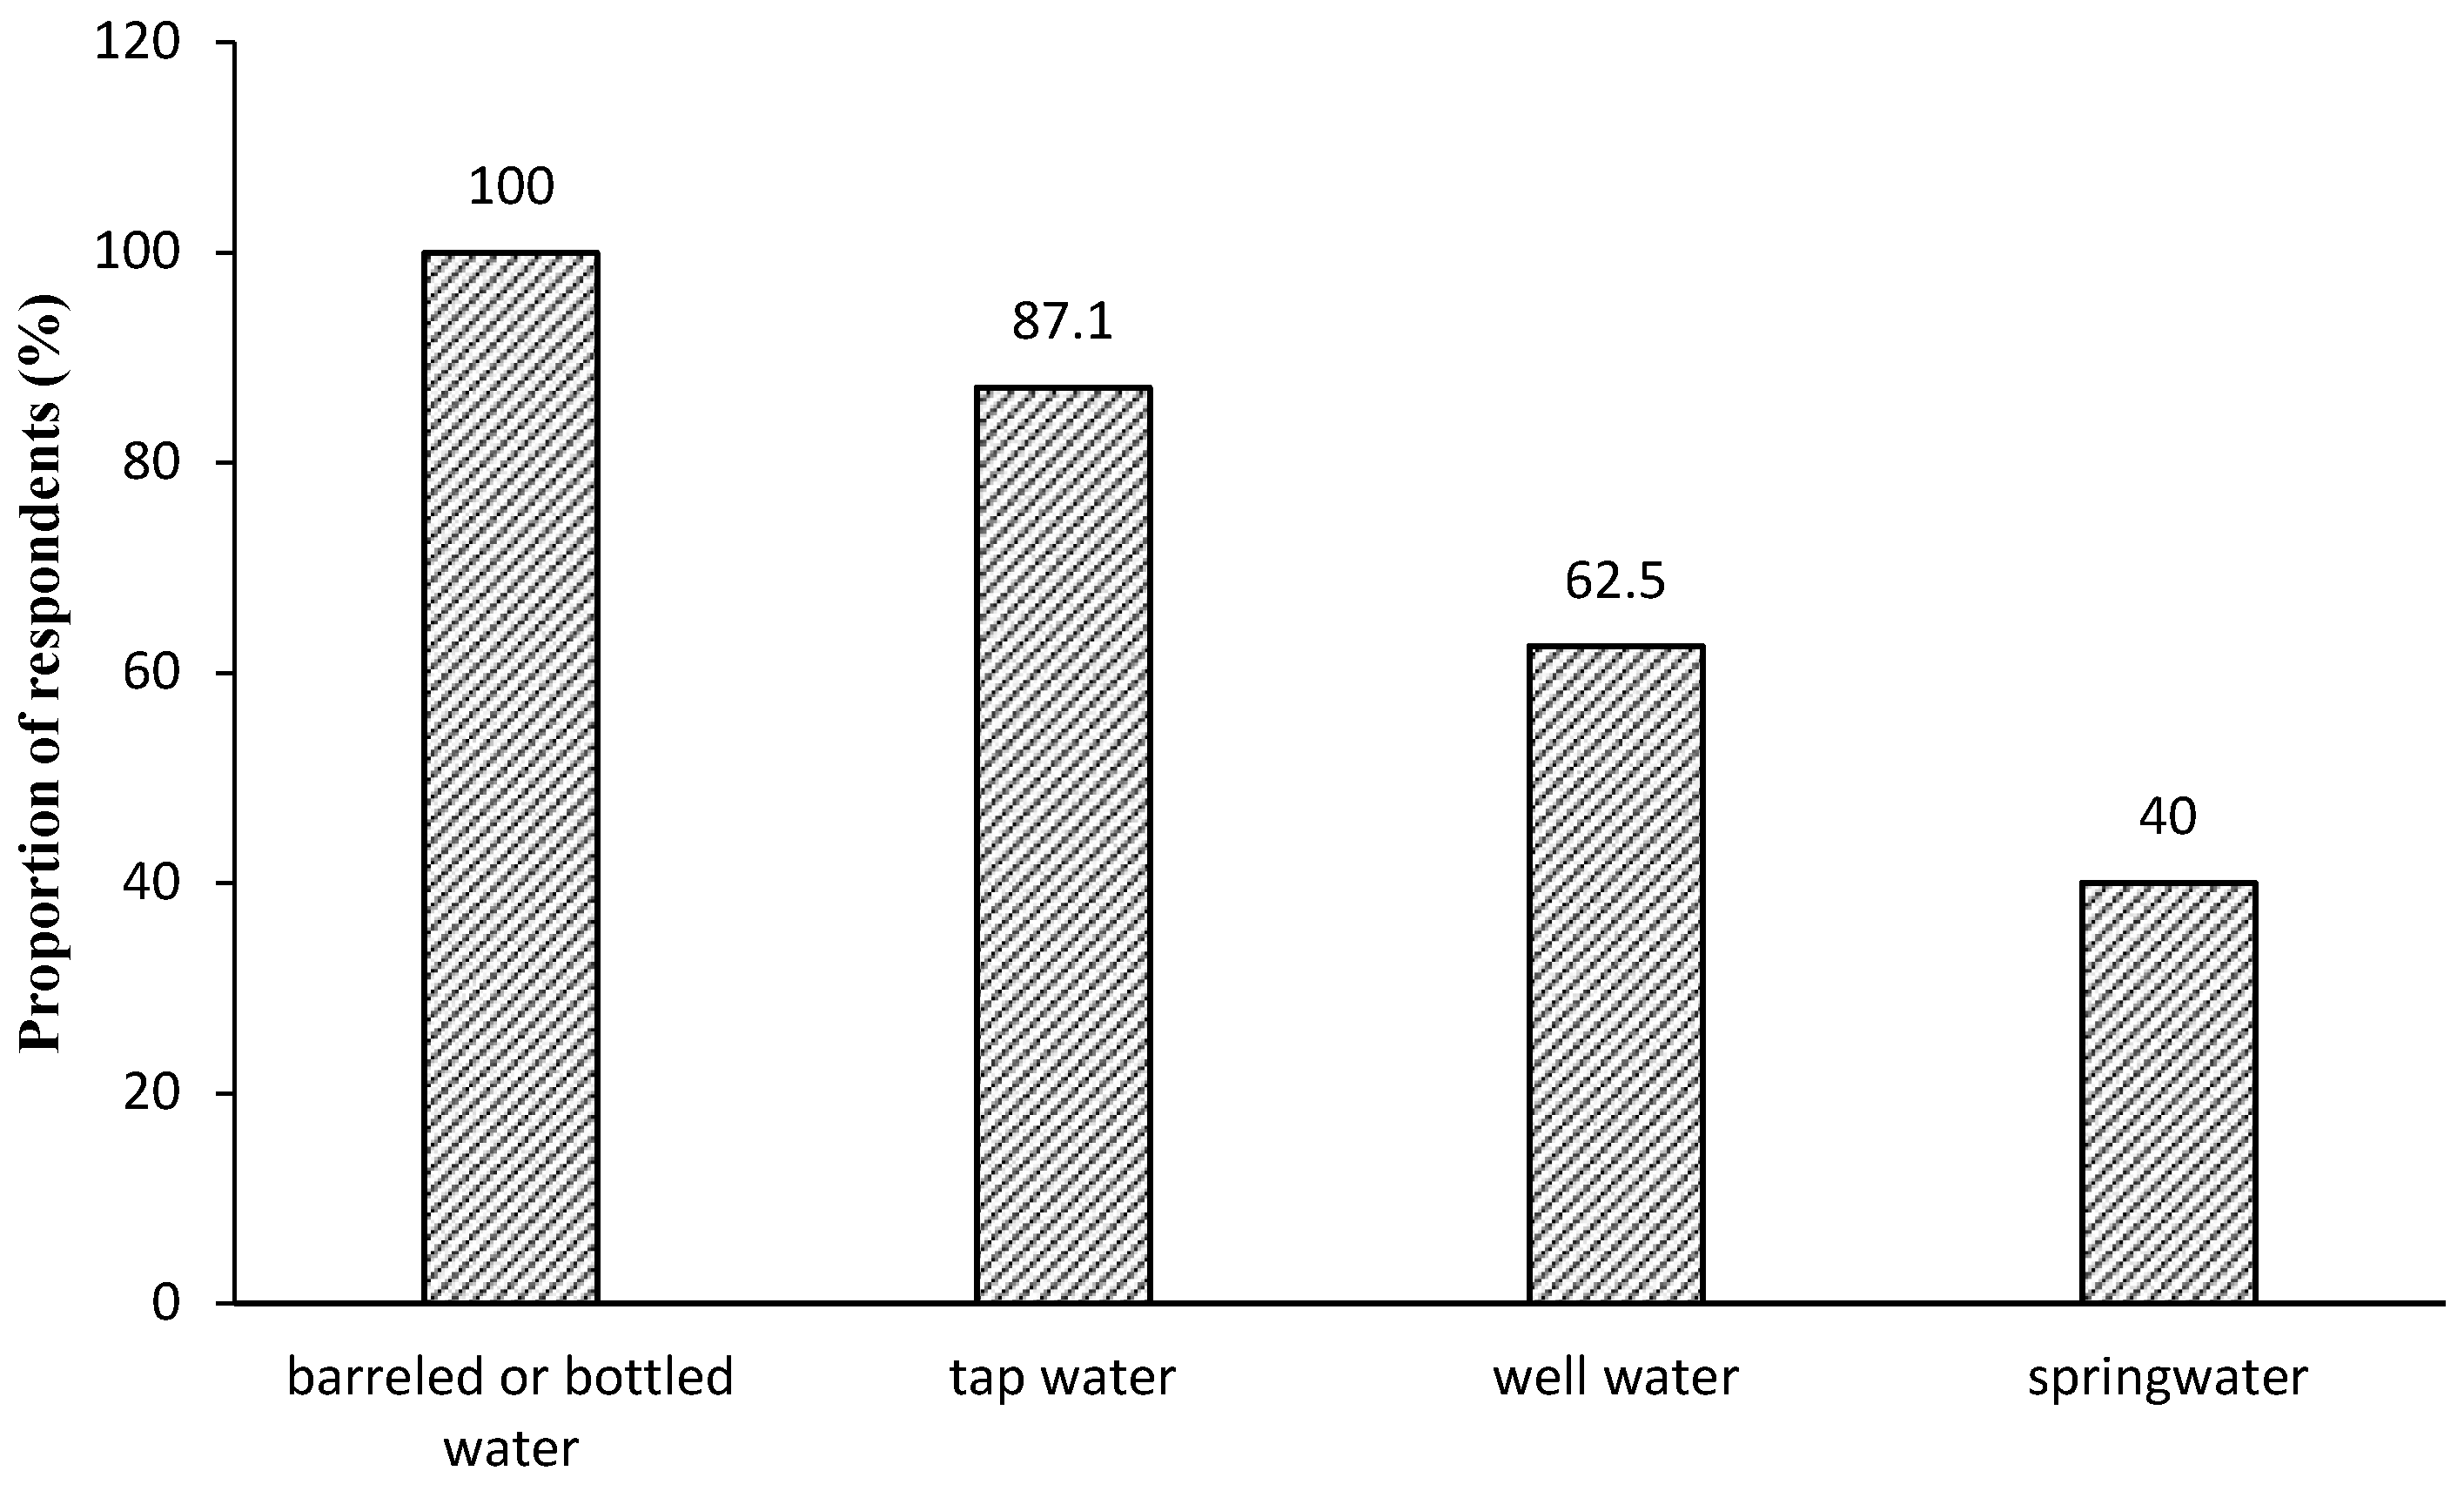
3.2.1. Household Drinking Water Sources

Household water security is a key part of the United Nations’ International Children’s Emergency Fund (UNICEF) efforts in the WASH (water, sanitation and hygiene) sector [21]. Survey results regarding sources of household drinking water are shown in Table 3. Tap water was the main type of drinking water reported by respondents (70.7%), followed by well water (22.8%). The consumption of barreled or bottled water was very small (5.2%). These are different from some developed countries and some wealthy city in China. Bottled or barreled water consumption in these areas has greatly increased in the past decade [22,23]. Based on 2016 Hainan Environmental Status Bulletin, the water quality of surface water and ground water is good, and the qualified rate of water quality of surface water is 90.1% (and is considered as excellent by local authorities, which can be questioned), and there are not many accidental water pollution events in Hainan province except flooding and typhoons [24]. Thus, at the two pilot sites, many small tap water utilities have been established, and tap water and well water are popular in these areas. A few respondents used barreled or bottled water as their main household drinking water sources. Some studies have shown that when consumers are dissatisfied with the tap water provided by municipalities they often turn to bottled or barreled water [22,23]. Barreled and bottled water quality is regulated by the China Food and Drug Administration, but many local residents are peasants or fishermen who are not wealthy, thus, relatively expensive barreled or bottled water is not commonly purchased and used.

3.2.2. Public Attention of Local Drinking Water Quality

As can be seen in Table 3, survey results about public attention of local drinking water quality revealed that 22.7% of respondents paid special attention to local water quality, 56.1% paid comparatively high attention, and 16.3% were not concerned about local drinking water quality. The technologies used in water-supply systems are considered in sequence, from the water source to the points of supply: water sources and intakes, water-lifting devices, power technologies, water treatment, storage and distribution. The technologies for each these subsystems must function properly to ensure a reliable water supply and a safe water quality [25]. A safe and convenient water supply plays a vital role in public and well-being of society [26]. Most water treatment plants in two pilot counties are very small, with mainly centralized (or sometimes decentralized) township and rural water supplies, and the water supply ability is less than 1000 m3/d. The water treatment equipment is relatively simple and crude, even, there is not water treatment equipment in these water utilities, and the purification capacity is thus very limited and some contaminants should not be removed at these treatment facilities. And many residents were eager to know whether their drinking water is clean or not, therefore, most of respondents paid high attention to the quality of drinking water.
The residents think that the main related factors influencing drinking water quality include water source quality, water pipe network and water treatment technology, and with the ratios of 70.1%, 51.4% and 51.1%, respectively. And only 12.5% of residents regard usage of tap water as main influencing factors.

3.2.3. Public Satisfaction with Drinking Water Quality

Survey responses regarding the degree of public satisfaction with drinking water quality are shown in Table 3. A total 20.5% of respondents were very satisfied with the quality of their drinking water, 59.8% were relatively satisfied, and 18.3% of them felt dissatisfied with their current drinking water quality. Correlation analysis between drinking water type and degree of public satisfaction revealed that people whose main drinking water source was barreled or bottled water had the highest degree of satisfaction (Figure 2), with a proportion as high as 100%; this was followed by tap water and well-water sources, with satisfaction degree of 87.1% and 62.5%, respectively. Those with spring water as their main water source reported the lowest satisfaction levels of only 40.0%.
Consumer satisfaction with drinking water quality has been measured in several studies [27,28]. Many factors including availability and safety of water sources, flavor, attitudes toward chemicals often found in drinking water have mainly been found to be involved in the public perception of drinking water quality [6,15,29]. A few residents used barreled or bottled water, but they often imagine that bottled water is a pure and safe product, and this could explain the satisfaction of 100% for barreled or bottled water. Tap water often comes from centralized water supply, but for the simple and crude water treatment, only 87.1% of tap water sources users were satisfied with the quality of their drinking water. Well water and spring water are derived from decentralized water supplies which are directly from the water source, without any facilities or only simple facilities. Thus, only 62.5% and 40.0% of residents were satisfied with the quality of well water and spring water. The main reasons for respondents’ dissatisfaction were related to sensory properties such as water turbidity, rust color, or unpleasant taste and odor. China’s drinking water quality standard includes 106 water quality indicators, and sensory indicators are only part of them. If the residents fully understood the water treatment process and the value of all water quality indicators of their drinking water, their satisfaction degree of drinking water quality is likely to change.

3.2.4. Public Trust in the Safety of Drinking Water

Results regarding the degree of public trust in the safety of drinking water are shown in Table 3. A total 17.1% of respondents felt confident about the safety of their drinking water and 42.2% felt relatively confident; Water resources and water quality have been identified as the important parts of public trust in the safety of drinking water [30]. 34.9% of respondents reported feeling somewhat worried about the safety of their drinking water and 5.1% felt extremely worried. The result of about 40% residents didn’t feel confident that may be due to the simple or crude water treatment in these two counties. In rural areas of China, there are not regulations for the communication of drinking water quality, and water treatment plants seldom report values of drinking water quality indicators. Residents occasionally obtain information about drinking water quality from television, newspapers, or the Internet. Research has shown that a little information and a few reports are not enough to effectively change public perception [31]. Thus, many residents have become increasingly attention to the quality and safety of local drinking water at the two pilot sites and some residents are worried about drinking water safety.

3.2.5. Public Awareness of Tap Water Common Problems and Solutions

People often face a number of drinking water taste, odor, smell and appearance problems, for example, water which is initially clear but produces brown, orange or red-dish stains or sediment, metallic tasting water. As shown in Table 3, 62.9% of respondents said that they had never had problems with their tap water quality; 25.9% reported having problems once or twice a year, and 4.4% reported frequent tap water issues, and 6.8% had no answer. Reasons for problems with tap water at the two pilot sites is that these areas are prone to typhoons and flooding, which sometimes adversely affect local water quality and water supply [32]. Issues with drinking water include the appearance of white foam, rust color, unpleasant smell, turbidity, red worms, or other impurities. Problems with the water supply include water shortages and occasional lack of water. However, there are many other water quality problems that can’t be seen, and respondents do not fully understand most of water quality indicators of their drinking water, so most of respondents reported no problems or few problems of tap water.
Table 3 also shows results regarding respondents’ awareness about ways to solve problems that arise with tap water including water quality abnormal, pipeline damage, faucet water leakage, and so on. A total 52.4% of residents solved such problems by themselves, they repaired pipe and faucet by themselves and filtrated the unclean water by home water purifier; 42.2% relied on the local water utility, 21.9% of respondents complained to the local department of health, 17.3% sought to the residential property maintenance staff to solve the problem, and only 1.8% of respondents called the local government telephone hotline for help. These results reveal that the most common means used by residents to solve issues with their drinking water was to solve problems by themselves, followed by seeking help from the local water utility. Public information about drinking water problems and solutions is scarce in rural areas and many residents solve problems with their water themselves and do not seek help from water treatment plants or monitoring departments. The main reason is when residents turn to local water utilities or monitoring departments for help, these departments could not solve their problem in time. Even, some residents don’t know how to contact these departments at all. Few residents know the number for the government public service hotline (12320).

3.3. Public Awareness about Water Contamination Accidents

3.3.1. Public Awareness about Water Pollution Events

A total 32.0% of respondents said they pay special attention to reports of water pollution events on television or in the newspaper; 53.2% reported following such events when they have free time, and 14.8% of respondents said they were not concerned about water pollution accidents. In recent years, serious water contamination accidents, including heavy metal contamination, algal blooms, organic chemical spills, and microbial contamination, have raised concerns among the public [33,34]. Most of public often like to care about what happened on them, but based on the information provided by Hainan province environmental information public publishing system, there are almost no polluters in Ding’an and Ledong County and not many water pollution events in Hainan province except flooding and typhoons [35].Thus, there are not large amount of people to pay special attention to water pollution events. In the question, “What kind of water pollution incident do you pay attention to?” some residents were eager to know whether the long-term drinking of barreled or bottled water is harmful to the human body, and what diseases could be caused by drinking unclean water for a long time.

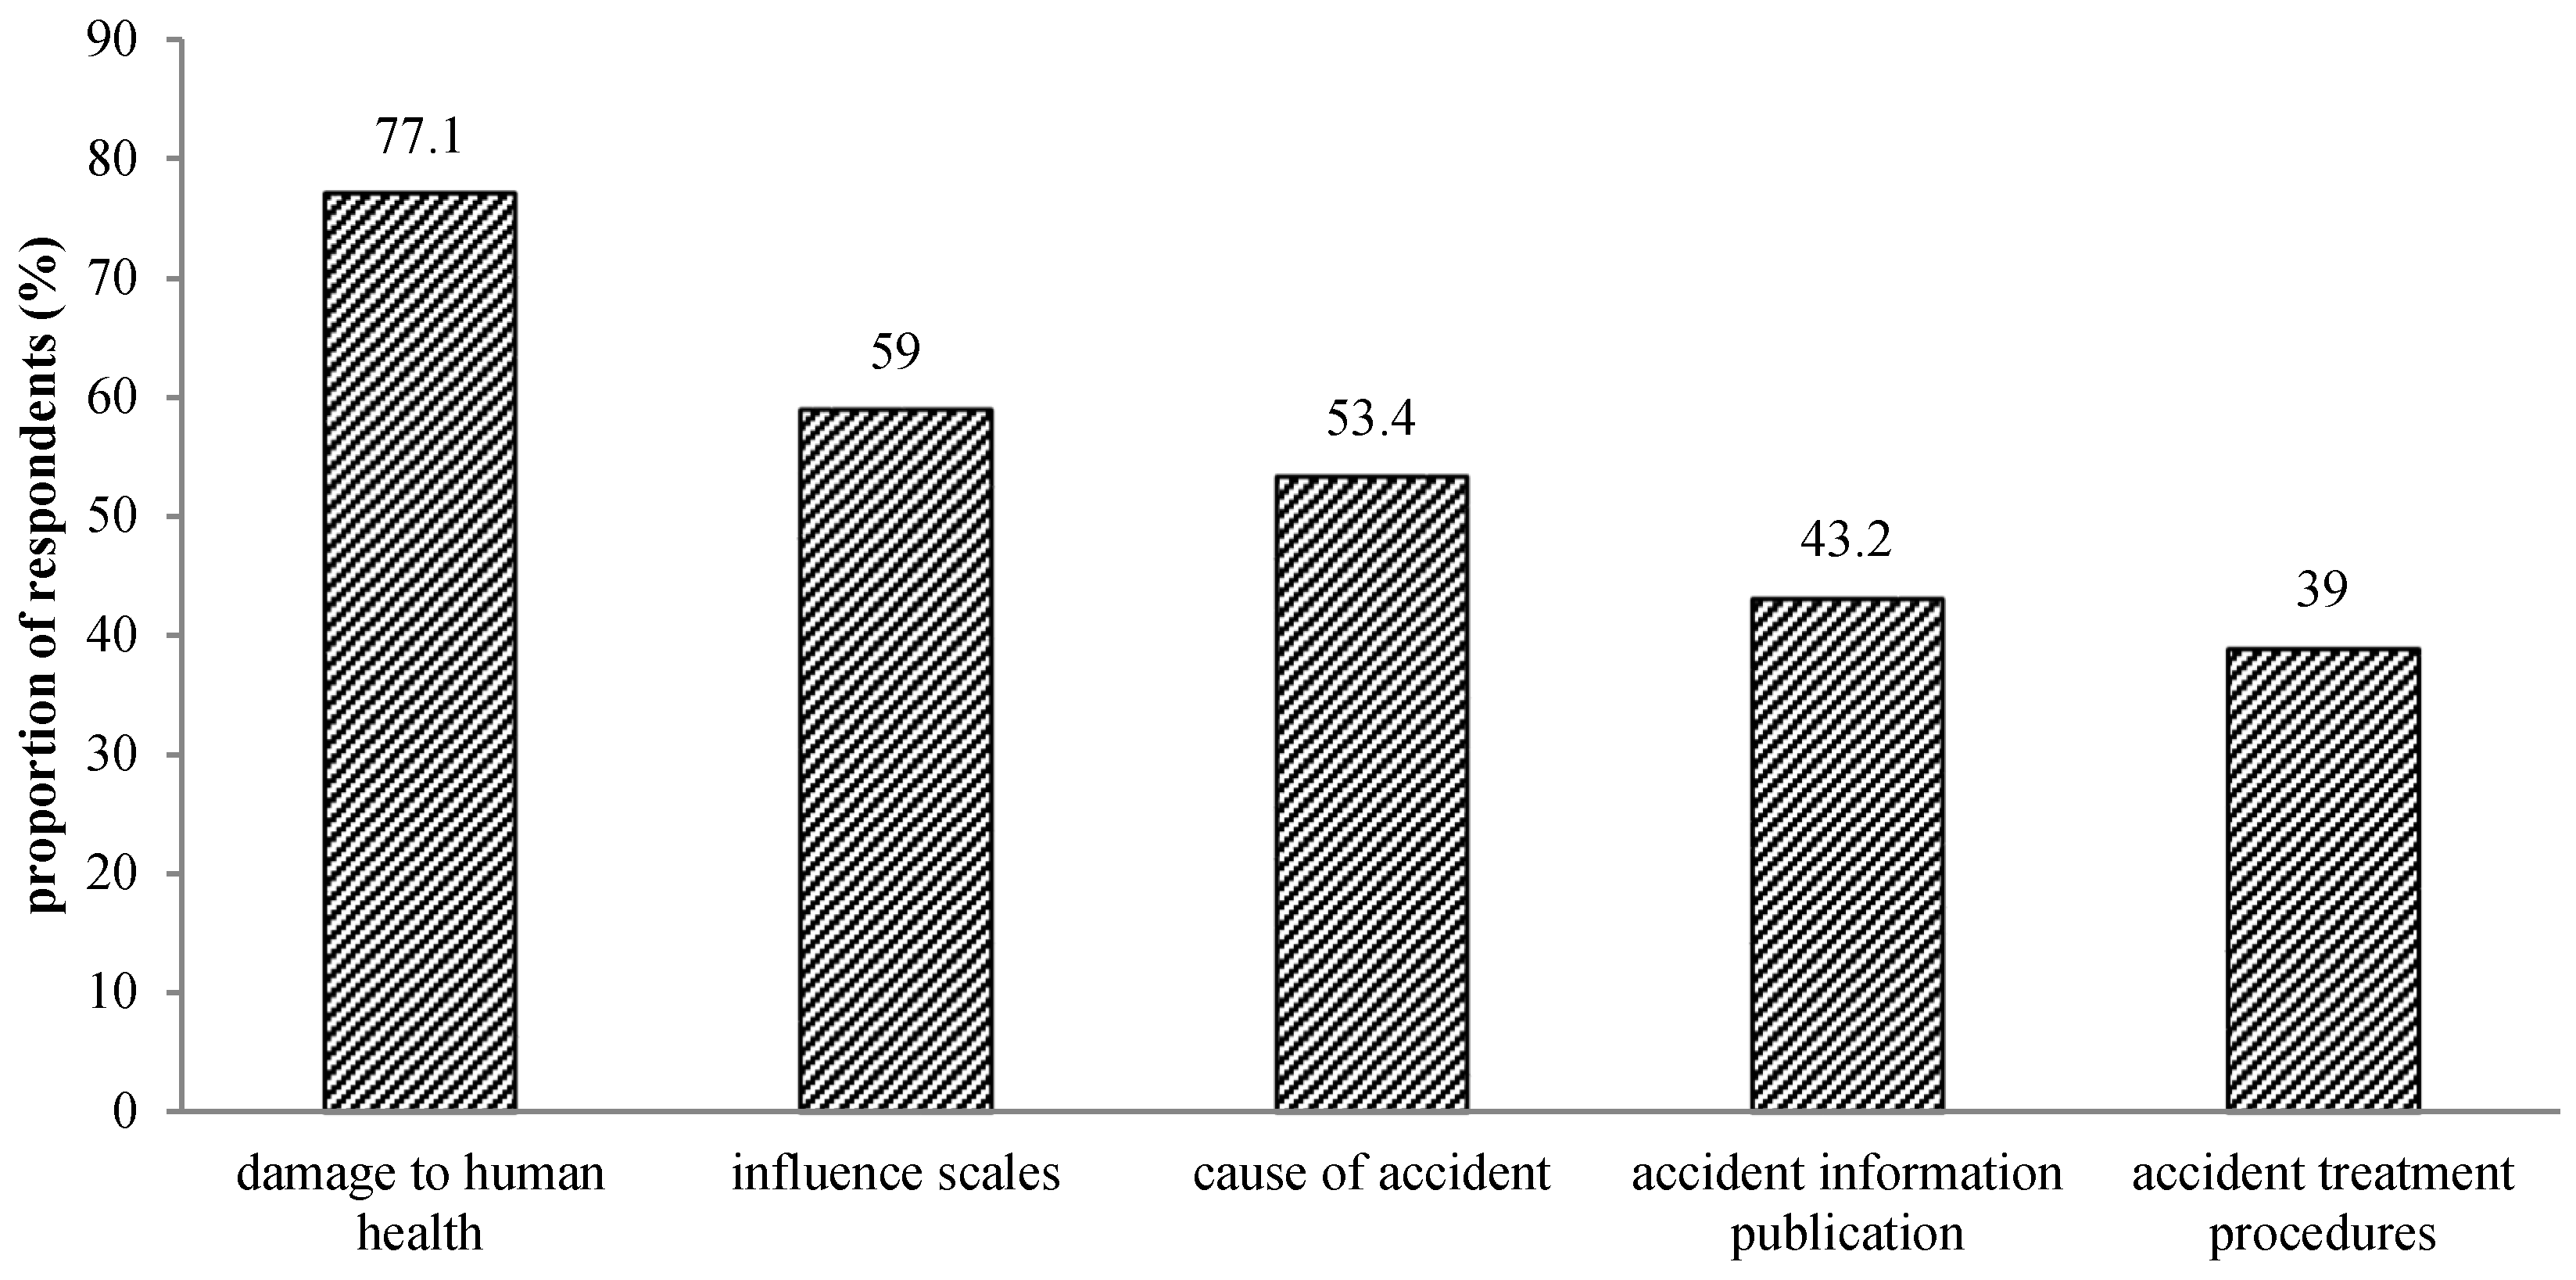
3.3.2. Public Knowledge about Water Pollution Accidents

Results of public knowledge about water pollution accidents are displayed in Figure 3. A total 77.1% of respondents were knowledgeable about the potential damage to human health caused by water pollution accidents. Around 55% of respondents focused on the influence scope of water pollution accidents and the causes of accidents; about 40% had some degree of knowledge, gained from information in government publications, about water contamination accidents and accident treatment procedures.
As shown in Figure 4, 88.5% of respondents regarded the local health department as the main emergency response provider during drinking water contamination accidents, followed by the local departments of environmental protection, water resources, and propaganda. About 65% of respondents believed that during the process of emergency response, all related departments should improve public information and education and share responsibility.
Water pollution could cause environmental and economic damage as well as public concern and the potential for social problem [36]. Most water pollution events in China could cause ecosystem disturbance and have a key environment impact-damage on creature’s health even threaten their lives [33]. Thus, most of respondents paid attention to the knowledge of the potential health impacts of water pollution and regarded the health department as the main emergency response provider for drinking water pollution.

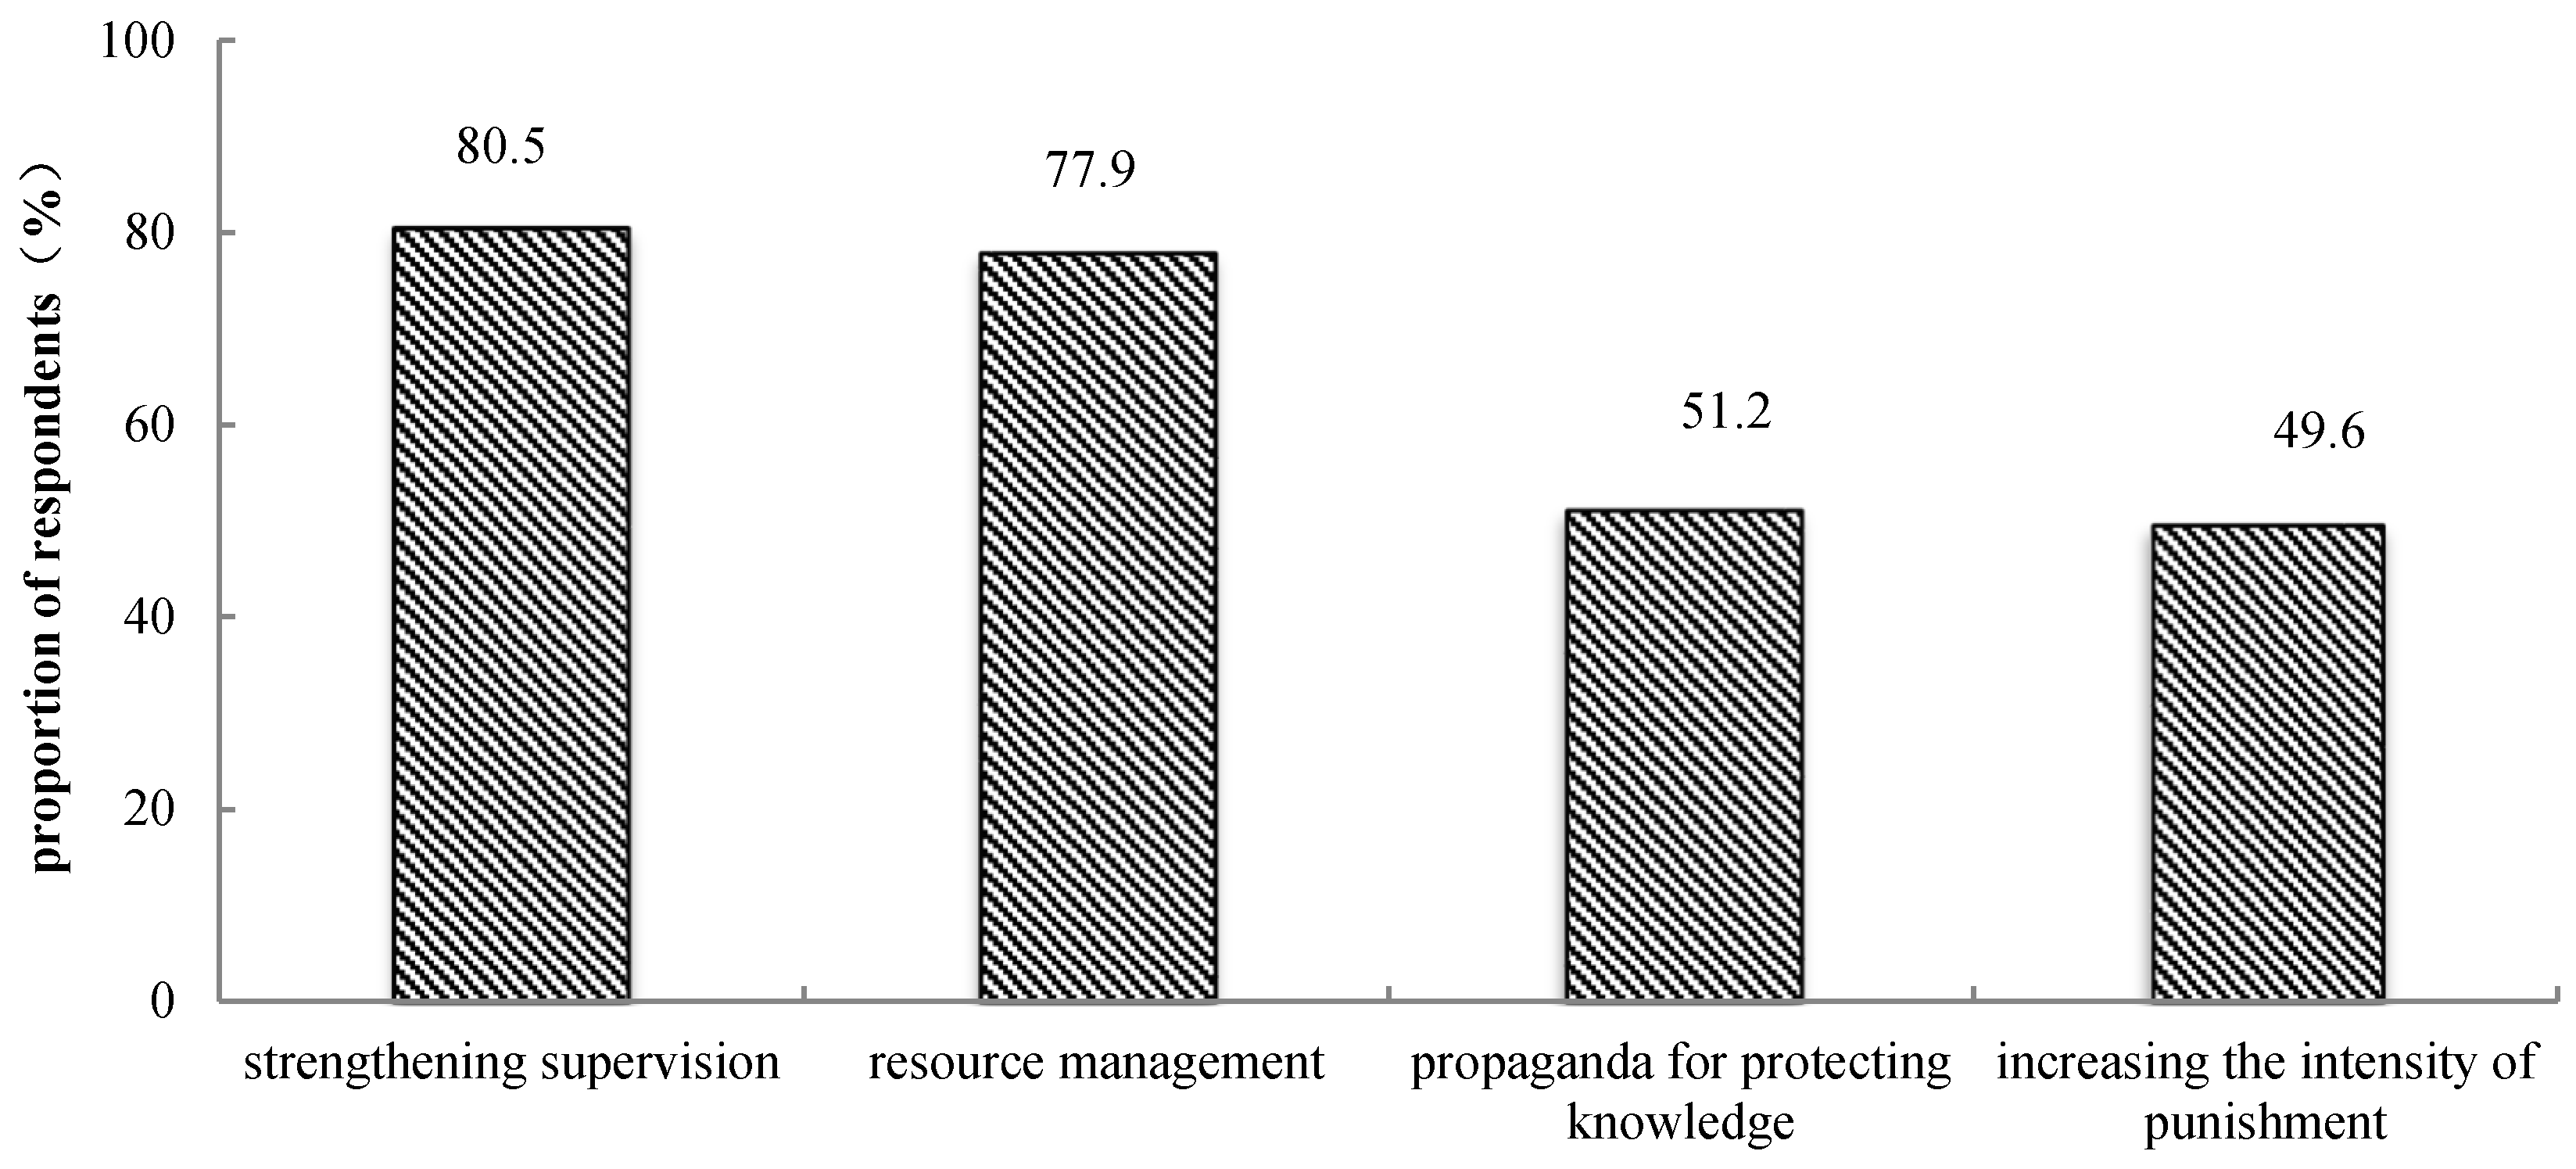
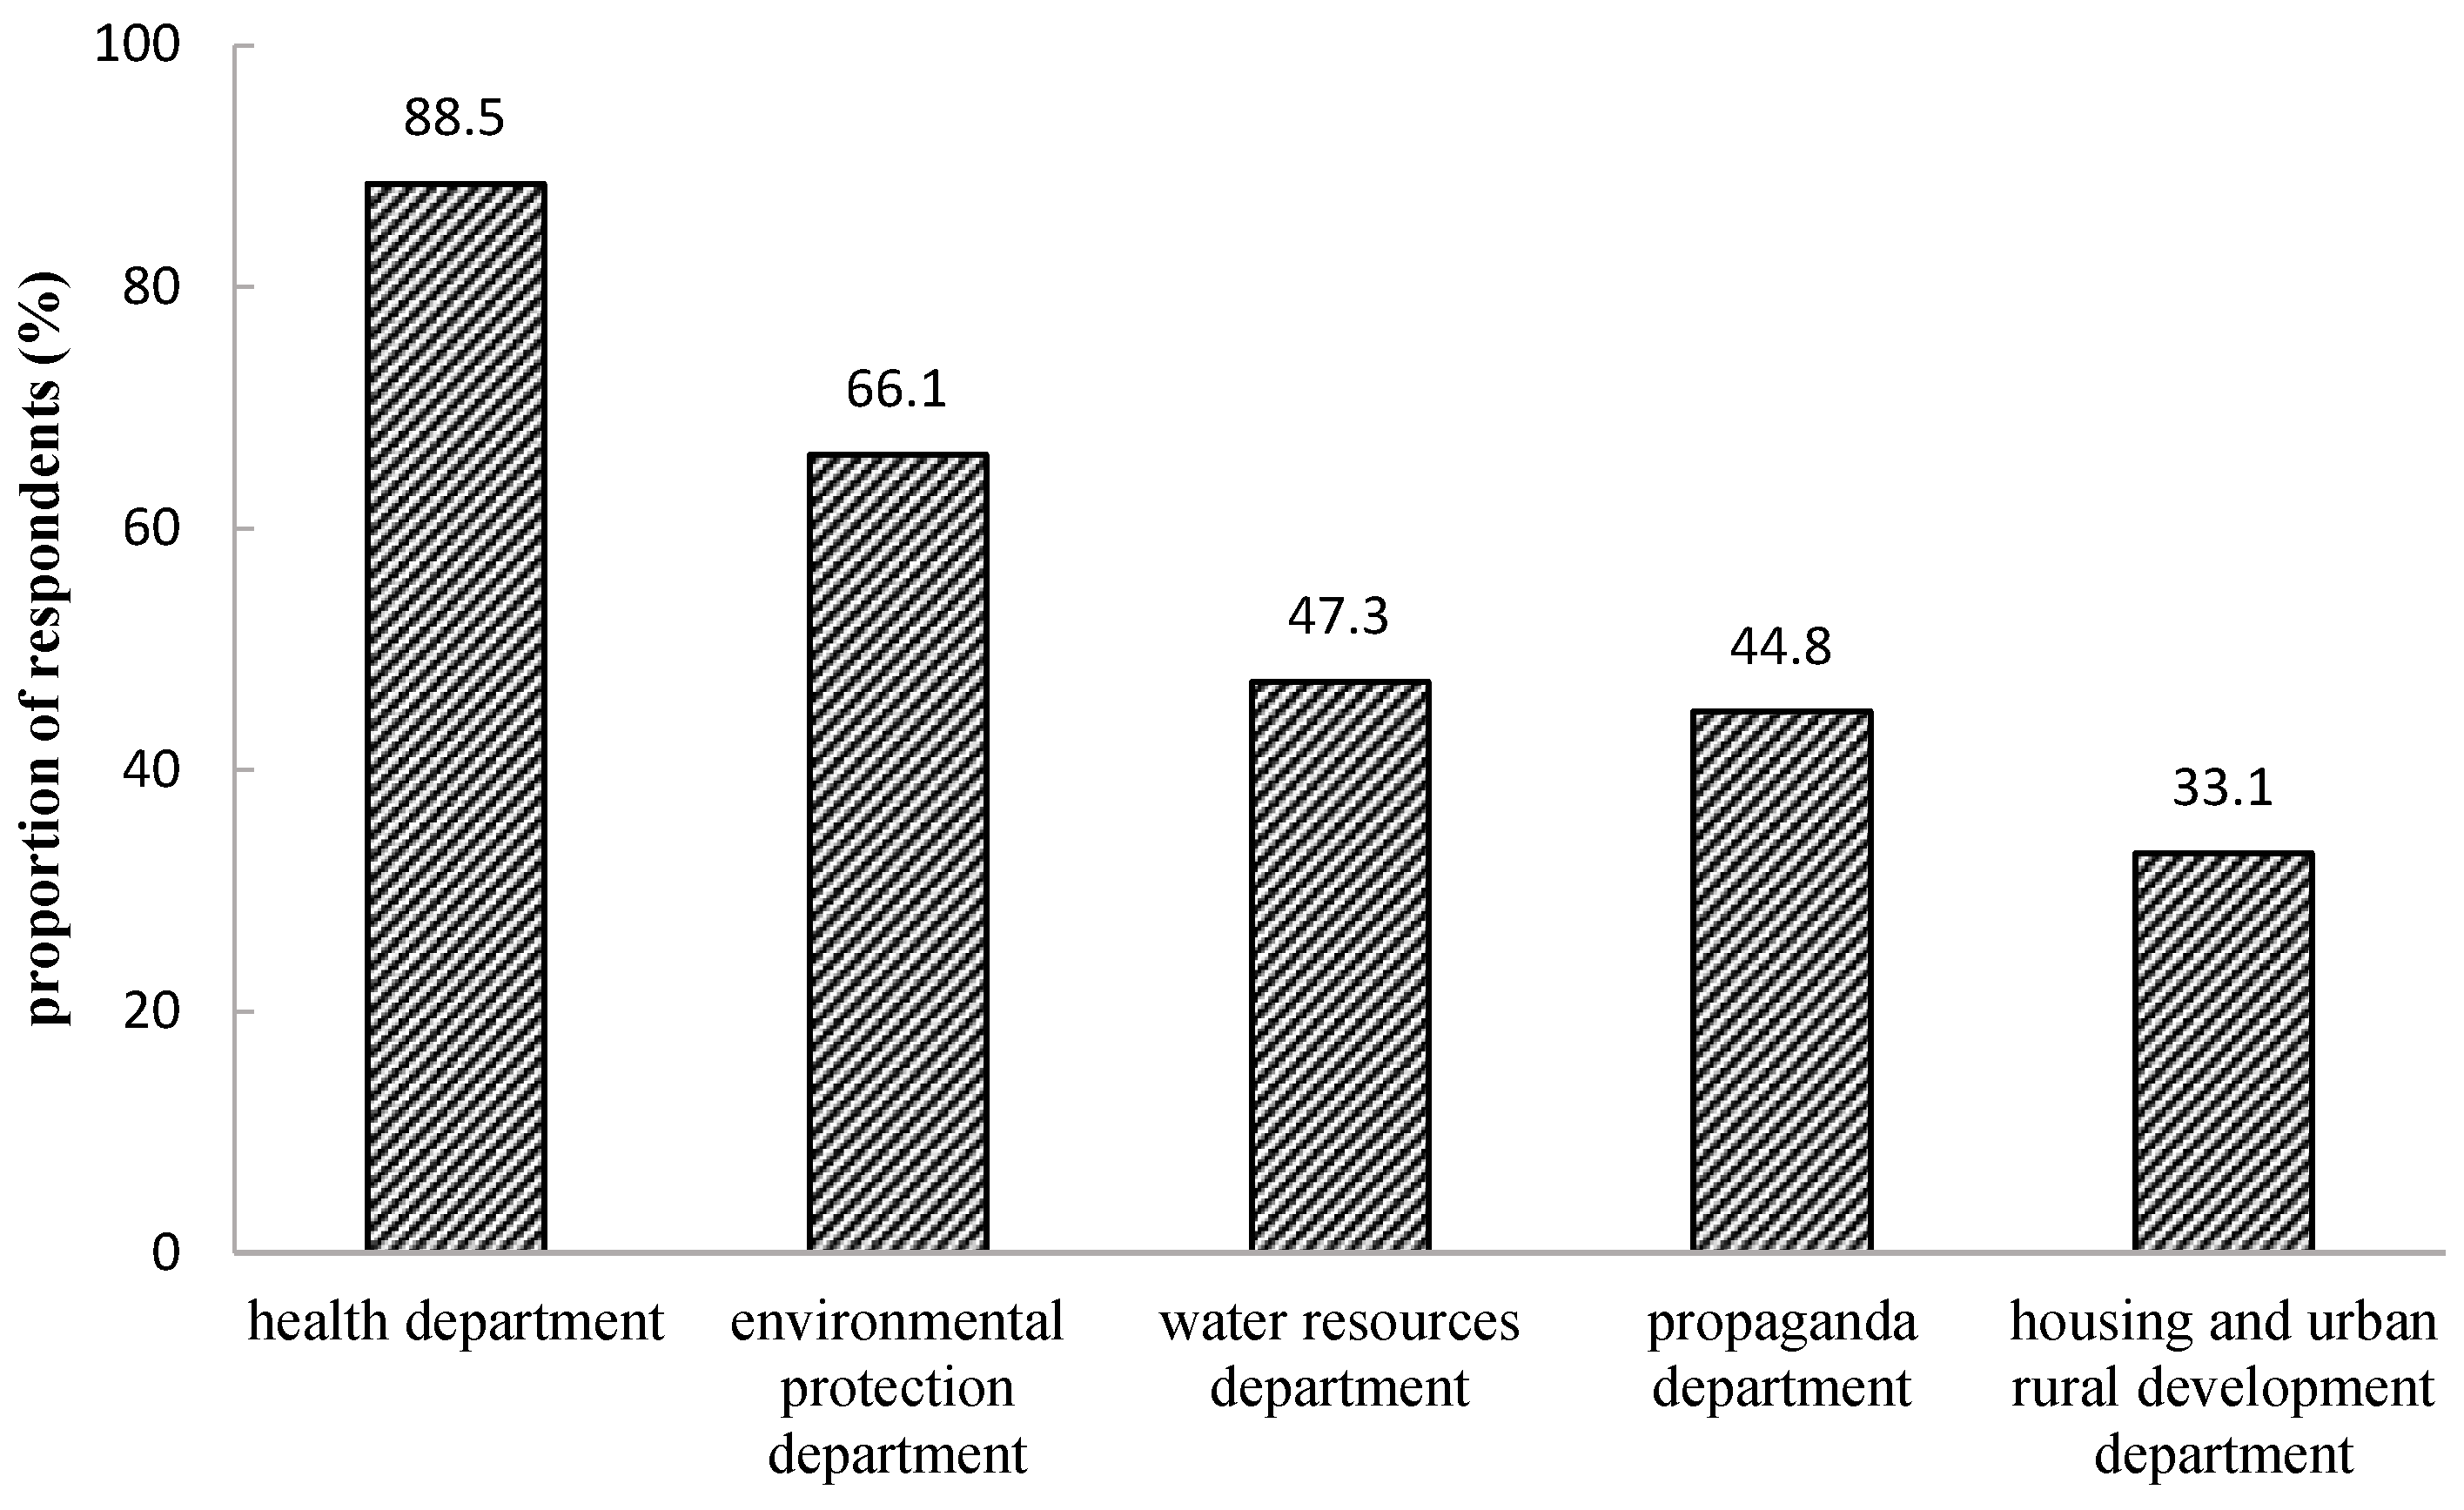
3.3.3. Measures Taken for Preventing Water Pollution Accidents

Results regarding the main measures taken for preventing water pollution accidents are displayed in Figure 5. About 80% of respondents believed that improving supervision, monitoring, and resource management can effectively reduce the occurrence of contamination accidents. About 50% of respondents said they believed that increased public information and education as well as increased penalties for polluters can also help to reduce pollution accidents.
At present, China maintains water quality monitoring networks with thousands of monitoring sites. Despite the impressive numbers, however, spatial coverage remains sparse due to the size of the country [37]. Environmental advocates in China state that punishments laid down by the Ministry of Environmental Protection, in many cases related to pollution and unlawful practices, are simply not strict enough. Such laws show determination of the government, but are not strong enough to raise fear. In order to apply these laws, some departments are authorized to supervise the water source and water utilities. The health supervision department is authorized to supervise the water treatment plants. When the water treatment plant is unqualified, it should be punished to improve the water treatment technique and strengthen the construction of the water network system for improving the water quality. The environmental protection department is authorized to supervise and manage the water source and water environment to ensure drinking water is clean and not contaminated by anything. Increasing rigorous punishment would help to stop illegal sewage discharges, strengthening supervision and monitoring would ensure the effectiveness of disposal of pollution incidents. Thus, respondents regarded supervision, monitoring and resource management as effect measures for controlling water pollution.

3.4. Comparison between Ding’an County and Ledong County

Based on survey results, two counties residents have some different public awareness about drinking water issues. These differences are also shown in Table 3. Ding’an County is a pilot county belonging to China drinking water quality health monitoring network (CDWQHMN), and Ledong County is out of CDWQHMN. Drinking water in the areas within network could have been tested more regularly. Furthermore, Ledong County is poorer than Ding’an County, and the per capita disposable income of households are 15,109 Yuan and 17,175 Yuan respectively, and total annual volume of water supply for residential use is higher in Ledong County than in Ding’an County (2,110,000 cu.m vs. 3,110,000 cu.m) [38]. Because of these, Ledong residents think their drinking water is not safe enough and have to be more vigilant and proactive about their drinking water than residents in Ding’an County. Thus, for drinking water sources, tap water using in Ding’an is higher than that of Ledong (80.3% vs. 61.3%), but Ledong residents were more likely to use barreled or bottled water than that of Ding’an (7.1% vs. 3.2%). In the public perception of drinking water safety, residents in Ledong paid more special attention to the local drinking water quality (27.8% vs. 17.4%). And in drinking water satisfaction degree, residents in Ledong were less very satisfied (6.2% vs. 35.3%) but more dissatisfied (25.8% vs. 10.4%) with their drinking water quality. For public trust of the safety of drinking water, Ledong residents were lower level of confidence but more worried about the safety of drinking water. These indicated residents in Ledong County are more likely to consider their drinking water less safe and they are less satisfied with their drinking water. For drinking water problem, Ledong residents had more problems with their drinking water than residents in Ding’an. However, there are no significant differences between Ding’an and Ledong of the public awareness on the main factors influencing drinking water quality and the measures taken to solve problems that arise with tap water.

3.5. Influencing Factors of Public Awareness about Drinking Water Safety and Pollution Accidents

3.5.1. Influencing Factors of Public Satisfaction with Drinking Water Safety

We used a multinomial logistic regression model to determine the relationships between degree of public satisfaction with drinking water quality and its influencing factors. As shown in Table 4, age, sex, and education level did not have significant relationships with the degree of satisfaction in drinking water quality. However, residential area had a statistically significant role in differentiating between two groups of respondents: those who felt between very satisfied and dissatisfied with the quality of their drinking water and those who felt between satisfied and dissatisfied (p = 0.000 < 0.05, p = 0.036 < 0.05, respectively). Survey respondents who lived in Ding’an County, which is within the CDWQHMN, expressed greater satisfaction with their drinking water quality than those who lived in a county outside of the network.
A multinomial logistic regression model was also used to analyze the relationship between public attention to local water quality and its influencing factors. As shown in Table 5, age and sex did not have significant relationships with awareness about water quality; however, residential area and education were statistically significant in differentiating the two groups in this regard. Survey respondents with higher education levels had greater levels of awareness than those with lower education levels. However, survey respondents living in Ding’an County, which is within the CDWQHMN, had less awareness about local water quality than those living outside of the network.

3.5.2. Influencing Factors of Public Awareness about Drinking Water Pollution Accidents

The relationship between public awareness of drinking water pollution accidents and its influencing factors was also analyzed using the multinomial logistic regression model. As shown in Table 6, age and sex did not play significant roles in awareness about drinking water contamination events; however, county of residence and education had statistically significant roles in differentiating awareness levels between groups. Survey respondents with higher education levels were more aware about contamination accidents than those with lower education levels, but survey respondents living within the CDWQHMN had lower such awareness than those living outside of the network.
Keeping consumers informed about drinking water quality is an essential component of protecting public health [1,8,9]. Thus influencing factors of public awareness could also reflect drinking water safety and pollution accidents and to provide some valuable information to decision-making. If we disregard the fact that people of all ages and both sexes can obtain information about drinking water emergencies on television, the newspaper, and the internet, age and sex did not play significant roles in the degree of public satisfaction about water quality and public perception of water pollution accidents. Factors influencing residents’ perceptions about drinking water can vary significantly among different groups. For example, with respect to public awareness about drinking water pollution accidents, men had greater awareness than women; however, there were no significant differences between men and women with respect to taking occasional interest in contamination events.
Residents of Ding’an County often see health department staff supervising and inspecting drinking water samples, and residents can obtain information about the quality and safety of their drinking water. Access to such information is limited to television, newspapers, and the internet for residents of Ledong County, but they are very eager for such information. Thus, people living in Ledong County were more satisfied with drinking water quality and safety than those living in Ding’an County. However, residents of Ding’an were more interested in drinking water contamination accidents than those in Ledong County.
Similar to other environmental studies [5,39,40], education played a vital role in respondents’ perceptions and behavior. Survey respondents with higher education levels showed greater awareness than those with lower education levels with respect to local water quality and water contamination accidents.

4. Conclusions

We surveyed public awareness about drinking water safety and drinking water pollution accidents in a typical province of China, and also investigated the relationship between awareness of these issues and its main influencing factors. We found that respondents who have some information about their water quality are more confident in their drinking and offer stronger support for the protection of water safety and prevention of water pollution. In this study, most respondents feel they have a high degree of awareness about drinking water quality and safety and drinking water pollution accidents. About 79% of respondents paid attention to local water quality (special attention 22.7% and comparatively high attention 56.1%). Only 20.5% of respondents were very satisfied with their drinking water quality, and 59.8% were relatively satisfied. Educational level and drinking water quality health monitoring could influence public awareness about drinking water safety and contamination accidents. The knowledge provided by this study will inform the decision-making to strengthen drinking water quality monitoring to ensure drinking water safety. It also informs them to enhance public awareness of drinking water quality, to strengthen education and increase knowledge about drinking water safety, and to improve emergency response for drinking water pollution accidents. Public satisfaction could be increased by publicizing the importance of the annual drinking water quality report provided by local government to the public using local television and print media.

Acknowledgments

This work was supported by China–WHO annual cooperation projects (2012–2013) and the National Natural Science Foundation of China (No. 41671499).

Author Contributions

Li Wang and Bixiong Ye wrote the paper; Lan Zhang and Yawei Zhang conceived and designed the questionnaire survey; Li Wang and Jia Lv analyzed the data.

Conflicts of Interest

The authors declare no conflict of interest.

References

  1. World Health Organization (WHO). Guidelines for Drinking-Water Quality, 4th ed.; World Health Organization: Geneva, Switzerland, 2011. [Google Scholar]
  2. Zhang, X.J.; Chen, C.; Lin, P.F.; Hou, A.X.; Niu, Z.B.; Wang, J. Emergency drinking water treatment during source water pollution accidents in China: Origin analysis, framework and technologies. Environ. Sci. Technol. 2011, 45, 161–167. [Google Scholar] [CrossRef] [PubMed]
  3. Gleick, P.H.; Cohen, M.J. The World’s Water 2008-2009: The Biennial Report on Freshwater Resources; Island Press: Washington, DC, USA, 2008. [Google Scholar]
  4. Liu, Y.Q.; Xu, J.P.; Luo, H.W. An integrated approach to modelling the Economy-Society-Ecology system in urbanization process. Sustainability 2014, 6, 1946–1972. [Google Scholar] [CrossRef]
  5. Wang, Y.Y.; Sun, M.X.; Yang, X.C.; Yuan, X.L. Public awareness and willingness to pay for tackling smog pollution in China: A case study. J. Clean. Prod. 2016, 112, 1627–1634. [Google Scholar] [CrossRef]
  6. Doria, M. Factors influencing public perception of drinking water quality. Water Policy 2010, 12, 1–19. [Google Scholar] [CrossRef]
  7. International Water Association (IWA). The Bonn Charter for Safe Drinking Water; IWA: London, UK, 2004. [Google Scholar]
  8. Mahler, R.L.; Barber, M.E.; Shafii, B. Urban public satisfaction with drinking water since 2002 in the Pacific northwest, USA. Int. J. Sustain. Dev. Plan. 2015, 10, 620–634. [Google Scholar] [CrossRef]
  9. Means, E.G. Drinking water quality in the new millennium: The risk of underestimating public perception. J. Am. Water Works Assoc. 2002, 94, 28–33. [Google Scholar]
  10. Mihaly, M. Citizen participation in the making of environmental decisions: Evolving obstacles and potential solutions through partnership with experts and agents. Pace Environ. Law Rev. 2009, 27, 151–226. [Google Scholar]
  11. Hoedjes, J.C.B. Public Participation in Environmental Research; Occasional Paper 22; World Agroforestry Centre: Nairobi, Kenya, 2014. [Google Scholar]
  12. Zhang, K.M.; Wen, P. Review on environmental policies in China: Evolvement, features, and evaluation. Environ. Front. Environ. Sci. Eng. China 2008, 2, 129–141. [Google Scholar] [CrossRef]
  13. Yang, C.H.; Tseng, Y.H.; Chen, C.P. Environmental regulations, induced R&D, and productivity: Evidence from Taiwan’s manufacturing industries. Resour. Energy Econ. 2012, 34, 514–532. [Google Scholar]
  14. European Economic Area (EEA). Public Participation: Contributing to Better Water Management Experiences from Eight Case Studies across Europe; Publications Office of the European Union: Luxembourg, 2014. [Google Scholar]
  15. Wright, J.A.; Yang, H.; Rivett, U.; Gundrg, S.W. Public perception of drinking water safety in South Africa 2002–2009: A repeated cross-sectional study. BMC Public Health 2012, 12, 556. [Google Scholar] [CrossRef] [PubMed] [Green Version]
  16. Calicioglu, O.; Hepgunes, E.; Firat, Μ.; Alp, E. Public perception and willingness to pay analysis for the improved water quality in Ankara, Turkey. In Proceedings of the 12th International Conference on Environmental Science and Technology, Rhodes, Greece, 8–10 September 2011. [Google Scholar]
  17. Fröhler, M.; Elmadfa, I. Public perception of drinking water quality in Austria. Nutrition 2010, 34, 206–214. [Google Scholar]
  18. Doria, M.D.; Pidgeon, N.; Hunter, P.R. Perceptions of drinking water quality and risk and its effect on behaviour: A cross-national study. Sci. Total Environ. 2009, 407, 5455–5464. [Google Scholar] [CrossRef] [PubMed]
  19. Turgeon, S.; Rodriguez, M.J.; Theriault, M.; Levallois, P. Perception of drinking water in the Quebec City region (Canada): The influence of water quality and consumer location in the distribution system. J. Environ. Manag. 2004, 70, 363–373. [Google Scholar] [CrossRef] [PubMed]
  20. Joshi, M.W.; Talkhande, A.V.; Andey, S.P.; Kelkar, P.S. Urban community perception towards intermittent water supply system. Indian J. Environ. Health 2002, 44, 118–123. [Google Scholar] [PubMed]
  21. Water, Sanitation and Hygiene. Available online: http://www.unicef.org/wash/index_watersecurity.html (accessed on 7 November 2017).
  22. Van Der Linden, S. Exploring beliefs about bottled water and intentions to reduce consumption: The dual-effect of social norm activation and persuasive information. Environ. Behav. 2015, 47, 526–550. [Google Scholar] [CrossRef]
  23. Hyun, T.K.; Tae, S.K. Analysis of brand naming and marketing implications of mineral water sold in China: Jeju SamDaSoo, Evian, and Tibet Spring 5100. J. Hum. Stud. 2015, 36, 81–98. [Google Scholar]
  24. 2016 Hainan Environmental Status Bulletin. Available online: http://hi.people.com.cn/n2/2017/0605/c231190-30278269.html (accessed on 8 January 2018).
  25. Brikké, F.; Bredero, M. Linking Technology Choice with Operation and Maintenance in the Context of Community Water Supply and Sanitation: A Reference Document for Planners and Project Staff; WHO: Geneva, Switzerland; IRC International Water and Sanitation Centre: Hague, The Netherlands, 2003. [Google Scholar]
  26. World Health Organization (WHO). Water Safety Planning for Small Community Water Supplies: Step-by-Step Risk Management Guidance for Drinking-Water Supplies in Small Communities; World Health Organization: Geneva, Switzerland, 2012. [Google Scholar]
  27. Tao, T.; Xin, K.; Xia, Y.; Liu, S. A risk assessment of the tap drinking water quality in a water distribution system based on consumer complaints. Water Distrib. Syst. Anal. 2011, 2010, 595–603. [Google Scholar]
  28. Atputharaj, A.U.E. The Influence of Service Quality Factors on Customer Satisfaction and Drinking Water Quality in Syarikat Bekalan Air Selangor (SYABAS). Master’s Thesis, University Utara Malaysia, Changlun, Malaysia, 2013. [Google Scholar]
  29. Dupont, D.P. Tapping into consumer perceptions of drinking water quality in Canada: Capturing consumer demand to assist in better management of water resources. Can. Water Resour. J. 2005, 30, 11–20. [Google Scholar] [CrossRef]
  30. United States Environmental Protection Agency (USEPA). Consumer Confidence Reports: Building Public Trust; National Primary Drinking Water Standards; U.S. Environmental Protection Agency: Washington, DC, USA, 2003.
  31. Johnson, B.B. Do reports on drinking water affect customers’ concerns? Experiments in report content. Risk Anal. 2003, 23, 985–998. [Google Scholar] [CrossRef] [PubMed]
  32. Hainan from Wikipedia, the Free Encyclopedia. Available online: https://en.wikipedia.org/wiki/Hainan (accessed on 8 January 2018).
  33. Lu, W.Q.; Xie, S.H.; Zhou, W.S.; Zhang, S.H.; Liu, A.L. Water pollution and health impact in China: A mini review. Open Environ. Sci. 2008, 2, 1–5. [Google Scholar] [CrossRef]
  34. Li, H. Spatial-Temporal analysis of heavy metal water pollution and the impact on public health in China. J. Plant Res. 2015, 116, 455–460. [Google Scholar]
  35. Hainan Province Environmental Information Public Publishing System. Available online: http://wr.hnsthb.gov.cn/wry/ (accessed on 8 January 2018).
  36. The World Bank. Water Pollution Emergencies in China: Prevention and Response; The World Bank: Washington, DC, USA, 2007. [Google Scholar]
  37. Su, Y.; Wang, X.L.; Li, K.Q.; Liang, S.; Qian, G.D.; Jin, H.; Dai, A.Q. Estimation methods and monitoring network issues in the quantitative estimation of land-based COD and TN loads entering the sea: A case study in Qingdao City, China. Environ. Sci. Pollut. Res. 2014, 21, 10067–10082. [Google Scholar] [CrossRef] [PubMed]
  38. Statistical Bureau of Hainan Province. Hainan Statistical Yearbook 2017; China Statistics Press: Beijing, China, 2017.
  39. Eilam, E.; Trop, T. Factors influencing adults’ environmental attitudes and behaviors and the role of environmental schools in influencing their communities. Educ. Urban Soc. 2014, 46, 234–263. [Google Scholar] [CrossRef] [Green Version]
  40. Swaim, J.; Maloni, M.; Napshin, S.; Henley, A. Influences on student intention and behavior toward environmental sustainability. J. Bus. Ethics 2014, 124, 465–484. [Google Scholar] [CrossRef]
Figure 1. The map of study areas.
Water 10 00446 g001
Figure 2. Degree of public satisfaction of different drinking water sources quality. Note: the same respondent ticked more than one alternative.
Water 10 00446 g002
Figure 3. Public knowledge about water pollution accidents. Note: the same respondent ticked more than one alternative.
Water 10 00446 g003
Figure 4. Emergency response provider during drinking water contamination accidents. Note: the same respondent ticked more than one alternative.
Water 10 00446 g004
Figure 5. Main measures to prevent water pollution accident. Note: the same respondent ticked more than one alternative.
Water 10 00446 g005
Table 1. The main questions of the questionnaire.
No.The main questions
1What kind of water do you use as the main source of your drinking water?
2Do you pay attention to local drinking water quality?
3Are you satisfied with your drinking water quality?
4Do you trust the safety of your drinking water?
5Do you have any problems with your tap water quality?
6When you have problems with your drinking water (such as water quality abnormal, pipeline damage, faucet water leakage, etc.), how do you solve these problems?
7What factors can affect the quality of tap water?
8Do you pay attention to the water pollution events reported on TV or in the newspaper?
9What kind of water pollution events do you pay attention to?
10What information do you mainly pay attention to the water pollution events?
11Who do you think as the main emergency response provider during drinking water contamination accidents?
12What do you think should be strengthened at the emergency disposal process?
13What do you think should be done to reduce pollution emergencies?
Table 2. Demographic composition of the sample.
TotalDing’an CountyLedong County
NumberPercentNumberPercentNumberPercent
Age
>507217.6%4321.4%2913.9%
35–5016339.8%7135.3%9244.0%
20–3416239.5%7939.3%8339.7%
<20133.2%84.0%52.4%
Sex
male16740.7%9547.3%7234.4%
female24359.3%10652.7%13765.6%
Education level
bachelor and above7418.0%4622.9%2813.4%
college11227.3%4823.9%6430.6%
high school 15638.0%6431.8%9244.0%
middle school5713.9%3517.4%2210.5%
primary school and below112.7%84.0%31.4%
Table 3. Statistical analysis of public awareness of drinking water safety.
TotalDing’an CountyLedong County
NumberPercentNumberPercentNumberPercent
Sources of household drinking water
tap water31370.7%17580.3%13861.3%
barreled or bottled water235.2%73.2%167.1%
well water10122.8%3315.1%6830.2%
spring water51.1%31.4%20.9%
others10.2%00.0%10.4%
Public attention of local water quality
special attention9322.7%3517.4%5827.8%
comparatively high attention23056.1%11758.2%11354.1%
no concerned6716.3%4421.9%2311.0%
no answer204.9%52.5%157.2%
The degree of public satisfaction with drinking water quality
very satisfied8420.5%7135.3%136.2%
relatively satisfied24559.8%10954.2%13665.1%
dissatisfied7518.3%2110.4%5425.8%
no answer61.5%00.0%62.9%
The degree of public trust in the safety of drinking water
confident7017.1%6431.8%62.9%
relatively confident17342.2%8542.3%8842.1%
somewhat worried14334.9%4321.4%10047.8%
extremely worried215.1%84.0%136.2%
no answer30.7%10.5%21.0%
Public awareness of problems with their tap water
never had problems25862.9%15577.1%10349.3%
had problems once or twice a year 10625.9%3416.9%7234.4%
had problems frequently184.4%84.0%104.8%
no answer286.8%42.0%2411.5%
The measures taken to solve problems that arise with tap water
solve problems by themselves20652.4%10837.8%9839.7%
help by local water utility6817.3%3512.2%3313.4%
complain to the local department of health16642.2%8730.4%7932.0%
help by the residential property maintenance staff8621.9%5218.2%3413.8%
call the local government telephone hotline for help71.8%41.4%31.2%
Note: Bold: the same respondent ticked more than one alternative.
Table 4. Results of multinomial logistic regression analysis for degree of public satisfaction with drinking water quality and its influencing factors.
Degree of Public Satisfaction with Drinking Water Quality aBStd. ErrorWalddfSig.Exp (B)95% Confidence Interval for Exp (B)
Lower BoundUpper Bound
very satisfiedintercept−0.9391.5440.37010.543
>50−0.1940.9940.03810.8460.8240.1175.783
35–500.7550.9460.63710.4252.1280.33313.603
20–34−0.3010.9520.10010.7520.7400.1154.781
<200.000..0....
male0.3490.3910.79810.3721.4180.6593.048
female0.000..0....
bachelor and above0.1411.3270.01110.9151.1510.08515.507
college−0.7541.2660.35410.5520.4710.0395.625
high school −1.0181.2360.67810.4100.3610.0324.074
middle school−0.9651.2640.58410.4450.3810.0324.533
primary school and below0.000..0....
within CDWQHMN2.6270.41340.55210.00013.8336.16331.051
outside of CDWQHMN0.000..0....
satisfiedintercept0.9081.3500.45210.501
>500.1210.7840.02410.8771.1290.2435.248
35–500.2780.7480.13810.7101.3210.3055.723
20–34−0.1990.7410.07210.7880.8190.1923.500
<200.000..0....
male0.3340.3151.13010.2881.3970.7542.588
female0.000..0....
bachelor and above0.9431.2350.58310.4452.5680.22828.915
college0.0861.1720.00510.9411.0900.11010.830
high school −0.4201.1520.13310.7150.6570.0696.277
middle school−0.4801.1700.16910.6810.6190.0626.123
primary school and below0.000..0....
within CDWQHMN0.6330.3024.38010.0361.8831.0413.405
outside of CDWQHMN0.000..0....
Note: a The reference category is dissatisfied.
Table 5. Results of multinomial logistic regression analysis for public attention to local water quality and its influencing factors.
Public Attention to Local Water Quality aBStd. ErrorWalddfSig.Exp (B)95% Confidence Interval for Exp (B)
Lower BoundUpper Bound
extremely concernedintercept−0.1251.2370.01010.920
>50−0.2100.9210.05210.8190.8100.1334.930
35–50−0.5900.8710.45910.4980.5540.1013.057
20–34−1.0090.8801.31410.2520.3650.0652.047
<200.000..0....
male0.5430.3822.02010.1551.7200.8143.636
female0.000..0....
bachelor and above2.7721.0077.58510.00615.9932.224115.005
college1.5110.9632.46210.1174.5310.68629.914
high school1.6020.9272.98310.0844.9610.80630.539
middle school0.9850.9521.07010.3012.6790.41417.327
primary school and below0.000..0....
within CDWQHMN−1.3260.36113.47710.0000.2660.1310.539
outside of CDWQHMN0.000..0....
fairly concernedintercept−0.6201.0930.32110.571
>500.3040.8360.13210.7161.3550.2636.979
35–50−0.0140.7900.00010.9860.9860.2094.643
20–34−0.2240.7950.07910.7780.7990.1683.800
<200.000..0....
male0.4060.3331.48910.2221.5010.7822.884
female0.000..0....
bachelor and above2.7790.87310.14410.00116.1082.91289.091
college2.4600.8159.11710.00311.7092.37157.824
high school2.1920.7907.70310.0068.9501.90442.075
middle school1.3420.8062.77210.0963.8250.78818.558
primary school and below0.000..0....
within CDWQHMN−0.6230.3104.05010.0440.5360.2920.984
outside of CDWQHMN0.000..0....
Note: a The reference category is no concerned.
Table 6. Results of multinomial logistic regression analysis for public awareness of water pollution accidents and influencing factors.
Public Awareness of Water Pollution Accidents aBStd. ErrorWalddfSig.Exp (B)95% Confidence Interval for Exp (B)
Lower BoundUpper Bound
extremely concernedintercept−1.0921.2290.78910.374
>500.2850.9260.09510.7581.3300.2168.171
35–50−0.3100.8470.13410.7140.7330.1393.860
20–34−0.3240.8600.14210.7060.7230.1343.901
<200.000..0....
male0.7910.3784.37010.0372.2061.0514.630
female0.000..0....
bachelor and above2.9591.0328.21410.00419.2722.548145.768
college2.6960.9637.84010.00514.8152.24597.773
high school2.1070.9285.15610.0238.2231.33450.681
middle school1.5020.9422.54310.1114.4900.70928.432
primary school and below0.000..0....
within CDWQHMN−0.7390.3404.73310.0300.4770.2450.929
outside of CDWQHMN0.000..0....
fairly concernedintercept−1.1031.1130.98210.322
>500.8880.8601.06710.3022.4300.45113.101
35–50−0.1930.7860.06010.8060.8250.1773.851
20–34−0.0910.7970.01310.9090.9130.1924.351
<200.000..0....
male0.3260.3600.82010.3651.3850.6842.806
female0.000..0....
bachelor and above3.4670.93013.88310.00032.0345.172198.432
college2.9050.86211.34910.00118.2653.37098.991
high school2.5090.8239.30510.00212.2972.45261.668
middle school1.6230.8303.81910.0515.0680.99525.805
primary school and below0.000..0....
within CDWQHMN−0.4130.3181.68910.1940.6620.3551.234
outside of CDWQHMN0.000..0....
Note: a The reference category is no concerned.

