Prediction Method for the Complete Characteristic Curves of a Francis Pump-Turbine


1
State Key Laboratory of Hydroscience and Engineering, Department of Hydraulic Engineering, Tsinghua University, Beijing 100084, China
2
State Key Laboratory of Simulation and Regulation of Water Cycle in River Basin, China Institute of Water Resources and Hydropower Research, Beijing 100038, China
3
Technology Center of State Grid Xinyuan Company Limited, Beijing 100161, China
*
Author to whom correspondence should be addressed.
Water 2018, 10(2), 205; https://doi.org/10.3390/w10020205
Submission received: 27 November 2017
/
Revised: 10 February 2018
/
Accepted: 11 February 2018
/
Published: 14 February 2018
Abstract
:Complete characteristic curves of a pump-turbine are essential for simulating the hydraulic transients and designing pumped storage power plants but are often unavailable in the preliminary design stage. To solve this issue, a prediction method for the complete characteristics of a Francis pump-turbine was proposed. First, based on Euler equations and the velocity triangles at the runners, a mathematical model describing the complete characteristics of a Francis pump-turbine was derived. According to multiple sets of measured complete characteristic curves, explicit expressions for the characteristic parameters of characteristic operating point sets (COPs), as functions of a specific speed and guide vane opening, were then developed to determine the undetermined coefficients in the mathematical model. Ultimately, by combining the mathematical model with the regression analysis of COPs, the complete characteristic curves for an arbitrary specific speed were predicted. Moreover, a case study shows that the predicted characteristic curves are in good agreement with the measured data. The results obtained by 1D numerical simulation of the hydraulic transient process using the predicted characteristics deviate little from the measured characteristics. This method is effective and sufficient for a priori simulations before obtaining the measured characteristics and provides important support for the preliminary design of pumped storage power plants.

1. Introduction
In the development of modern electric power systems, pumped-storage power plants (PSPPs) play an important role in peak regulation, frequency modulation, emergency reserve and black starts [1,2,3]. However, to adapt to the load change of a power system, PSPPs often need to change their operating conditions, which leads to hydraulic transients. Severe hydraulic transients cause adverse effects on the safety and stability of PSPPs [4,5,6]. Therefore, these transients must be considered in advance.
Complete characteristic curves are key to establishing the boundary conditions of pump-turbines. They are important for determining the structural parameters of the penstocks, developing the protection strategies, and optimizing the layout of the project. However, in the preliminary design stage, if a model test is not conducted or the pump-turbine is not selected, the corresponding characteristic curves are unavailable. Moreover, applying the characteristics of a pump-turbine with a similar specific speed may produce large errors [7,8]. Therefore, in this context, it is necessary to predict the characteristic curves of the pump-turbine to analyze the hydraulic transients in advance and to guide the preliminary design of the project.
Due to the wide range of applicable head values, the Francis pump-turbine has become the most common pump-turbine in use today [9,10]. Some achievements have been obtained in the prediction of its characteristic curves. According to the partial characteristic curves in the optimum working area of a turbine, Krivchenko [11] drew complete characteristic curves by extrapolation and interpolation. Gryanko [12] studied the relationship between the working parameters of the optimum operating conditions and the specific speed. Martin [13,14] proposed the transformation pattern of pump-turbine characteristics at some special conditions and analyzed the relationship between the parameters of some characteristic operating points (COPs) and guide vane openings (GVOs). Liu [15] and Zeng [16] independently provided the fitting functions between the parameters of COPs and the specific speed at the optimum operating conditions. Liu [17], Zhu [18] and Hu [19] introduced backpropagation neural network technology to predict the characteristic curves of a pump. A prediction method of the “S”-shaped characteristic zone (unstable operating zone in the turbine region and reverse pump region, in which a speed factor corresponds to multiple flow factors or torque factors) of pump-turbines based on CFD was proposed by Ji [20,21]. Through the experiments, Cavazzini [22] and Li [23] studied the influence of the “S”-shaped characteristic zone on the transient processes of a PSPP.
However, the above studies did not fully predict the complete characteristic curves of a pump-turbine because they focused more on some special operating regions. According to the dynamic characteristics of a pump-turbine, a mathematical expression describing the complete pump-turbine characteristics was established by Chang [24,25], but it cannot correctly reflect the characteristics of the complete characteristic curves when the flowrate is zero. According to Euler’s turbine equations, Nielsen [26] simulated the turbine region of a pump-turbine with the pumping effect included. Zhu [27] presented the laws of some basic geometric parameters of turbines through curvilinear regression of the turbine hill charts. Zeng [28,29] divided the characteristic curves into several domains and then obtained the characteristic curves through high-dimensional spline interpolation and reverse transformation, but the transform procedures were complex.
In this paper, a mathematical model describing the complete characteristic curves of a Francis pump-turbine was derived. Ten sets of complete characteristic curves of Francis pump-turbines, including high-, medium- and low-rated heads, were then collected to establish an expression of the characteristic parameters of COP sets as explicit functions of a specific speed and GVO. Furthermore, by combining the mathematical model with the regression analysis of COP sets, the complete characteristic curves of a given specific speed were predicted. Finally, a comparison with the measured data was conducted to validate the prediction method.
2. Mathematical Model
According to the theorem of the moment of momentum, the torque TT and the effective head HT in a steady turbine mode and the torque TP and the pumping head HP in a steady pump mode can be expressed by the following equations, which are also known as Euler equations [25,26]:
where the subscripts T and P represent the turbine mode (centripetal flow mode) and pump mode (centrifugal flow mode), respectively; subscripts 1 and 2 represent the runner inlet and outlet, respectively; T is the shaft torque (N∙m); Q is the discharge; Vu, , r, H and are the peripheral components of the absolute velocity (m/s), hydraulic efficiency, radius (m), water head (m) and angular velocity of rotation (rad/s), respectively; and , where is the hydraulic loss coefficient, and its value is generally between and , according to the statistics of several PSPPs; is the flow density (kg/m3), and g is the gravitational acceleration (m/s2).
When the pump-turbine is running stably in turbine mode, ignoring the flow loss at the runner and assuming that the flow distribution of the runner inlet or outlet is uniform, the flow through it can be calculated as follows [30,31,32]:
where is the meridional flow velocity at the runner inlet (m/s), and is the discharge section area at the runner inlet (m2).
According to the continuity of water flow, another expression of Q is
where is the meridional flow velocity at the runner outlet (m/s), and is the discharge section area at the runner outlet (m2).
By analyzing the velocity triangles at the runners in turbine mode [5,33] shown in Figure 1, and are yielded as follows:
where is the peripheral velocity (m/s); is the absolute flow angle (°), and is the relative flow angle (°).
Substituting Equations (7) and (8) into Equations (1) and (2) yields
Pump-turbine characteristics are often represented by the dimensionless quantities , and , which are defined as follows [34]:
where , m and represent the speed factor, discharge factor and torque factor, respectively; is the reference diameter of the runner inlet (m), and n is the rotational speed (rad/s), whose value is equal to angular velocity .
Substituting Equation (11) and into Equation (9) yields
where , .
Likewise, substituting , and Equation (11) into Equation (10) gives
where , , , and K is the hydraulic loss coefficient.
In addition, because of the inverse relationship between the turbine mode and the pump mode [25,26], the characteristic equations of the pump mode according to the velocity triangle of the reverse flow at the runner can be deduced as follows:
where , . , , .
The above characterization of the relationship curves among , and under different GVOs during the steady operation mode provides the complete characteristic curves of the pump-turbine. They are derived under the assumptions that the fluid is ideal and incompressible and that there is no interference between adjacent flow layers [25]. However, from the measured complete characteristic curves of a Francis pump-turbine, it can be found that the corresponding torque factor is not equal to zero when the discharge factor is zero; Equations (12) and (14) can be corrected as follows:
where and are the correction factors, which are related to the specific speed and the GVOs.
Equations (13), (15), (16) and (17) constitute a mathematical model describing the characteristics of a Francis pump-turbine, where Equations (13) and (15) are used to determine the flow characteristics of the centripetal flow mode () and centrifugal flow mode (), respectively, while Equations (16) and (17) are used to describe the torque characteristics of the centripetal flow mode and centrifugal flow mode, respectively. The shapes of the complete characteristic curves depend on the parameters (such as , , and ) that are related to the geometric parameters of the runner and the operation condition parameters [35,36,37].
However, these parameters are unknown before the pump-turbine is selected or the runner model test is carried out, and they are varying from hub to shroud when the operating point changes [38,39,40]. There are two solutions: first, collect the geometric dimensions of the runner of different specific speed pump-turbines and the flow angle with different operation conditions, including the guide vane height, runner diameter, blade angle, absolute flow angle and relative flow angle. The relationship between the above parameters and specific speed and GVO can then be obtained by regression analysis. Second, only collect several COP sets on the complete characteristic curves of different pump-turbines and develop an expression for their dimensionless characteristic parameters (, and ) as functions of specific speed and relative GVOs. When the specific speed is given, the characteristic parameters of these COPs on the complete characteristics can be approximately determined according to the regression model. Thus, the above parameters can be determined by substituting the values of , and of COPs into the mathematical model. Since each equation in Equation (13) to Equation (17) has only three undetermined coefficients, the values of these coefficients in theory can be determined if the dimensionless characteristic parameters of three COPs in the corresponding operating region are known.
Clearly, the second method has advantages over the first method for data collection and statistical analysis. Therefore, the second method is applied to predict the characteristics of a Francis pump-turbine.
3. COP Set Analysis
Each characteristic curve can be regarded as the connection of the adjacent COPs at a constant GVO. Therefore, if we can accurately predict the characteristic parameters of each COP, the complete characteristics can be theoretically drawn by applying the mathematical model. The generic four-quadrant characteristic curves at different constant GVOs of a Francis pump-turbine are presented in Figure 2. It shows the distribution of the COPs on the complete characteristic curves, in which five main operating regimes are distinguished: pump, pump brake, turbine, turbine brake and reverse pump. In Figure 2, point C and point O represent the best efficiency points in the pump region and the turbine region, respectively, and the characteristic curve on which point O is located is known as the optimal opening curve (OOC). Point B1 is the demarcation point of the pump region and pump brake region, while point B2 is the demarcation point of the runaway region and reverse pump region. Their discharge factors are equal to zero. Point A is the zero speed point, and point R represents the runaway point, whose torque factor is equal to zero. Since the above COPs exist in the characteristic curves of each GVO, the COP sets Ci, Oi, Ai, Ri, B1i and B2i (i represents the GVO serial number) are formed. The working conditions corresponding to these COP sets represent special meanings, and the locations of these COP sets have a decisive influence on the shape of the complete characteristic curves. Here, to avoid calculating the efficiency of the pump region and turbine region under all GVOs, Ci and Oi can be defined as the point sets with the same as point C and point O, respectively.
Since the locations of these COP sets are mainly related to the specific speed and GVO, for constructing the function relations between the characteristic parameters of each COP and specific speed and GVO, i.e., , and , the measured characteristic data of 10 Francis pump-turbines were collected in Table 1, including high-, medium- and low-rated heads, ranging from 100 m to 700 m. The dimensionless forms of specific speed and relative GVO are given below [34]:
where represents the specific speed at the optimal working conditions of the turbine mode; the subscript O refers to the best efficiency point in the turbine region; is the relative GVO, and a is guide vane opening (m).
From Refs. [13] and [28], the assumption can be made that the relationship between the characteristic parameters (, and ) of the COP sets and is determined only by the COPs on the OOC. Once is determined, the characteristic parameters of the COP sets are related only to GVO. Therefore, the relationship between and the characteristic parameters of the COPs on the OOC is determined first. To avoid the inconvenience caused by differences in data dimensions and magnitudes in the process of statistical analysis, the relationship between the dimensionless relative characteristic parameters of the COP sets and the GVO () is analyzed. Since the relative characteristic parameters are nonlinear functions of , the relations can be described simply in polynomial functions. To evaluate the fitting quality, the correlation coefficient is defined as follows:
where and are the original data and the fitting results, respectively; and and are the mean values of and , respectively.
3.1. Point Sets Oi and Ci
Before the 1990s, the speed factor of point O () was often in a narrow range from 2.51 to 2.67, and was approximately 1.12 to 1.16 times [9,11]. With the development of hydraulic machinery technology, has increased and can now reach 2.71 to 2.94 [16]. The characteristic parameters of point O and point C of different pump-turbines in Table 1 are collected and analyzed, as shown in Figure 3. Their speed factors are relatively stable in a micro inclined zone. Thus, a linear fitting can still be used to obtain and approximately since their variation range is small, even if the R values are 0.6366 and 0.8199, respectively. Meanwhile, the boundaries of the 95% prediction interval are given. For the and relations, according to the distribution of data points, the regression model as recommended by Zeng [16] is applied, and the R values are greater than 0.90. For the and relations, it can be seen that the data points are reasonably clustered around the regression model , with the standard deviations of 0.01 and 0.0036 as shown by the gray strip in Figure 3.
After determining the characteristic parameters of point O and point C, the relationship between and the dimensionless relative characteristic parameters (, , , , and ) still must be analyzed to identify the point sets Oi and Ci. For this purpose, 10 sets of statistical data with different specific speeds were arranged into one group, and the least squares method was then applied to obtain the undetermined coefficients in the polynomial functions. In addition, because the fitting curve must pass through a fixed point (1, 1), the locally weighted linear regression is used to obtain the optimal parameter estimation. The fitting results are shown in Figure 4. It can be seen that the dimensionless relative characteristic parameters (, , , ) of ten pump-turbines with significant differences in specific speed overlap greatly and that the R values are greater than 0.94. This indicates that the relative characteristic parameters are highly relevant to but are less related to . Thus, the above assumption was confirmed.
3.2. Point Sets Ai and Ri
Likewise, the relationships between and the characteristic parameters of point A (the zero speed point) and point R (the runaway point) are analyzed first in Figure 5. Because the runner of a Francis pump-turbine is similar to that of a centrifugal pump, the centrifugal effect of the flow through the runner is significant under the runaway condition [26]. This leads to a large resistance torque, which makes the runaway speed smaller than that of a conventional Francis turbine. Since runaway speed increases little with increasing specific speed and the variation range of is small [9,11,16], the linear fitting can be used in Figure 5c, and the R value is 0.6731. To evaluate the confidence limits of for a given , the 95% prediction interval is provided. The other R values exceed 0.95, which indicates that , and have a strong correlation with the specific speed .
Figure 6 shows the relationship between and the relative characteristic parameters of Ai and Ri, and the correlation coefficients are greater than 0.96. This indicates that the GVO has a strong positive correlation with the characteristic parameters of point sets Ai and Ri, which is why engineers usually adjust the GVO to prevent the units from entering the runaway condition. Since the rotational speeds of Ai are equal to zero, the flow changes of Ai are affected only by the GVO.
3.3. Point Sets B1i and B2i
According to previous experience with water pumps, Krivchenko [11] proposed the approximate pump head of point B1 under zero flow conditions:
where is the runner peripheral speed (m/s), and is the rotational speed for zero flow conditions (rpm).
According to Equation (11), can be obtained as follows:
Substituting Equation (22) into Equation (21) yields
Through the data collection shown in Figure 7, it is found that the variation range of the speed factor of point B1 is small. Because there exists an approximately linear relationship between and —that is, —linear fitting can be used to determine their values, and the short dash lines are the bands of the 95% prediction interval. Due to the impending reverse flow and the pumping effect in the “S”-shaped region [26,41,42], the change of the resistance torque is complex under the operating condition corresponding to point B2. This leads to relatively low correlation coefficients between and (0.7683), and the standard deviations of 0.0029 are provided as shown by the gray strip in Figure 7.
Point set B1i is concentrated on the complete characteristics and forms the hump region. The relative speed factor of B1i () presents less variation, ranging from 0.92 to 1.02, and the GVO has a strong influence on the torque factor of B1i. Additionally, it can be seen that the data points are reasonably clustered around the polynomial fit, with the standard deviations of 0.0108 and 0.0806 as shown by the gray strip in Figure 8a,b. Relatively speaking, the correlations of and are stronger (0.9634 and 0.9670, respectively), as shown in Figure 8c,d.
Ultimately, as explicit functions of the specific speed and the relative GVO, the characteristic parameters of COP sets are obtained, as listed in Table 2. Due to the limited collection of Francis pump-turbines, the relational model in Table 2 is valid within the range of 0.43 to 0.87 of the specific speed at optimum condition. Indeed, to obtain the complete characteristic curves, the COPs must also be increased in the pump region, pump brake region and reverse pump region to ensure that there are at least three sets of COPs in each quadrant, e.g., Di, which exists at ; Ei, which exists at ; Gi and Ii, which are the point sets with the smallest speed factor and the best efficiency in the reverse pump region, respectively. Due to space limitations, the regression analyses of Di, Ei, Gi and Ii are not elaborated here. When the specific speed at the optimum condition and the GVO are given, the position of each COP set can be determined according to the above fitting relations, and then the proposed mathematical model (Equation (13) to Equation (17)) can be used to draw the complete characteristic curves. In addition, to improve the prediction accuracy, it is recommended to use the segmented drawing method in the centripetal flow region—for example, using the three adjacent points Ai, Oi, and Ri to draw the Ai-Oi segment.
4. Case Study and Discussion
To verify the mathematical model proposed in Section 2, the pump-turbines of the Xianju and Xilongchi PSPPs in China, whose measured characteristics are available from the model test, are selected as the test subjects. The specific speeds in the optimum condition are 0.52 and 0.43, respectively. The basic parameters of the two pump-turbines are presented in Table 3.
First, if the characteristic parameters of all COPs are known, as listed in Table 4, the parameters (such as , , and ) and the flow characteristic of OOC can be obtained using Equations (13) and (15), which were segmentally solved within each quadrant using the ‘ezplot’ function of MATLAB. It is then easy to obtain the torque characteristic of OOC using Equations (16) and (17). The predicted OOCs of the Xianju and Xilongchi pump-turbines are highly consistent with their measured curves in any condition region, as shown in Figure 9. As expected, the derived mathematical model describing a Francis pump-turbine’s characteristics is effective and accurate. The complete characteristics can be successfully predicted if the characteristic parameters of all COPs under any GVO are yielded. Therefore, when the costly and time-consuming model test of the complete characteristic curves is carried out, engineers can even test only these characteristic working conditions to speed up the model test process.
According to the correlation of the characteristic parameters of the COP sets with and in Table 2, the locations of the COP sets can be determined if is given, allowing the values of these parameters (such as , , and ) under each GVO to be obtained and the complete characteristic curves to be predicted using the mathematical model. Figure 10 shows the comparison between the predicted complete characteristic curves of the Xianju and Xilongchi pump-turbines and their measured data. The theoretical prediction curves are in good agreement with the measured data, even at small opening degrees. Nevertheless, because the characteristic curves in the hump region and the “S”-shaped region have large slopes and because they intersect and overlap each other, it is difficult to implement the statistical analysis on the COPs in these regions. This causes some deviation in predicting the characteristic parameters of point sets B1i, Ri and B2i, leading to differences between the prediction curves and the measured data in these regions. However, there is no meaningful difference; thus, the prediction characteristic curves are still acceptable. Certainly, the precision of this prediction method depends on the statistical accuracy of COPs, and the classification and statistics of different pump-turbine manufacturers can improve the prediction accuracy theoretically.
Since it is difficult to estimate the deviation between the predicted complete characteristic curves and the measured data directly and quantitatively based on Figure 10, the utility of the prediction method can be indirectly evaluated by using them to simulate the same transient operating conditions. The layouts of the Xianju and Xilongchi PSPPs are presented in Figure 11. A water conservancy system of the Xianju PSPP is composed of an upstream reservoir, a 90 m long pressure headrace tunnel, a common penstock of approximately 1125 m long and 6.2 m in diameter connected to two 375 MW pump-turbines connected to the tailrace surge chamber by a common draft tube extension of 278 m in length, and a pressure tailrace tunnel of approximately 758 m in length and 7.4 m in diameter. One water conservancy system of the Xilongchi PSPP comprises an upstream reservoir; a 250 m long pressure headrace tunnel; a common penstock of approximately 1197 m in length and 4.7 m in diameter connected to two 300 MW pump-turbines connected to the tailrace gate shaft by the draft tube extension of 262 m and 285 m in length, respectively; and a pressure tailrace tunnel of approximately 100 m in length to the downstream reservoir. The main characteristics of the two PSPPs are presented in Table 5.
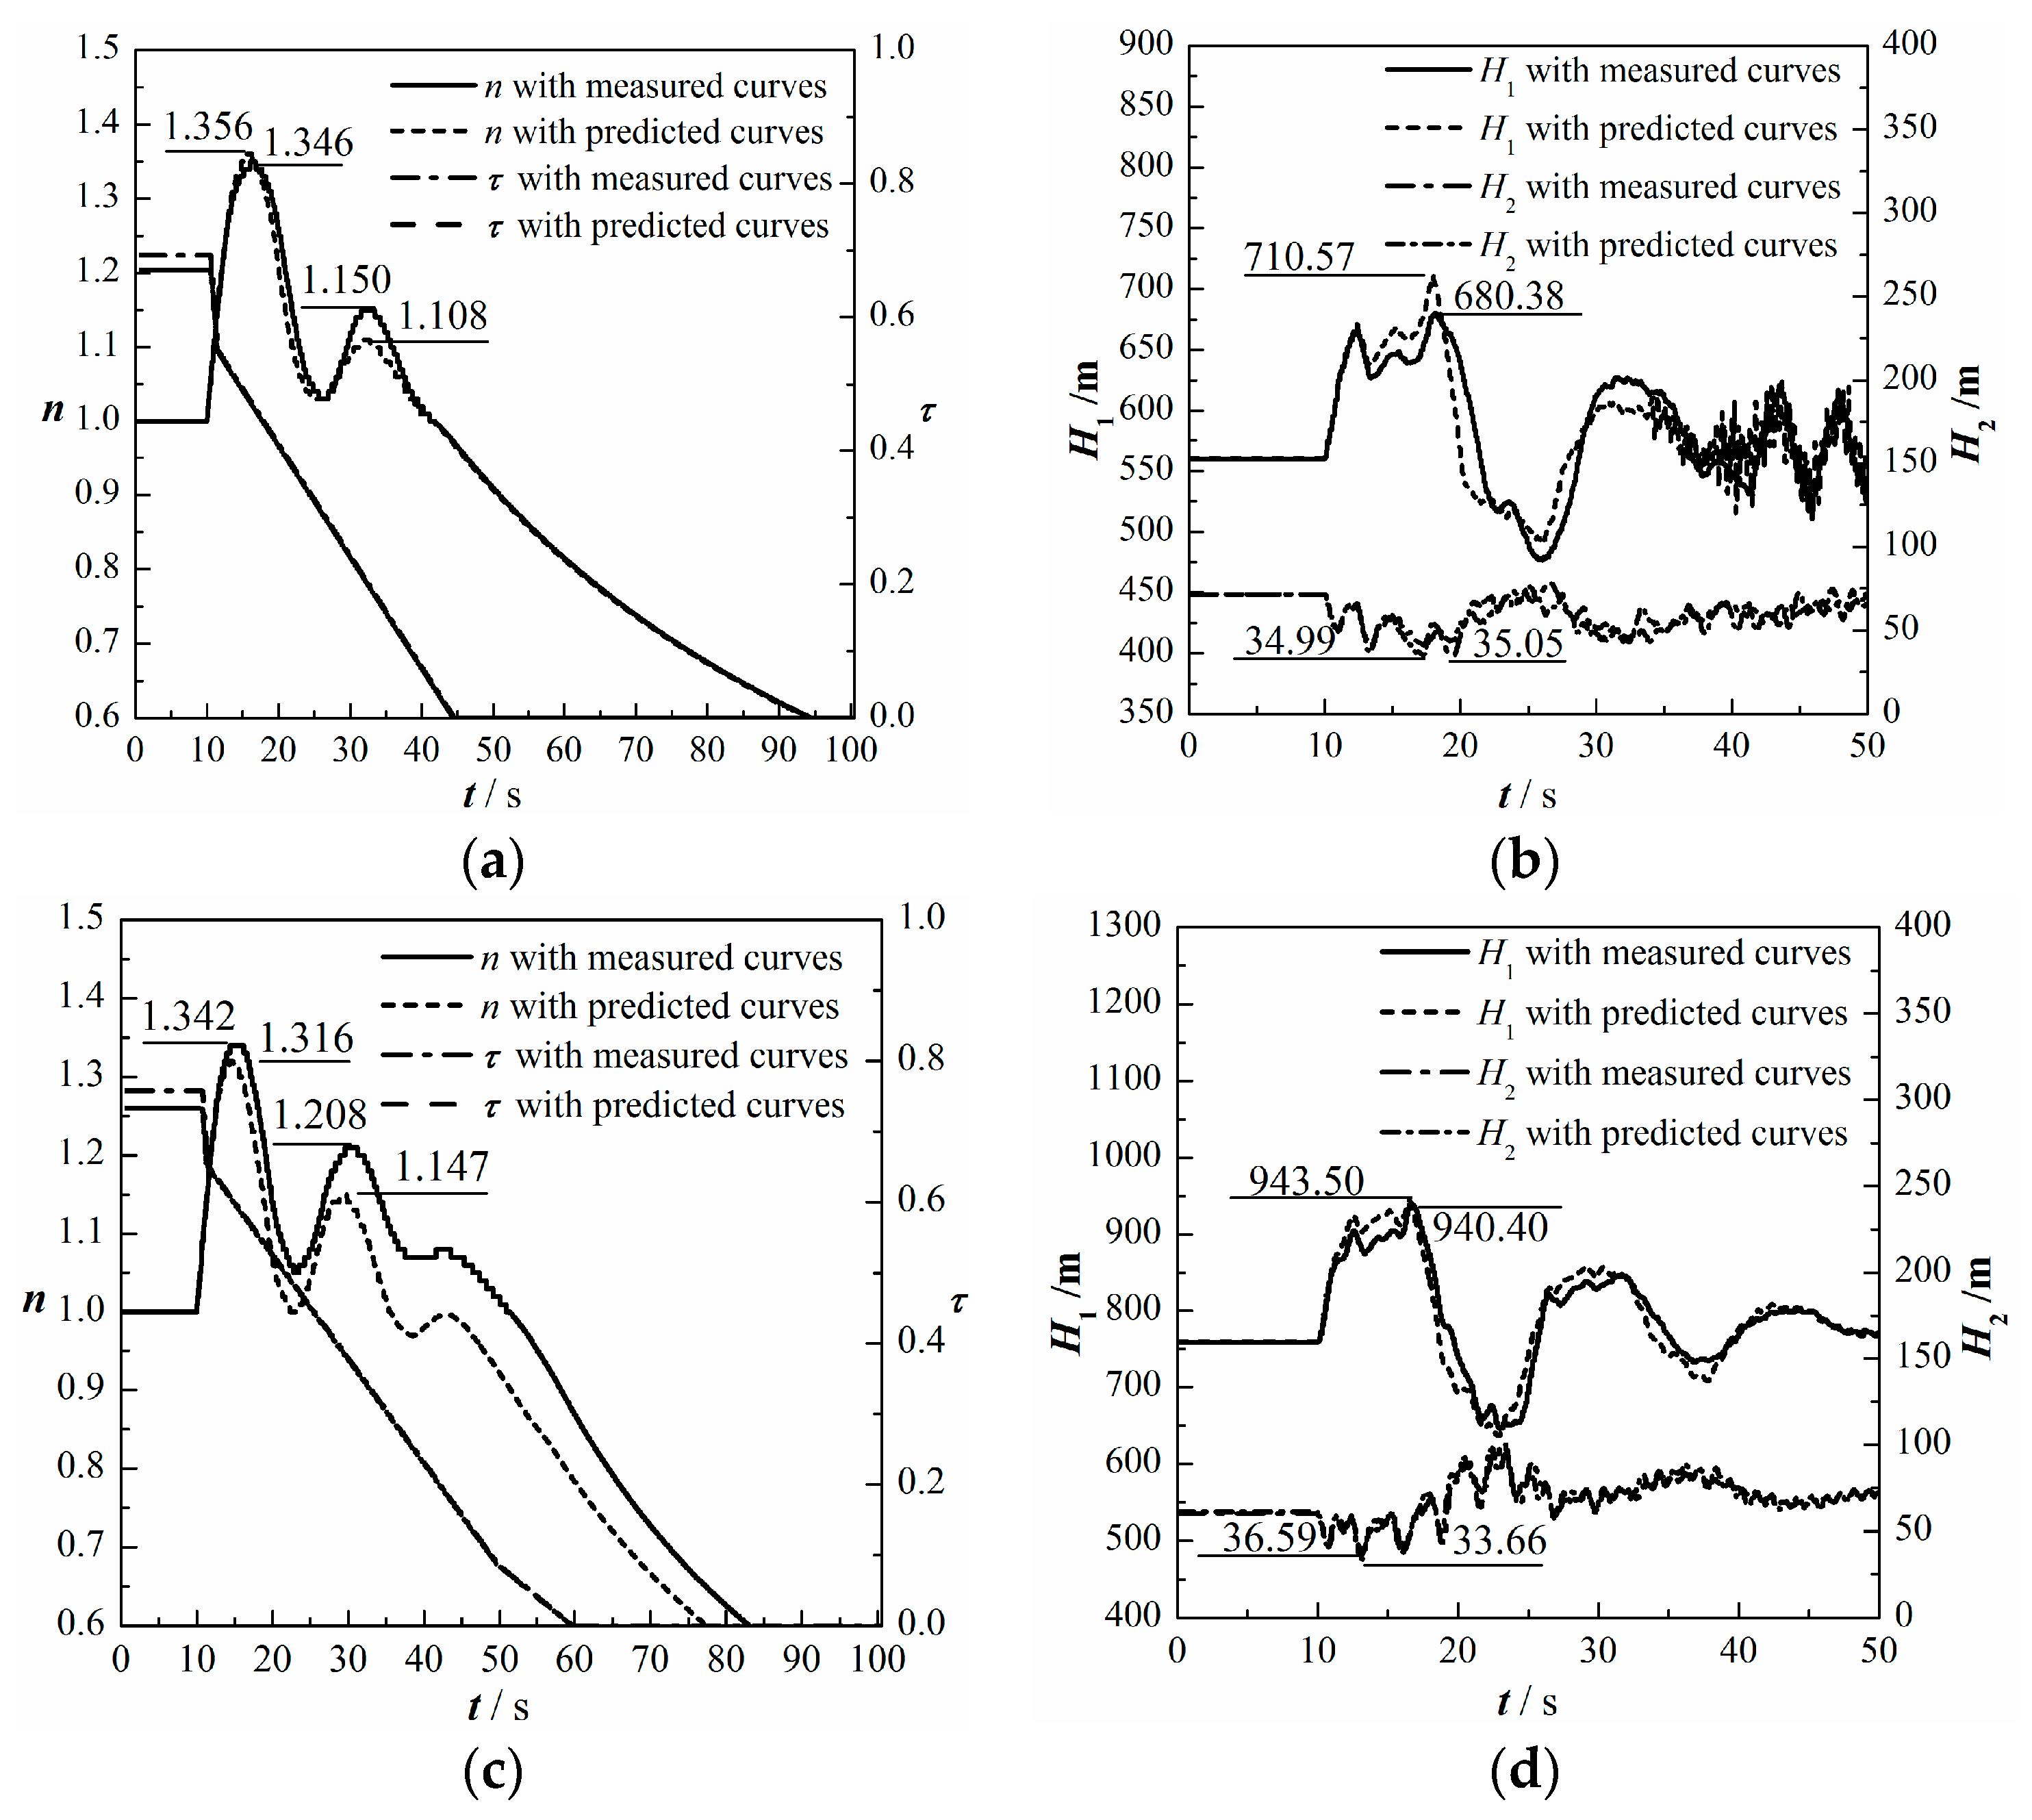
The simultaneous load rejection of the units of the Xianju and Xilongchi PSPPs at the rated output condition are simulated by SIMSEN-Hydro software [33,43,44] using the predicted complete characteristic curves; the measured curves are shown in Figure 10, and the transient results are presented in Figure 12. The water levels of the upstream reservoirs and downstream reservoirs are normal water level and dead water level, respectively. Table 6 presents the comparison of the maximum rotational speed, the maximum pressure at the spiral case inlet and the minimum pressure at the draft tube inlet. It can be noted that for the simulation results of the rotational speed with the predicted characteristics and with the measured characteristics, the overall speed variation is almost identical for the Xianju pump-turbine, and there is less than a 3% difference for the maximum speed rise. For the Xilongchi pump-turbine, the maximum speed increase simulated by the measured complete characteristics is greater than that obtained by using the predicted characteristics (7.6%). For the Xianju PSPP, the maximum head rise at the spiral case inlet (H1) is approximately 4.4% higher for the simulation with the predicted characteristic curves, and the absolute deviation is relatively large. Considering that the “S” instability zone and the pressure pulsation have a significant effect on the pressure at the spiral case inlet [7,14,32,33], the deviation is still acceptable. However, for the Xilongchi PSPP, there is only a 0.3% difference for the maximum head rise at the spiral case inlet. For the minimum pressure at the draft tube inlet (H2), the relative deviations are only 0.2% for the Xianju PSPP and 8% for the Xilongchi PSPP. The percentage difference of 8% is due to the magnitude of the minimum pressure resulting in a large relative deviation. By converting it to an absolute value, it is less than 3 m, which is considered acceptable. This demonstrates that the simulations obtained by using the predicted characteristics match well with the results corresponding to the measured complete characteristic curves. Therefore, the above prediction method of complete characteristics can satisfy the preliminary analysis accuracy of the hydraulic transients in PSPPs.
Note that when the undetermined coefficients in Equation (13) to Equation (17) are determined by using the prediction method, it is even possible to use these equations instead of the characteristic curves in the 1D simulation of the hydraulic transition process to omit the interpolation process in the simulation.
5. Conclusions
According to Euler equations and the velocity triangles at the runners, the mathematical model describing the complete characteristics of a Francis pump-turbine was derived. The functional relationship of the characteristic parameters of COP sets with specific speed and the relative GVO were then proposed based on multiple sets of measured complete characteristic curves. Ultimately, based on the case study, the following conclusions are drawn:
- Under the condition that the characteristic parameters of all COPs are known, the predicted OOC is in high-precision agreement with the measured data. This indicates that the mathematical model for predicting the complete characteristics is valid and feasible. The key to ensuring prediction precision is the accurate location of each COP set. The higher the positioning accuracy of the COP sets, the higher the prediction accuracy. Therefore, in the model test of the complete characteristic curves, it is even possible to test only these characteristic working conditions to speed up the model test process.
- Using the relational model of the characteristic parameters of the COP sets with specific speed and the relative GVO we proposed, the predicted complete characteristic curves match well with the measured characteristics, even at small opening degrees. Due to the limited collection of Francis pump-turbines, the relational model in Table 2 is valid within the range of 0.43 to 0.87 of the specific speed. In theory, the classification and statistics of different pump-turbine manufacturers can improve the prediction accuracy.
- The 1D simulation results of the simultaneous load rejection obtained by using the prediction characteristics match well with the results corresponding to the measured complete characteristics. The minimum pressures at the draft tube inlet are almost identical, and the differences of the maximum speed rises are less than 8%. For the maximum head rises at the spiral case inlet, there is less than 4.4% relative deviation. This method is effective and sufficient for a priori simulations before obtaining the measured characteristics and provides important support for the preliminary design of PSPPs.
Although the complete characteristic curves of a Francis pump-turbine with an arbitrary specific speed were successfully predicted, among the factors influencing the COP sets’ characteristic parameters, only on the specific speed was considered here. The impact of a pump-turbine’s geometric dimensions on the complete characteristic curves is a matter of interest for future research.
Acknowledgments
This work was supported by the National Key Research and Development Program of China (Grant No. 2016YFC0401808), National Science & Technology Pillar Program during the Twelfth Five-year Plan Period (Grant No. 2015BAD24B02), National Natural Science Foundation of China (Grant Nos. 51379099 and 51609265) and Beijing Natural Science Foundation (Grant No. 9152010). The authors sincerely appreciate the support of the Technology Center of State Grid Xinyuan Company Limited in providing the design parameters and the measured characteristic curves of pump-turbines.
Author Contributions
This paper is part of the ongoing work of Wei Huang, who derived the mathematical model and wrote the paper. Xinlei Guo assisted in modifying the structure of the paper and carried out the regression analysis of the measured data. Kailin Yang and Jiming Ma are the candidate’s supervisors. They helped determine the direction of the study and provided consultation. Jue Wang helped provide the valuable complete characteristic curves and design parameters of pump turbines. Jiazhen Li provided excellent suggestions for the Discussion section.
Conflicts of Interest
The authors declare no conflict of interest.
Nomenclature
| PSPP | pumped-storage power plant |
| COP | characteristic operating curve |
| GVO | guide vane opening |
| OOC | optimal opening curve |
| T | hydraulic torque, N∙m |
| Q | diversion flowrate, m3/s |
| H | pump turbine working head, m |
| N | rotational speed, rpm |
| Vu | peripheral component of absolute velocity, m/s |
| Vm | meridional flow velocity, m/s |
| U | peripheral velocity, m/s |
| A | section area, m2 |
| absolute flow angle, ° | |
| relative flow angle, ° | |
| r | radius, m |
| γ | bulk density of water, N/m3; correction factor in the mathematical model |
| ω | angular velocity of rotation, rad/s |
| flow density, kg/m3 | |
| g | gravitational acceleration, m/s2 |
| η | working efficiency |
| speed factor | |
| discharge factor | |
| torque factor | |
| D | diameter, m |
| K | hydraulic loss coefficient |
| n | rotational speed, rad/s; relative rotational speed |
| P | effective power, MW |
| GD2 | moment of inertia, t·m2 |
| NQE | specific speed |
| τ | relative opening of guide vane |
| a | guide vane opening, m |
Subscripts
| T | pump-turbine in the turbine mode |
| P | pump-turbine in the pump mode |
| O | best efficiency point in the turbine mode |
| r | rated condition |
| u | upstream reservoir |
| d | downstream reservoir |
| min. | minimum value |
| max. | maximum value |
| nor | normal value |
| 1 | runner inlet |
| 2 | runner outlet |
References
- Kerensky, G. Adapting pump storage plant to meet grid emergencies. In International Symposium on Water Hammer in Pumped Storage Projects; Gibson, W.L., Streeter, V.L., Eds.; American Society of Mechanical Engineers: New York, NY, USA, 1965; pp. 24–33. [Google Scholar]
- Guittet, M.; Capezzali, M.; Gaudard, L.; Romerio, F.; Vuille, F.; Avellan, F. Study of the drivers and asset management of pumped-storage power plants historical and geographical perspective. Energy 2016, 111, 560–579. [Google Scholar] [CrossRef]
- Steffen, B. Prospects for pumped-hydro storage in Germany. Energy Policy 2012, 45, 420–429. [Google Scholar] [CrossRef]
- Trivedi, C.; Cervantes, M.J.; Gandhi, B.K.; Dahlhaug, O.G. Transient pressure measurements on a high head model Francis turbine during emergency shutdown, total load rejection, and runaway. AMSE J. Fluids Eng. 2014, 136, 121107. [Google Scholar] [CrossRef]
- Pullinger, M.G. Evaluating Hydraulic Transient Analysis Techniques in Pumped-Storage Hydropower Systems. Master’s Thesis, Murdoch University, Perth, Australia, 2011. [Google Scholar]
- Afshar, M.H.; Rohani, M.; Taheri, R. Simulation of transient flow in pipeline systems due to load rejection and load acceptance by hydroelectric power plants. Int. J. Mech. Sci. 2010, 52, 103–115. [Google Scholar] [CrossRef]
- Yang, L.; Chen, N.X. Analysis of relation between characteristics of pump-turbine runner and transition of pumped-storage power station. J. Tsinghua Univ. (Sci. Technol.) 2003, 43, 34–37. [Google Scholar]
- Yang, J.B.; Yang, J.D. B-spline surface construction for the complete characteristics of pump-turbine. In Proceedings of the IEEE Asia-Pacific Power and Energy Engineering Conference (APPEEC), Shanghai, China, 27–29 March 2012; pp. 1–5. [Google Scholar]
- Mei, Z.Y. Pumped Storage Power Generation Technology; Machinery Industry Press: Beijing, China, 2000. [Google Scholar]
- Lu, Y.M.; Pan, J.Z. Pumped Storage Power Plants; Water Resources and Electric Power Press: Beijing, China, 1992. [Google Scholar]
- Krivchenko, G.I. Transient Process of Power Installation of Hydropower Station; Water Conservancy Press: Beijing, China, 1981. [Google Scholar]
- Gryanko, L.P. Reversible Hydraulic Machinery; Water Resources and Electric Power Press: Beijing, China, 1987. [Google Scholar]
- Martin, C.S.; Horlacher, H. Conversion of pump-turbine characteristics at zero flow, locked rotor position and runaway condition. In Proceedings of the 15th IAHR Symposium, Belgrade, Yugoslavia, 11–14 September 1990. [Google Scholar]
- Martin, C.S. Evaluation of Pump-Turbine Characteristics for Transient Analysis. In Proceedings of the 13th IAHR Symposium on Press in Technology, Montreal, QC, Canada, 2–5 September 1986. [Google Scholar]
- Liu, J.Y. Study on the Variety of Characteristic Curve and Its Effect on Hydraulic Transient Process in Pumped Storage Plant. Master’s Thesis, Wuhan University, Wuhan, China, 2005. [Google Scholar]
- Zeng, W.; Yang, J.D.; Liu, Y.N. Non-linear statistical analyses on characteristic parameters of pump turbines. Large Electr. Mach. Hydraul. Turbine 2014, 2, 44–48. [Google Scholar]
- Liu, G.L.; Jiang, J.; Fu, X.Q. Predicting complete characteristics of pumps by using BP neural network. J. Wuhan Univ. Hydraul. Electr. Eng. 2000, 2, 37–39. [Google Scholar]
- Zhu, M.L.; Zhang, X.H.; Zhang, Y.H.; Wang, T. Study on prediction model of complete characteristic curves of centrifugal pumps. J. Northwest A F Univ. (Nat. Sci. Ed.) 2006, 4, 143–146. [Google Scholar]
- Hu, X.Y.; Yu, B.; Guo, J.; Wang, S.K. Visualization for predictable model of complete characteristic curve of pump. Fluid Mach. 2012, 3, 37–39. [Google Scholar]
- Ji, X.Y.; Lai, X. Numerical simulation of the S-shaped characteristics of the pump-turbine. J. Hydrodyn. 2011, 26, 318–326. [Google Scholar]
- Ji, X.Y. Research on the ‘S’ Characteristics of Prediction Methods of the Pump turbine. Ph.D. Thesis, Wuhan University, Wuhan, China, 2013. [Google Scholar]
- Cavazzini, G.; Covi, A.; Pavesi, G.; Ardizzon, G. Analysis of the unstable behavior of a pump-turbine in turbine mode: Fluid-dynamical and spectral characterization of the S-shape characteristic. ASME J. Fluid Eng. 2015, 138, 21105. [Google Scholar] [CrossRef]
- Li, J.W.; Hu, Q.J.; Yu, J.X.; Li, Q.Z. Study on S-shaped characteristic of Francis reversible unit by on-site test and CFD simulation. Sci. China Technol. Sci. 2013, 56, 2163–2169. [Google Scholar] [CrossRef]
- Chang, J.S. Analysis of whole characteristic curve and their special condition points in mixed-flow pump-turbine. J. Beijing Agric. Eng. Univ. 1995, 4, 77–83. [Google Scholar]
- Chang, J.S. Transients of Hydraulic Machine Installations; Higher Education Press: Beijing, China, 2005. [Google Scholar]
- Nielsen, T.K.; Olimstad, G. Dynamic behaviour of reversible pump-turbines in turbine mode of operation. In Proceedings of the International Symposium on Transport Phenomena and Dynamics of Rotating Machine, Honolulu, HI, USA, 4–7 April 2010. Paper ID-No. 60. [Google Scholar]
- Zhu, Y.P.; Shi, X.Y.; Zhou, L.J. Study on complete characteristic curves based on internal characteristic. J. China Agric. Univ. 2006, 11, 88–91. [Google Scholar]
- Zeng, W.; Yang, J.D.; Chen, Y.G. Construction of pump-turbine characteristics at any specific speed by domain-partitioned transformation. ASME J. Fluid Eng. 2015, 137, 31103. [Google Scholar] [CrossRef]
- Zeng, W.; Yang, J.D.; Chen, Y.G.; Guo, W. Formulae for the intersecting curves of pump-turbine characteristic curves with coordinate planes in three-dimensional parameter space. Proc. Inst. Mech. Eng. Part A J. Power Energy 2015, 229, 324–336. [Google Scholar] [CrossRef]
- Hasmatuchi, V. Hydrodynamics of a Pump-Turbine Operating at Off-Design Conditions in Generating Mode. Ph.D. Thesis, École Polytechnique Fédérale de Lausanne (EPFL), Lausanne, Switzerland, 2012. [Google Scholar]
- Olimstad, G.; Nielsen, T.K.; Børresen, B. Dependency on runner geometry for reversible-pump turbine characteristics in turbine mode of operation. J. Fluids Eng. 2012, 134, 121102. [Google Scholar] [CrossRef]
- Olimstad, G. Characteristics of Reversible-Pump Turbines. Ph.D. Thesis, The Norwegian University of Science and Technology (NTNU), Trondheim, Norway, 2012. [Google Scholar]
- Nicolet, C. Hydroacoustic Modelling and Numerical Simulation of Unsteady Operation of Hydroelectric Systems. Ph.D. Thesis, École Polytechnique Fédérale de Lausanne (EPFL), Lausanne, Switzerland, 2007. [Google Scholar]
- International Electrotechnical Committee (IEC). Hydraulic Turbines, Storage Pumps and PumpTurbines–Model Acceptance Tests, 2nd ed.; International Standard IEC 60193; IEC: Geneva, Switzerland, 1999. [Google Scholar]
- Jain, S.V.; Swarnkar, A.; Motwani, K.H.; Patel, R.N. Effects of impeller diameter and rotational speed on performance of pump running in turbine mode. Energy Convers. Manag. 2015, 89, 808–824. [Google Scholar] [CrossRef]
- Walseth, E.C.; Nielsen, T.K.; Svingen, B. Measuring the dynamic characteristics of a low specific speed pump-turbine model. Energies 2016, 9, 199. [Google Scholar] [CrossRef]
- Li, X.Q.; Chang, J.S.; Li, C.S.; Chen, P.; Tang, X.L. Hydraulic transient controlling rules coupled with ball-valve and guide-vane in pumped storage power station. J. Hydraul. Eng. 2014, 45, 220–226. [Google Scholar]
- Susan-Resiga, R.F.; Muntean, S.; Avellan, F.; Anton, I. Mathematical modelling of swirling flow in hydraulic turbines for the full operating range. Appl. Math. Model. 2011, 35, 4759–4773. [Google Scholar] [CrossRef]
- Ješe, U. Numerical Study of Pump-Turbine Instabilities: Pumping Mode Off-Design Conditions. Ph.D. Thesis, University Grenoble Alpes, Grenoble, France, 2015. [Google Scholar]
- Hasmatuchi, V.; Farhat, M.; Roth, S.; Botero, F.; Avellan, F. Experimental evidence of rotating stall in a pump-turbine at off-design conditions in generating mode. ASME J. Fluid Eng. 2011, 133, 51104. [Google Scholar] [CrossRef]
- Xiao, Y.X.; Wang, Z.W.; Zhang, J.; Luo, Y. Numerical predictions of pressure pulses in a Francis pump turbine with misaligned guide vanes. J. Hydrodyn. Ser. B 2014, 26, 250–256. [Google Scholar] [CrossRef]
- Zhang, H.; Chen, D.Y.; Wu, C.Z.; Wang, X.; Lee, J.; Jung, K. Dynamic modeling and dynamical analysis of pump-turbines in S-shaped regions during runaway operation. Energy Convers. Manag. 2017, 138, 375–382. [Google Scholar] [CrossRef]
- Nicolet, C.; Avellan, F.; Allenbach, P.; Sapin, A. New tool for the simulation of transient phenomena in Francis turbine power plants. In Proceedings of the Hydraulic Machinery and Systems 21st IAHR Symposium, Lausanne, Switzerland, 9–12 September 2002. [Google Scholar]
- Nicolet, C.; Avellan, F.; Allenbach, P.; Alain, S. Simulation of transient phenomena in Francis turbine power plants: Hydroelectric interaction. In Proceedings of the Waterpower XIII, Advancing Technology for Sustainable Energy, Buffalo, NY, USA, 29–31 July 2003. [Google Scholar]
Figure 1.
The velocity triangles at the runner of a pump-turbine in turbine mode.
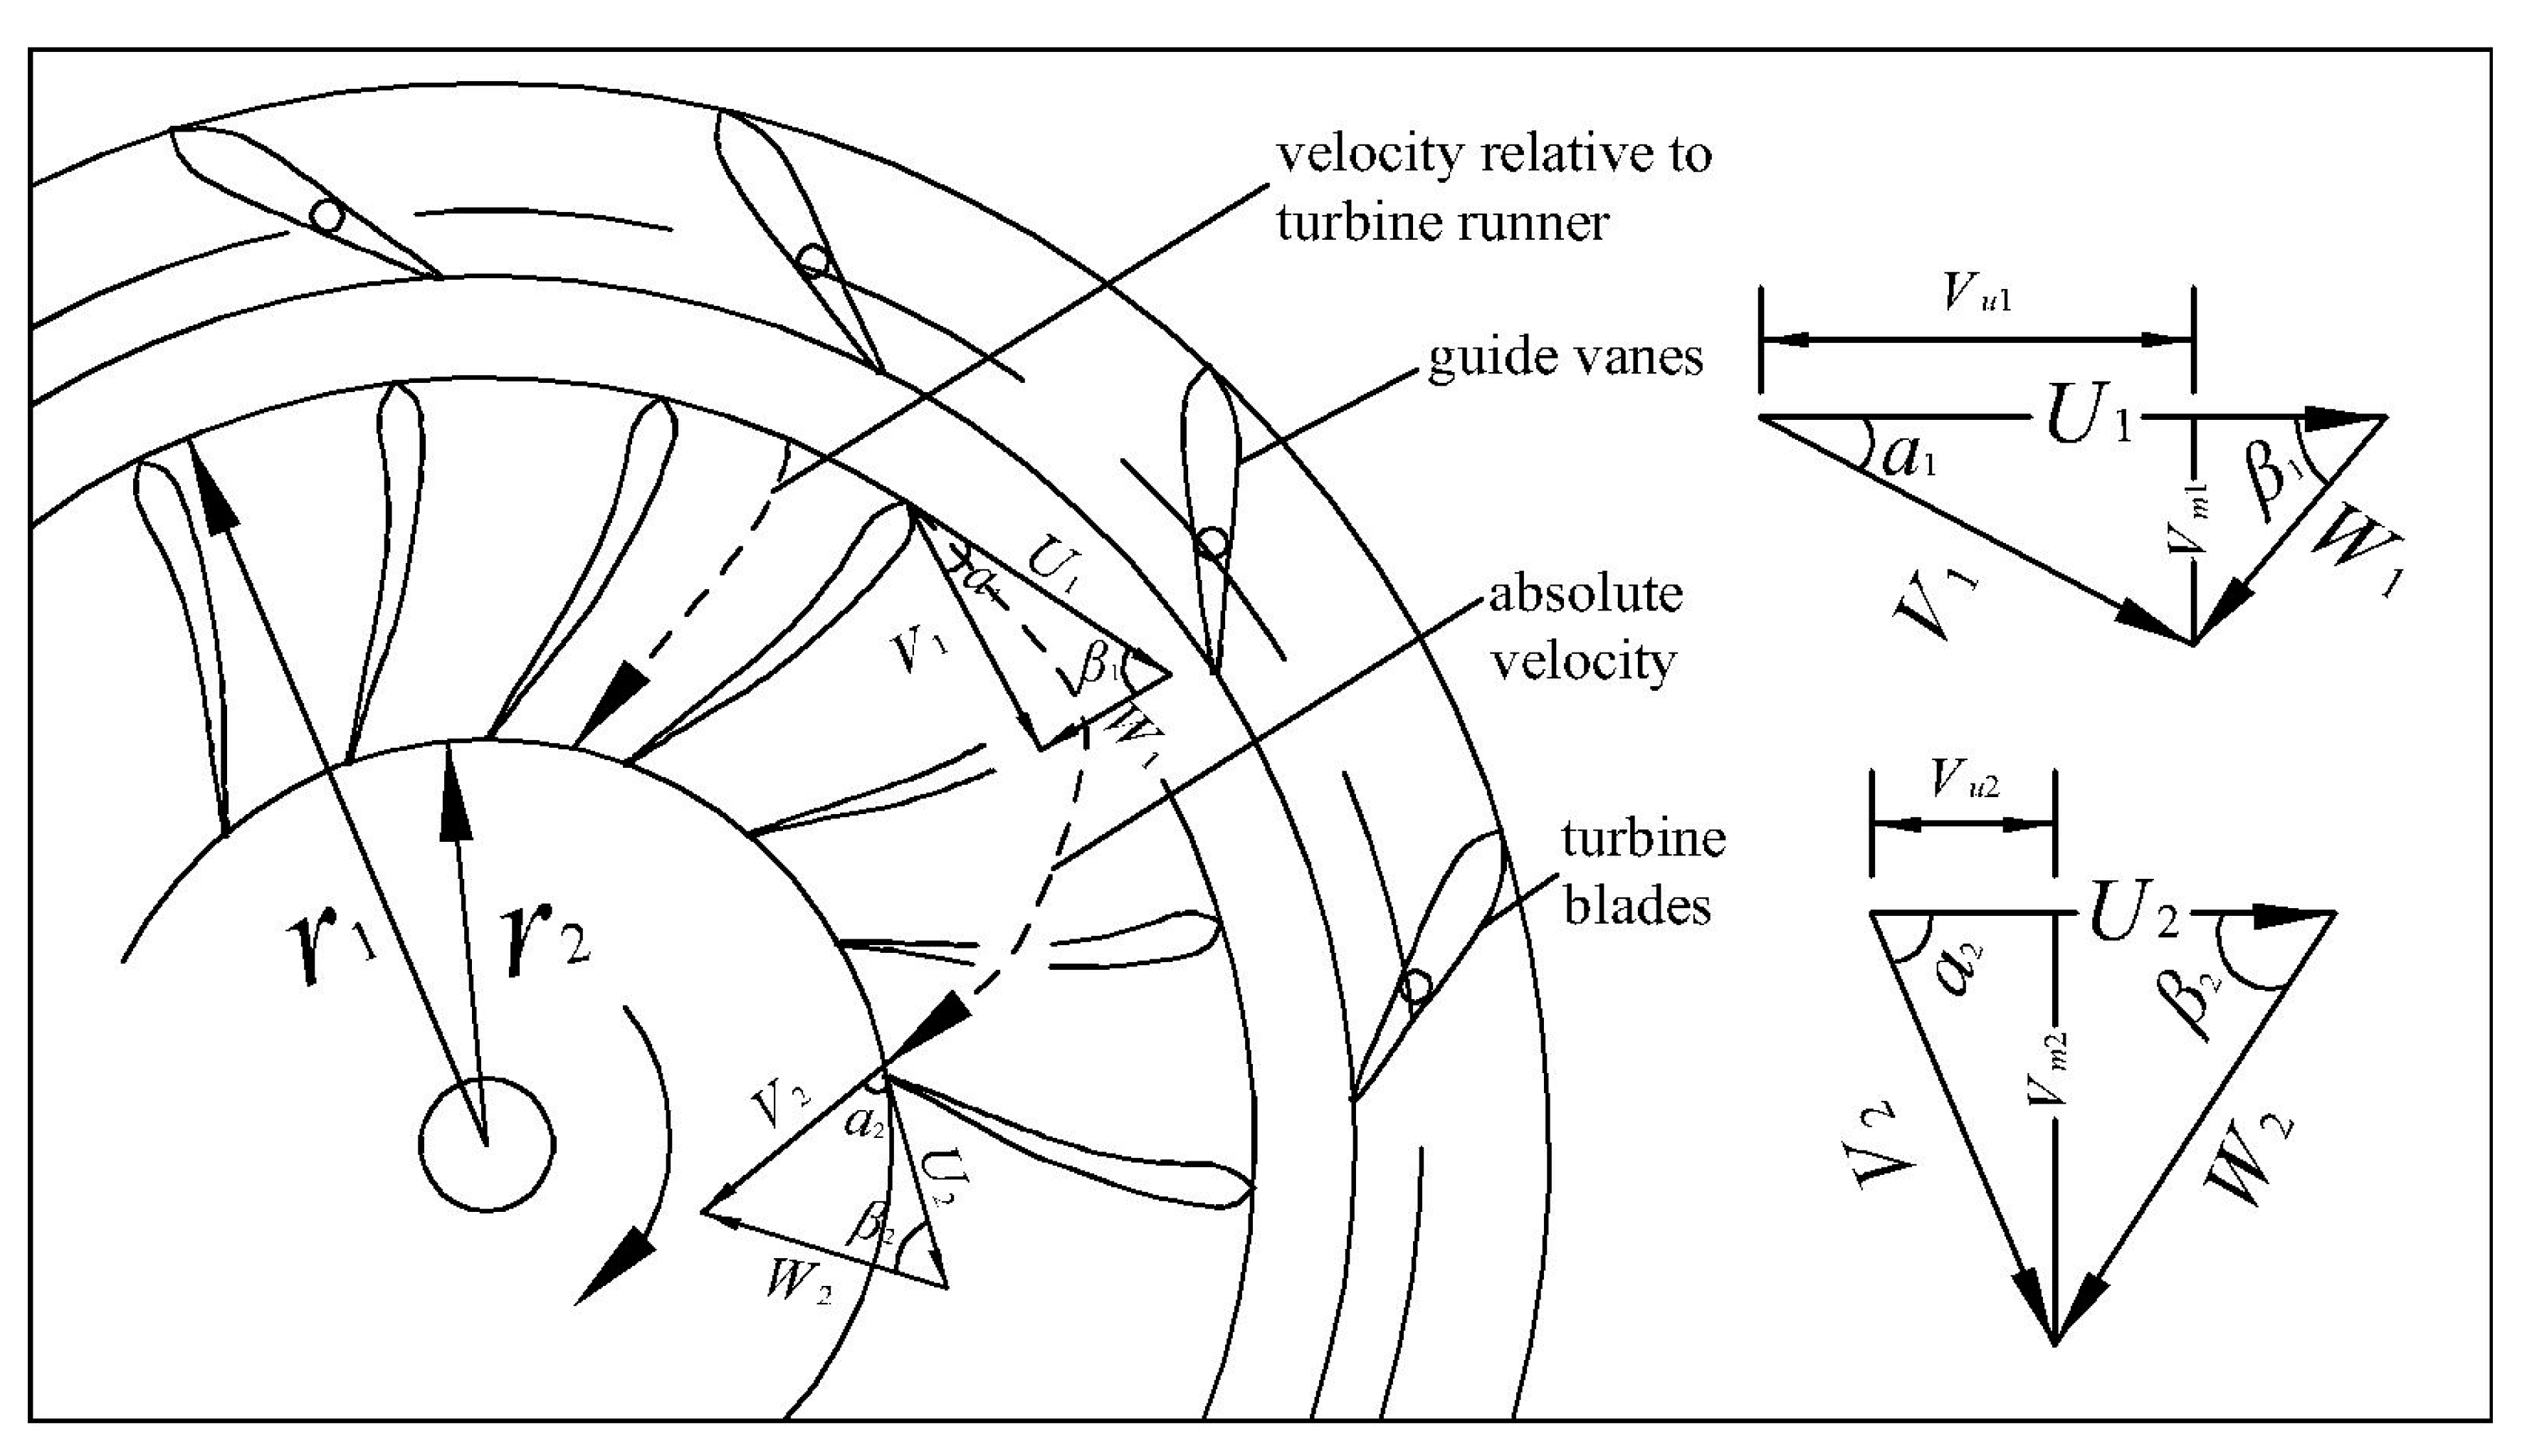
Figure 2.
The distribution of COPs on the generic four-quadrant characteristic curves [30,34]: (a) characteristics; (b) characteristics.
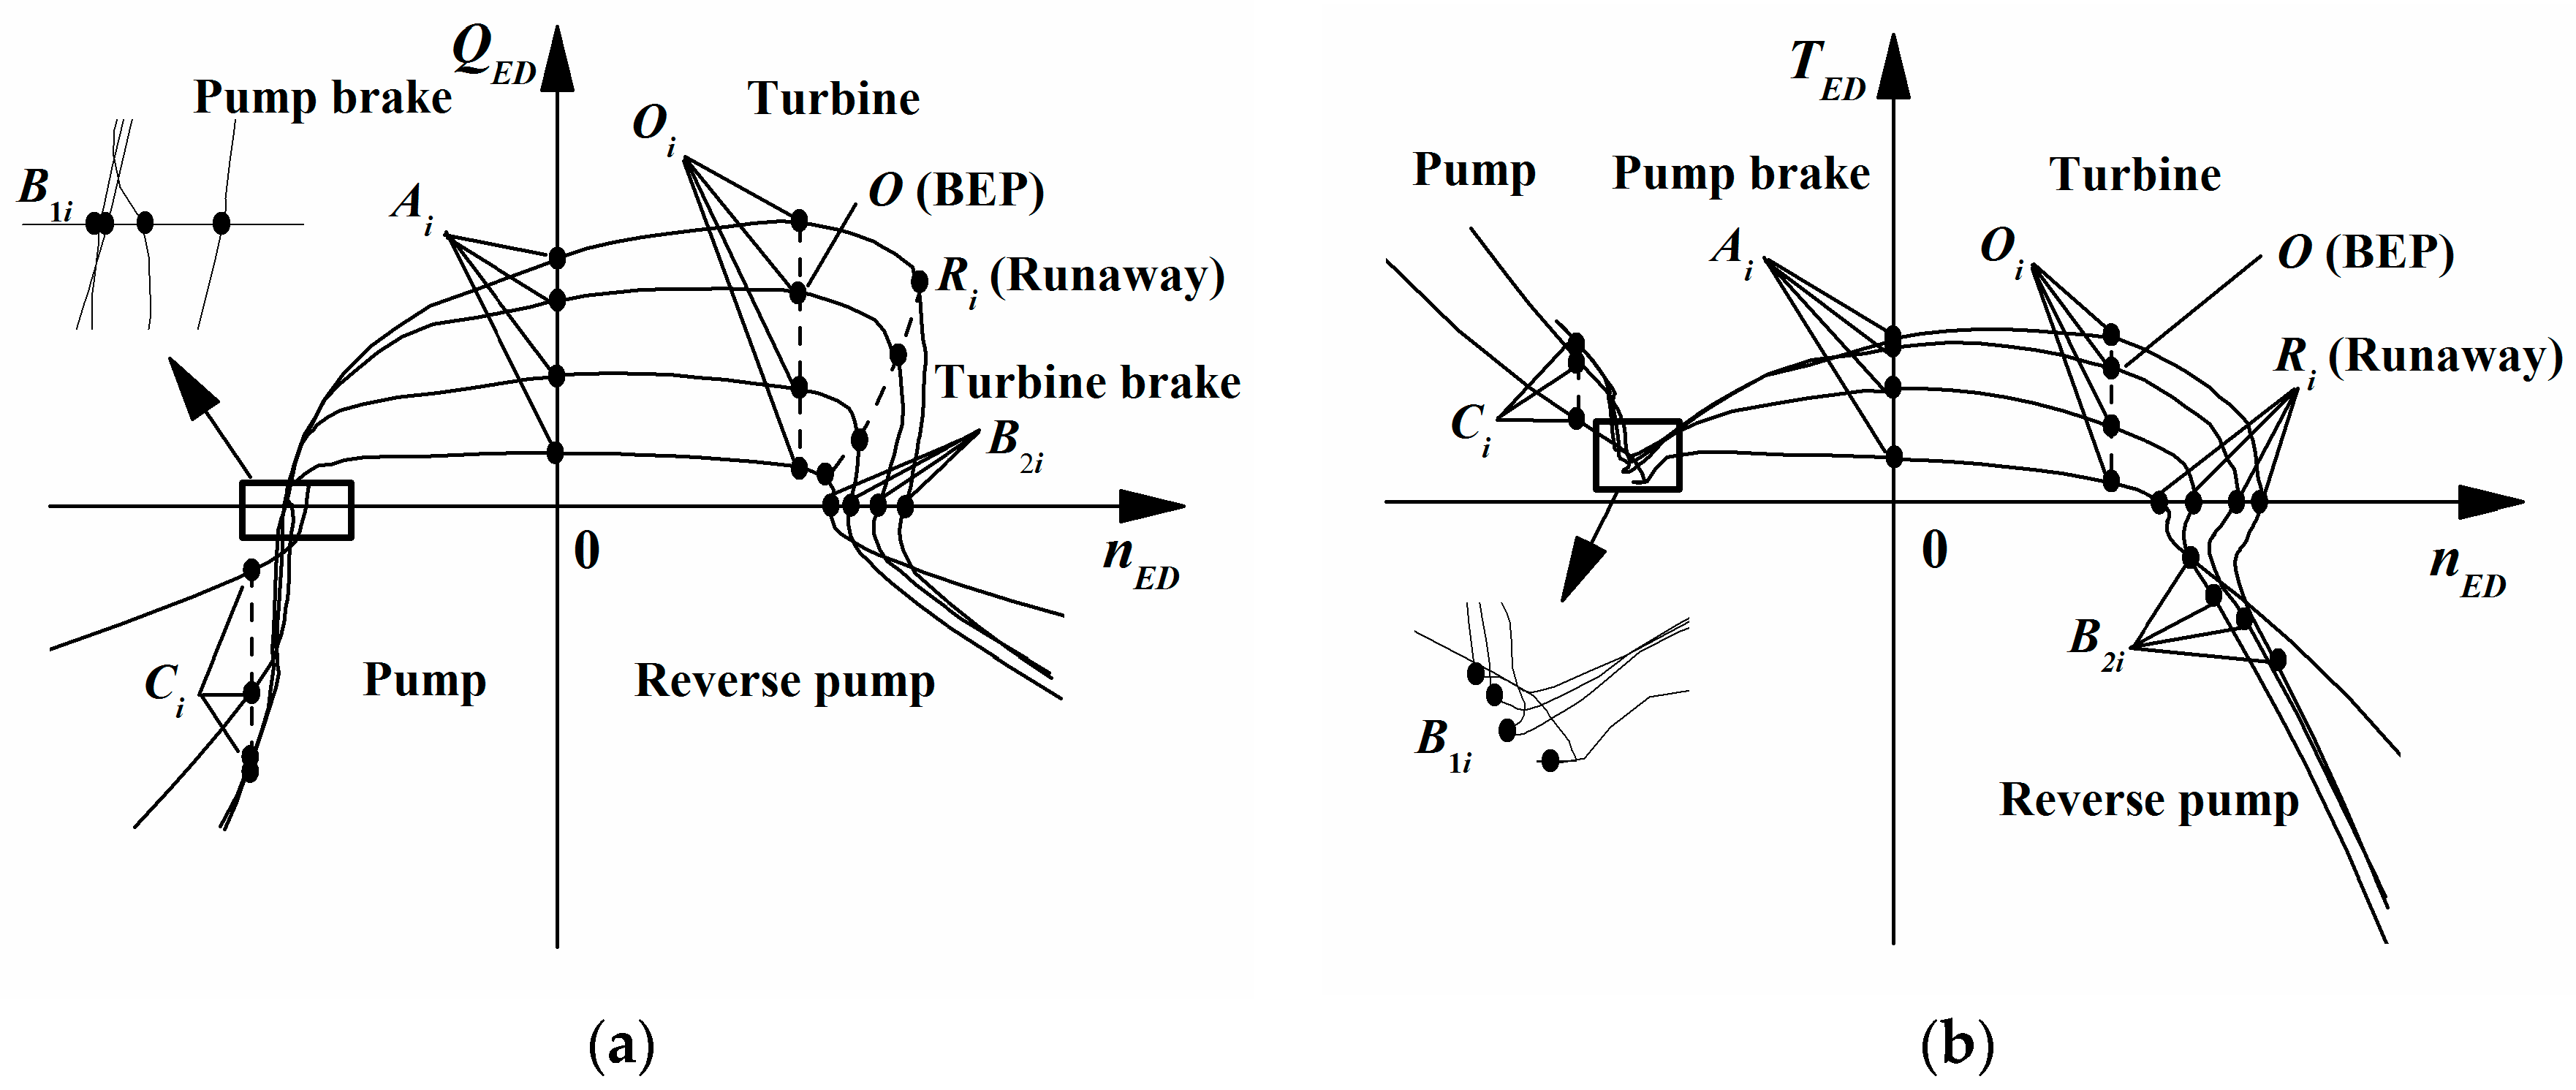
Figure 3.
The relationship between and the characteristic parameters of point O and point C: (a) ; (b) ; (c) ; (d) ; (e) ; (f) .
Figure 3.
The relationship between and the characteristic parameters of point O and point C: (a) ; (b) ; (c) ; (d) ; (e) ; (f) .

Figure 4.
The relationship between and the relative characteristic parameters of Oi and Ci: (a) ; (b); (c) ; (d) .
Figure 4.
The relationship between and the relative characteristic parameters of Oi and Ci: (a) ; (b); (c) ; (d) .
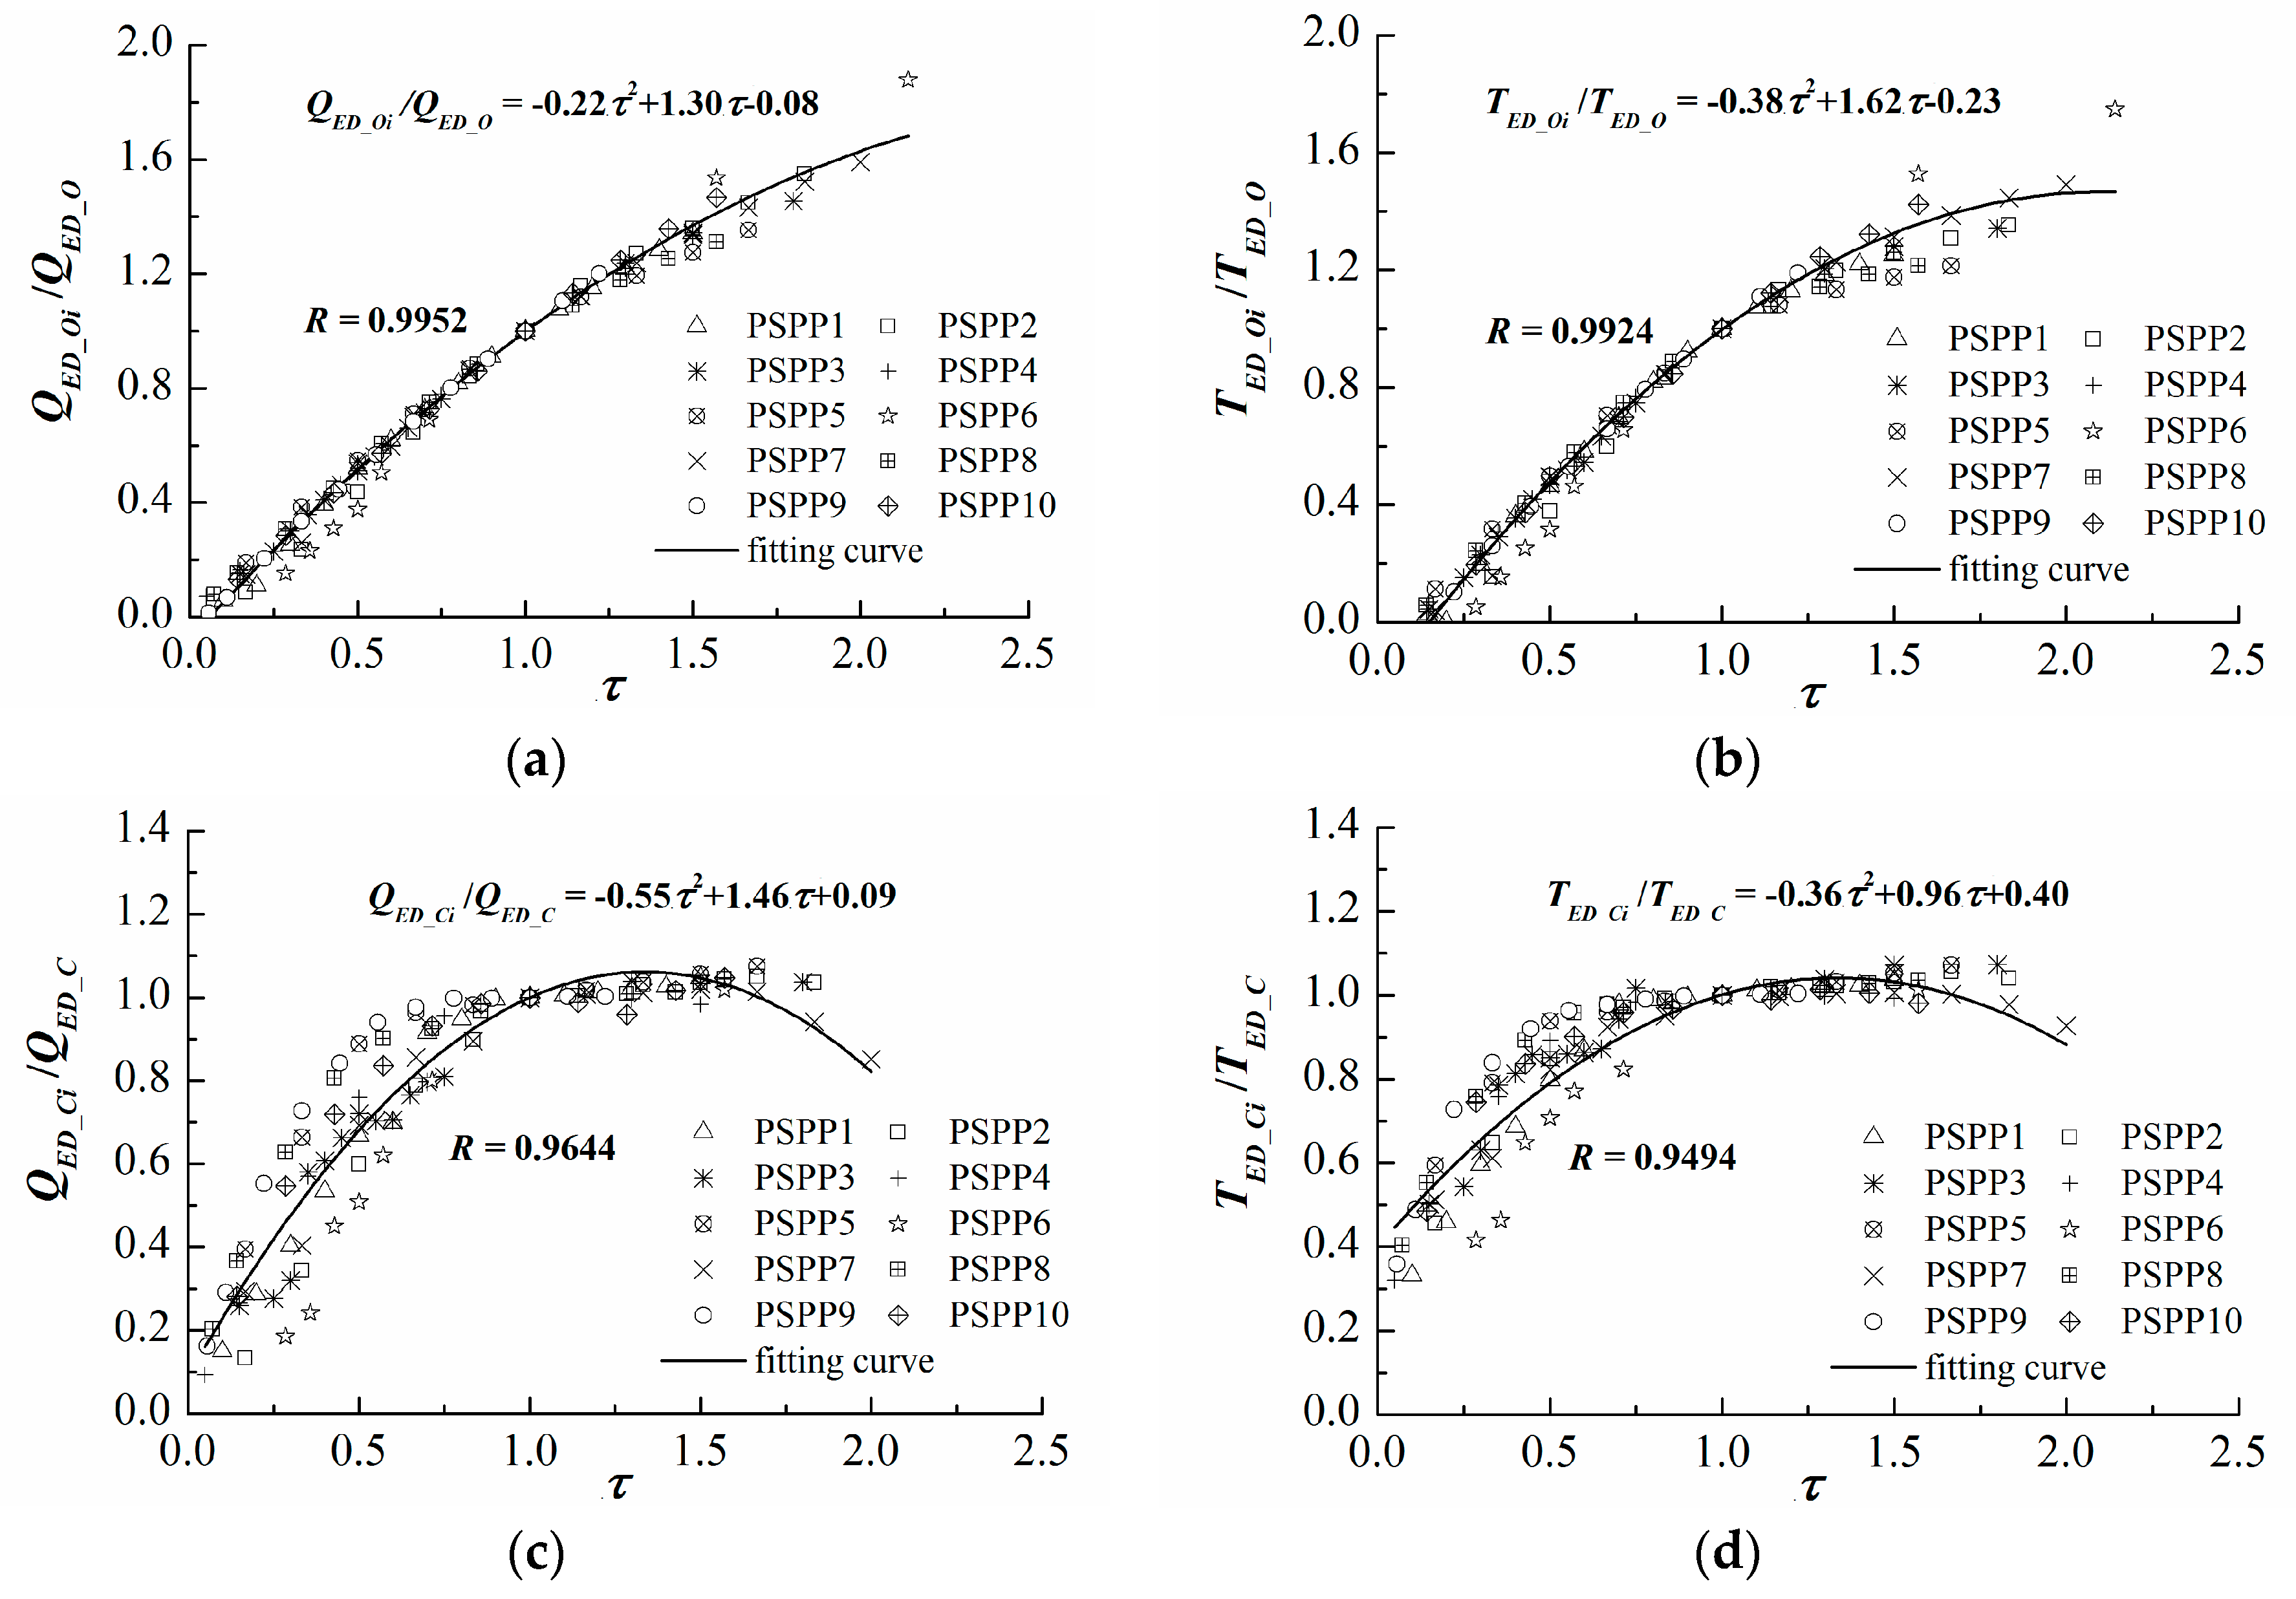
Figure 5.
The relationship between and the characteristic parameters of point A and point R: (a) ; (b) ; (c) ; (d) .
Figure 5.
The relationship between and the characteristic parameters of point A and point R: (a) ; (b) ; (c) ; (d) .
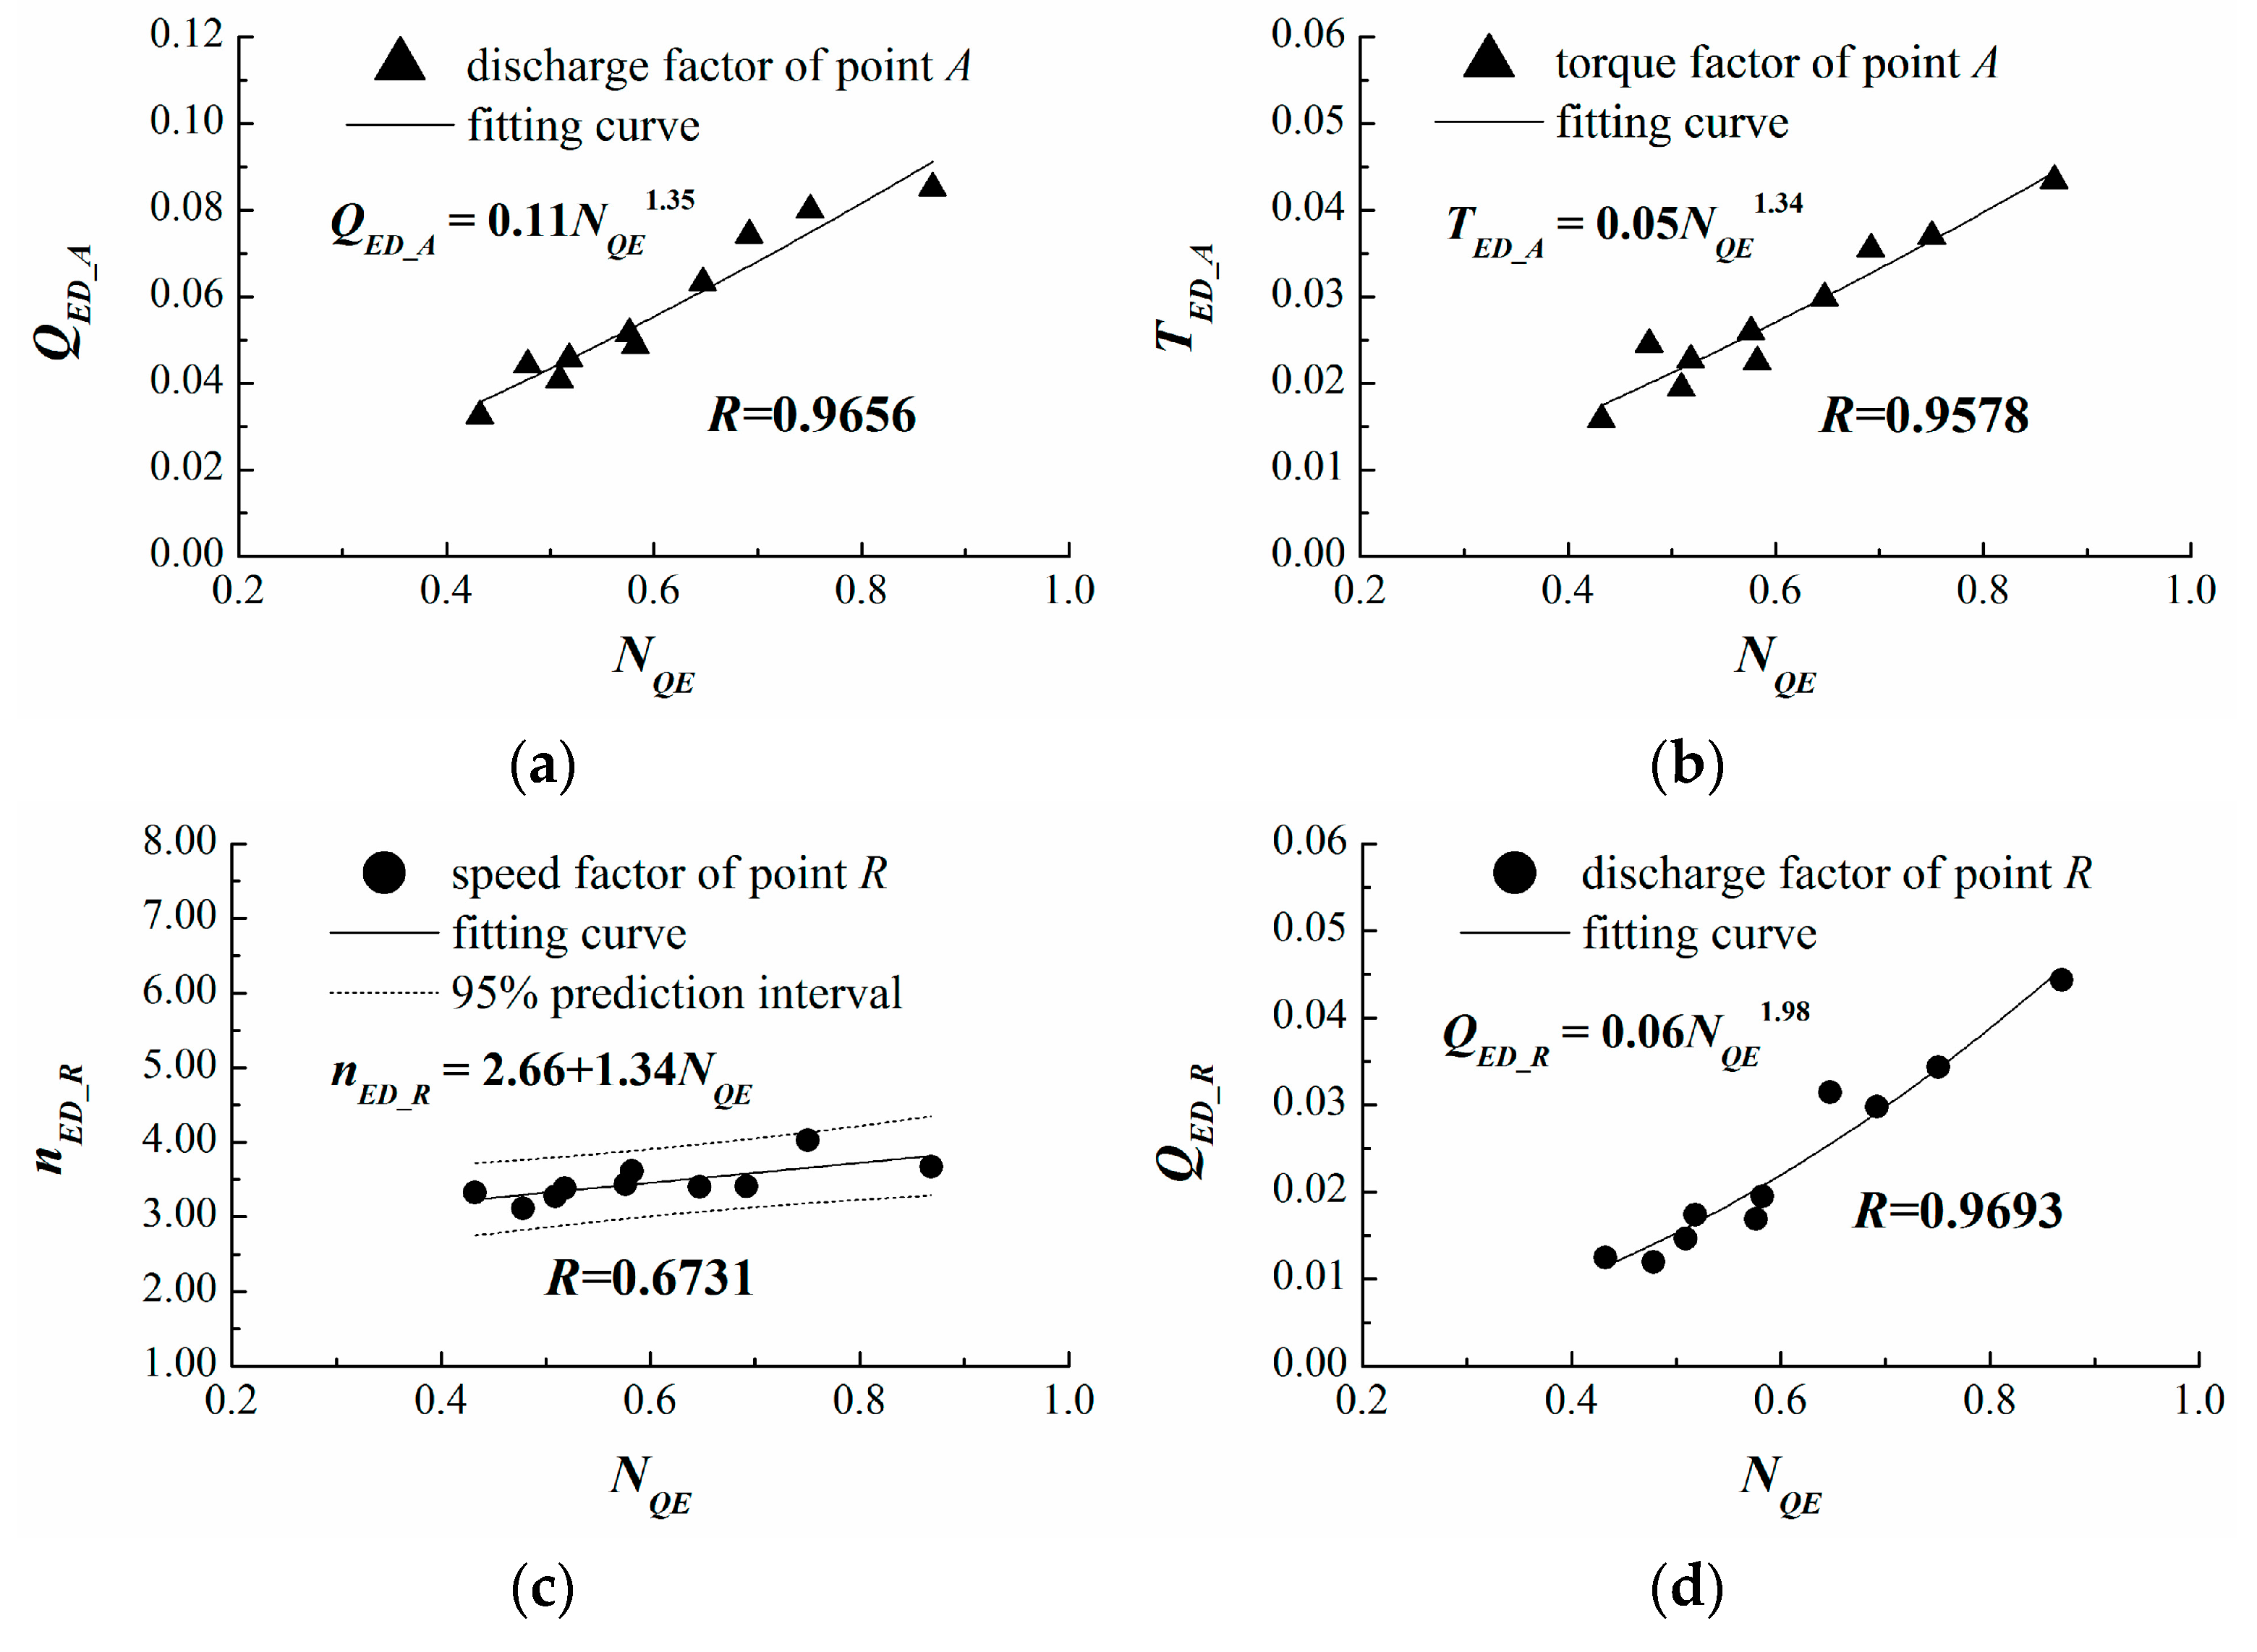
Figure 6.
The relationship between and the relative characteristic parameters of Ai and Ri. (a) ; (b) ; (c) ; (d) .
Figure 6.
The relationship between and the relative characteristic parameters of Ai and Ri. (a) ; (b) ; (c) ; (d) .
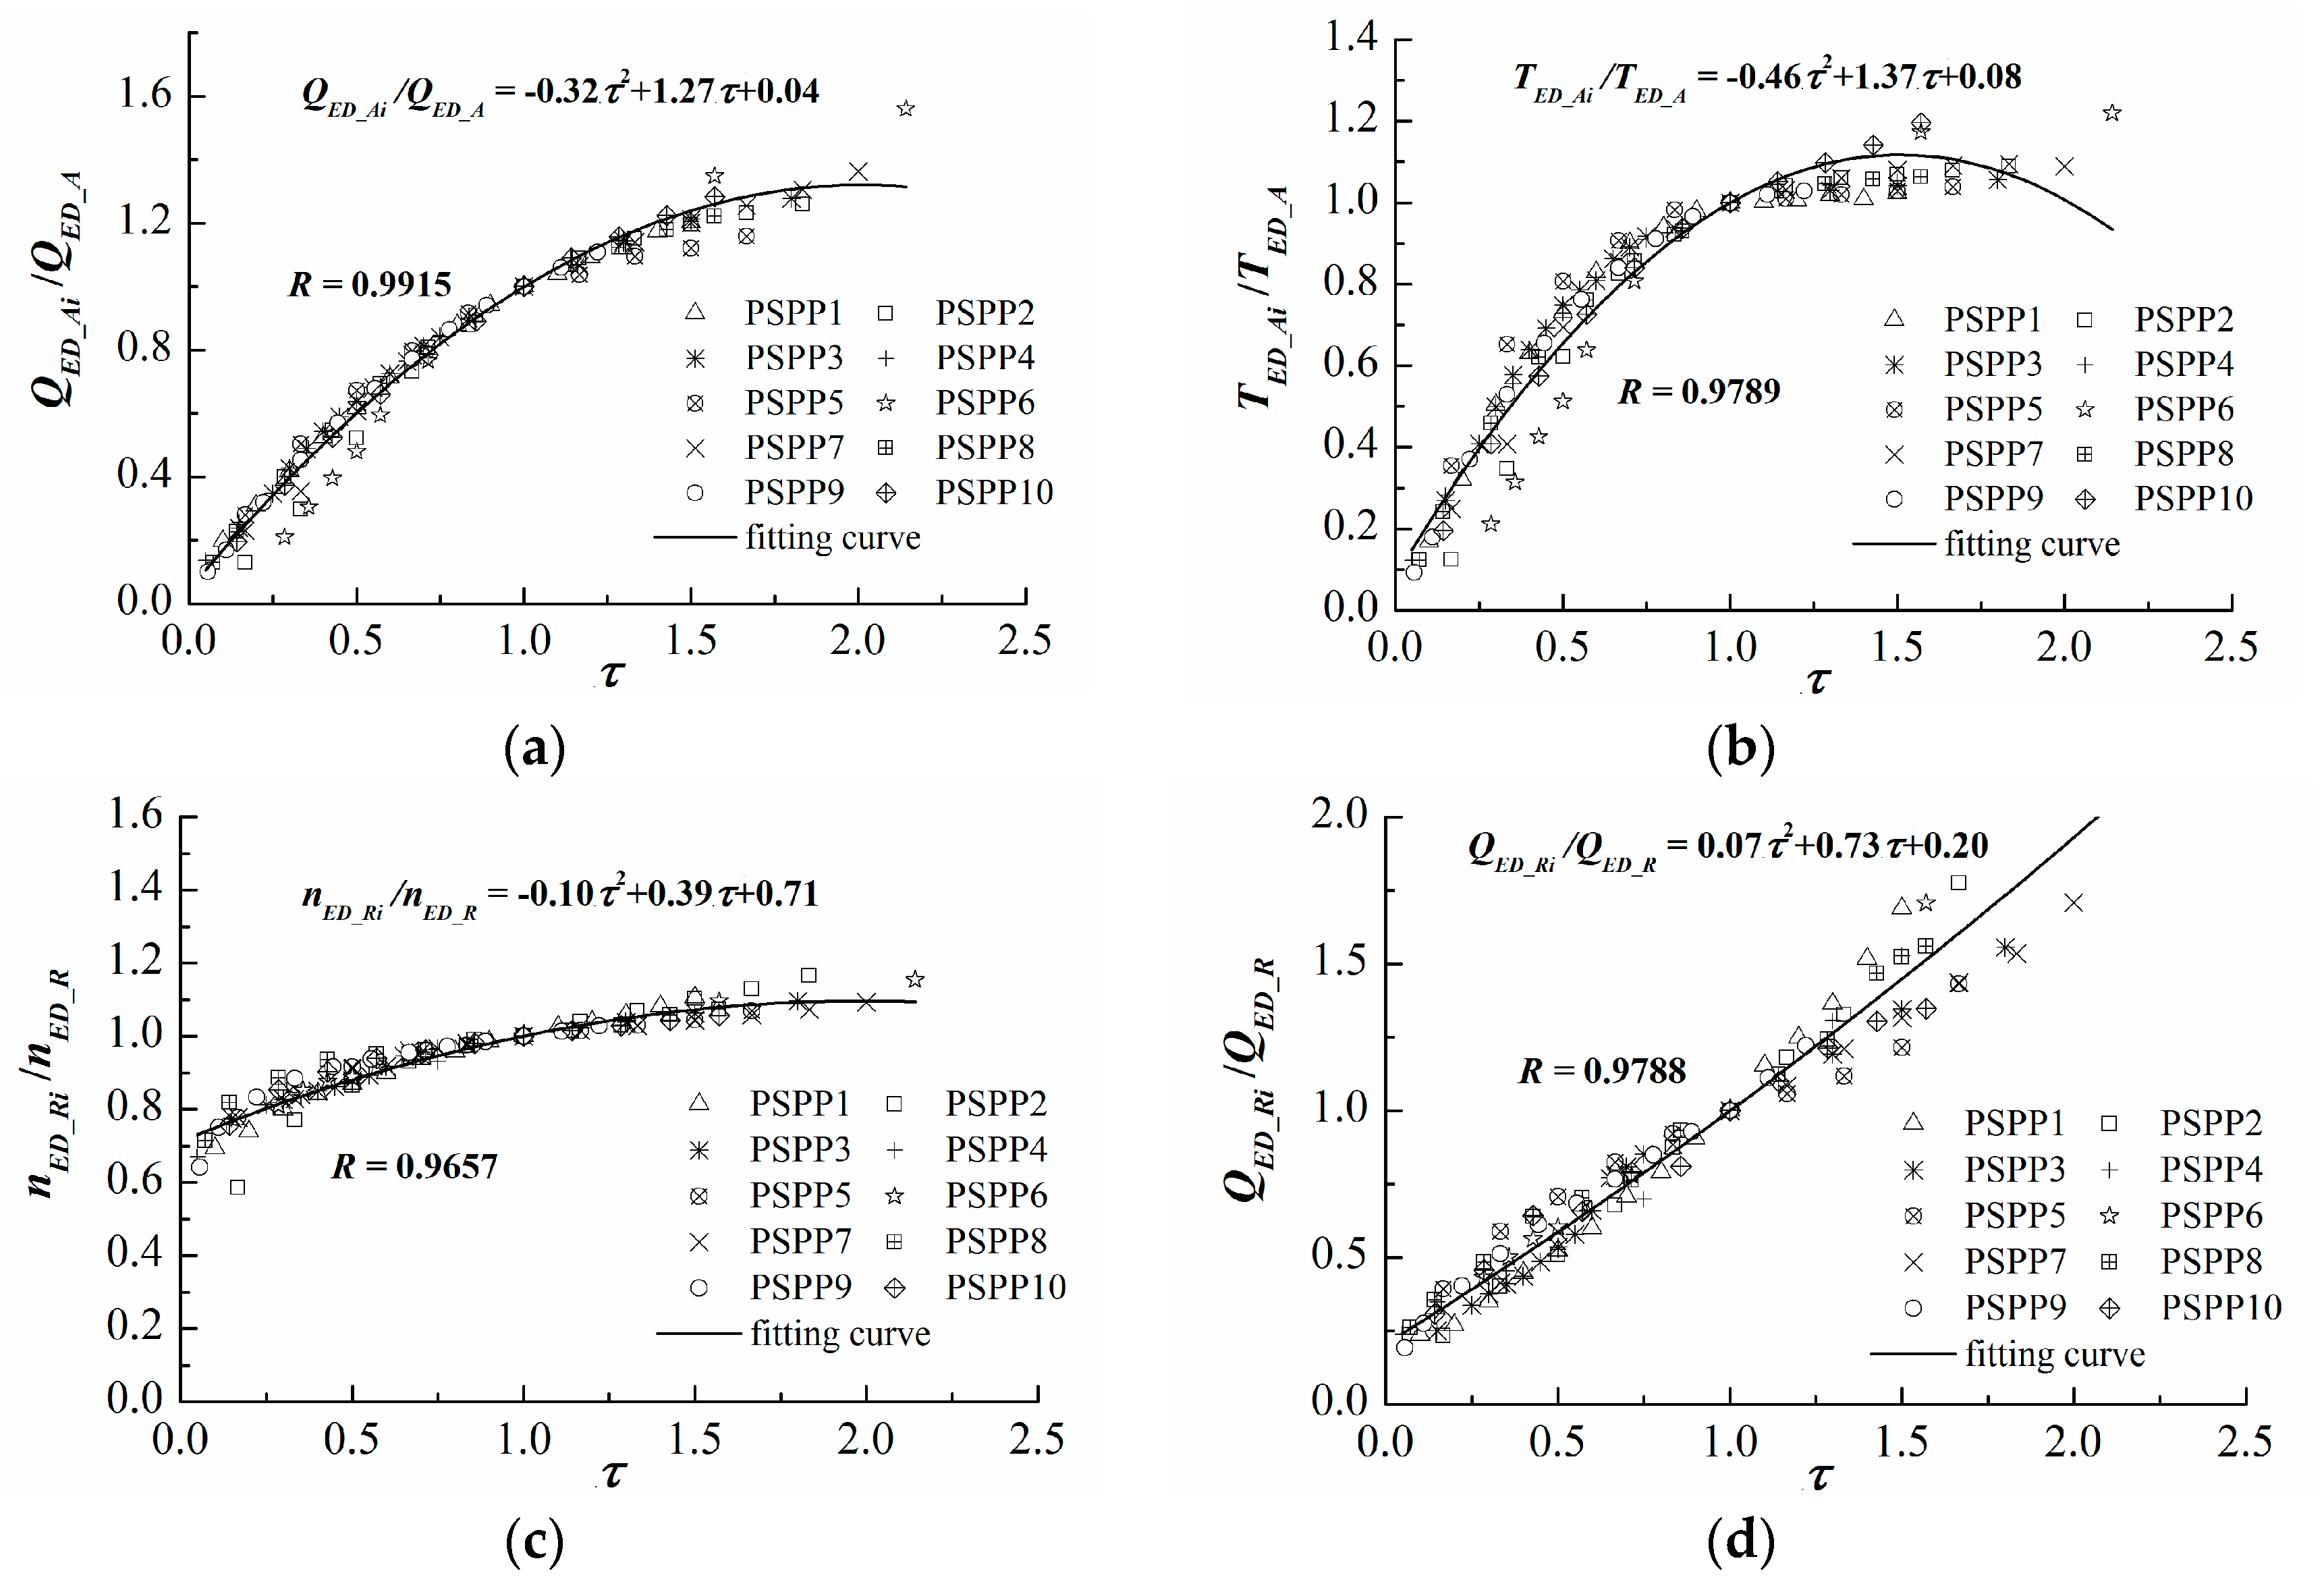
Figure 7.
The relationship between and the characteristic parameters of point B1 and point B2: (a) ; (b) ; (c) ; (d) .
Figure 7.
The relationship between and the characteristic parameters of point B1 and point B2: (a) ; (b) ; (c) ; (d) .
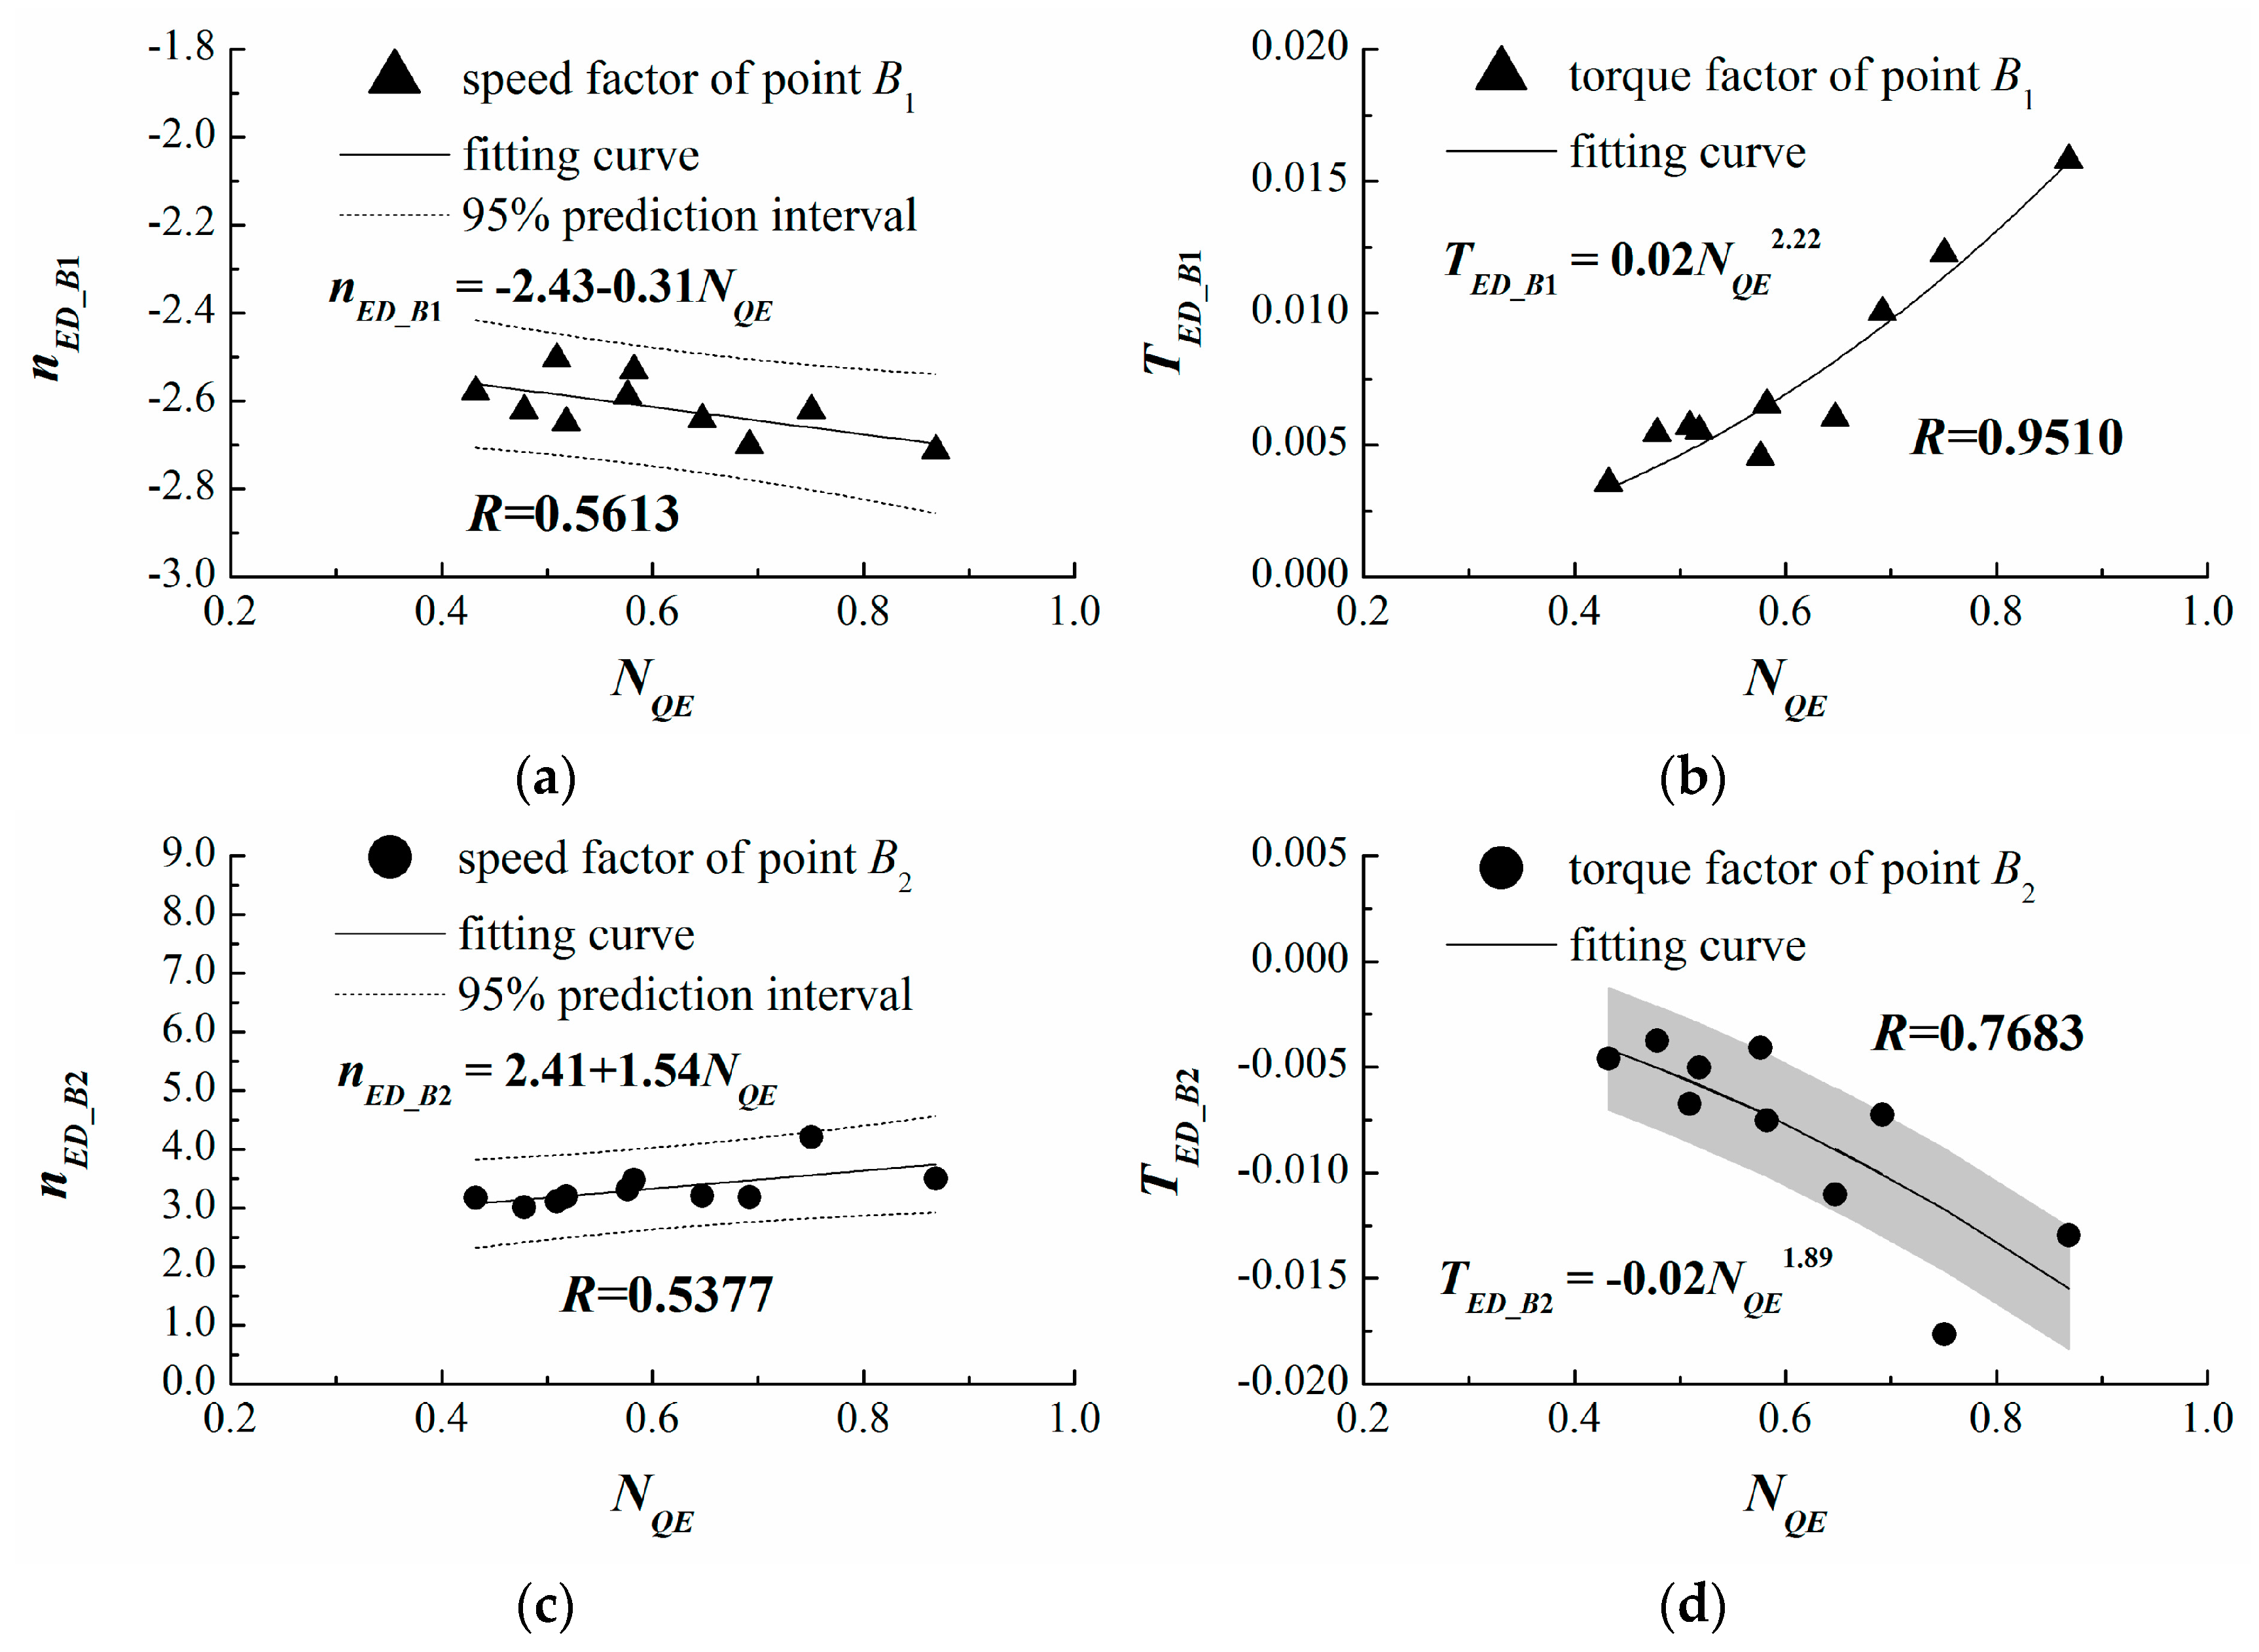
Figure 8.
The relationship between and the relative characteristic parameters of B1i and B2i. (a) ; (b) ; (c) ; (d) .
Figure 8.
The relationship between and the relative characteristic parameters of B1i and B2i. (a) ; (b) ; (c) ; (d) .
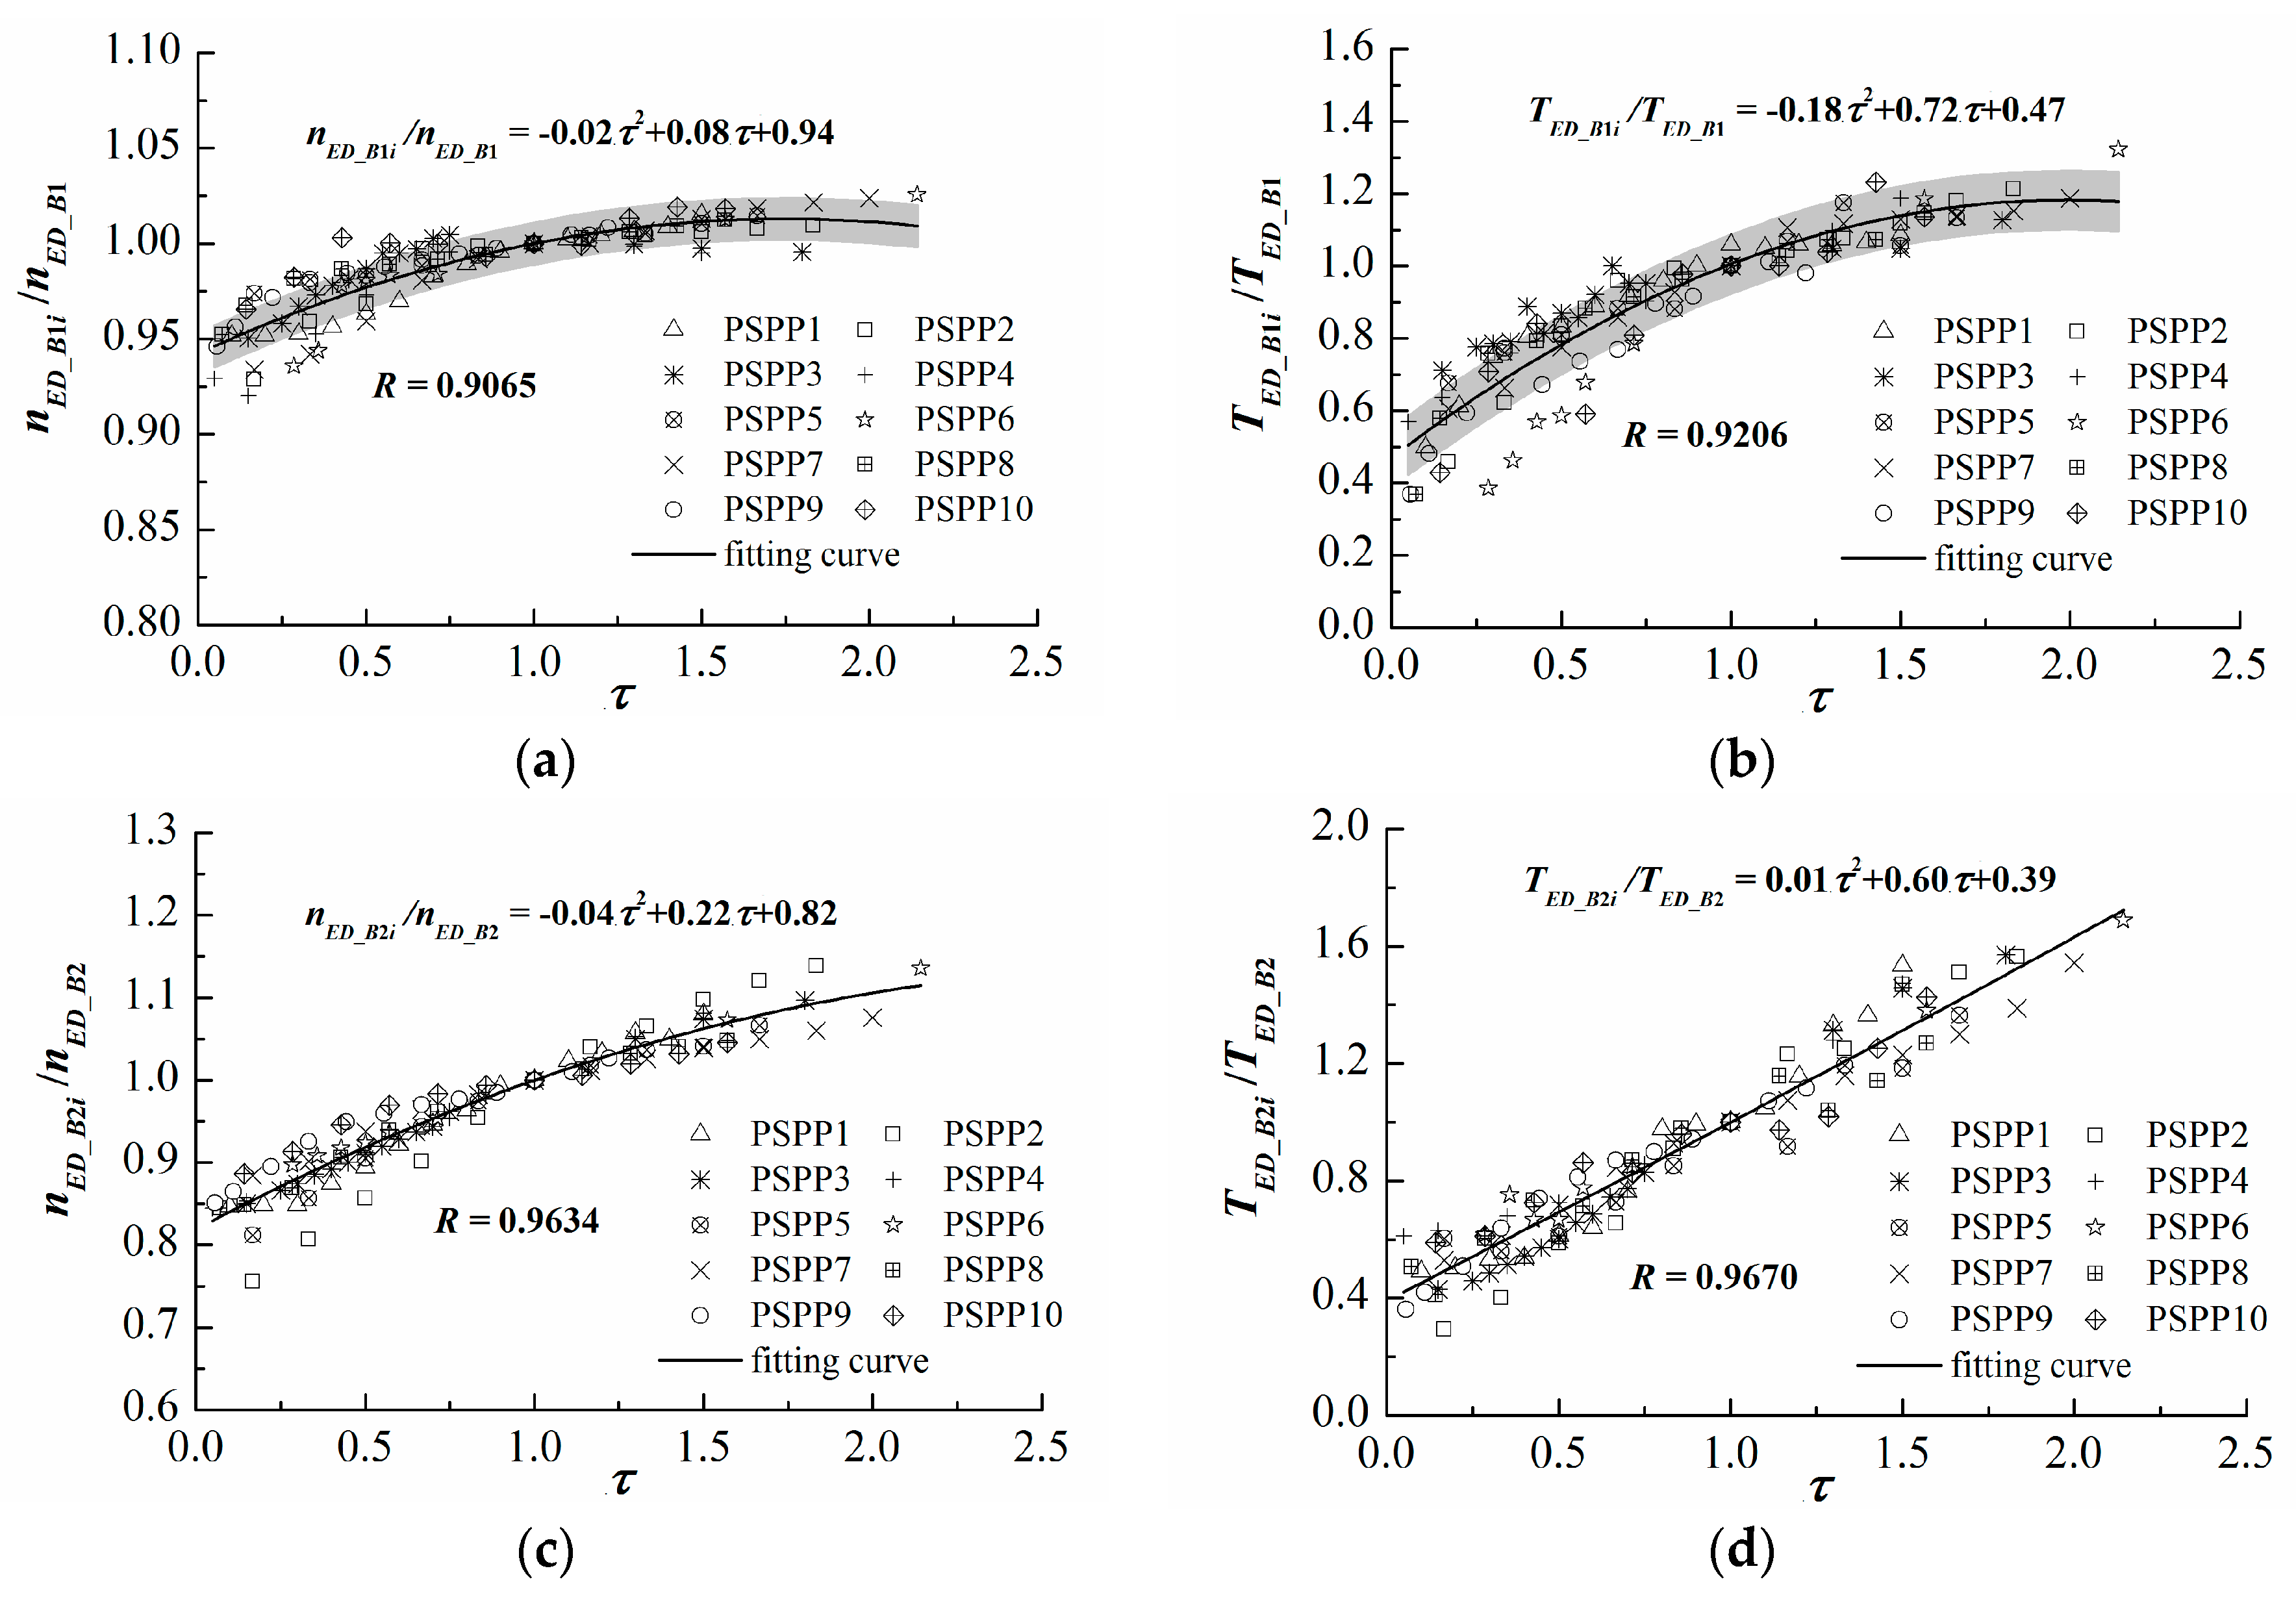
Figure 9.
Comparisons of the predicted and measured OOC. (a) of OOC of the Xianju pump-turbine; (b) of OOC of the Xianju pump-turbine; (c) of OOC of the Xilongchi pump-turbine; (d) of OOC of the Xilongchi pump-turbine.
Figure 9.
Comparisons of the predicted and measured OOC. (a) of OOC of the Xianju pump-turbine; (b) of OOC of the Xianju pump-turbine; (c) of OOC of the Xilongchi pump-turbine; (d) of OOC of the Xilongchi pump-turbine.
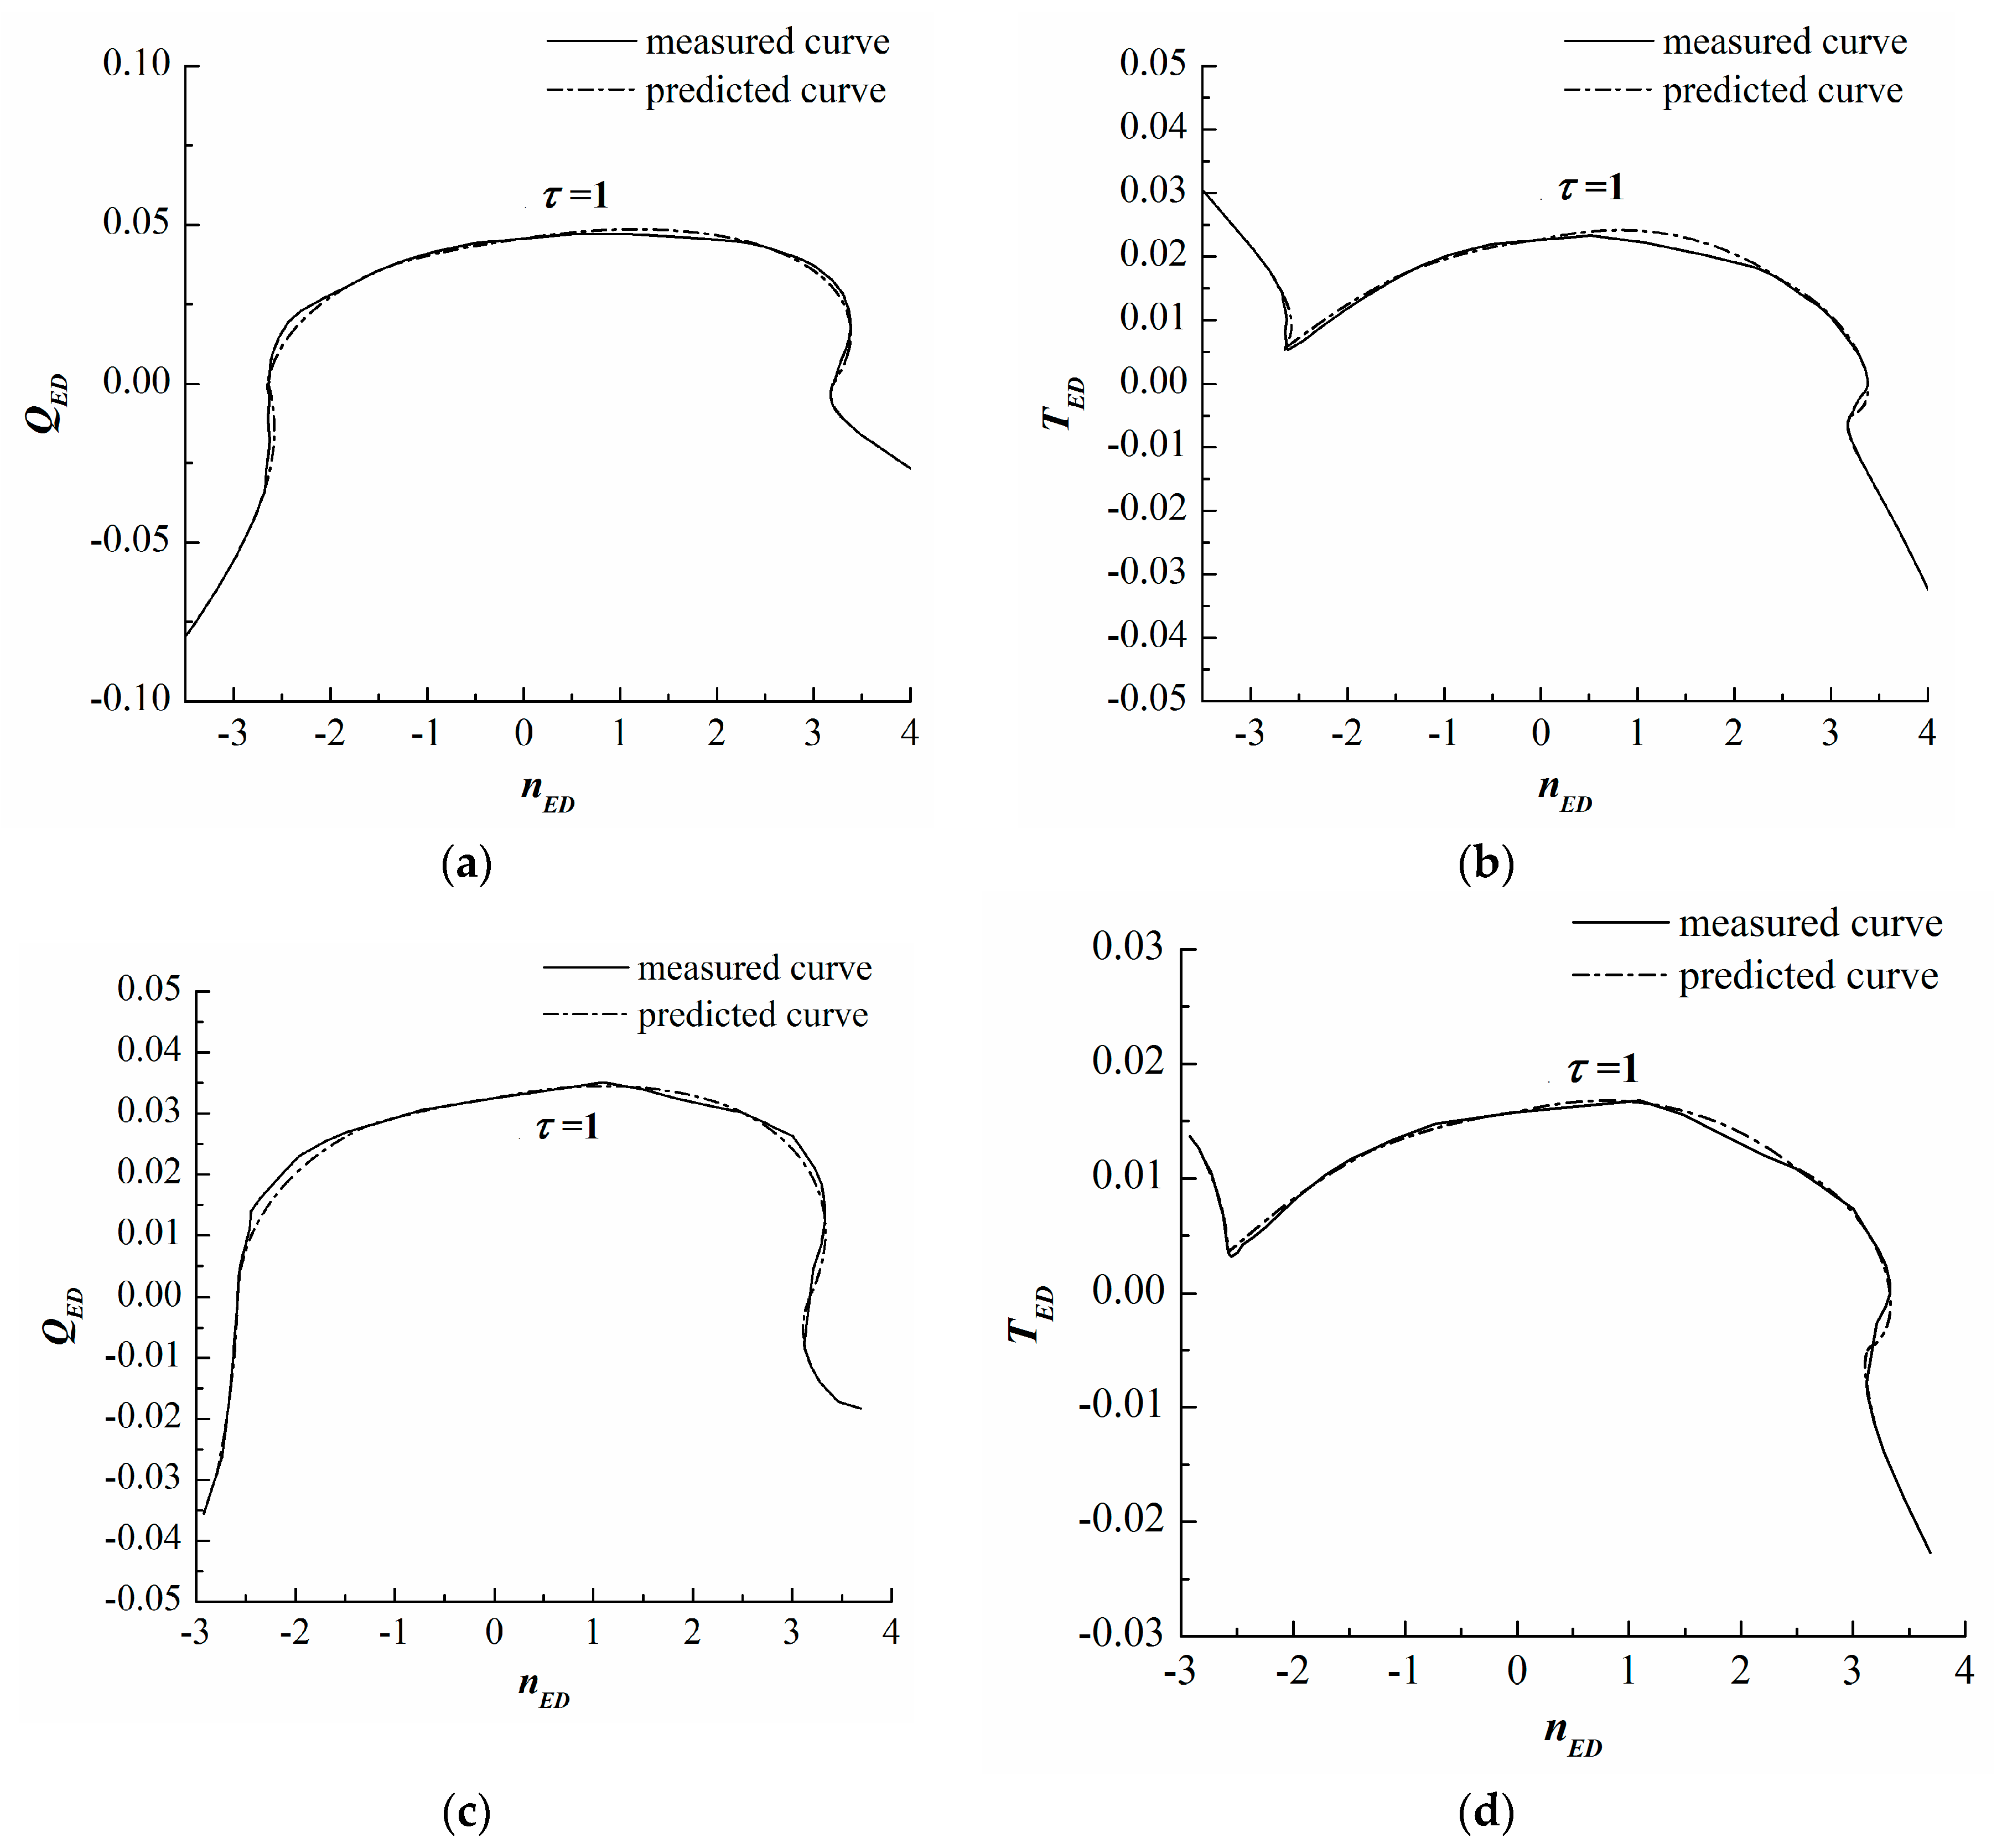
Figure 10.
Comparisons of the predicted and measured complete characteristic curves. (a) of the Xianju pump-turbine; (b) of the Xianju pump-turbine; (c) of the Xilongchi pump-turbine; (d) of the Xilongchi pump-turbine.
Figure 10.
Comparisons of the predicted and measured complete characteristic curves. (a) of the Xianju pump-turbine; (b) of the Xianju pump-turbine; (c) of the Xilongchi pump-turbine; (d) of the Xilongchi pump-turbine.
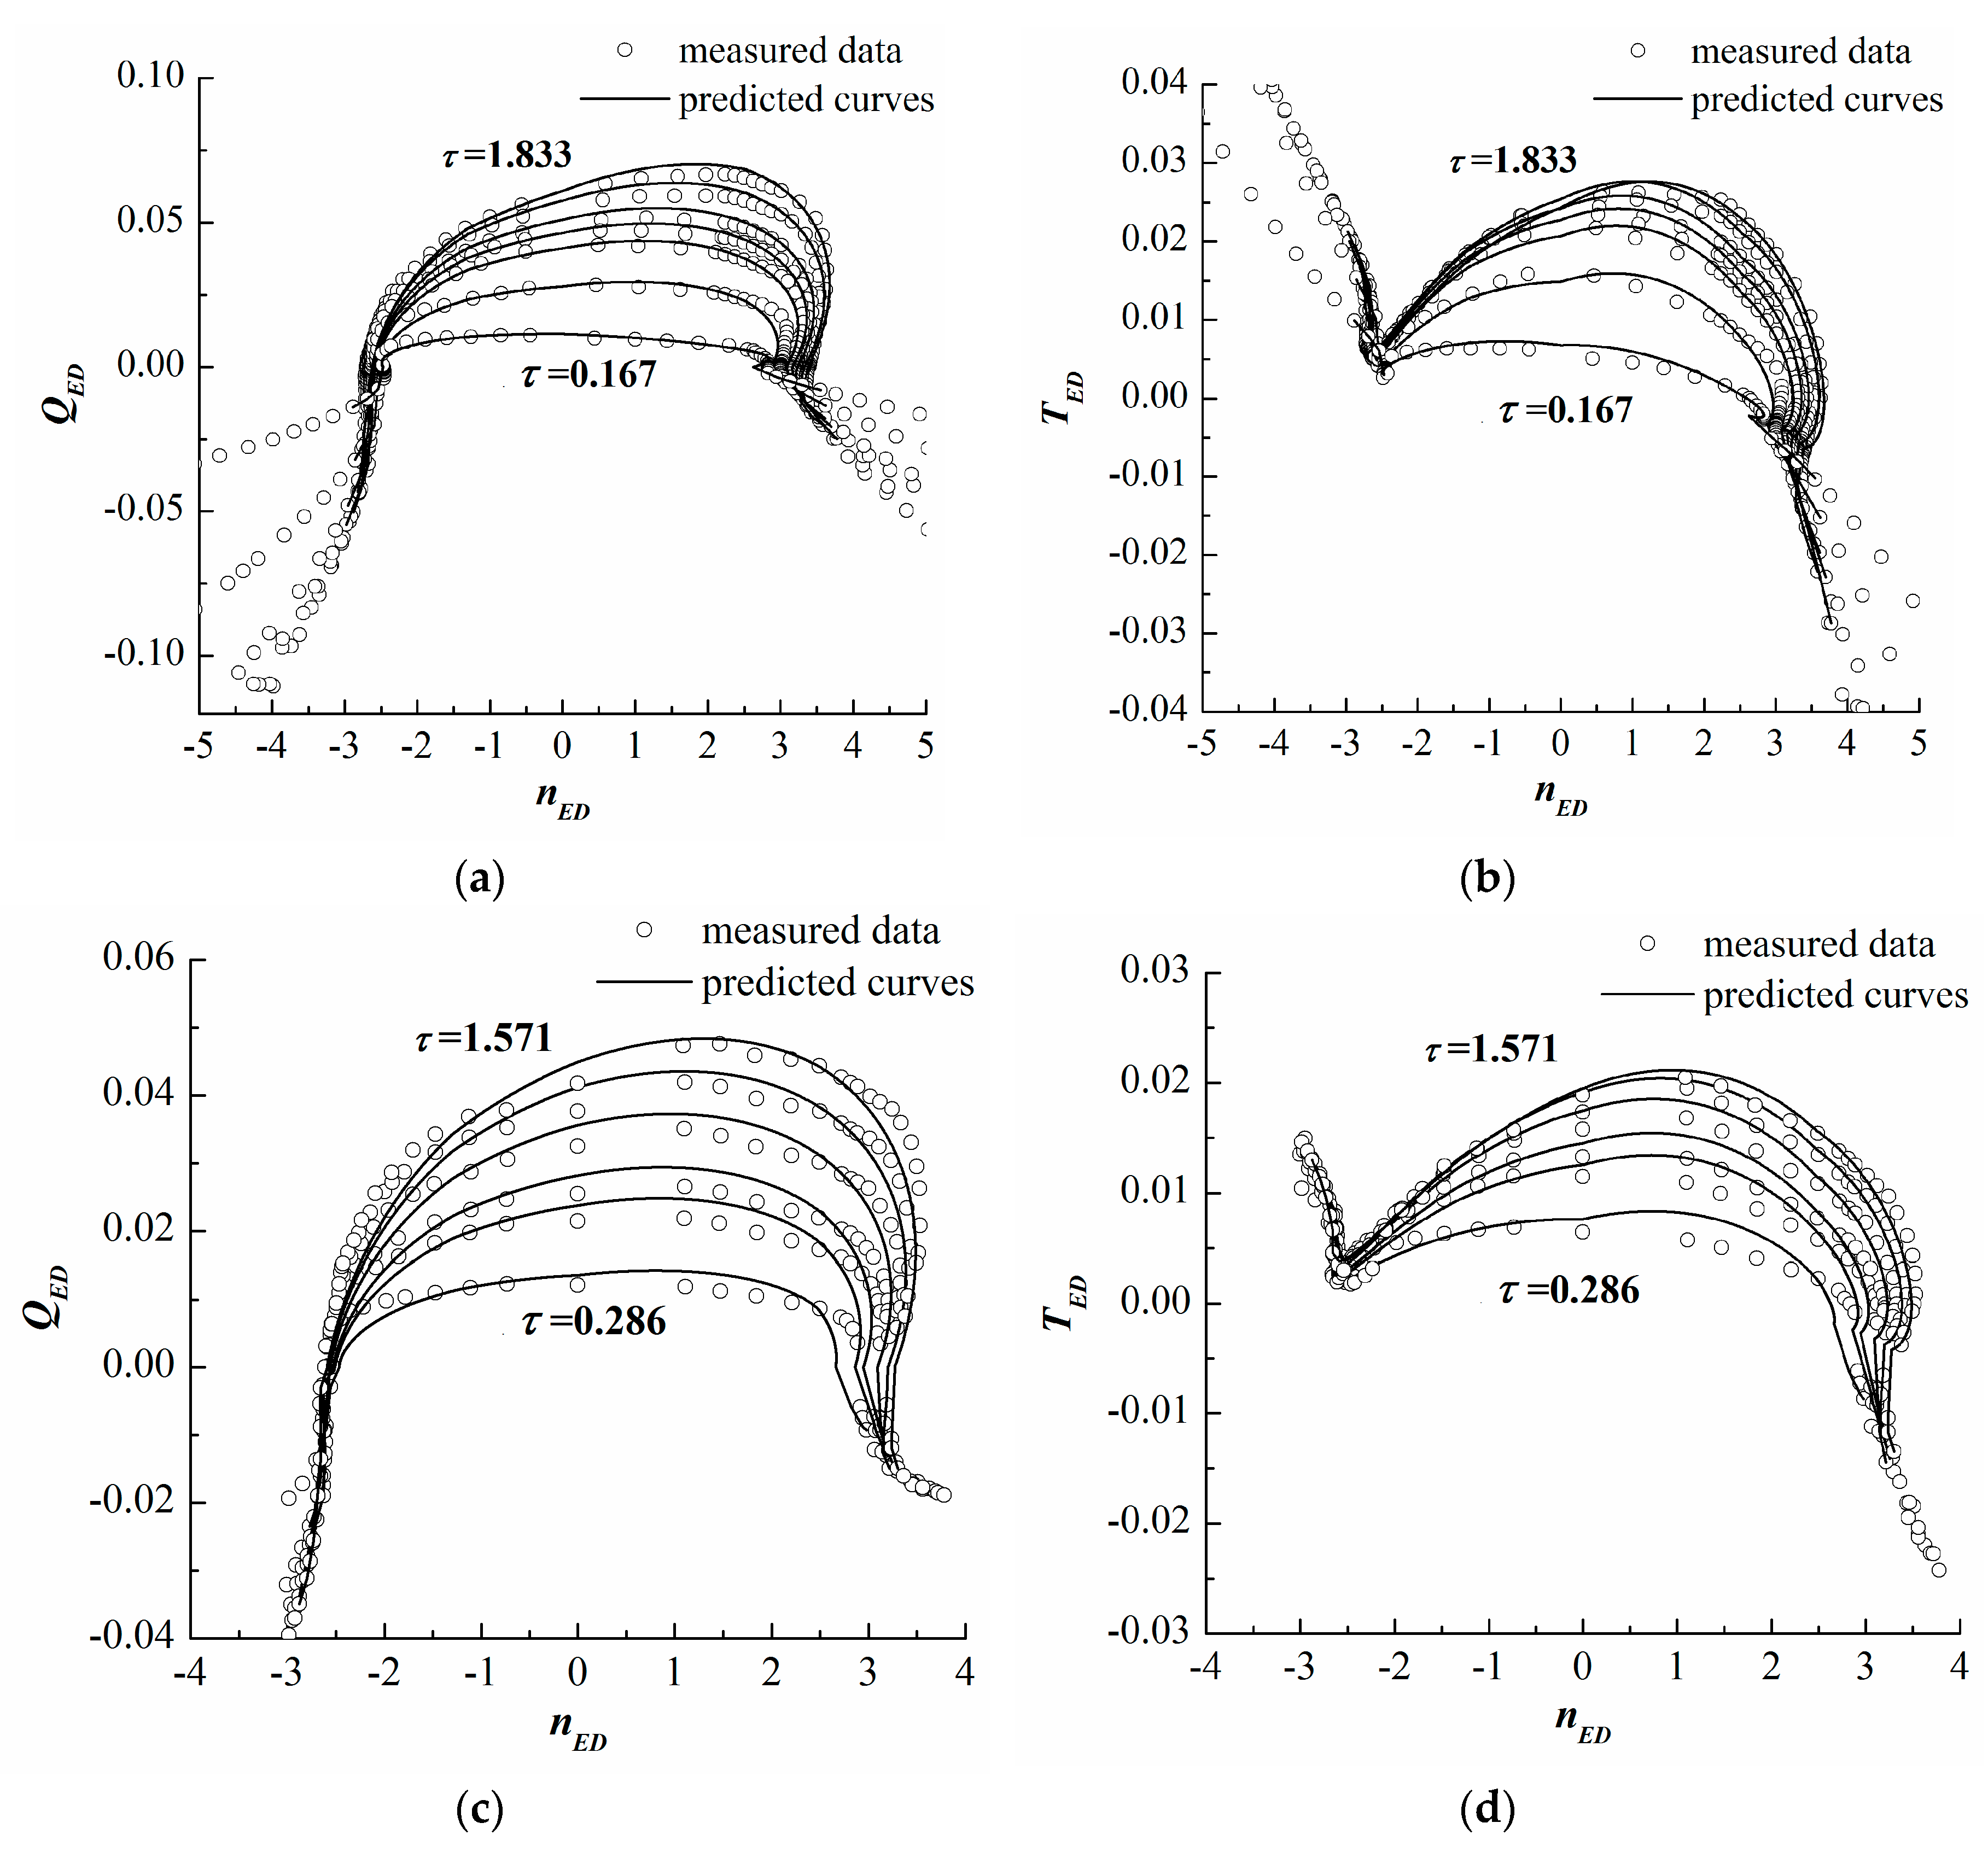
Figure 11.
Schematic diagram of piping layout. (a) Xianju PSPP; (b) Xilongchi PSPP.
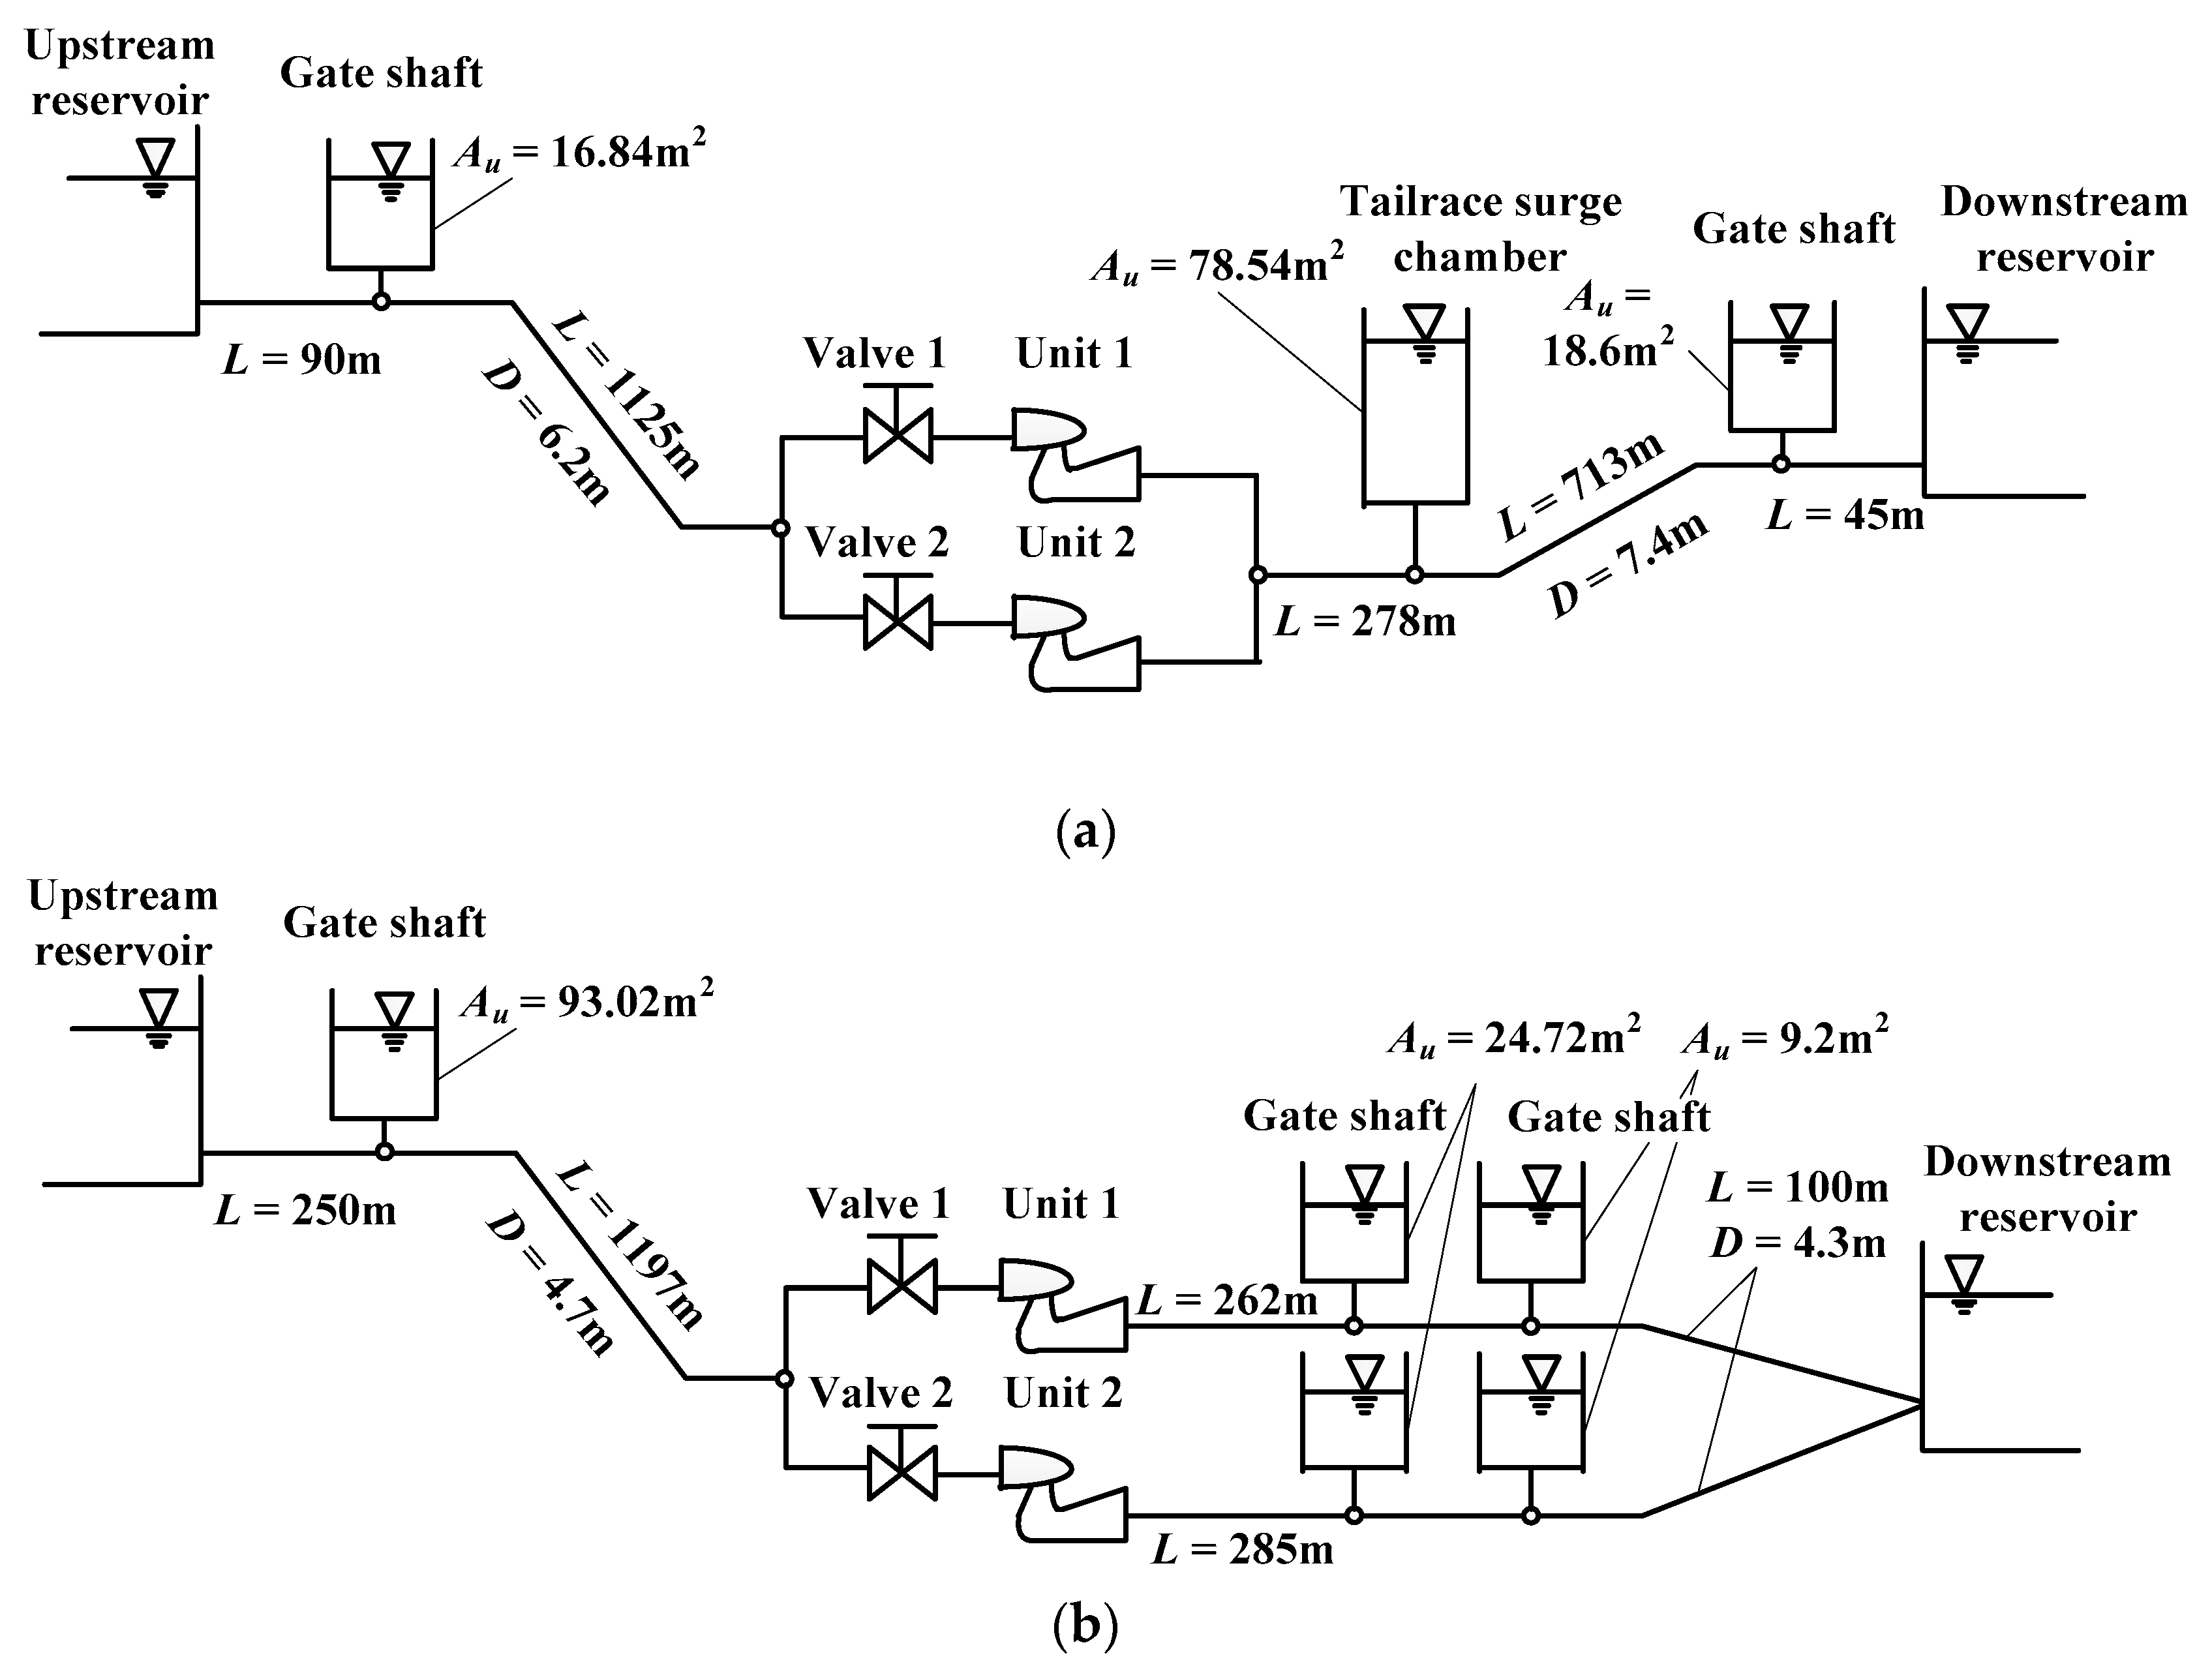
Figure 12.
Simulation results of simultaneous load rejection using the predicted characteristics and the measured characteristics. (a) rotational speed of the Xianju pump-turbine; (b) pressure at the spiral case inlet and the draft tube inlet of the Xianju PSPP; (c) rotational speed of the Xilongchi pump-turbine; (d) pressure at the spiral case inlet and the draft tube inlet of the Xilongchi PSPP.

Table 1.
Basic design parameters of PSPPs.
| Serial Number | Installed Capacity (MW) | Hr (m) | Qr (m3/s) | Nr (rpm) | Runner Inlet Diameter (m) | Runner Outlet Diameter (m) | NQE |
|---|---|---|---|---|---|---|---|
| PSPP1 | 250 × 4 | 190 | 152.15 | 250 | 5.19 | 3.29 | 0.87 |
| PSPP2 | 300 × 4 | 195 | 171.20 | 250 | 5.26 | 3.57 | 0.75 |
| PSPP3 | 300 × 4 | 300 | 118.30 | 300 | 5.04 | 2.70 | 0.65 |
| PSPP4 | 300 × 4 | 308 | 111.36 | 333 | 4.57 | 2.75 | 0.69 |
| PSPP5 | 250 × 4 | 363 | 78.50 | 375 | 4.56 | 2.60 | 0.58 |
| PSPP6 | 300 × 4 | 430 | 79.16 | 428.6 | 4.16 | 2.24 | 0.48 |
| PSPP7 | 375 × 4 | 447 | 96.60 | 375 | 4.86 | 2.54 | 0.52 |
| PSPP8 | 300 × 6 | 526 | 67.70 | 500 | 4.03 | 2.05 | 0.58 |
| PSPP9 | 300 × 6 | 600 | 57.80 | 500 | 4.23 | 2.00 | 0.51 |
| PSPP10 | 300 × 4 | 640 | 54.10 | 500 | 4.27 | 1.94 | 0.43 |
Table 2.
Functional relation between the characteristic parameters of COPs and , .
| COPs | Functional Form of Characteristic Parameters | a | b |
|---|---|---|---|
| Oi | 2.26 ± 0.12 | 0.50 ± 0.19 | |
| 0.13 ± (5.00 × 10⁻³) | 1.71 ± 0.09 | ||
| 0.05 ± (2.80 × 10⁻³) | 1.63 ± 0.14 | ||
| Ci | −2.32 ± 0.12 | −0.87 ± 0.20 | |
| −0.13 ± 0.02 | 1.84 ± 0.28 | ||
| 0.05 ± (5.30 × 10⁻³) | 1.72 ± 0.26 | ||
| Ai | / | / | |
| 0.11 ± (6.10 × 10⁻³) | 1.35 ± 0.12 | ||
| 0.05 ± (3.30 × 10⁻³) | 1.34 ± 0.13 | ||
| Ri | 2.66 ± 0.28 | 1.34 ± 0.46 | |
| 0.06 ± (4.20 × 10⁻³) | 1.98 ± 0.17 | ||
| / | / | ||
| B1i | −2.43 ± 0.09 | −0.31 ± 0.14 | |
| / | / | ||
| 0.02 ± (2.00 × 10⁻³) | 2.22 ± 0.24 | ||
| B2i | 2.41 ± 0.44 | 1.54 ± 0.71 | |
| / | / | ||
| −0.02 ± (4.40 × 10⁻³) | 1.89 ± 0.53 |
Table 3.
Basic design parameters of pump-turbines.
| Pump Turbines | NQE | Hr (m) | Qr (m3/s) | Nr (rpm) | Runner Inlet Diameter (m) | Runner Outlet Diameter (m) | Guide Vane Height (mm) | Number of Guide Vanes | Number of Blades |
|---|---|---|---|---|---|---|---|---|---|
| Xianju | 0.52 | 447 | 96.6 | 375 | 4.86 | 2.54 | 424.2 | 20 | 9 |
| Xilongchi | 0.43 | 640 | 54.1 | 500 | 4.27 | 1.94 | 298.0 | 20 | 7 |
Table 4.
The characteristic parameters of COPs on OOC.
| COPs | Xianju | Xilongchi | ||||
|---|---|---|---|---|---|---|
| C | −2. 7982 | −0.0433 | 0.0176 | −2.7919 | −0.0292 | 0.0116 |
| D | −2.7208 | −0.0373 | 0.0156 | −2.6859 | −0.0193 | 0.0090 |
| B1 | −2.6435 | 0.0000 | 0.0057 | −2.5800 | 0.0000 | 0.0036 |
| E | −1.3217 | 0.0378 | 0.0180 | −1.2900 | 0.0279 | 0.0125 |
| A | 0.0000 | 0.0457 | 0.0227 | 0.0000 | 0.0325 | 0.0158 |
| O | 2.4956 | 0.0431 | 0.0162 | 2.4910 | 0.0302 | 0.0109 |
| R | 3.3806 | 0.0174 | 0.0000 | 3.3288 | 0.0125 | 0.0000 |
| B2 | 3.2003 | 0.0000 | −0.0050 | 3.1759 | 0.0000 | −0.0046 |
| G | 3.1749 | −0.0040 | −0.0069 | 3.1198 | −0.0076 | −0.0078 |
| I | 3.3071 | −0.0111 | −0.0120 | 3.1926 | −0.0115 | −0.0114 |
Table 5.
The main characteristics of the Xianju and Xilongchi PSPPs.
| PSPP | Upstream Reservoir | Downstream Reservoir | Unit Parameters |
|---|---|---|---|
| Xianju | Humax = 676.8 m Hunor = 675.0 m Humin = 641.0 m | Hdmax = 213.9 m Hdnor = 208.0 m Hdmin = 178.0 m | Hr = 447 m Qr = 96.6 m3/s Nr = 375 rpm Pr = 382.7 MW GD2 = 9515 t·m2 |
| Xilongchi | Hunor = 1492.5 m Humin = 1467.0 m | Hdnor = 838.0 m Hdmin = 798.0 m | Hr = 640 m Qr = 54.1 m3/s Nr = 500 rpm Pr = 306 MW GD2 = 3800 t·m2 |
Table 6.
Transient conditions during simultaneous load rejection.
| PSPP | Simulation Results | Max. Speed Rise (%) | Max. Head at the Spiral Case Inlet (m) | Min. Head at the Draft Tube Inlet (m) |
|---|---|---|---|---|
| Xianju | With measured curves | 34.6 | 680.38 | 35.05 |
| With predicted curves | 35.6 | 710.57 | 34.99 | |
| Difference (%) | 2.9 | 4.4 | 0.2 | |
| Xilongchi | With measured curves | 34.2 | 940.40 | 36.59 |
| With predicted curves | 31.6 | 943.50 | 33.66 | |
| Difference (%) | 7.6 | 0.3 | 8.0 |
© 2018 by the authors. Licensee MDPI, Basel, Switzerland. This article is an open access article distributed under the terms and conditions of the Creative Commons Attribution (CC BY) license (http://creativecommons.org/licenses/by/4.0/).
Share and Cite
MDPI and ACS Style
Huang, W.; Yang, K.; Guo, X.; Ma, J.; Wang, J.; Li, J. Prediction Method for the Complete Characteristic Curves of a Francis Pump-Turbine. Water 2018, 10, 205. https://doi.org/10.3390/w10020205
AMA Style
Huang W, Yang K, Guo X, Ma J, Wang J, Li J. Prediction Method for the Complete Characteristic Curves of a Francis Pump-Turbine. Water. 2018; 10(2):205. https://doi.org/10.3390/w10020205
Chicago/Turabian StyleHuang, Wei, Kailin Yang, Xinlei Guo, Jiming Ma, Jue Wang, and Jiazhen Li. 2018. "Prediction Method for the Complete Characteristic Curves of a Francis Pump-Turbine" Water 10, no. 2: 205. https://doi.org/10.3390/w10020205
Note that from the first issue of 2016, this journal uses article numbers instead of page numbers. See further details here.