Article

Examining Storage Capacity Loss and Sedimentation Rate of Large Reservoirs in the Central U.S. Great Plains

1
Kansas Biological Survey, University of Kansas, Lawrence, KS 66407, USA
2
Department of Biological and Agricultural Engineering, Kansas State University, Manhattan, KS 66506, USA
3
Department of Ecology and Evolutionary Biology, University of Kansas, Lawrence, KS 66045, USA
4
Environmental Studies Program, University of Kansas, Lawrence, KS 66045, USA
5
Reservoir Operations and Planning, Kansas Water Office, Topeka, KS 66612, USA
6
Eastern Colorado Area Office, U.S. Bureau of Reclamation, Loveland, CO 80537, USA
7
FLO Analytics, Portland, OR 97209, USA
8
Watershed Planning, Monitoring, and Assessment Section, Kansas Department of Health and Environment Bureau of Water, Topeka, KS 66612, USA
*
Author to whom correspondence should be addressed.
Water 2018, 10(2), 190; https://doi.org/10.3390/w10020190
Submission received: 7 December 2017 / Revised: 7 February 2018 / Accepted: 8 February 2018 / Published: 11 February 2018

Abstract

:
Reservoirs created by impounding sediment-laden streams infill over time, reducing storage capacity and altering water quality. Increasing freshwater demand on a limited supply is adding pressure on reservoir water storage and management across much of the western and central U.S. Determining sedimentation rates is helpful to ensure a reliable and sustainable clean water supply for drinking, irrigation and recreation purposes. In the state of Kansas, located in the central Great Plains, bathymetric surveys have been completed recently for many major state and federally constructed reservoirs. In this paper, we examine sediment infill rate and storage capacity loss for all 24 federally operated reservoirs in Kansas. As of 2016, these reservoirs have an average age of 52 years and collectively have lost approximately 17% of their original capacity, with the highest single-reservoir loss of 45%, the highest annual loss rate of 0.84%, and the highest annual sediment yield of 1688 m3/km2/year. Results from this paper provide baseline information pertinent to the development, prioritization and assessment of remediation and mitigation strategies for addressing the sediment infill problem in Kansas, with general implications for other large reservoirs across the Great Plains as well as other climatologically and ecologically similar regions around the world.

1. Introduction

Streamflow has been managed by dam construction on large and small rivers for various purposes throughout modern human history, with dams in operation as old as Lake Homs water supply dam (c. 1300 BC) in Syria [1,2]. In areas with inadequate subsurface water supplies and highly variable surface flows, which describes much of the U.S. Great Plains, impoundments can provide water supply stability and also limit flooding by storing floodwater and releasing it gradually, thereby mitigating peak flows downstream.
Dam construction can have negative impacts on upstream and downstream ecosystems, water chemistry, stream flow and wetlands [3,4,5,6,7]. Sediment trapping in these reservoirs can be substantial [8,9,10], with the estimated mean annual global reservoir infill rate of 0.5–1% resulting in crucial storage loss, particularly in areas prone to severe storms [11]. Disproportionately high amounts of infill sediment are delivered during extreme high flow events typically associated with intense storms [12]. As human population increases, there is an associated higher demand for drinking and irrigation water. This presents a precarious situation in areas that have highly variable weather and extended drought periods such as the Great Plains, where reservoir sedimentation escalates water management concerns [13,14].
Kansas (Figure 1, inset map) is one of several states in the Great Plains region that depends heavily on reservoir-sourced drinking water, with about 80 reservoirs (including 17 of the 24 federal reservoirs examined in this study) providing primary or backup water supply for more than 60% of its residents [15]. To the south, the state of Texas has 188 reservoirs with a normal capacity greater than 6 Mm3 [16], many of which are used for drinking water supply. In Oklahoma, approximately 61 reservoirs have a normal capacity greater than 14 Mm3, all of which help meet the critical need for water in this state [17]. Eastern New Mexico, eastern Colorado, Nebraska and other Great Plains states similarly rely on reservoirs to meet at least part of their water supply needs (Figure 1). In the Great Plains, the majority of large federal reservoirs were designed and built in the 20th century principally to control flooding and secondarily to provide water for a number of human uses. Now well into the 21st century, many communities are faced with greater water demands but less available water due to reservoir sedimentation in conjunction with potentially more common episodic weather extremes, including both flooding and drought [18,19,20,21,22,23,24].
Recent efforts in Kansas have focused on estimating the amount of sediment accumulation in larger reservoirs. Bathymetric surveys have been initiated and supported primarily by the Kansas Water Office (KWO), the U.S. Army Corps of Engineers (USACE), and the U.S. Department of Interior—Bureau of Reclamation (BOR) during the last two decades [25,26]. High-quality lake-bottom topography and lake volume data for 24 federal and 55 state and local lakes resulted from these surveys (for convenience, we use “lake” and “reservoir” interchangeably in reference to impoundments, not to be confused with natural lakes). Due to the low detail of the original lake surveys (which, for this study, have generally been derived from pre-impoundment topographic contour maps as shown in several bathymetric reports available from [25]), there is inherent error when conducting infill volume estimates; however, the differencing approach used here has been found to be reasonably accurate [27,28]. An example of a more specific type of error that can enter into this kind of assessment can be seen in the bathymetric report for Clinton Lake [25], where a number of borrow pits along with an elevated road used for material transport during dam construction are visible in the lake bottom elevation change map. These features were present for the recent bathymetric survey but do not appear in the pre-impoundment topographic map. While such data artifacts are fairly common, they are generally of small magnitude relative to the whole-lake sediment volume estimates.
The objective of this study is to examine sedimentation (infill amount and rate) and capacity depletion (storage loss rate) of the 24 federally constructed reservoirs in Kansas (hereafter referred to as KS-FdR). Capacity refers to the volume of the conservation pool, which is the body of water below the normal operating level of a reservoir. The bathymetric survey information used in this study originated from data collected between 1998 and 2014 (Table 1), making sediment infill data the most accurate to date. None of the KS-FdR have been dredged prior to their most recent survey. However, a large-scale dredging project on John Redmond Reservoir occurred in 2016 [29], which is described later.

2. Methods and Materials
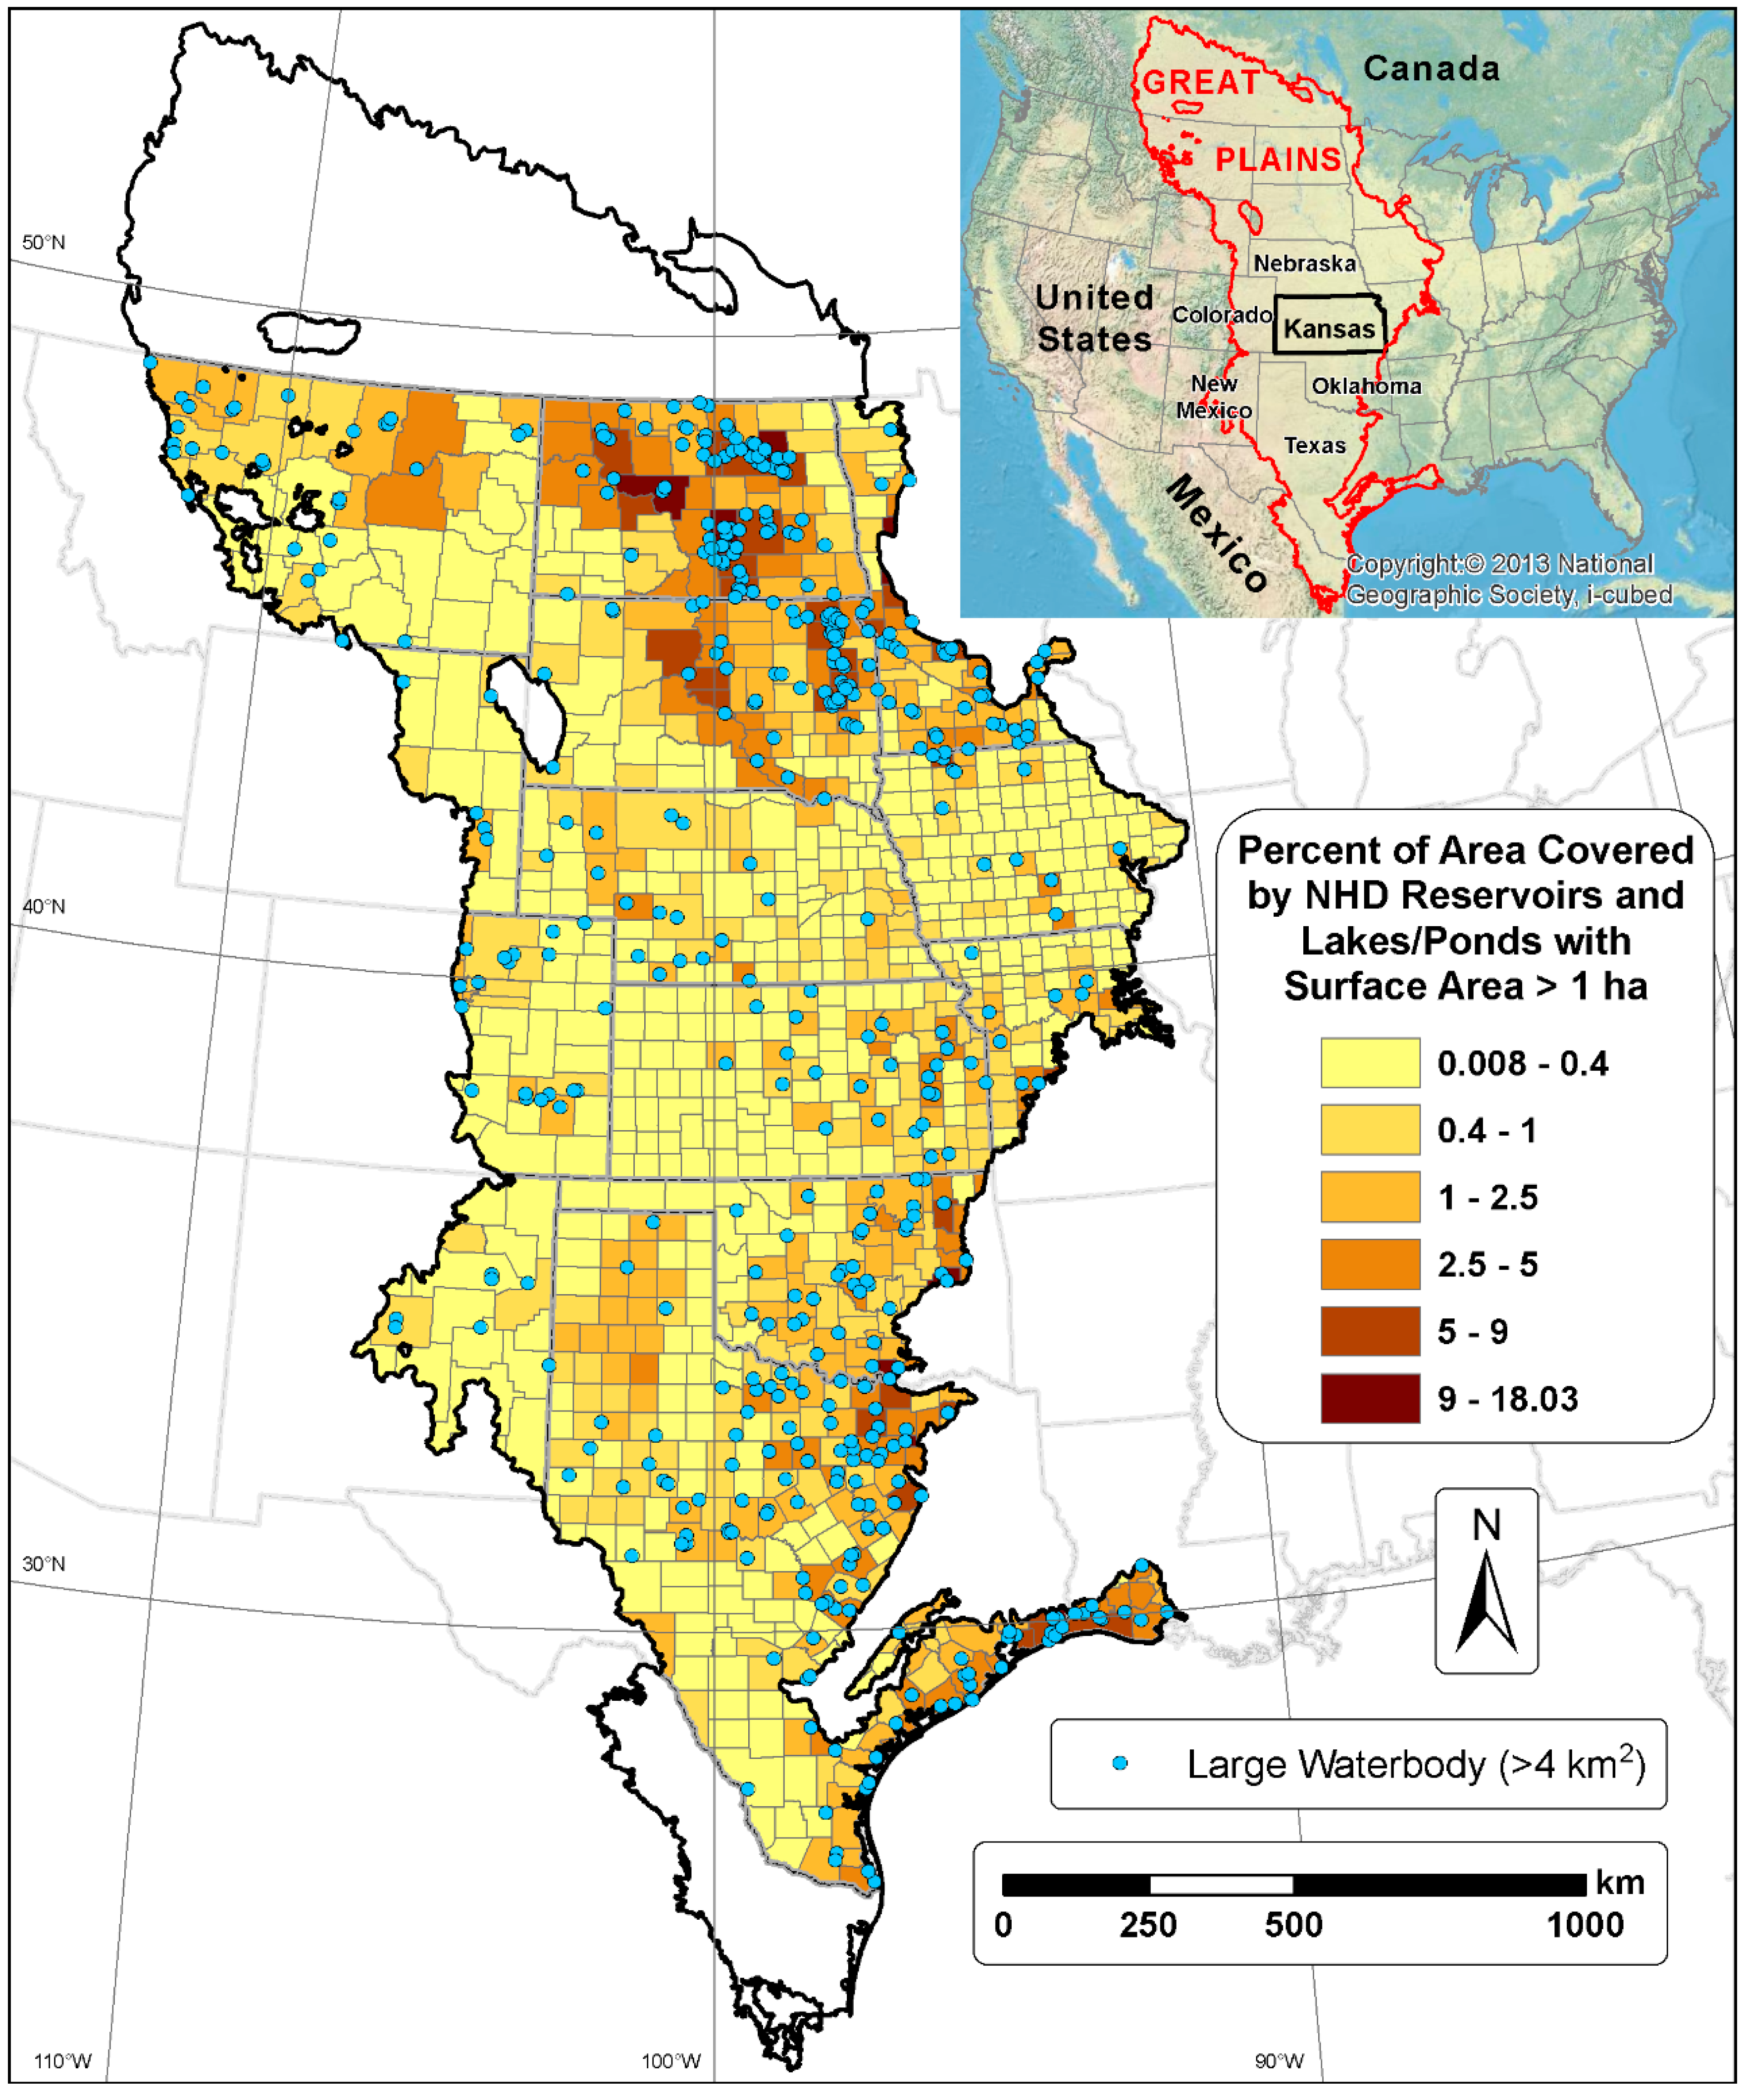
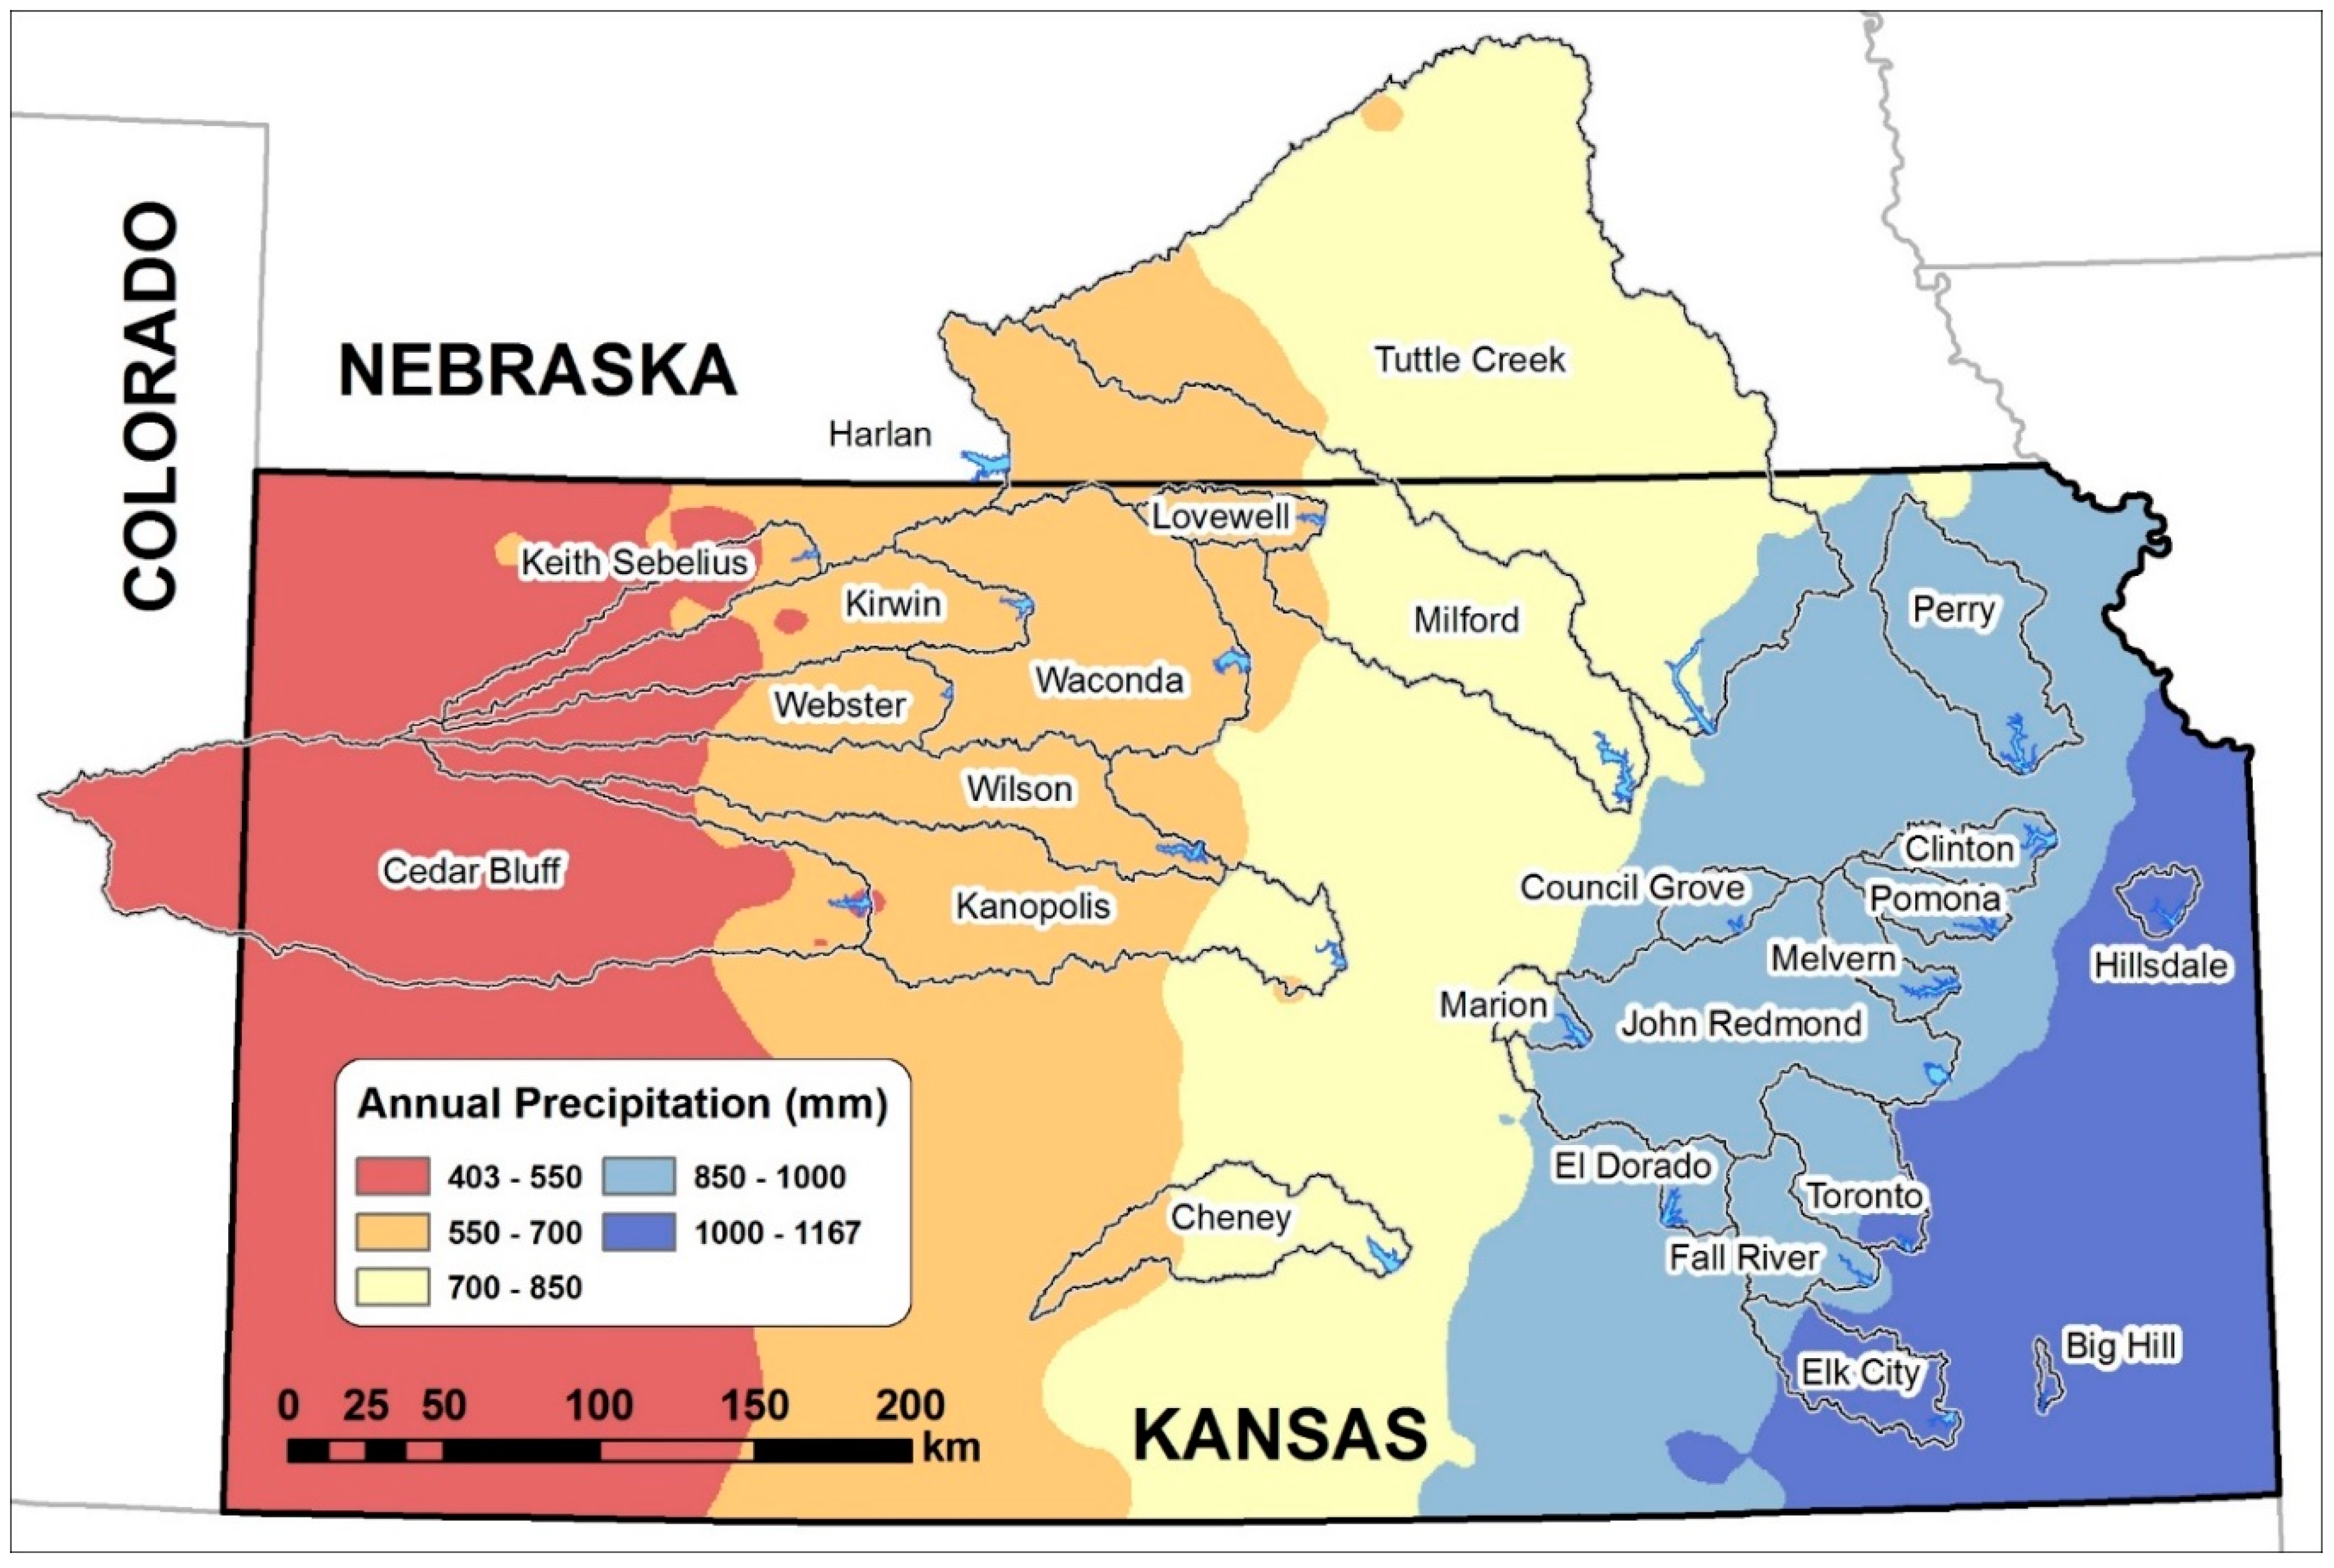
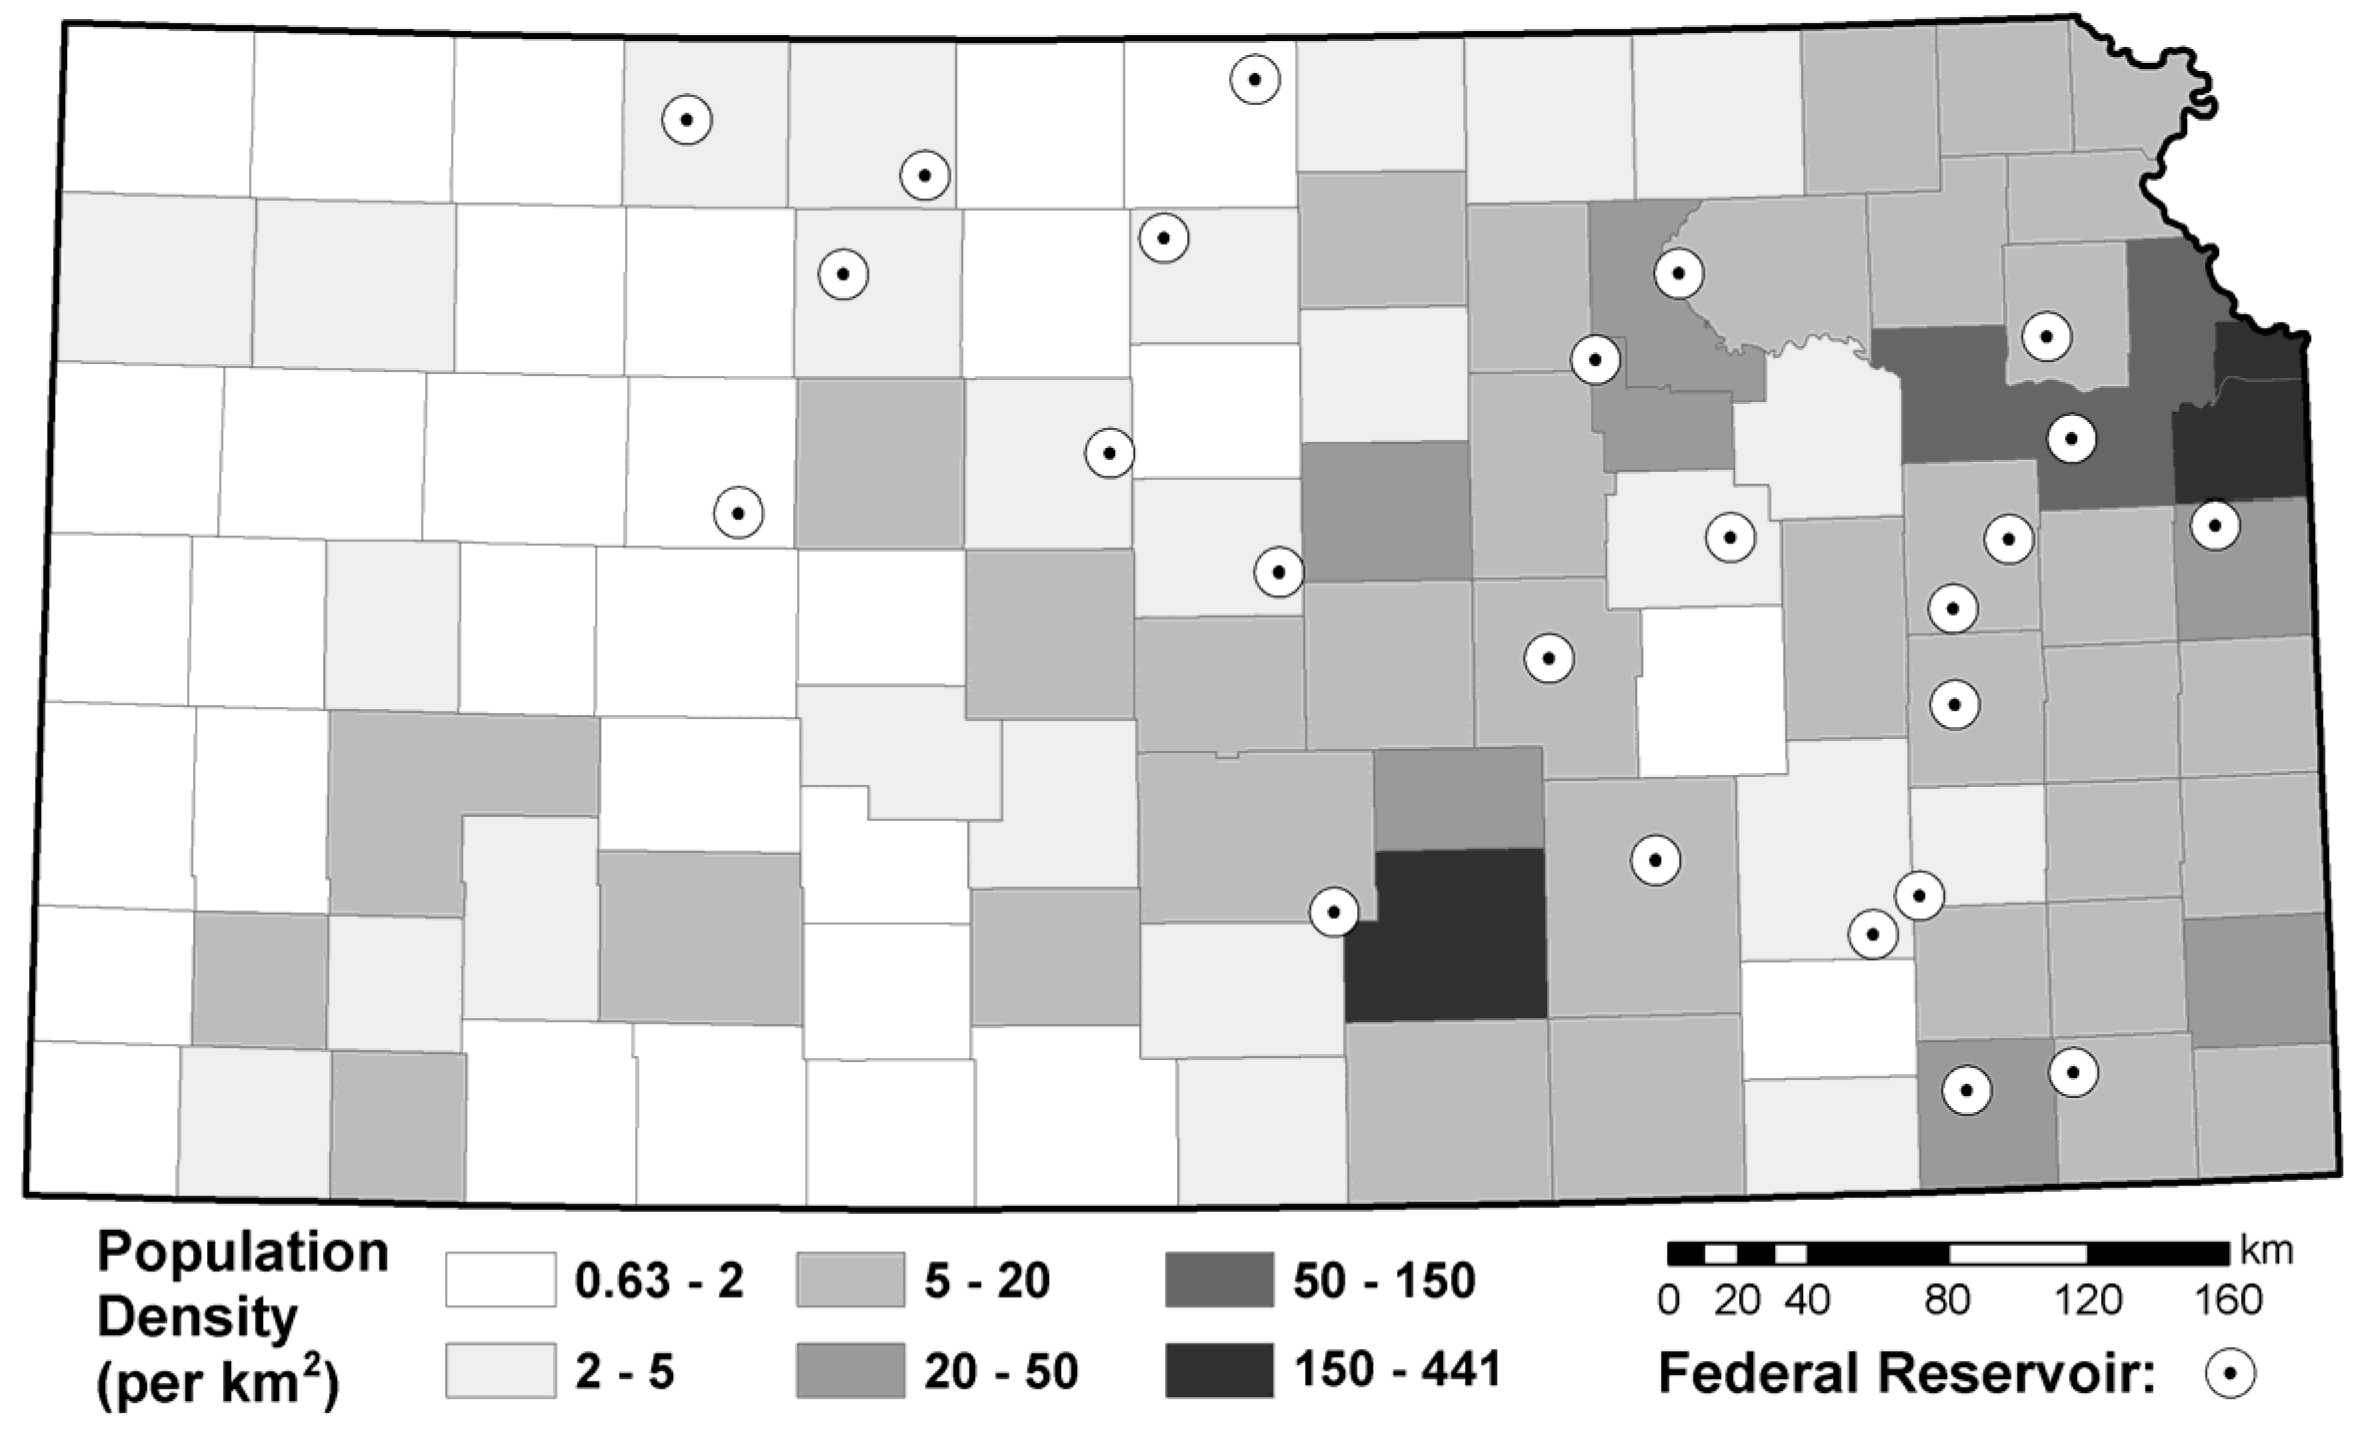
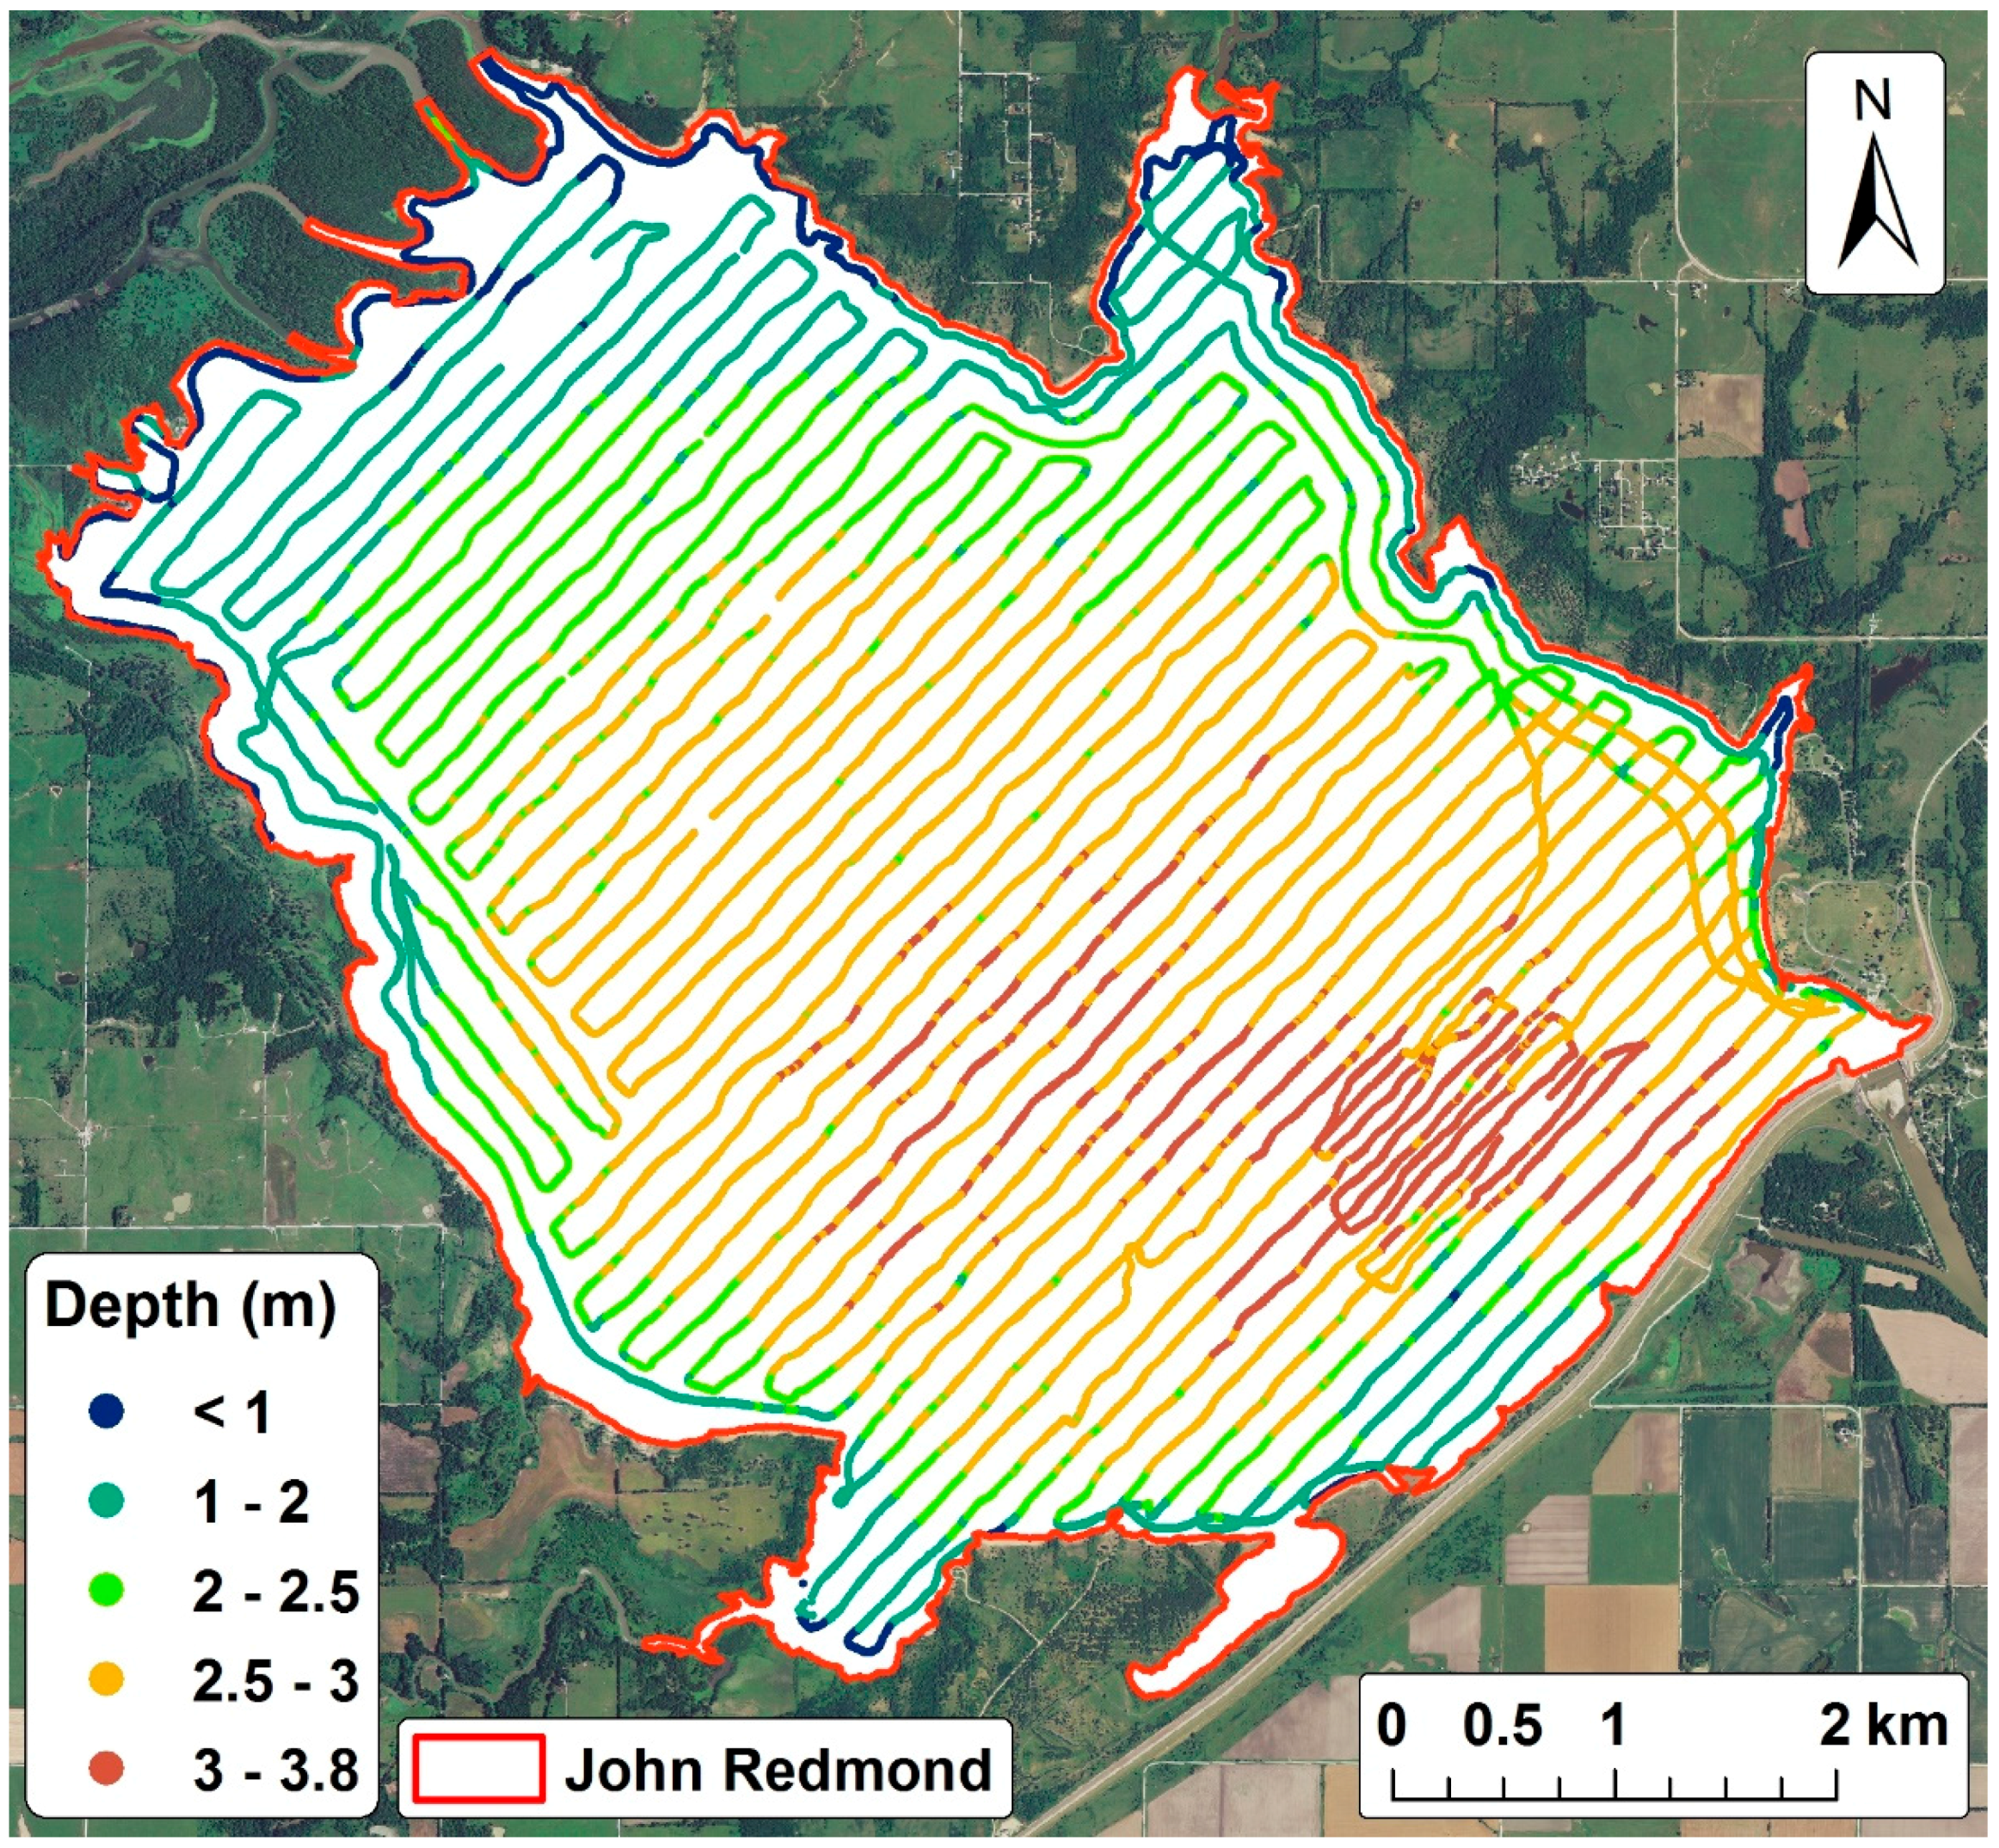
2.1. Study Area

The study sites include all the KS-FdR (Figure 2, Table 1). Aside from groundwater in the low populated counties of western Kansas, KS-FdR are the most important drinking water sources for the state’s citizens [32]. Surface water storage and population density are clearly related, with 15 of the 24 KS-FdR located in the more heavily populated eastern third of the state (Figure 3). This is consistent with the fact that KS-FdR placement was driven principally by flood control needs, which are greater in the eastern part of the state due to increased precipitation (Figure 2).
Annual rainfall indicates a gradient from west (approximately 500 mm/year) to east (approximately 1000 mm/year), with more frequent and greater extreme precipitation events in the east [34,35]. Thus, eastern Kansas reservoirs usually have more available inflow (both in absolute terms and relative to their respective capacities) than those toward the west.
Reservoir sediment volume has been widely studied in the state, and reservoir storage capacity data are available for all the KS-FdR [15,26,36,37,38]. Decreasing storage capacity due to sediment infill coupled with an estimated population increase of approximately 17,131 people per year ([39]; growth rate estimated using annual values from 1990–2014, with a determination coefficient (R2) of 0.99) suggests a decreasing per capita available surface water supply (Figure 4). The increase in Kansas’ population of approximately 164,294 persons between 2000 and 2010 alone represents an additional demand of nearly 1.8 Mm3 of drinking water per year, based on an average domestic water use of 307 liters (0.307 m3) per person per day [40]. Considering that the KS-FdR collectively are losing capacity at a rate of 13 Mm3/year while demand is increasing by 1.8 Mm3/year, surplus water supply capacity is effectively being reduced by 14.8 Mm3/year.

2.2. Data Sources

Depending on their location in the drainage system and other factors, the KS-FdR are monitored by the Kansas City or Tulsa districts of the USACE or the BOR. KWO, a state agency with responsibilities for state water resource planning and supply management, provided the general characteristics of the reservoirs [25]. The Kansas Biological Survey (KBS, a research center at the University of Kansas and a research agency of the state of Kansas), USACE, BOR, USGS, and Oklahoma Water Resources Board provided the bathymetry data used by the state for reservoir capacity and sedimentation rate analysis [33]. The majority of the surveys (15 of 24) were completed by KBS (Table 1). Climatological precipitation data from 1981–2010 were processed by and downloaded from the Parameter-elevation Regressions on Independent Slopes Model (PRISM) Climate Group [33].

2.3. Methods

To obtain bathymetric data, KBS operated a Biosonics DT-X echosounding system with a 200 kHz split-beam transducer and a 38-kHz single-beam transducer. Samples were densely collected along transect lines with a typical spacing of approximately 100–200 m (see Figure 5 for example), and depth estimates from these measurements were spatially interpolated to produce a map representing lake bottom topography at the time of survey. Additionally, a number of sediment cores were collected with each KBS survey, which provided information on sediment particle size, bulk density (which is used in this paper), thickness, and composition. Readers are referred to [41] and many similar reports (obtainable from [25]) for more information about the procedures of the KBS and other bathymetric surveys. Details on instruments, number of survey points in each reservoir, pre-survey preparation, survey procedure, and lake level adjustments are among the steps explained in those publications.
Drainage area was calculated for each KS-FdR separately; for watersheds that included more than one federal reservoir, the upstream reservoirs’ drainage area was calculated individually and excluded from the drainage area of the downstream reservoir (Figure 2). This was the case for four reservoirs (John Redmond, Kanopolis, Milford, and Waconda). While a substantial portion of each KS-FdR’s upstream watershed lies behind much smaller dams [30], the sediment trapping and pass-through behavior of these relatively small impoundments during extreme flood events generally is not well known, and these structures predominantly were built without a specific flood control purpose. For these reasons, and to be consistent with most other sediment yield studies, we did not exclude smaller impoundment catchments from the KS-FdR watersheds. Consequently, our sediment yield estimates likely are biased low to some degree, considering that smaller upstream impoundments are trapping some sediment that otherwise might have found its way into the downstream KS-FdR. Nonetheless, with KS-FdR found to have >90% sediment trapping efficiency [42,43,44,45] and existing at a much larger scale than all other upstream impoundments, this approach to watershed boundary determination is expected to result in a reasonably accurate estimate of sediment yield for the KS-FdR watersheds. From the most recent survey and watershed extent data in addition to the original surveys, we estimated sediment yield, annual depletion rate, and reservoir half-life (when the reservoir conservation pool is half full of sediment) for the KS-FdR (Table 1) [46].
The sediment yield was calculated by dividing the total accumulated sediment in the reservoir by the period between the most recent bathymetric survey and the original survey, divided by the reservoir drainage area:
Y = [ ( V 0 V r ) ( t r t 0 ) ] W
Y is the sediment yield (m3/km2/year), V0 is the original reservoir capacity (m3), Vr is the reservoir capacity at the most recent bathymetric survey, tr is the date of the most recent bathymetric survey (year), t0 is the beginning of reservoir operation, and W is the drainage area (km2). In this study, the sediment yield excludes the trapped sediment in the portion of the flood pool that is above the conservation pool as well as the sediment that is passed through the reservoir.
Percent loss of capacity (Lr) from time t0 to tr was calculated by:
L r = 100 × ( V 0 V r ) V 0
Vc denotes current reservoir capacity as of 2016 (=tc) and was estimated by:
V c = V 0 ( V 0 V r t r t 0 ) × ( t c t 0 )
The loss of capacity was estimated for 2016 because the most recent surveys were completed in different years. The use of 2016 estimations for all reservoirs allows for more current and temporally consistent comparisons to be made among individual reservoir capacity losses. Also, using 2016 values allows us to avoid any current volume adjustment for John Redmond due to the dredging activity that occurred late that year.
Annual depletion rate (D; also a %) was calculated by:
D = L r ( t r t 0 )
The year that half of the reservoir ( t 1 / 2 ) will be infilled with sediment is given by:
t 1 / 2 = t 0 + [ V 0 / ( Y × W ) ] 2

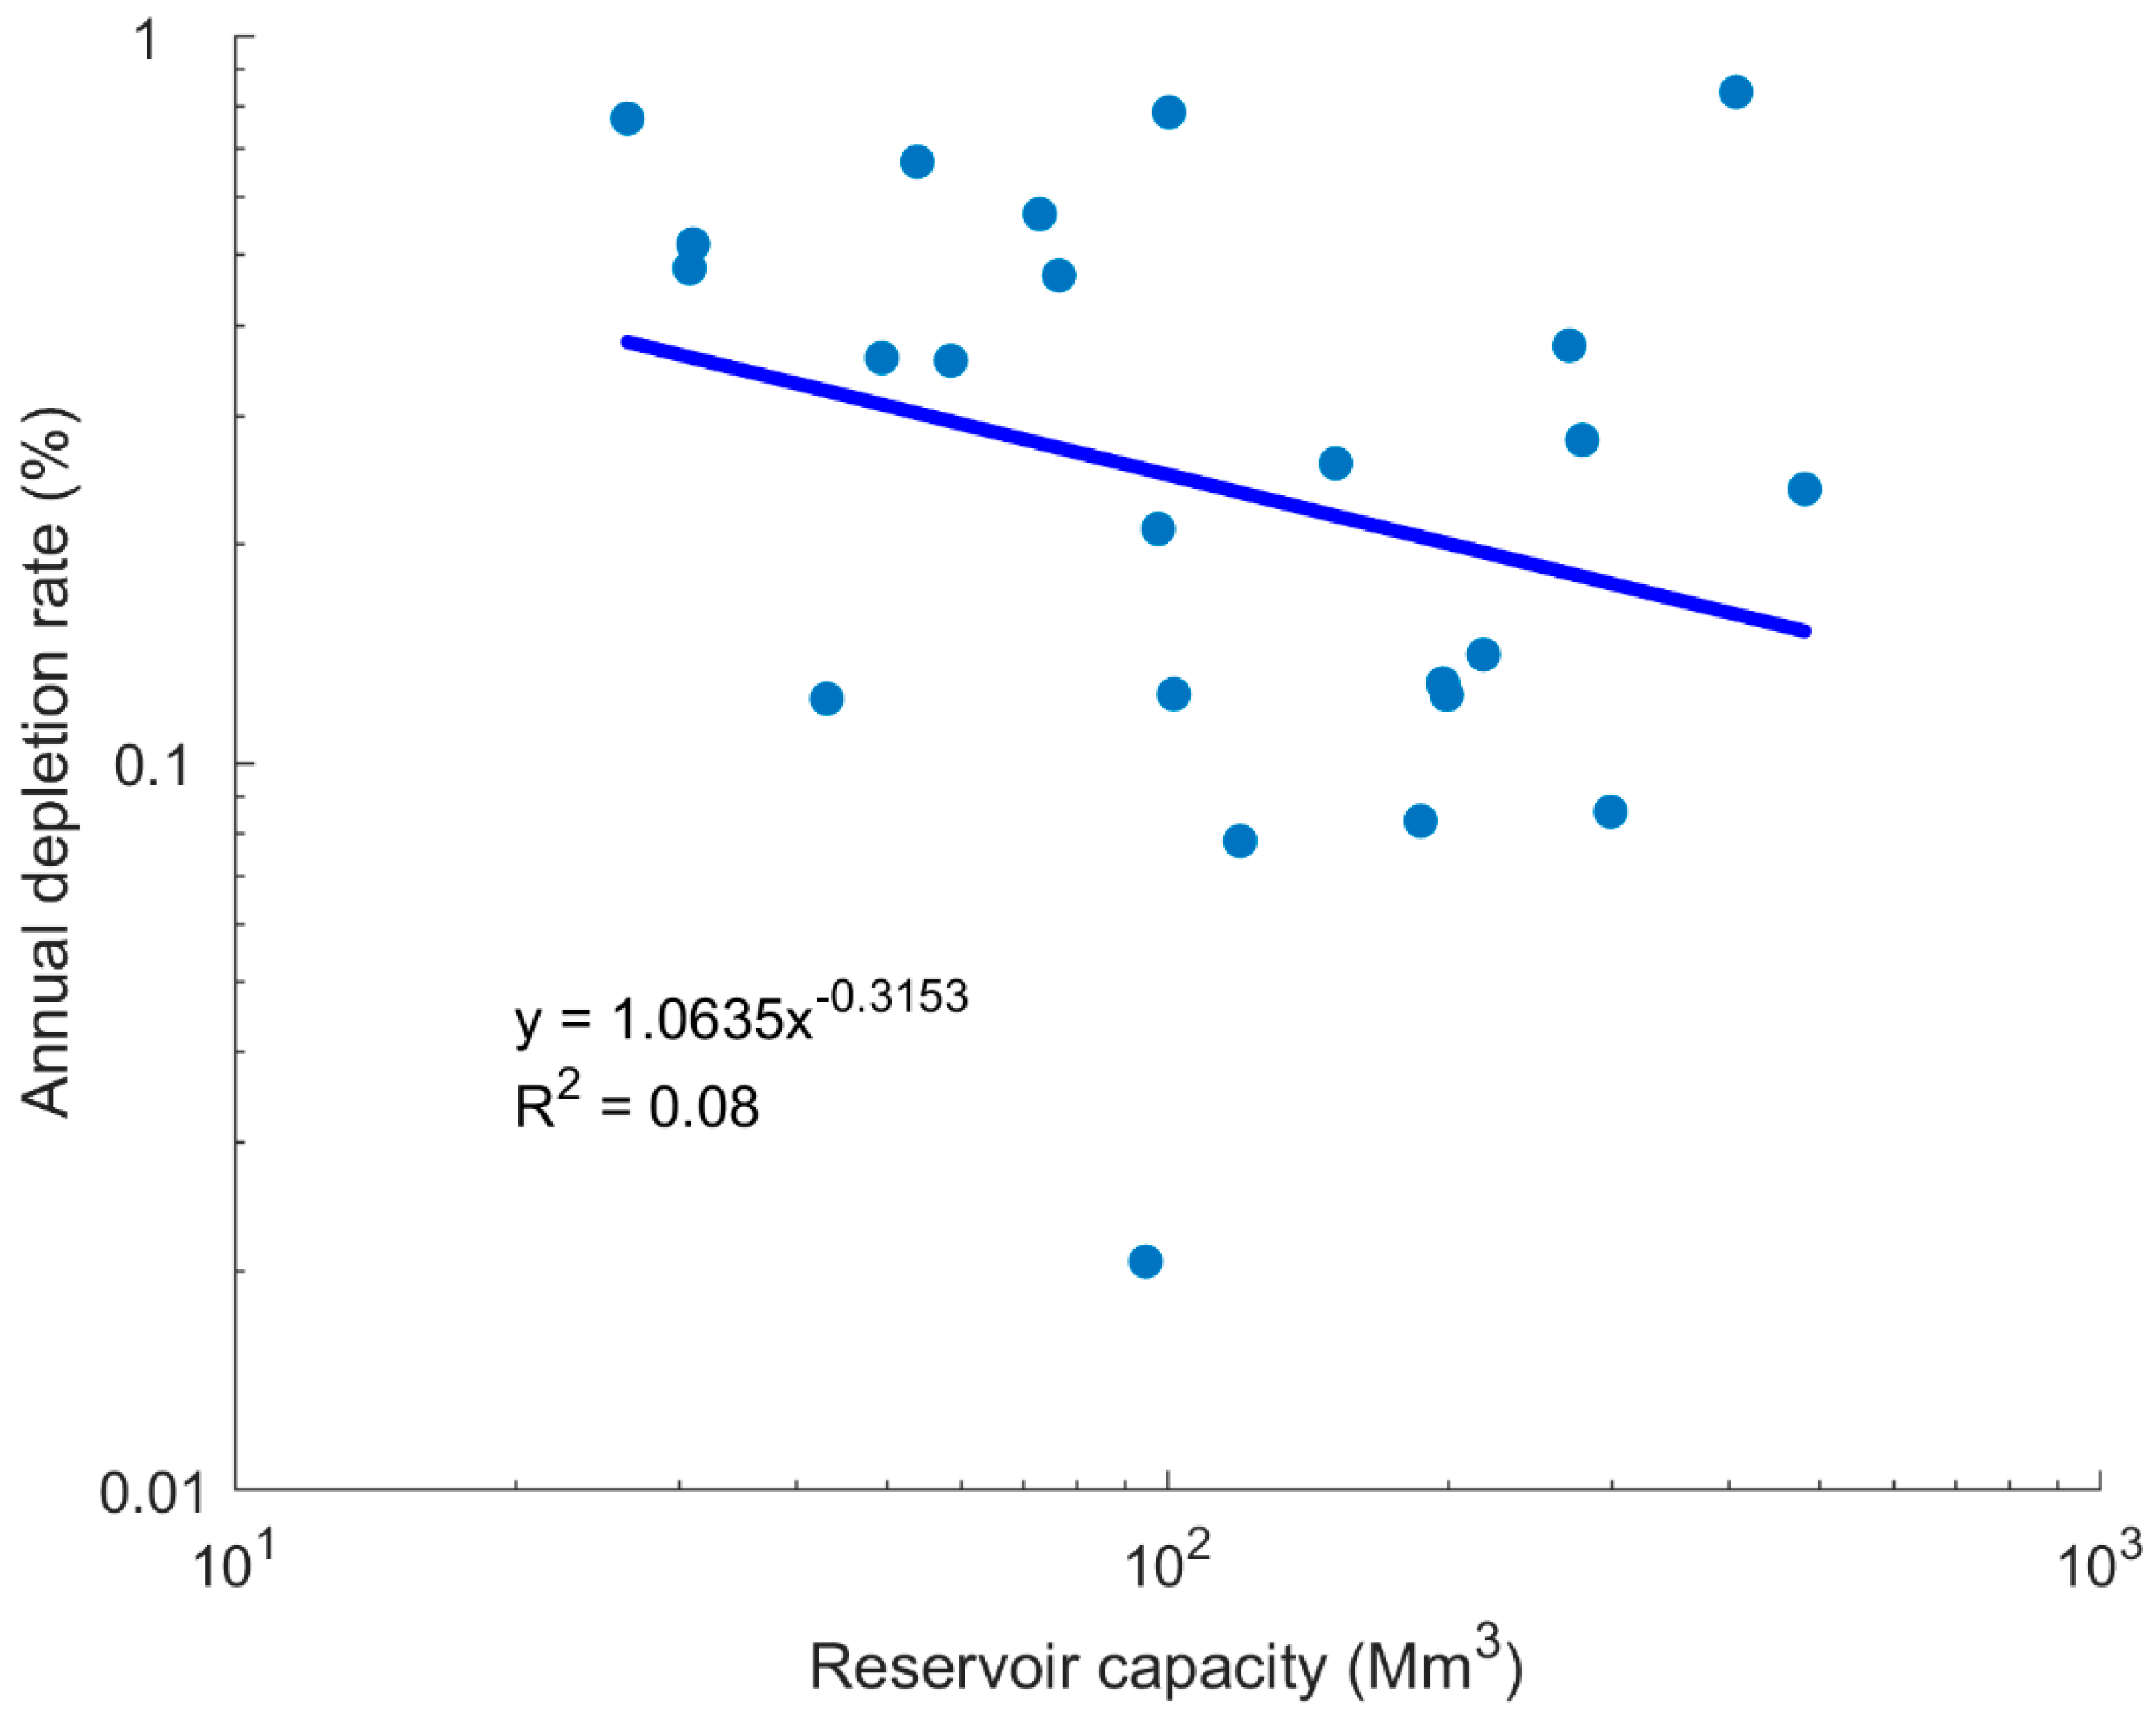
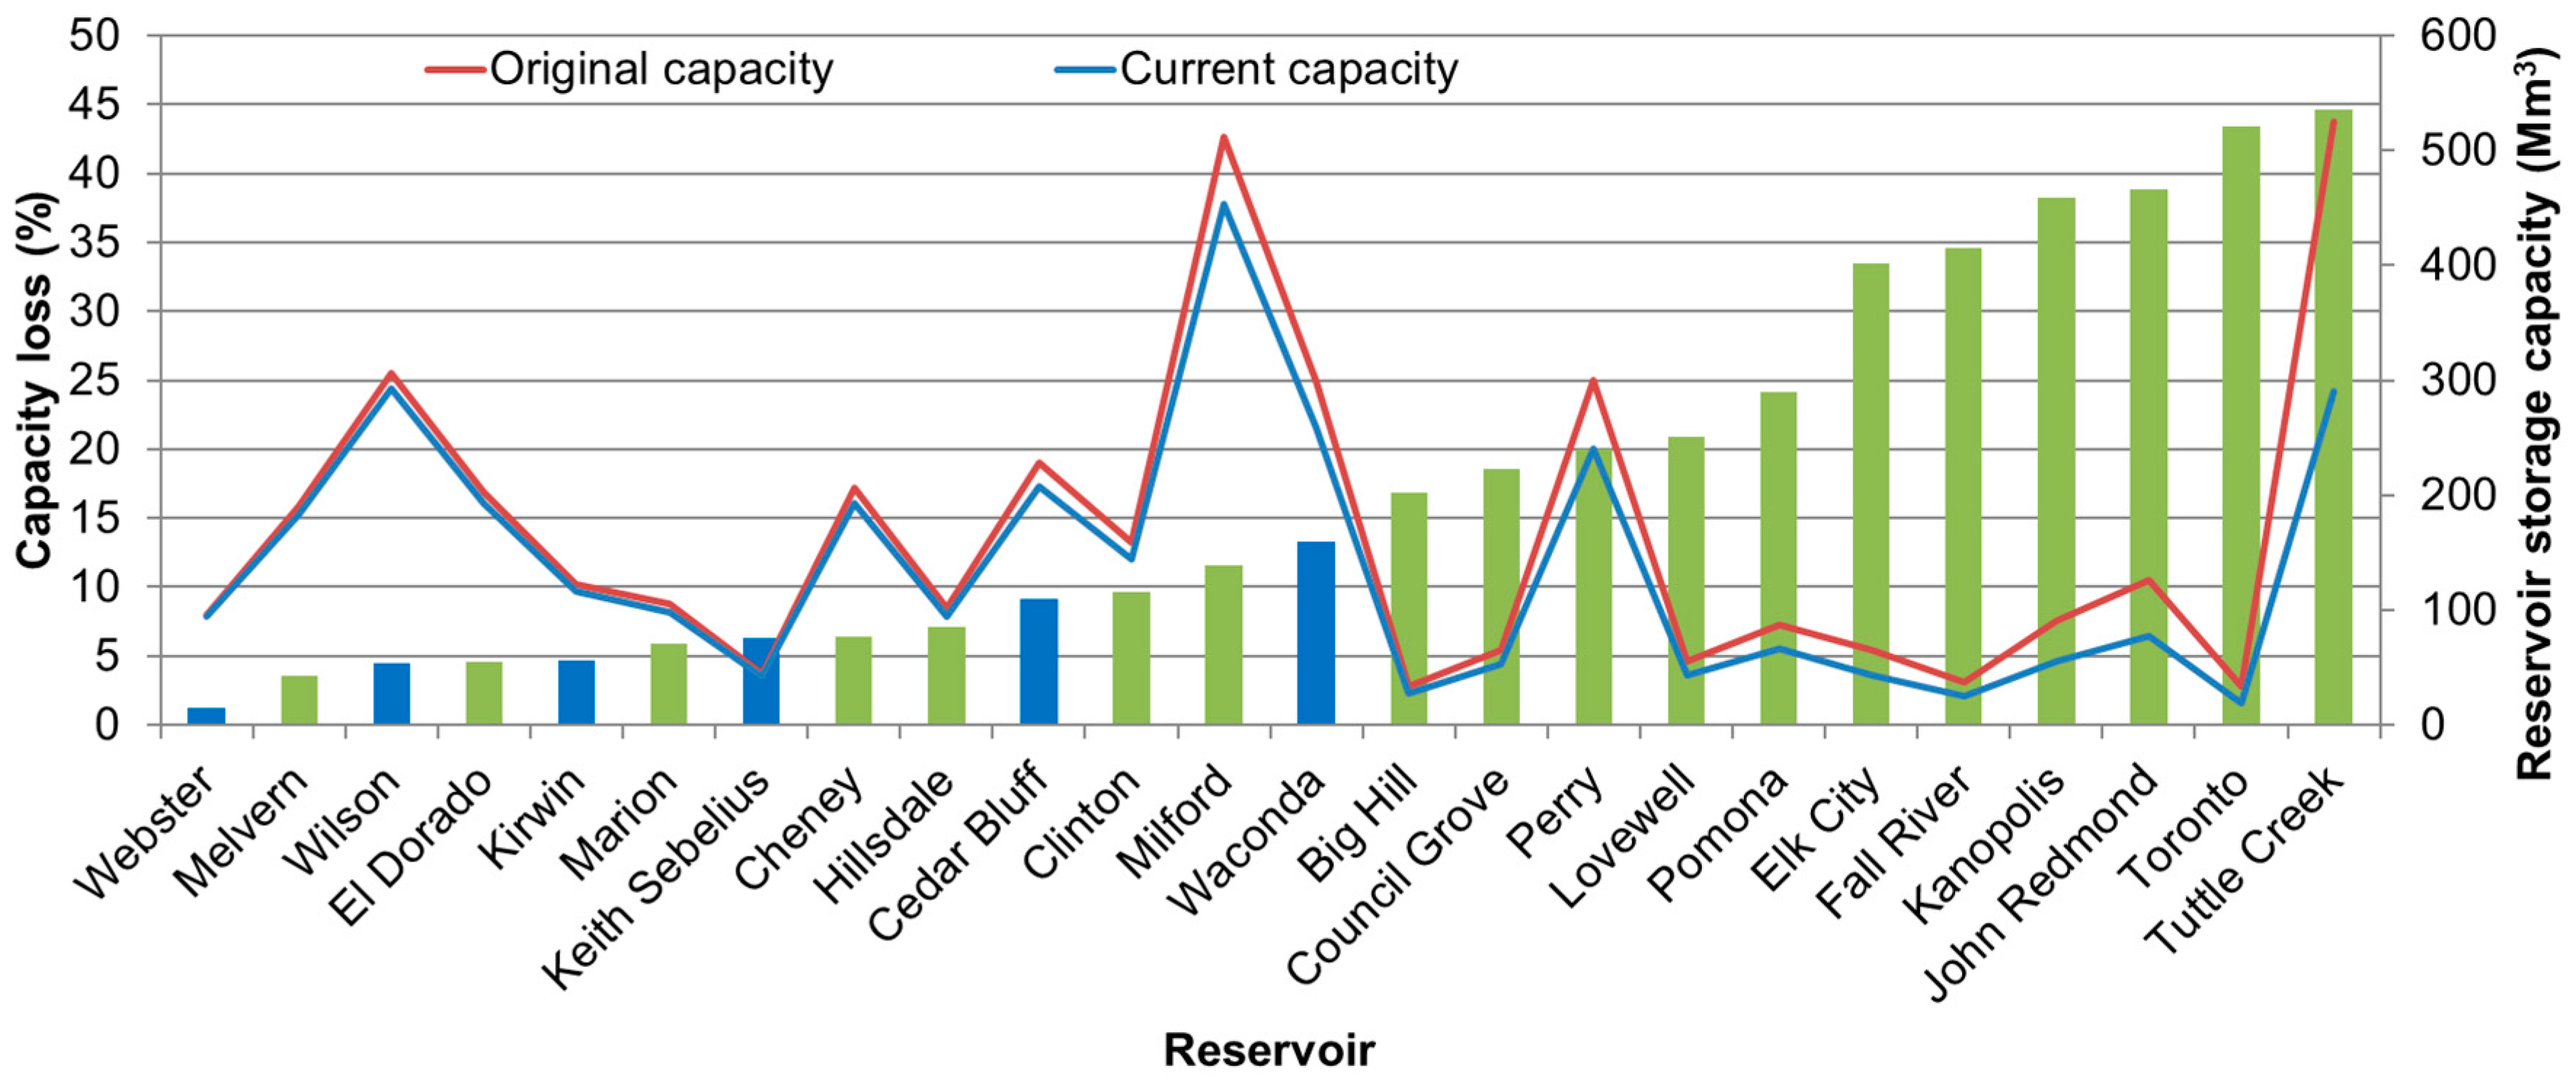
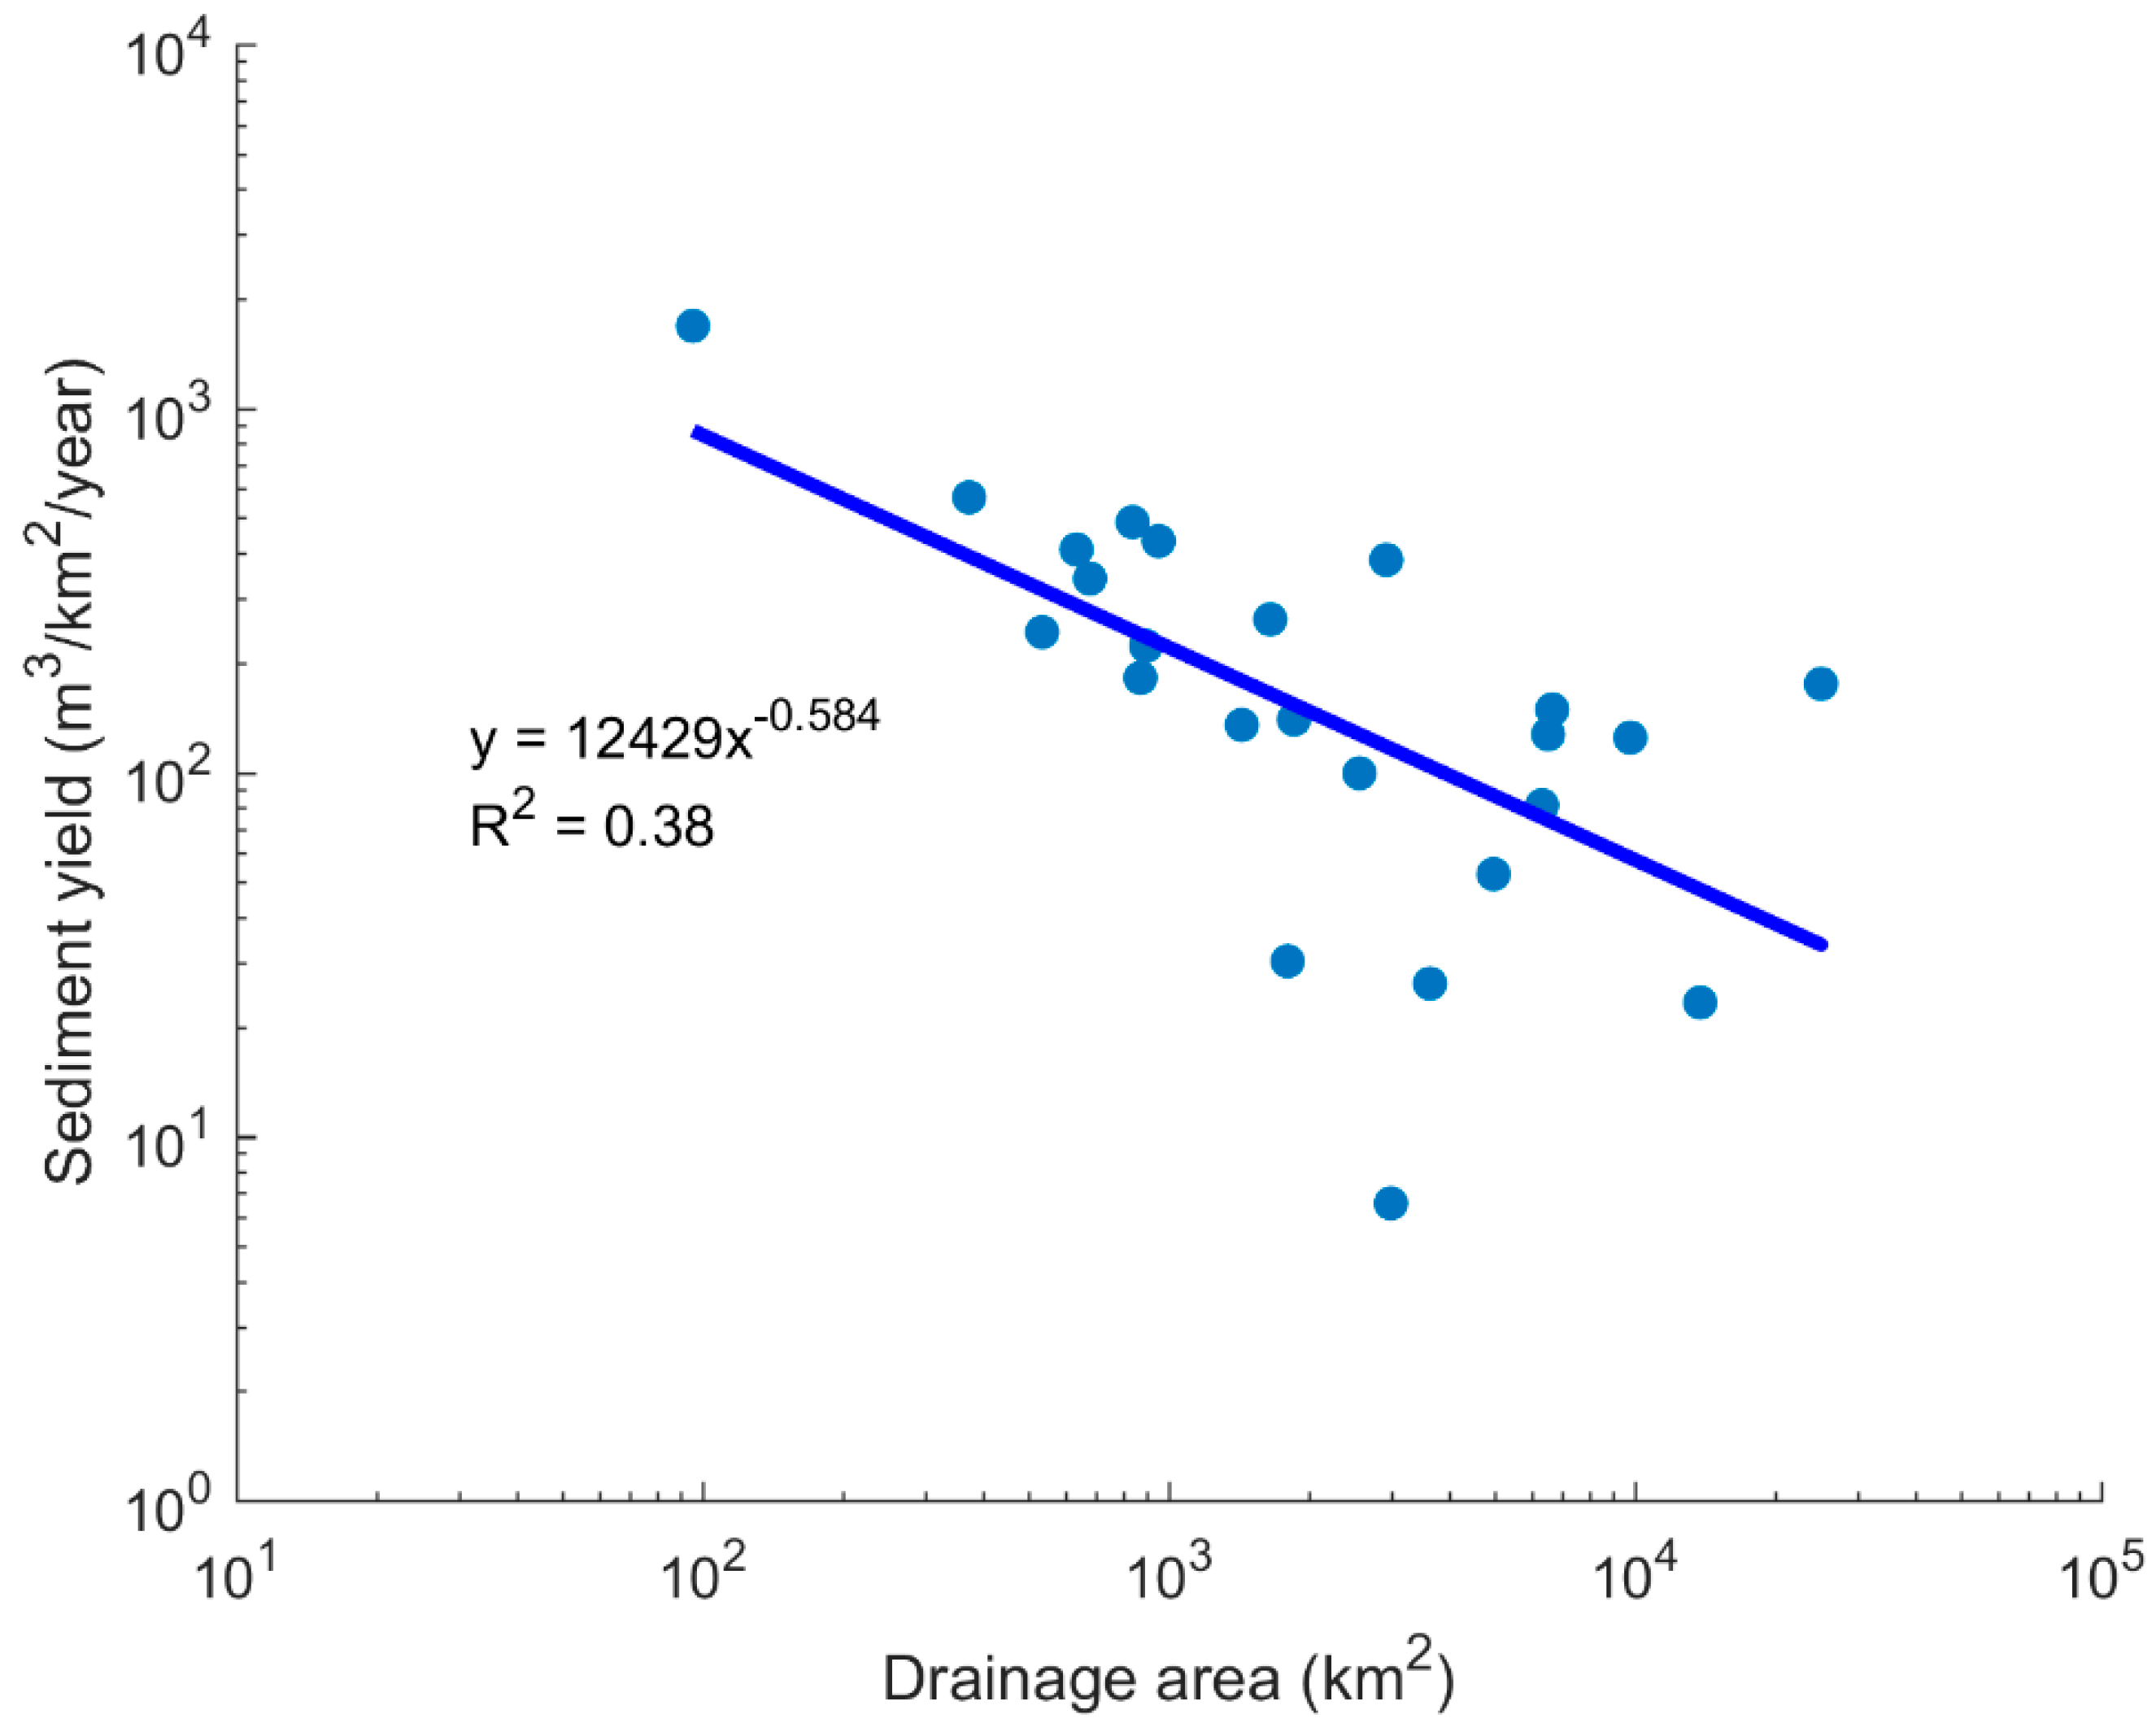
3. Results and Discussion

Physical and hydrological characteristics of the KS-FdR are summarized in Table 1. Drainage area ranges from 95 km2 (Big Hill) to 25,070 km2 (Tuttle Creek), with a total catchment area of 97,817 km2 for all the KS-FdR (72,560 km2 in Kansas, or 34% of the state; 22,733 km2 in Nebraska; and 2524 km2 in Colorado) [30]. Three KS-FdR have watersheds that cross into a neighboring state: 75% (18,862 km2) of Tuttle Creek and 40% (3872 km2) of Milford watersheds are in Nebraska, and 18% (2524 km2) of Cedar Bluff watershed is in Colorado. Generally, western and central reservoirs have larger drainage areas to help maintain adequate inflow due to the lower precipitation (and thus lower runoff) rates across their watersheds. The KS-FdR were built between the 1940s and 1980s, with the earliest gate closure (i.e., start of reservoir fill, or start of reservoir operation) occurring in 1948 (Kanopolis) and the most recent occurring in 1981 (Hillsdale). Original capacities were estimated primarily using digitized pre-impoundment topographic contour data. The most recent bathymetric surveys (and thus capacity estimates) were completed between 1998 (Cheney) and 2014 (John Redmond).
Annual depletion rate ranges from 0.02% (Webster) to 0.84% (Tuttle Creek) with a mean of 0.34%. Globally, reservoir capacity loss has been estimated to be in the range of 0.5–1% annually [11,47], but a review of the literature indicates that a broad range of capacity losses has occurred. For example, annual capacity loss is 1.5% for Tarbela Dam in Pakistan [11,48], 2% for Manwan Dam in China [49], and 0.2% on average in Ceará, Brazil, based on studying 21 reservoirs [50]. In Central Europe, a study of 19 reservoirs with storage capacity ranging from 1.5 to 226 Mm3 indicated an average annual depletion rate of 0.51% [51]. In the United States, 0.03% annual loss has been reported for Lake Mead upstream of Hoover Dam based on the sediment load in the first 13 years of dam operation [52]. By contrast, there are also cases where a reservoir was fully infilled by sediment only a few decades after dam construction; for example, full capacity loss was documented for Sweasey Dam in California in 1969 because of infilling sediment during 31 years of operation [53].
In a comprehensive reservoir study [54], the following average annual loss rates were found for different size categories: (a) 3.56% for reservoirs with V0 < 12.3 × 10³ m3 using data from 190 reservoirs, (b) 2.00% for reservoirs with 12.3 × 10³ m3 < V0 < 123.3 × 10³ m3 using data from 257 samples, (c) 1.02% for reservoirs with 123.3 × 10³ m3 < V0 < 1233 × 103 m3 using data from 283 samples, (d) 0.81% for reservoirs with 1233 × 103 m3 < V0 < 12,330 × 103 m3 using data from 176 samples, (e) 0.43% for reservoirs with 12,330 × 103 m3 < V0 < 123,300 × 103 m3 using data from 107 samples, (f) 0.23% for reservoirs with 123,300 × 103 m3 < V0 < 1,233,000 × 103 m3 using data from 69 samples, and (g) 0.16% for reservoirs with V0 > 1,233,300 × 103 m3 using data from 23 samples. These results suggest that greater capacity loss rates are observed for smaller reservoirs. The KS-FdR sizes fall in the (b) and (c) ranges from that study and exhibit lower annual loss rates, but they do show a similar general trend with annual loss decreasing as reservoir size increases (also noted in [55]) (Figure 6). An average of 0.22% annual storage loss has been documented for U.S. reservoirs with 24% of the infill sediment originating from cropland erosion [55]. Kansas is an agricultural state with about 47% of the land use within the KS-FdR catchments being classified as cropland [56], which likely contributes to the high sediment concentrations found in the state’s streams and reservoirs [57,58,59].
Total original capacity for all the KS-FdR is 3990 Mm3 where 692 Mm3 (17.3%) has been lost since the establishment of the reservoirs. Loss of capacity ranges between 1 Mm3 (1.2%) and 238 Mm3 (45.4%) for Webster and Tuttle Creek, respectively, with an average percent loss of 17.9% across all the KS-FdR (Table 1). A majority of the reservoirs with higher percent loss are located in the eastern half of Kansas, and generally the storage capacity is lower for these reservoirs compared to reservoirs in western Kansas (Figure 2 and Figure 7). Precipitation distribution follows an east-west gradient from higher to lower annual values, suggesting higher inflow to the eastern reservoirs. Streamflow is the source of sediment in the reservoirs, and higher sediment yield generally is expected in areas receiving higher precipitation [60]. Higher magnitude and frequency of extreme daily and annual rainfall events has been found in eastern Kansas [24]. Higher runoff carries more sediment, resulting in generally higher capacity loss for eastern reservoirs in Kansas [12]. For most of the state, a shift has been observed in the maximum monthly rainfall from June to May, when soil is also moister due to lower temperatures, potentially suggesting a transition to higher runoff generation earlier in spring.
Each KS-FdR should be useful for flood control well beyond the time its conservation pool is predominantly infilled. However, functionality with respect to non-flood-control design purposes is reduced when sediment starts to settle in the conservation pool. Crucial operational conditions may exist by the time the reservoir is half full of sediment [54,61,62,63] or possibly even sooner depending on factors such as pool fluctuation, lake bottom topography, sediment grain size, and intake and outflow structure design and configuration [64,65]. Furthermore, as the sediment settles in the reservoir, capacity and sediment trapping efficiency decline and the half-life period is not necessarily representative of the time it takes the reservoir to become half-filled with sediment because of shorter residence time and thus increased pass-through of suspended solids [66].
Nonetheless, if we ignore this reduction in sedimentation rate (which will be slow to build), six of the KS-FdR are projected to be half full with sediment by mid-century under the assumption that sediment infilling will continue at current rates (Table 1): Tuttle Creek (2022), Toronto (2024), John Redmond (2030 if we ignore dredging that occurred in 2016, which otherwise pushes this date back to 2033), Kanopolis (2036), Elk City (2040), and Fall River (2045). Five of these reservoirs (except Kanopolis) are located in the eastern third of the state. Originally, these six reservoirs accounted for 22% of the collective KS-FdR volume; as of 2016, this ratio has dropped to 15%, reflective of the fact that these reservoirs are losing their capacity faster than the others. Consequently, sediment upstream and within these six reservoirs may need to be managed prior to the other 18. KS-FdR, through direct extraction or release of stores downstream, are a primary source of water for various uses including drinking water and irrigation, particularly in prolonged drought periods when sufficient quantities of natural surface water baseflow are not available. Because of their critical importance for meeting the state’s water supply needs, all manner of KS-FdR sediment management techniques and strategies, both upstream and in situ, should be considered to extend their usable lifetime [36].
The state of Kansas has purchased all or some part of the conservation pool available water in 13 of the 24 KS-FdR for municipal, industrial and irrigation use. Four of these contracts are on reservoirs that are projected to be half full with sediment by 2040 (Elk City, John Redmond, Kanopolis, and Tuttle Creek). The other nine of the 13 reservoirs still have water available for purchase, though two are fully committed (Clinton and Hillsdale) [67]. With increasing population, drinking and irrigation water demands continue to increase along with water management concerns. In 2015, the state of Kansas created a long-term (50-year) Water Vision [68] to “provide Kansans with the framework, policy and tools, developed in concert with stakeholders, to manage, secure and protect a reliable, long-term statewide water supply while balancing conservation with economic growth”. One objective is to manage reservoirs sustainably while continuing to meet different domestic, agricultural, and industrial demands such as drinking water, irrigation, and recreation. With this Vision, the state hopes to anticipate and address challenges related to water including ensuring access to reliable water supply, protecting reservoirs, and reducing vulnerability to extreme events. Recommendations from the Vision could provide guidance to other regions with similar sedimentation and water challenges.
Sedimentation rate, as a physical quantity, is an absolute measure that depends on two factors, sediment yield (supply rate from the reservoir catchment) and trapping efficiency (retention rate, which is >90% for the KS-FdR). On the other hand, in its commonly used percent form, sedimentation rate provides a relative measure due to its additional dependency on reservoir volume. This is an important distinction, with the former definition appropriate for scientific examination and the latter perhaps more meaningful for reservoir prioritization for sediment management.
KS-FdR watershed sediment yield ranges from 7 m3/km2/year (Webster) to 1688 m3/km2/year (Big Hill). The average sediment yield is 268 m3/km2/year with a median of 159 m3/km2/year and a standard error about the mean of 71 m3/km2/year (Table 1). For comparison, watershed sediment yield rates for 66 surveyed reservoirs in California typically were higher than Kansas estimates, with a minimum, maximum, and mean of 8, 5085, and 413 m3/km2/year, respectively [69]. Similar rates to the KS-FdR were indicated in a different study [70], ranging approximately between 100 m3/km2/year and 1200 m3/km2/year for relatively small impoundments (drainage area < 70 km2) in southwestern Ohio.
Sediment yield has been reported using mass rather than volume by many researchers. In two maps prepared by the U.S. Department of Agriculture on sediment delivered to rivers and streams from sheet and rill erosion [71] and erosion rates on cropland [72], the Northern Plains was among the regions with the highest erosion rates in the U.S. with an average of 1.2 × 10⁶ kg/km2/year on croplands. Volume-based sediment yield values reported in this paper can be compared to the mass-based sediment yields by multiplying by sediment bulk density. An average bulk density of 1.1 t/m3 was reported [73] from the Reservoir Sedimentation Survey Information System (RESIS) for the conterminous U.S. [74]. However, we assume an average bulk density of 0.8 t/m3 for Kansas reservoirs based on sediment core samples obtained during recent regional bathymetric surveys (e.g., [75]).
The sediment delivery ratio (percentage of eroded soil amount that reaches the watershed outlet on an annual basis) to water bodies is impacted by various factors including drainage area and overland flow length [76,77]. On average, more time and opportunity are available for eroded soil to deposit in larger watersheds before reaching reservoirs located far downstream in a catchment. Consequently, the sediment delivery ratio and sediment yield are likely to be lower in larger watersheds [78,79]. Sedimentation rate and drainage area for the KS-FdR are correlated as in other regions, with sediment yield generally decreasing as drainage area increases (Figure 8). In an older study [80], sediment load was analyzed in 326 small reservoirs in Kansas with drainage areas ranging from 0.21 km2 to 98 km2, with sediment yield documented between 24 m3/km2/year and 5792 m3/km2/year. Though the sediment yields in that study with smaller watersheds are higher than the results reported here, the author also found a negative trend between drainage area and sediment yield.

4. Conclusions

Sedimentation and capacity depletion characteristics of 24 large federally operated reservoirs were examined in Kansas, an agricultural state situated in the central U.S. Great Plains. Original capacities range from 34 to 525 Mm3 and drainage areas range from 95 to 25,070 km2. Annual depletion rate and sediment yield were estimated using the most recent bathymetric surveys compared to pre-impoundment topographic data. Annual depletion rates range from 0.02% to 0.84%, with generally higher values for smaller reservoirs. Sediment yield was found to be between 7 and 1688 m3/km2/year, with generally larger values for reservoirs with smaller drainage areas. Reservoirs in wetter eastern Kansas typically exhibit higher loss of capacity than those in central and western parts of the state. As of 2016, with an average age of 52 years, Kansas has lost approximately 17% of the original capacity of its federal reservoirs to sedimentation.
Reservoir placement within a watershed typically is optimized for storing water for flood control or water supply. Consequently, finding locations with optimal geography, hydrology, topography, and geology for building new dams in the same region can be challenging [81]. For these reasons, along with other prohibitive logistical factors (e.g., economic, legal, and regulatory), new large impoundment construction currently is considered an unlikely option for Kansas as it seeks to ensure a future water supply for its citizens and industries.
Reservoir management techniques should be identified and assessed for cost effectiveness in light of the documented sedimentation rates and the increasing demands for reservoir-supplied surface water [82,83]. Several options are discussed in [36] that affect different components of the reservoir-watershed system, and a number of these are being enacted or seriously considered in Kansas. For example, in 2013, the USACE approved a 0.61-m raise of the conservation pool at John Redmond to increase available allocable water supply [84], which had the effect of extending the reservoir’s half-life by about 15 years. Kansas was compelled to action at John Redmond primarily because of a contractual water supply obligation with a local power company that extends through 2045. State officials initiated this process more than 10 years prior to approval, reflecting the difficulty in enacting conservation pool level changes when working with federal flood control reservoirs. The state’s John Redmond dredging project, which was anticipated during the pool-raise approval process, is the first such experiment in the country to recover water supply capacity in a large federal reservoir. At a cost of $20M (US), 2.3 Mm3 of sediment was removed from John Redmond in 2016 [29], which extended its half-life by an additional 2.5 years. The implied annual maintenance dredging cost for this one reservoir alone is $8M/year, which is not sustainable considering current state budget limitations for water resources management. Alternatively, USACE is exploring possibilities for sediment transport and hydrosuction sediment removal at Tuttle Creek, but as yet no action is planned [85]. With these and other in situ sediment removal options, a good understanding of lake bottom geometry and sediment deposition patterns is necessary to maximize efficiency and effectiveness.
Reducing sediment yield from the upstream watershed offers another approach to slowing sediment infill [86]. In the drainage network above several federal reservoirs, Kansas is investing heavily in streambank stabilization projects [87] to harden streambank erosion hotspots. While techniques are improving and treated lengths are adding up, it is not yet clear if these stationary treatments applied to non-stationary stream channels are effectively and sustainably slowing reservoir sedimentation. As a counter-alternative, holistic watershed management options are also being investigated in an effort to identify adaptable, sustainable, and environmentally beneficial sediment mitigation strategies (e.g., [88,89]).
Sediment management, both upstream and within the reservoir, is a rapidly growing concern as reservoir infill progresses and water retention capacities are diminished [90,91]. Climate change may yet be another factor impacting reservoir water availability for multiple uses including drinking water. More observed and projected frequent and greater flooding across the world [92] may result in greater sediment delivery to reservoirs and thus increased sedimentation rates and capacity loss in some areas, while more frequent and intense droughts will reduce the available water in many impoundments through increased evaporation and reduced storage opportunity between periods of adequate surface water inflow. Results from this study provide baseline information that will help guide and support further investigation of reservoir sedimentation and sediment management, in Kansas as well as in other regions around the world facing similar challenges. Future research directions will involve more detailed geospatial analyses of landscape and climate factors of the KS-FdR reservoir-watershed systems to better understand the sediment yields that are driving reservoir sedimentation.

Acknowledgments

The authors thank the following organizations, which provided support or partial funding for the information discussed in this study: Kansas Water Office; U.S. Army Corps of Engineers; Kansas Department of Agriculture; and U.S. Environmental Protection Agency. The data used are listed in the references and tables.

Author Contributions

Vahid Rahmani, Jude H. Kastens, Frank deNoyelles, Mark E. Jakubauskas, Edward A. Martinko, Donald H. Huggins, and Christian Gnau conceived and designed the experiments; Vahid Rahmani, Jude Kastens, Frank deNoyelles, Mark E. Jakubauskas, Edward A. Martinko, Donald H. Huggins, Christian Gnau, Paul M. Liechti, Scott W. Campbell, Ryan A. Callihan, and Adam J. Blackwood performed the experiments; Vahid Rahmani, Jude Kastens, Frank deNoyelles, Mark E. Jakubauskas, and Christian Gnau analyzed the data; Frank deNoyelles, Mark Jakubauskas, Edward A. Martinko, and Christian Gnau contributed reagents/materials/analysis tools; Vahid Rahmani, Jude H. Kastens, Frank deNoyelles wrote the paper.

Conflicts of Interest

The authors declare no conflict of interest. The founding sponsors had no role in the design of the study; in the collection, analyses, or interpretation of data; in the writing of the manuscript, and in the decision to publish the results.

References

  1. Smith, N. A History of Dams; Peter Davies: London, UK, 1971; p. 279. [Google Scholar]
  2. Ho, M.; Lall, U.; Allaire, M.; Devineni, N.; Kwon, H.H.; Pal, I.; Raff, D.; Wegner, D. The Future Role of Dams in the United States of America. Water Resour. Res. 2017, 53, 982–998. [Google Scholar] [CrossRef]
  3. Tilt, B.; Braun, Y.; He, D. Social Impacts of Large Dam Projects: A Comparison of International Case Studies and Implications for Best Practice. J. Environ. Manag. 2009, 90, S257. [Google Scholar] [CrossRef] [PubMed]
  4. McCully, P. Rivers No More: The Environmental Effects of Dams; Zed Books: London, UK, 1996. [Google Scholar]
  5. Shucheng, W. On Dam Construction and Ecological Protection. China Three Gorges Construct. 2004, 6, 4–10. [Google Scholar]
  6. Goldsmith, E.; Hildyard, N. The Social and Environmental Effects of Large Dams. Volume 1: Overview; Wadebridge Ecological Centre: Camelford, UK, 1984. [Google Scholar]
  7. Beck, J.S.; Basson, G.R. The Hydraulics of the Impacts of Dam Development on the River Morphology; Water Research Commission: Stellenbosch, South Africa, 2003. [Google Scholar]
  8. Meade, R.H.; Moody, J.A. Causes for the Decline of Suspended-Sediment Discharge in the Mississippi River System, 1940–2007. Hydrol. Process. 2010, 24, 35–49. [Google Scholar] [CrossRef]
  9. Fryirs, K. (Dis) Connectivity in Catchment Sediment Cascades: A Fresh Look at the Sediment Delivery Problem. Earth Surf. Process. Landf. 2013, 38, 30–46. [Google Scholar] [CrossRef]
  10. Asselman, N.E.; Middelkoop, H. Floodplain Sedimentation: Quantities, Patterns and Processes. Earth Surf. Process. Landf. 1995, 20, 481–499. [Google Scholar] [CrossRef]
  11. Mahmood, K. Reservoir Sedimentation: Impact, Extent, and Mitigation; International Bank for Reconstruction and Development: Washington, DC, USA, 1987. [Google Scholar]
  12. Meade, R.H.; Parker, R.S. Sediment in Rivers of the United States. US Geol. Surv. Water-Suppl. Pap. 1985, 2275, 49–60. [Google Scholar]
  13. Huntzinger, T.L. Surface water: A critical resource of the Great Plains. In Conservation of Great Plains Ecosystems: Current Science, Future Options; Springer: Amsterdam, The Netherlands, 1995; pp. 253–273. [Google Scholar]
  14. Annandale, G. Quenching the Thirst: Sustainable Water Supply and Climate Change; CreateSpace Independent Publishing Platform: North Charleston, SC, USA, 2013. [Google Scholar]
  15. De Noyelles, F.; Jakubauskas, M. Current State, Trend, and Spatial Variability of Sediment in Kansas Reservoirs. In Sedimentation in Our Reservoirs: Causes and Solutions; Kansas State University Agricultural Experiment Station and Cooperative Extension Service: Manhattan, KS, USA, 2008; pp. 9–23. [Google Scholar]
  16. Texas State Historical Association (TSHA). Lakes and Reservoirs. Available online: http://www.texasalmanac.com/topics/environment/lakes-and-reservoirs (accessed on 13 September 2017).
  17. Vance, B.; Whitley, D.; Mills, O. Lakes of Oklahoma, 2nd ed.; Oklahoma Water Resources Board and Oklahoma Department of Wildlife Conservation: Oklahoma City, OK, USA, 2012; p. 179. [Google Scholar]
  18. Hurd, B.; Leary, N.; Jones, R.; Smith, J. Relative Regional Vulnerability of Water Resources to Climate Change. J. Am. Water Resour. Assoc. 1999, 35, 1399–1409. [Google Scholar] [CrossRef]
  19. Sophocleous, M. From Safe Yield to Sustainable Development of Water Resources—The Kansas Experience. J. Hydrol. 2000, 235, 27–43. [Google Scholar] [CrossRef]
  20. Wen, F.; Chen, X. Evaluation of the Impact of Groundwater Irrigation on Streamflow in Nebraska. J. Hydrol. 2006, 327, 603–617. [Google Scholar] [CrossRef]
  21. Young, D.P.; Buddemeier, R.W. Climate Variation: Implications of Long-Term Records and Recent Observations; Kansas Geological Survey: Lawrence, KS, USA, 2002. [Google Scholar]
  22. Milly, P.C.; Dunne, K.A.; Vecchia, A.V. Global Pattern of Trends in Streamflow and Water Availability in a Changing Climate. Nature 2005, 438, 347–350. [Google Scholar] [CrossRef] [PubMed]
  23. Rosenberg, N.J.; Brown, R.A.; Izaurralde, R.C.; Thomson, A.M. Integrated Assessment of Hadley Centre (HadCM2) Climate Change Projections on Agricultural Productivity and Irrigation Water Supply in the Conterminous United States: I. Climate Change Scenarios and Impacts on Irrigation Water Supply Simulated with the HUMUS Model. Agric. For. Meteorol. 2003, 117, 73–96. [Google Scholar]
  24. Rahmani, V.; Hutchinson, S.L.; Harrington, J.A.; Hutchinson, J.M.S. Analysis of Frequency and Magnitude of Extreme Rainfall Events with Potential Impacts on Flooding; a Case Study from the Central United States. Int. J. Climatol. 2016, 36, 3578–3587. [Google Scholar] [CrossRef]
  25. Kansas Water Office (KWO). Reservoir Information. Available online: https://kwo.ks.gov/reservoirs (accessed on 13 September 2017).
  26. Martinko, E.; deNoyelles, J.; Bosnak, K.; Jakubauskas, M.; Huggins, D.; Kastens, J.; Shreders, A.; Baker, D.; Blackwood, A.; Campbell, S.; et al. Atlas of Kansas Lakes: A resource for Communities, Policy Makers and Planners; Kansas Biological Survey: Lawrence, KS, USA, 2014. [Google Scholar]
  27. Johnston, S. Uncertainty in Bathymetric Surveys; U.S. Army Engineer Research and Development Center, Defense Technical Information Center: Fort Belvoir, VA, USA, 2003. [Google Scholar]
  28. Schmitt, T.; Mitchell, N.C.; Ramsay, A.T.S. Characterizing Uncertainties for Quantifying Bathymetry Change between Time-Separated Multibeam Echo-Sounder Surveys. Cont. Shelf Res. 2008, 28, 1166–1176. [Google Scholar] [CrossRef]
  29. Kansas Water Office (KWO). John Redmond Dredging Initiative. Available online: http://kwo.ks.gov/projects/john-redmond-dredging (accessed on 13 September 2017).
  30. USGS National Hydrography Dataset (NHD). United Sates Geological Survey, Department of the Interior. Available online: http://nhd.usgs.gov/data.html (accessed on 20 September 2015).
  31. United States Environmental Protection Agency (USEPA). Western Ecology Division. Available online: http://www.epa.gov/wed/pages/ecoregions.htm (accessed on 20 September 2015).
  32. Kenny, J.F. Public-Supply Water Use in Kansas, 1990–2012; U.S. Geological Survey: Reston, VA, USA, 2014.
  33. PRISM Climate Group. PRISM Climate Data. Northwest Alliance for Computational Science & Engineering. Available online: http://prism.oregonstate.edu (accessed on 13 September 2017).
  34. Rahmani, V.; Hutchinson, S.L.; Hutchinson, J.M.S.; Aavudai, A. Extreme Daily Rainfall Event Distribution Patterns in Kansas. J. Hydrol. Eng. 2014, 19, 707–716. [Google Scholar] [CrossRef]
  35. Rahmani, V.; Hutchinson, S.L.; Harrington, J.A., Jr.; Hutchinson, J.M.S.; Anandhi, A. Analysis of Temporal and Spatial Distribution and Change-Points for Annual Precipitation in Kansas, USA. Int. J. Climatol. 2015, 35, 3879–3887. [Google Scholar] [CrossRef]
  36. DeNoyelles, F.; Kastens, J.H. Reservoir Sedimentation Challenges Kansas. Trans. Kans. Acad. Sci. 2016, 119, 69–81. [Google Scholar] [CrossRef]
  37. Liechti, P.M.; Jakubauskas, M.; deNoyelles, J.; Martinko, E.A. Characterization and Mapping of Sediment Thickness and Pattern in John Redmond Reservoir, Coffey County, Kansas; Applied Science and Technology for Reservoir Assessment Program, Kansas Biological Survey: Lawrence, KS, USA, 2014.
  38. Baker, D.; Everhart, R.; Huggins, D.; Bennett, L.; Blackwood, A. Biological Impairment in Three Kansas Reservoirs and Associated Lotic Ecosystems due to Sediment and Nutrients; Kansas Biological Survey: Lawrence, KS, USA, 2014. [Google Scholar]
  39. Institute for Policy & Social Research (IPSR). Kansas Statistical Abstract 2015; Institute for Policy & Social Research: Lawrence, KS, USA, 2016. [Google Scholar]
  40. U.S. Census Bureau. State Population Total. U.S. Department of Commerce. Available online: https://www.census.gov/data/tables/2016/demo/popest/state-total.html (accessed on 28 May 2017).
  41. Jakubauskas, M.; deNoyelles, J.; Martinko, E. Bathymetric Survey of John Redmond Reservoir, Coffey County, Kansas; Kansas Biological Survey, Applied Science and Technology for Reservoir Assessment Program, Kansas Biological Survey: Lawrence, KS, USA, 2014. [Google Scholar]
  42. Shotbolt, L.A.; Thomas, A.D.; Hutchinson, S.M. The use of Reservoir Sediments as Environmental Archives of Catchment Inputs and Atmospheric Pollution. Prog. Phys. Geogr. 2005, 29, 337–361. [Google Scholar] [CrossRef]
  43. Juracek, K.E. Suspended-Sediment Loads and Reservoir Sediment Trap Efficiency for Clinton Lake, Kansas, 2010–2012; United States Geological Survey: Reston, VA, USA, 2013.
  44. Vanoni, V.A. Sedimentation Engineering; American Society of Civil Engineers: Reston, VA, USA, 2006; p. 418. [Google Scholar]
  45. Brune, G.M. Trap Efficiency of Reservoirs. Eos Trans. Am. Geophys. Union 1953, 34, 407–418. [Google Scholar] [CrossRef]
  46. Negm, A.; Elsahabi, M.; Ali, K. A Satellite Remote Sensing Approach to Estimate the Lifetime Span of Aswan High Dam Reservoir; Springer: Cham, Switzerland, 2017. [Google Scholar]
  47. Sumi, T.; Okano, M.; Takata, Y. Reservoir Sedimentation Management with Bypass Tunnels in Japan. In Proceedings of the Ninth International Symposium on River Sedimentation, Yichang, China, 18–21 October 2004; pp. 1036–1043. [Google Scholar]
  48. Tate, E.L.; Farquharson, F.A. Simulating Reservoir Management Under the Threat of Sedimentation: The Case of Tarbela Dam on the River Indus. Water Resour. Manag. 2000, 14, 191–208. [Google Scholar] [CrossRef]
  49. Fu, K.D.; He, D.M.; Lu, X.X. Sedimentation in the Manwan Reservoir in the Upper Mekong and its Downstream Impacts. Quat. Int. 2008, 186, 91–99. [Google Scholar] [CrossRef]
  50. De Araújo, J.C.; Guntner, A.; Bronstert, A. Loss of Reservoir Volume by Sediment Deposition and its Impact on Water Availability in Semiarid Brazil. Hydrol. Sci. J. 2006, 51, 157–170. [Google Scholar] [CrossRef]
  51. Glymph, L.M. Summary: Sedimentation of Reservoirs. In Man-Made Lakes: Their Problems and Environmental Effects; American Geophysical Union: Washington, DC, USA, 1973; pp. 342–348. [Google Scholar]
  52. Smith, W.O.; Vetter, C.P.; Cummings, G.B. Comprehensive Survey of Sedimentation in Lake Mead, 1948–49; US Government Printing Office: Washington, DC, USA, 1960.
  53. Mount, J.F. California Rivers and Streams: The Conflict between Fluvial Process and Land Use; University of California Press: Berkeley, CA, USA, 1995. [Google Scholar]
  54. Dendy, F.M.; Champion, W.A.; Wilson, R.B. Reservoir sedimentation surveys in the United States. In Man-Made Lakes: Their Problems and Environmental Effects; American Geophysical Union: Washington, DC, USA, 1973; pp. 349–357. [Google Scholar]
  55. Crowder, B.M. Economic Costs of Reservoir Sedimentation: A Regional Approach to Estimating Cropland Erosion Damage. J. Soil Water Conserv. 1987, 42, 194–197. [Google Scholar]
  56. Homer, C.G.; Dewitz, J.A.; Yang, L.; Jin, S.; Danielson, P.; Xian, G.; Coulston, J.; Herold, N.D.; Wickham, J.D.; Megown, K. Completion of the 2011 National Land Cover Database for the Conterminous United States-Representing a Decade of Land Cover Change Information. Photogramm. Eng. Remote Sens. 2015, 81, 345–354. [Google Scholar]
  57. Callihan, R.A. Distribution, Proliferation and Significance of Small Impoundments in Kansas; University of Kansas: Lawrence, KS, USA, 2013. [Google Scholar]
  58. Verstraeten, G.; Prosser, I.P.; Fogarty, P. Predicting the Spatial Patterns of Hillslope Sediment Delivery to River Channels in the Murrumbidgee Catchment, Australia. J. Hydrol. 2007, 334, 440–454. [Google Scholar] [CrossRef]
  59. Doetterl, S.; Van Oost, K.; Six, J. Towards Constraining the Magnitude of Global Agricultural Sediment and Soil Organic Carbon Fluxes. Earth Surf. Process. Landf. 2012, 37, 642–655. [Google Scholar] [CrossRef]
  60. Langbein, W.B.; Schumm, S.A. Yield of Sediment in Relation to Mean Annual Precipitation. Eos Trans. Am. Geophys. Union 1958, 39, 1076–1084. [Google Scholar] [CrossRef]
  61. Morris, G.L.; Annandale, G.; Hotchkiss, R. Reservoir Sedimentation. In Sedimentation Engineering: Processes, Measurements, Modeling, and Practice; American Society of Civil Engineers: Reston, VA, USA, 2008; pp. 579–612. [Google Scholar]
  62. Morris, G.L.; Fan, J. Reservoir Sedimentation Handbook: Design and Management of Dams, Reservoirs, and Watersheds for Sustainable Use; McGraw Hill Professional: New York, NY, USA, 1998. [Google Scholar]
  63. Murthy, B.N. Life of Reservoir; Central Board of Irrigation and Power: New Delhi, India, 1977. [Google Scholar]
  64. Garcia, M. Sedimentation Engineering: Processes, Measurements, Modeling, and Practice; American Society of Civil Engineers: Reston, VA, USA, 2008; p. 1132. [Google Scholar]
  65. Strand, R.I.; Pemberton, E.L. Reservoir Sedimentation Technical Guidelines for Bureau of Reclamation; US Bureau of Reclamation: Denver, CO, USA, 1982.
  66. Lajczak, A. Modelling the Long-Term course of Non-Flushed Reservoir Sedimentation and Estimating the Life of Dams. Earth Surf. Process. Landf. 1996, 21, 1091–1107. [Google Scholar] [CrossRef]
  67. Kansas Water Office (KWO). Surplus Water Available in Water Marketing Program Lakes Calendar Year 2015; Kansas Water Office: Topeka, KS, USA, 2015.
  68. Kansas Water Office (KWO). Kansas Water Vision. Kansas Water Office. Available online: http://kwo.ks.gov/water-vision-water-plan/water-vision (accessed on 17 January 2018).
  69. Minear, J.T.; Kondolf, G.M. Estimating Reservoir Sedimentation Rates at Large Spatial and Temporal Scales: A Case Study of California. Water Resour. Res. 2009, 45. [Google Scholar] [CrossRef]
  70. Renwick, W.H.; Carlson, K.J.; Hayes-Bohanan, J.K. Trends in Recent Reservoir Sedimentation Rates in Southwestern Ohio. J. Soil Water Conserv. 2005, 60, 72–79. [Google Scholar]
  71. National Resources Conservation Service (NRCS). Sediment Delivered to Rivers and Streams from Sheet and Rill Erosion; US Department of Agricutlure: Washington, DC, USA, 1997.
  72. National Resources Conservation Service (NRCS). Soil Erosion on Cropland 2007; National Resources Conservation Service (NRCS): Washington, DC, USA, 2009.
  73. Renwick, W.H.; Smith, S.V.; Bartley, J.D.; Buddemeier, R.W. The Role of Impoundments in the Sediment Budget of the Conterminous United States. Geomorphology 2005, 71, 99–111. [Google Scholar] [CrossRef]
  74. Steffen, L.J. A Reservoir Sedimentation Survey Information system—RESIS. In Proceedings of the Sixth Federal Interagency Sedimentation Conference, Las Vegas, NV, USA, 10–14 March 1996; pp. 10–14. [Google Scholar]
  75. Jakubauskas, M.; deNoyelles, J.; Martinko, E.A. Bathymetric and Sediment Survey of Elk City Reservoir, Montgomery County, Kansas; Applied Science and Technology for Reservoir Assessment Program, Kansas Biological Survey: Lawrence, KS, USA, 2011. [Google Scholar]
  76. Boyce, R.C. Sediment Routing with Sediment Delivery Ratios; Present and Prospective Technology for Predicting Sediment Yields and Sources, Publ. ARS-S-40; U.S. Department of Agriculture: Washington, DC, USA, 1975; pp. 61–65.
  77. Hrissanthou, V. Computation of Lake or Reservoir Sedimentation in Terms of Soil Erosion. In Sediment Transport in Aquatic Environments; InTech: Rijeka, Croatia, 2011. [Google Scholar]
  78. Lane, L.J.; Hernandez, M.; Nichols, M. Processes Controlling Sediment Yield from Watersheds as Functions of Spatial Scale. Environ. Model. Softw. 1997, 12, 355–369. [Google Scholar] [CrossRef]
  79. Birkinshaw, S.J.; Bathurst, J.C. Model Study of the Relationship between Sediment Yield and River Basin Area. Earth Surf. Process. Landf. 2006, 31, 750–761. [Google Scholar] [CrossRef]
  80. Holland, D.D. Sediment Yields from Small Drainage Areas in Kansas; Kansas Water Resources Board: Topeka, KS, USA, 1971. [Google Scholar]
  81. Kondolf, G.M.; Gao, Y.; Annandale, G.W.; Morris, G.L.; Jiang, E.; Zhang, J.; Cao, Y.; Carling, P.; Fu, K.; Guo, Q. Sustainable Sediment Management in Reservoirs and Regulated Rivers: Experiences from Five Continents. Earth Future 2014, 2, 256–280. [Google Scholar] [CrossRef]
  82. Schleiss, A.J.; Franca, M.J.; Juez, C.; De Cesare, G. Reservoir Sedimentation. J. Hydraul. Res. 2016, 54, 595–614. [Google Scholar] [CrossRef]
  83. George, M.W.; Hotchkiss, R.H.; Huffaker, R. Reservoir Sustainability and Sediment Management. J. Water Resour. Plan. Manag. 2016, 143, 04016077. [Google Scholar] [CrossRef]
  84. U.S. Army Corps of Engineers. Water Supply Storage Reallocation John Redmond Dam and Reservoir, Kansas; U.S. Army Corps of Engineers: Tulsa, OK, USA, 2013.
  85. United State Army Corps of Engineers. Tuttle Creek Lake Hydrosuction Assessment; United State Army Corps of Engineers: Kansas City, KS, USA, 2017.
  86. Fox, G.A.; Sheshukov, A.; Cruse, R.; Kolar, R.L.; Guertault, L.; Gesch, K.R.; Dutnell, R.C. Reservoir Sedimentation and Upstream Sediment Sources: Perspectives and Future Research Needs on Streambank and Gully Erosion. Environ. Manag. 2016, 57, 945–955. [Google Scholar] [CrossRef] [PubMed]
  87. Kansas Water Office (KWO). Streambank Stabilization Projects. Available online: https://kwo.ks.gov/projects/streambank-stabilization-projects (accessed on 25 October 2017).
  88. Huggins, D.; Kastens, J.; Baker, D.; Freeman, C. Conversion of Existing Farm Ponds to Wetlands in Agricultural Landscapes for Mitigation, Land Use Treatment and Conservation with a Perspective toward Climate Change; Kansas Biological Survey: Lawrence, KS, USA, 2017. [Google Scholar]
  89. Kansas Alliance for Wetlands and Streams (KAWS). Flint Hills Stream the Subject of Holistic Watershed Management Plan. Available online: http://www.kaws.org/news/flinthillsstreamthesubjectofholisticwatershedmanagementplan (accessed on 25 October 2017).
  90. Falinski, K.; Penn, D. Loss of Reservoir Capacity through Sedimentation in Hawai i: Management Implications for the Twenty-First Century. Pac. Sci. 2018, 72, 1–19. [Google Scholar] [CrossRef]
  91. Podolak, C.J.; Doyle, M.W. Reservoir Sedimentation and Storage Capacity in the United States: Management Needs for the 21st Century. J. Hydraul. Eng. 2015, 141, 02515001. [Google Scholar] [CrossRef]
  92. IPCC. Summary for Policymakers. In Climate Change 2013: The Physical Science Basis; Stocker, T.F., Qin, D., Plattner, G.-K., Tignor, M., Allen, S.K., Boschung, J., Nauels, A., Xia, Y., Bex, V., Midgley, P.M., Eds.; Contribution of Working Group I to the Fifth Assessment Report of the Intergovernmental Panel on Climate Change; Cambridge University Press: Cambridge, UK; New York, NY, USA, 2013. [Google Scholar]
Figure 1. Waterbody summary information from the U.S. Geological Survey National Hydrography Dataset (NHD) is shown for the U.S. Great Plains [30,31]. Aggregation zones used in the main map are county boundaries. 24 federally constructed reservoirs in the central state of Kansas (most of which correspond with blue dots) are the focus of this sedimentation study.
Water 10 00190 g001
Figure 2. Watershed extents are shown for the KS-FdR, overlaid on an average annual precipitation map developed using PRISM climatological normal data (1981–2010) [33]. Harlan County Lake, a federal reservoir in Nebraska that is not part of the study, serves as the upstream watershed boundary for Milford.
Water 10 00190 g002
Figure 3. Population density (est. 2010) across Kansas, by county. The 24 KS-FdR locations are also shown.
Water 10 00190 g003
Figure 4. Linearly projected declining KS-FdR total storage capacity is shown against estimated Kansas population increase of 17,131/year described in the text. Percent of original total capacity is noted on the bars.
Water 10 00190 g004
Figure 5. Bathymetric survey points collected in 2014 for John Redmond Reservoir are shown. Sample points appear as continuous lines due to the dense sampling (roughly 4 m between successive points) along the sample paths. Approximately 65,000 depth values were collected during this survey, along paths spaced approximately 150 m apart. Background imagery is from the 2012 U.S. Department of Agriculture National Agricultural Imagery Program (NAIP) dataset.
Water 10 00190 g005
Figure 6. Consistent with other studies, annual depletion rate was found to be (weakly) inversely correlated with original capacity for the KS-FdR.
Water 10 00190 g006
Figure 7. Capacity (lines) and capacity loss (bars) are shown for the KS-FdR. Blue bars denote reservoirs in the western half of the state.
Water 10 00190 g007
Figure 8. Consistent with other studies, sediment yield was found to be inversely correlated with drainage area for the KS-FdR.
Water 10 00190 g008
Table 1. Physical and hydrological characteristics of the 24 federally operated reservoirs in Kansas (KS-FdR).
ReservoirW (km2)t0 (year)V0 (Mm3)tr (year)Vr (Mm3)Vc (Mm3)Lc (%)D (%)Y (m3/km2/year)t1/2 (year)Bathymetric Data Source *
Big Hill951980342010292817.30.4816882085USACE
Cedar Bluff13,794195022920002132089.30.14232306BOR
Cheney2566196420619981971936.50.12992368USGS
Clinton950197715920091461439.90.264332172KBS
Council Grove6771963652008545218.90.363412104KBS
El Dorado634197920220041961934.70.134102369OWRB
Elk City16501965652008464334.20.672632040KBS
Fall River14331948372010262435.10.521352045KBS
Hillsdale3721981101200995947.30.215712220KBS
John Redmond664219631262014787639.60.751422030KBS
Kanopolis63221948902007605538.90.57812036KBS
Keith Sebelius1799196445200043426.40.12302373BOR
Kirwin3635195512320131171174.80.08262597KBS
Lovewell8941957552011444321.30.362232096KBS
Marion5351967105200899986.00.122432371KBS
Melvern869197219020091851833.60.081822575KBS
Milford97771967512200946045211.80.241252177USACE
Perry29241966300200924723820.60.414242088USACE
Pomona8351963872009686624.70.474882071KBS
Toronto18541959342010201944.20.771402024KBS
Tuttle Creek25,0701962525200931728645.40.841752022USACE
Waconda65181967299200127125813.50.281272148BOR
Webster2997195695201194941.20.0274388KBS
Wilson4976196330620082942924.50.09532548KBS
Sum97,817 3990 3298
Mean4076 166 13717.90.34268
Median1827 114 9612.60.27159
Max25,070 525 45245.40.841688
Min95 34 191.20.027
W is the drainage area, t0 is the beginning of reservoir operation, V0 is the original reservoir capacity, tr is the date of the most recent survey, Vr is the reservoir capacity at the most recent bathymetric survey, Vc is the reservoir capacity in the year 2016, Lc is the loss of capacity to 2016, D is the annual depletion rate, Y is the sediment yield, and t1/2 is the year that half of the reservoir will be infilled by sediment. * USACE = U.S. Army Corps of Engineers; BOR = U.S. Bureau of Reclamation; USGS = U.S. Geological Survey; KBS = Kansas Biological Survey; OWRB = Oklahoma Water Resources Board.

