Experimental Optimization of Gate-Opening Modes to Minimize Near-Field Vibrations in Hydropower Stations


Abstract
:1. Introduction
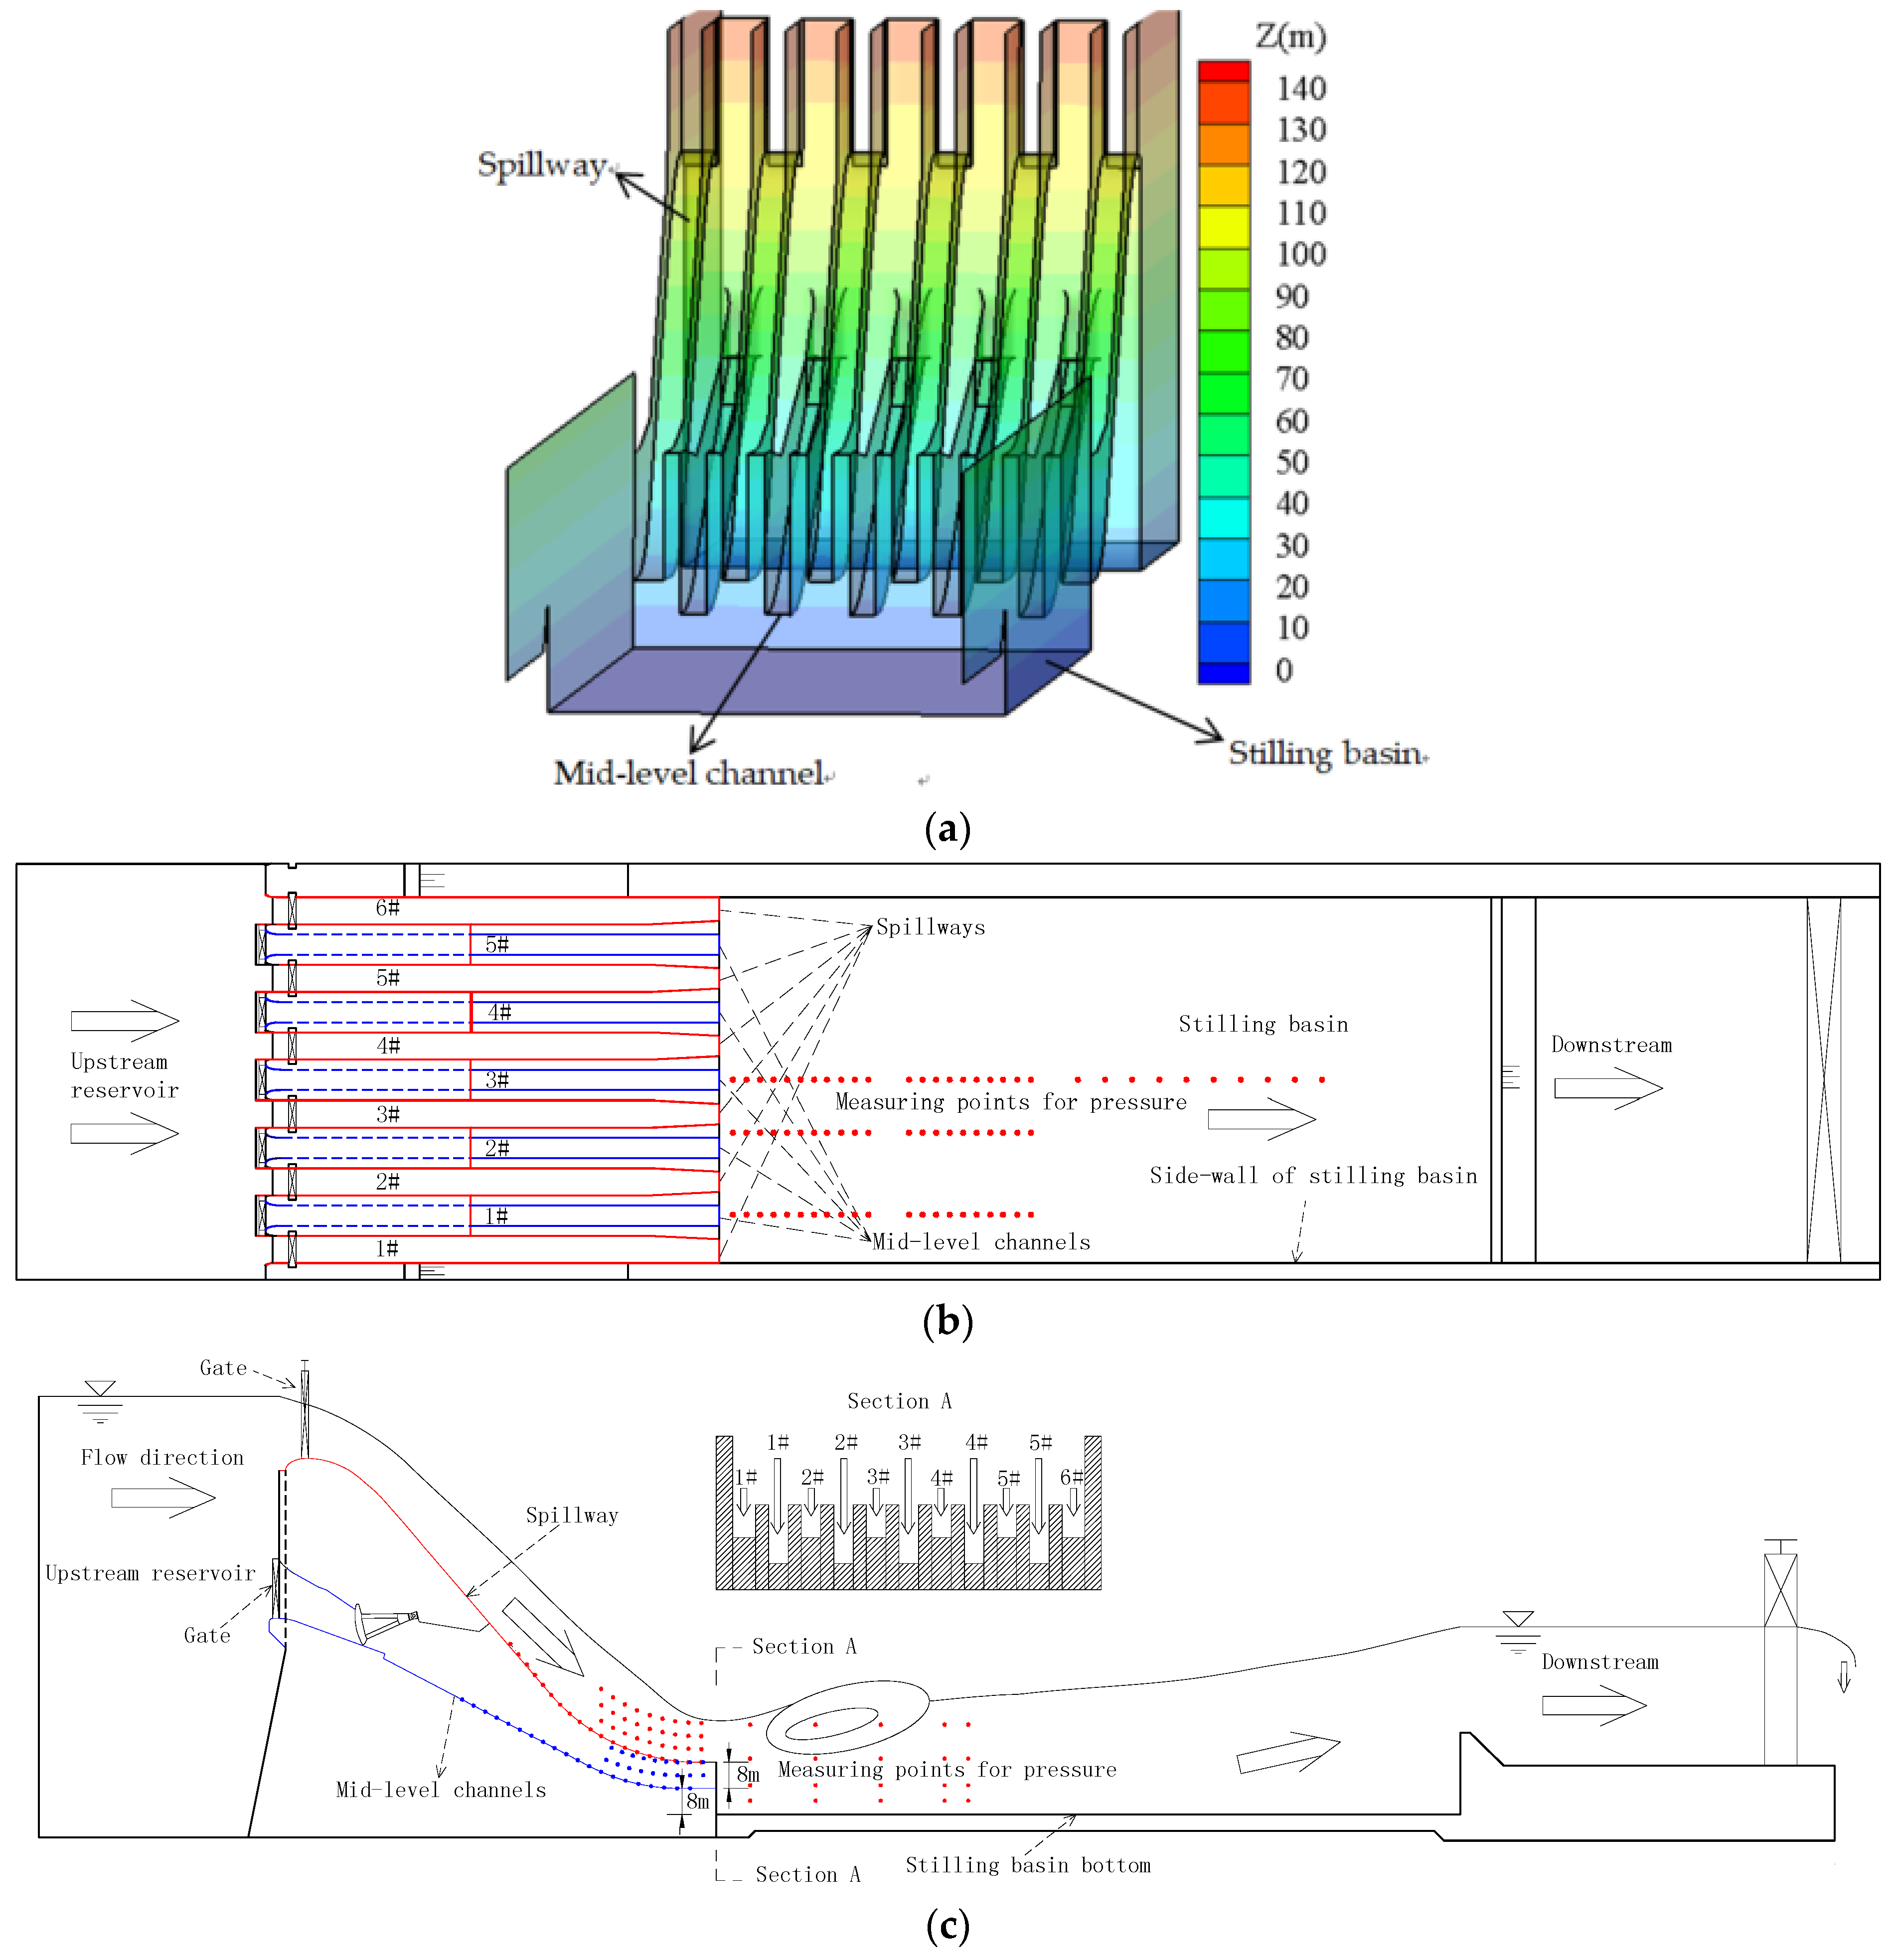
2. Methods
3. Results and Discussion
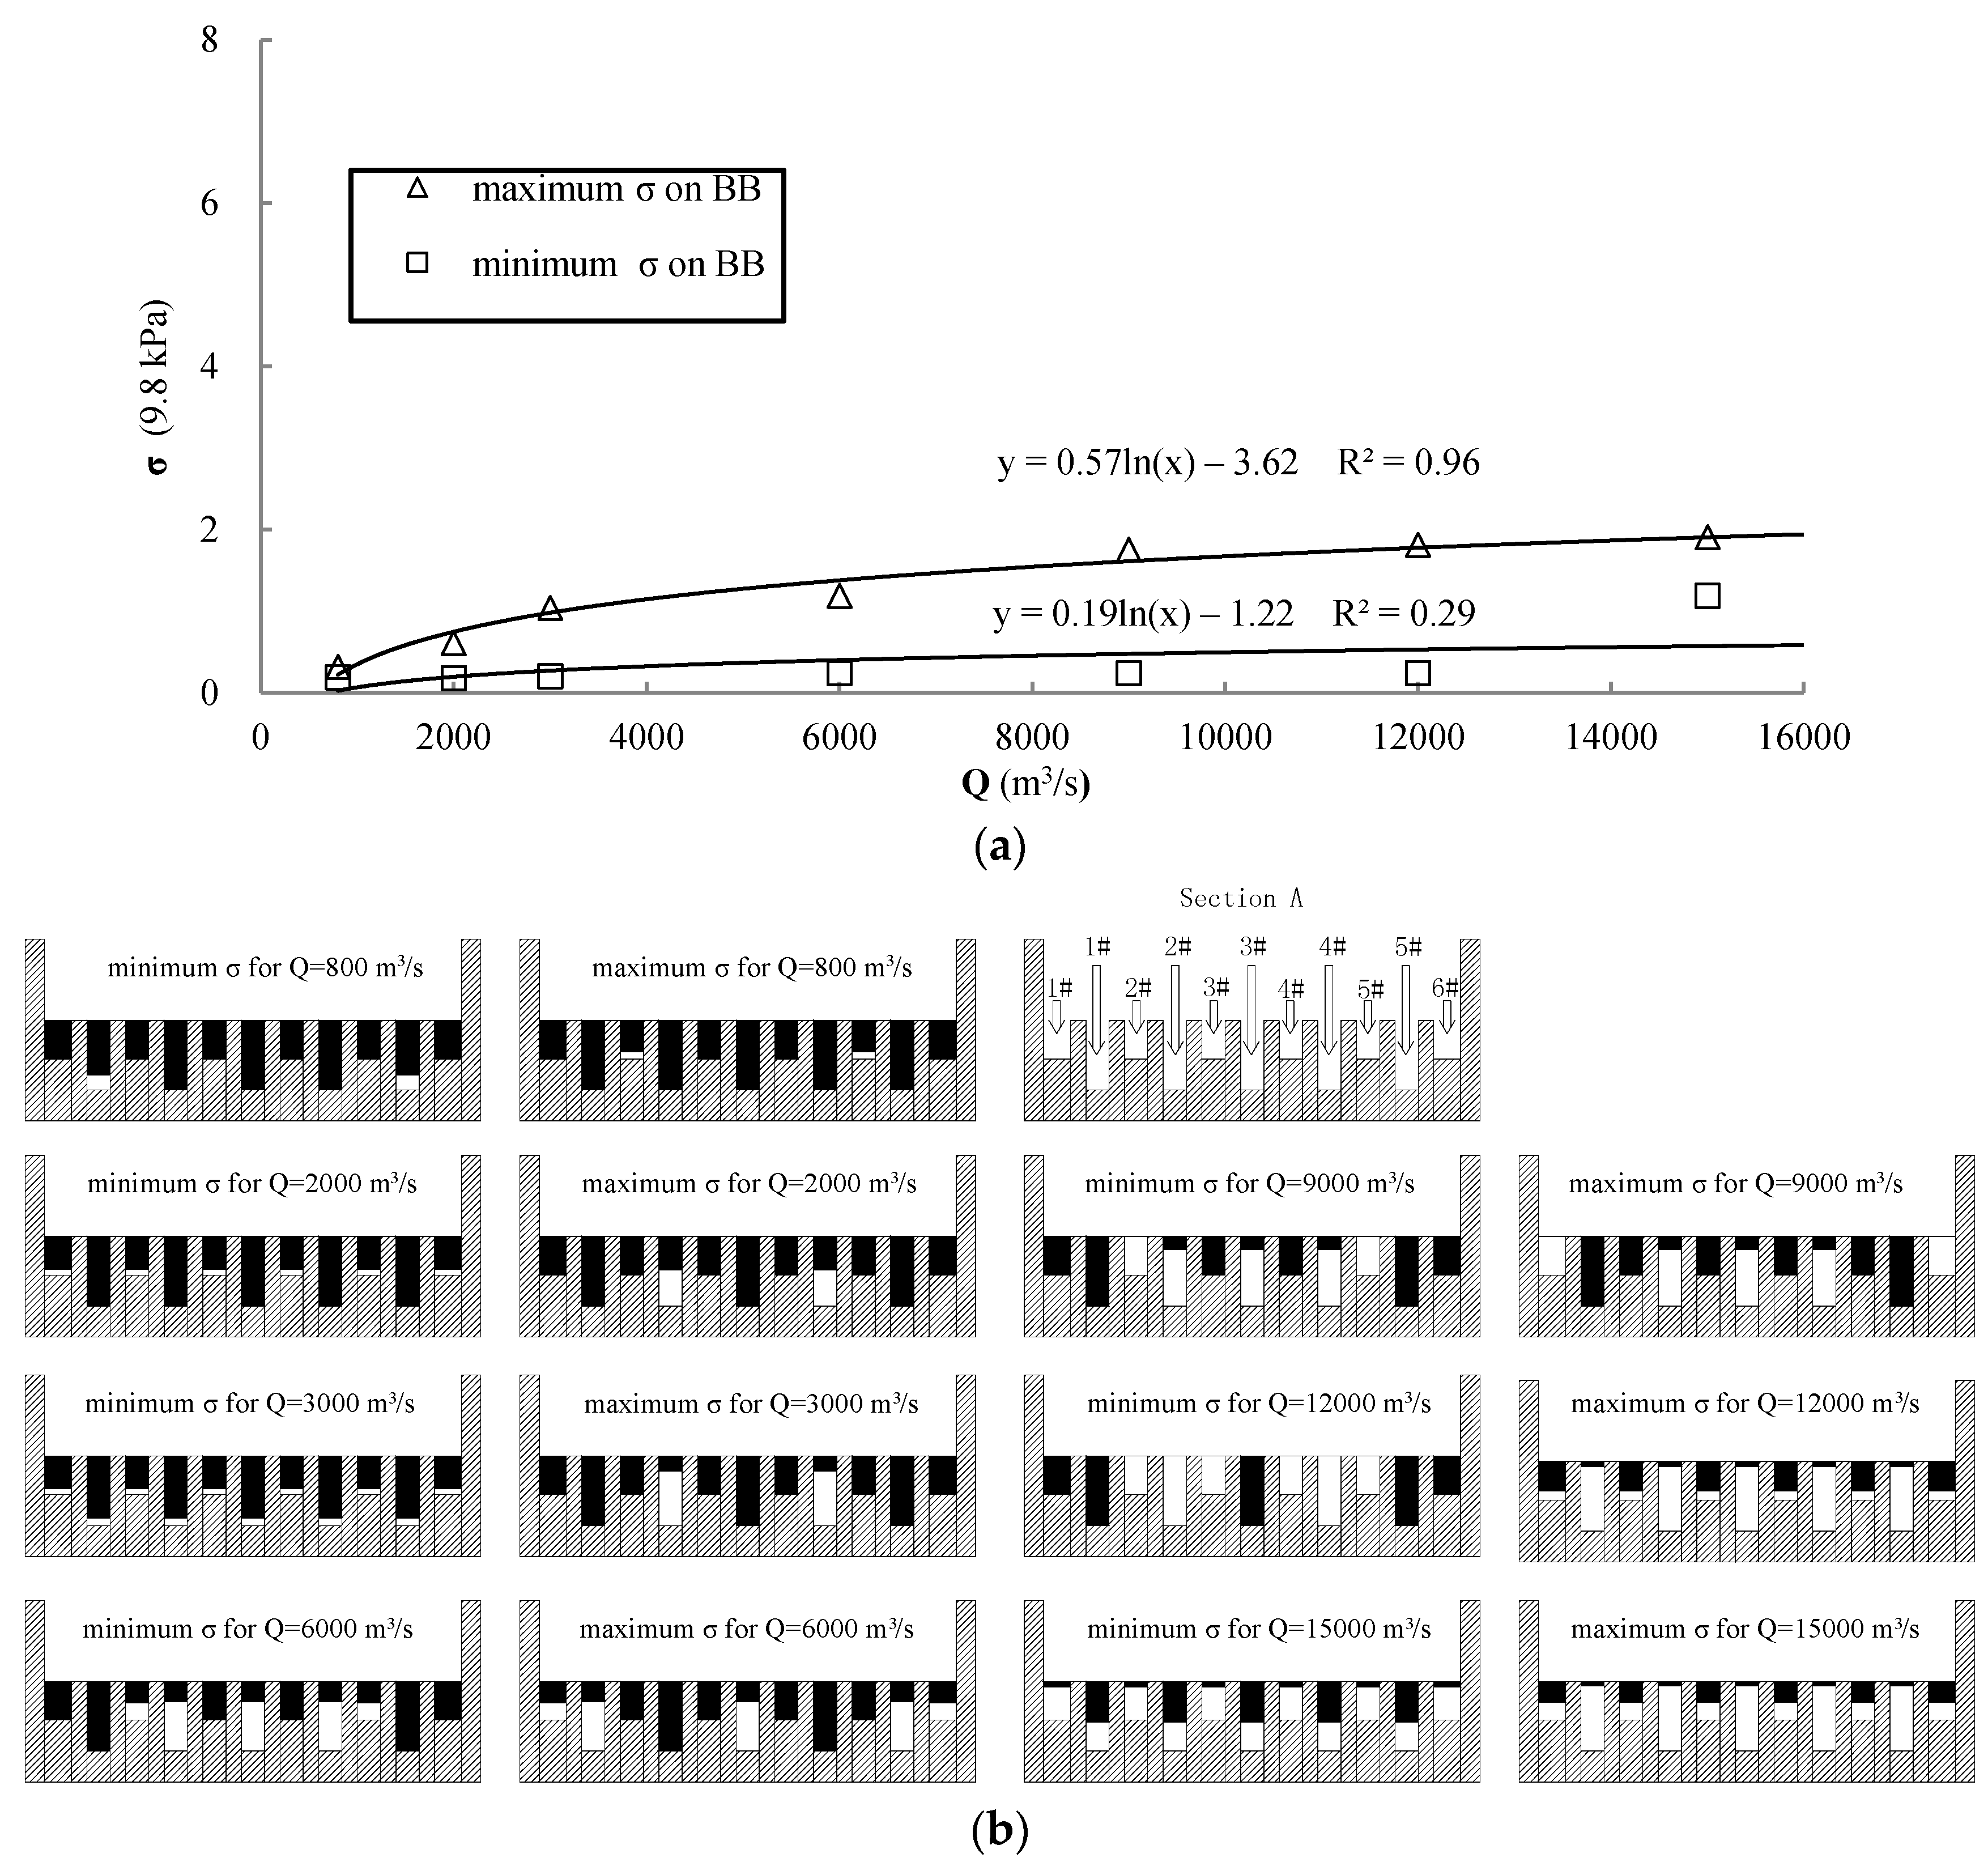
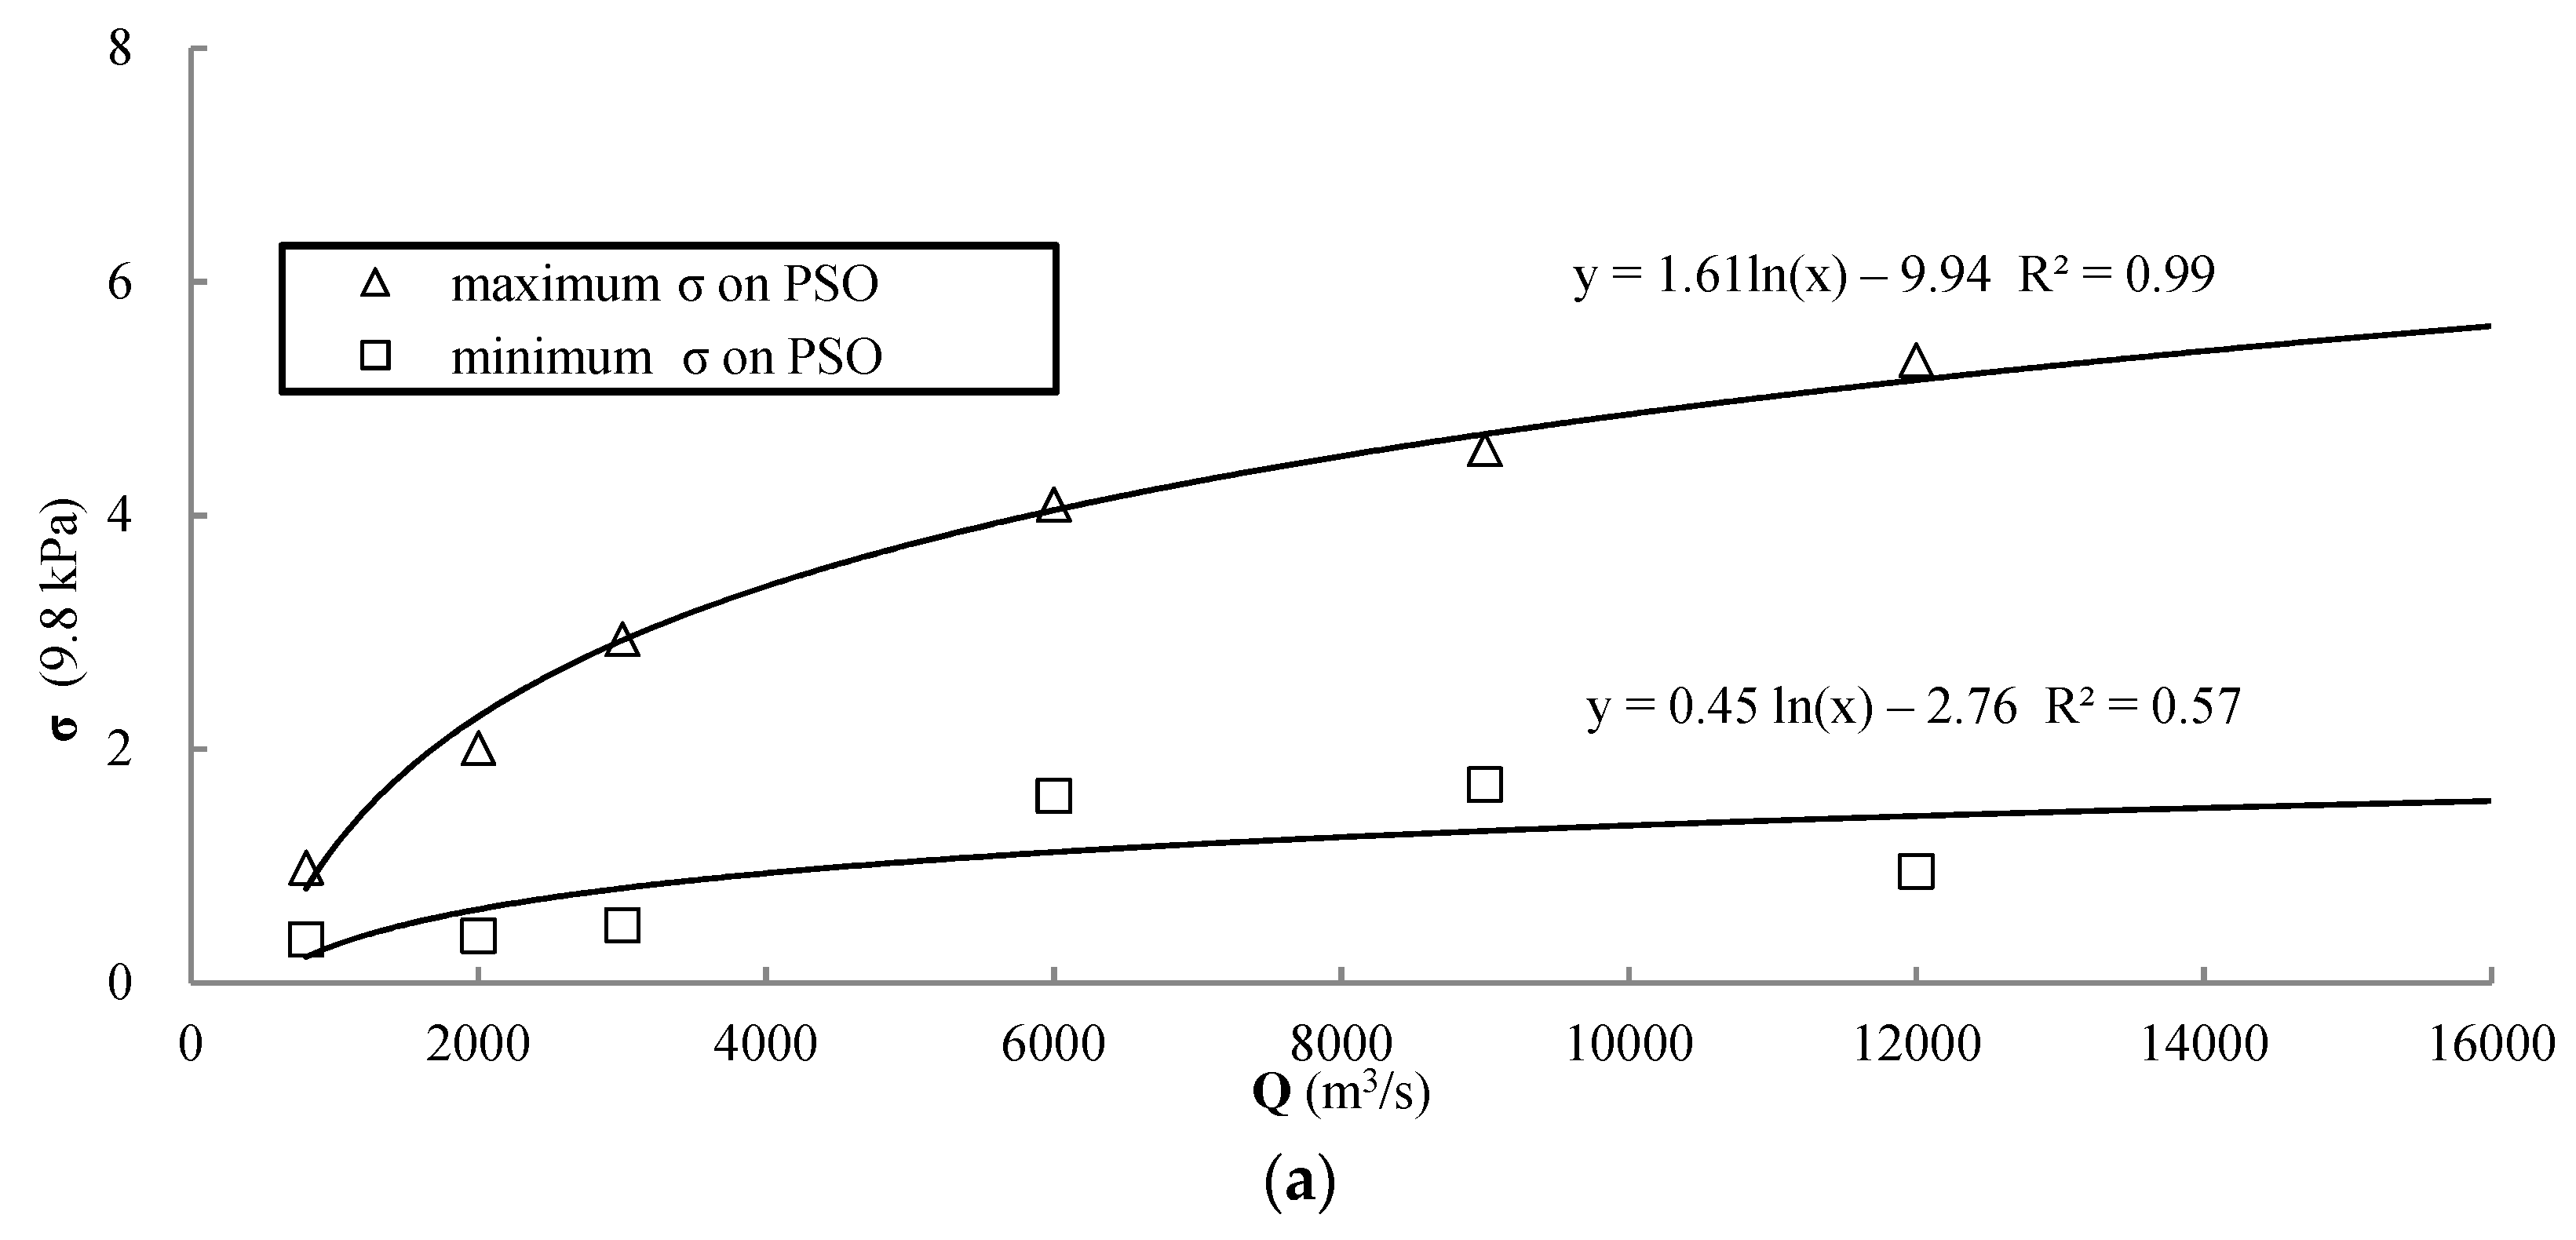
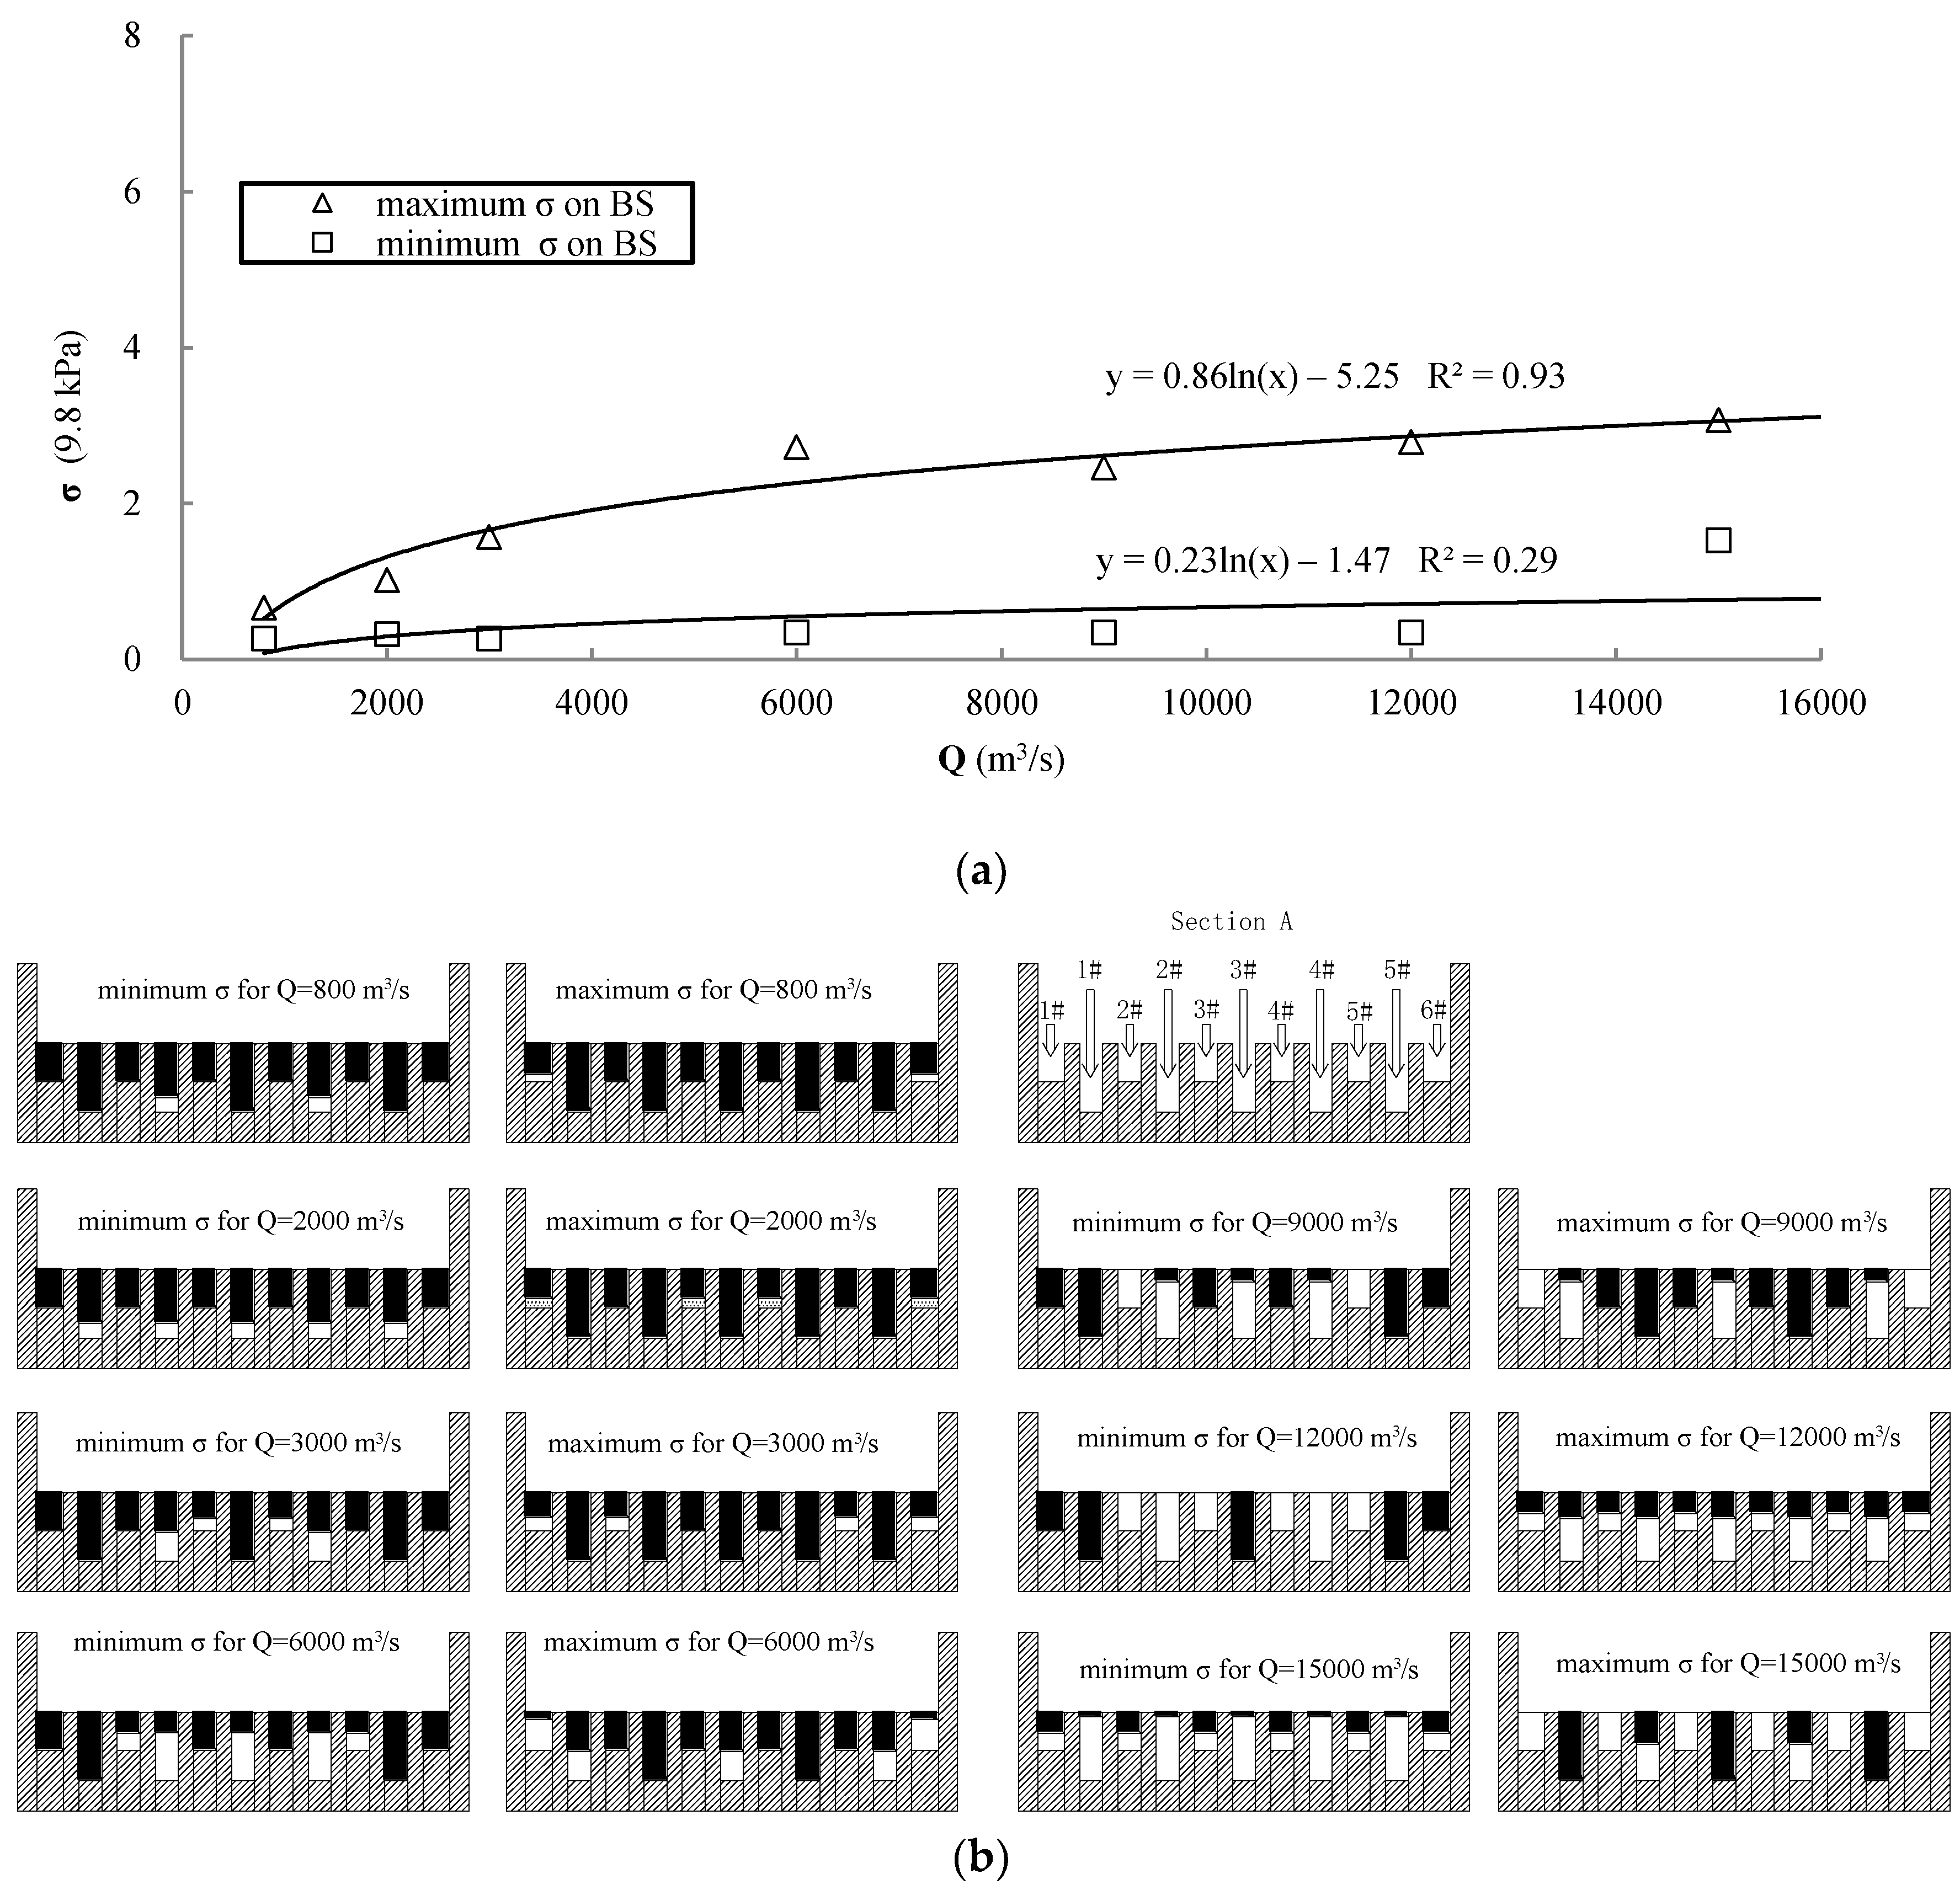
3.1. Relation between Fluctuating Pressure and Flood Discharge
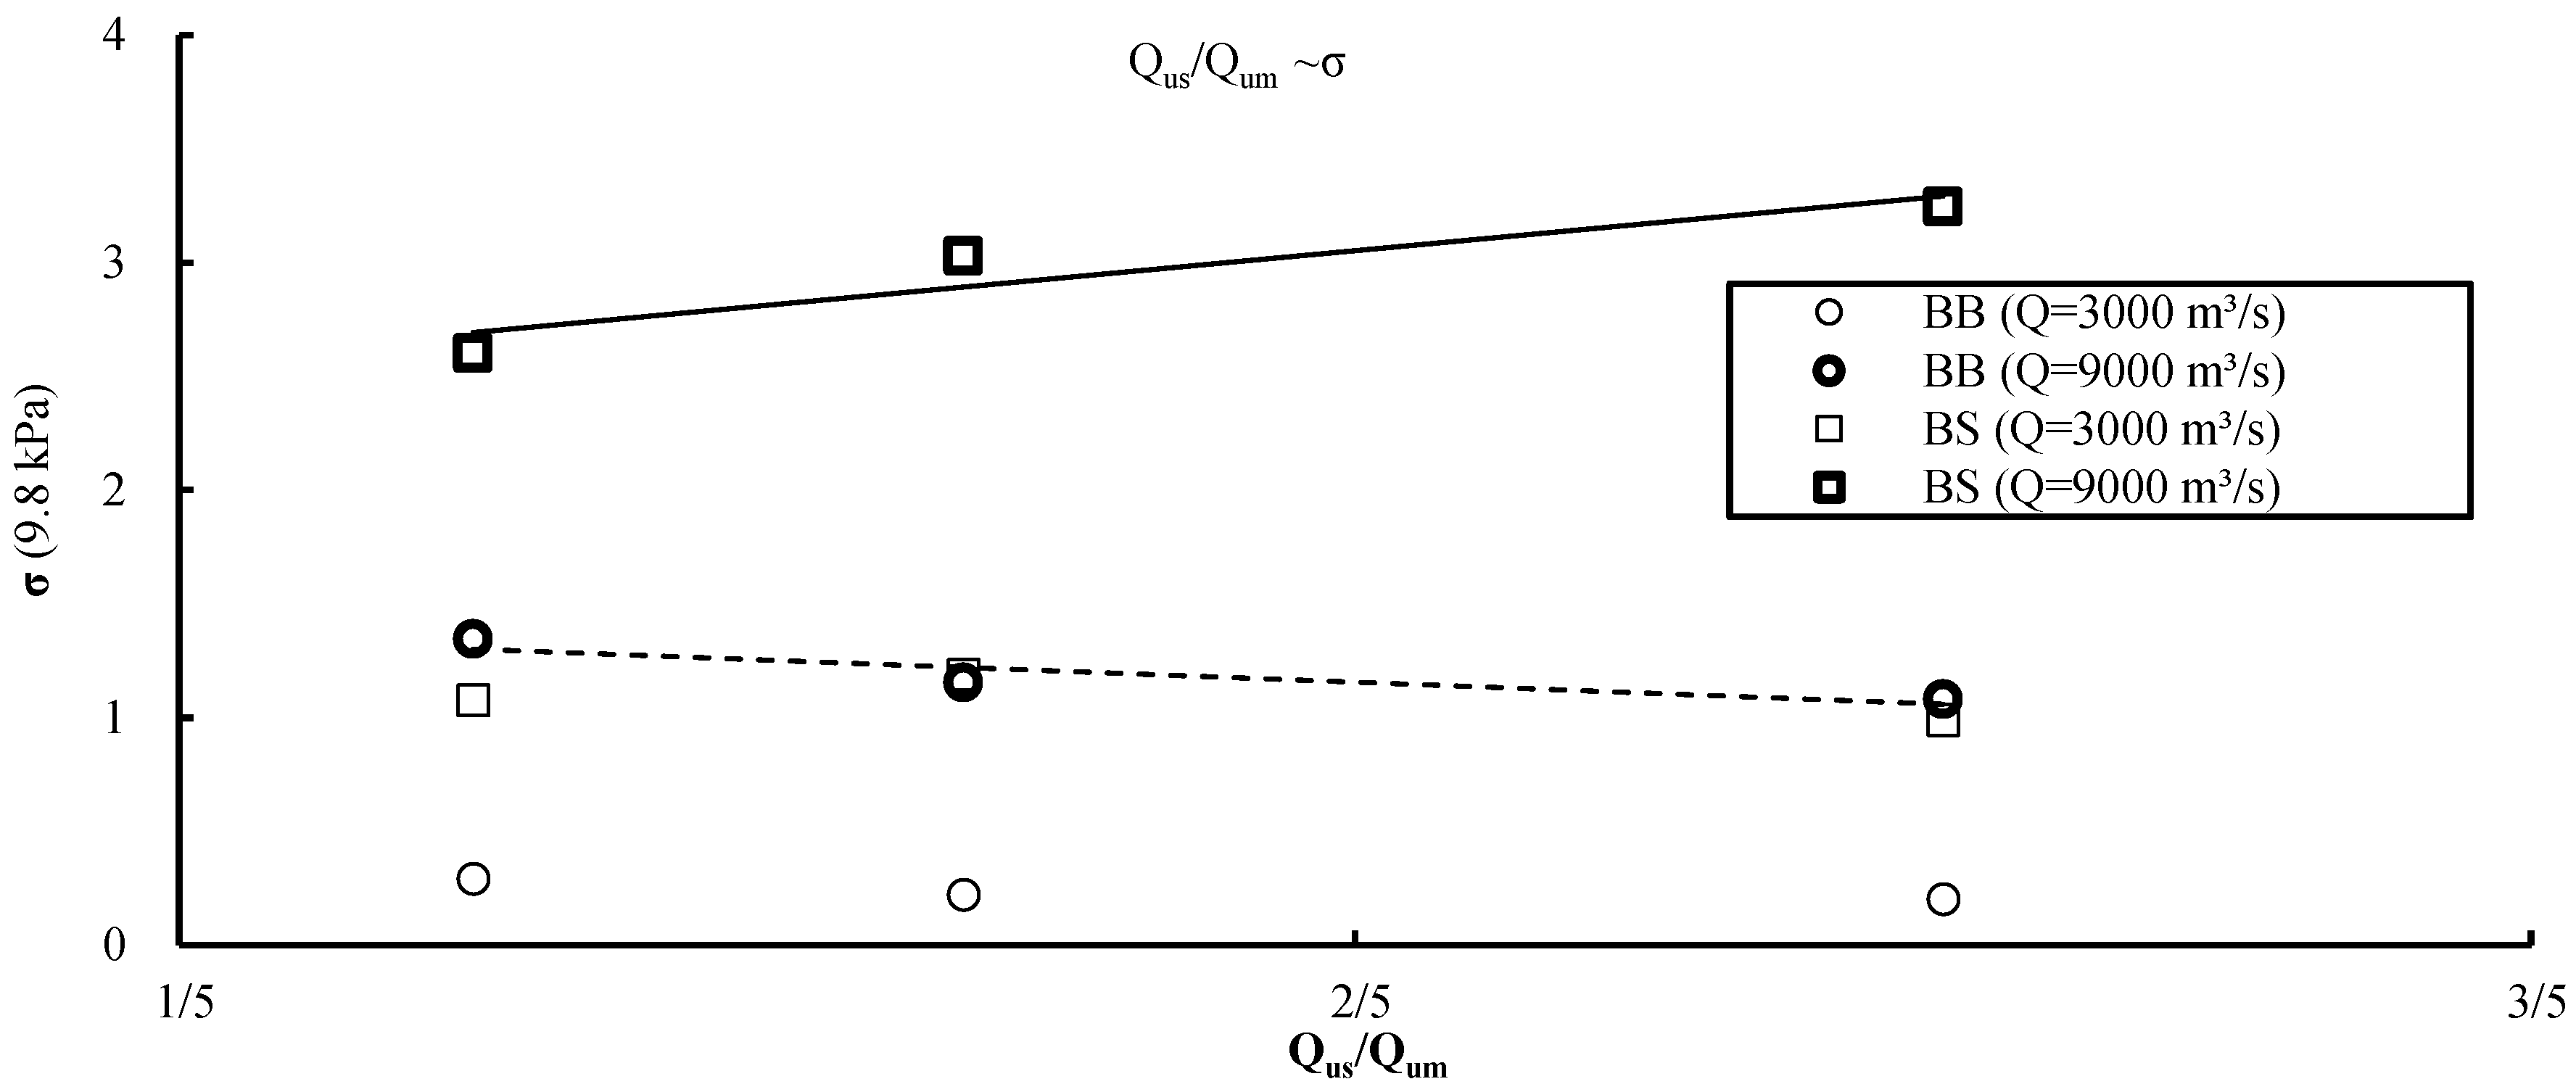
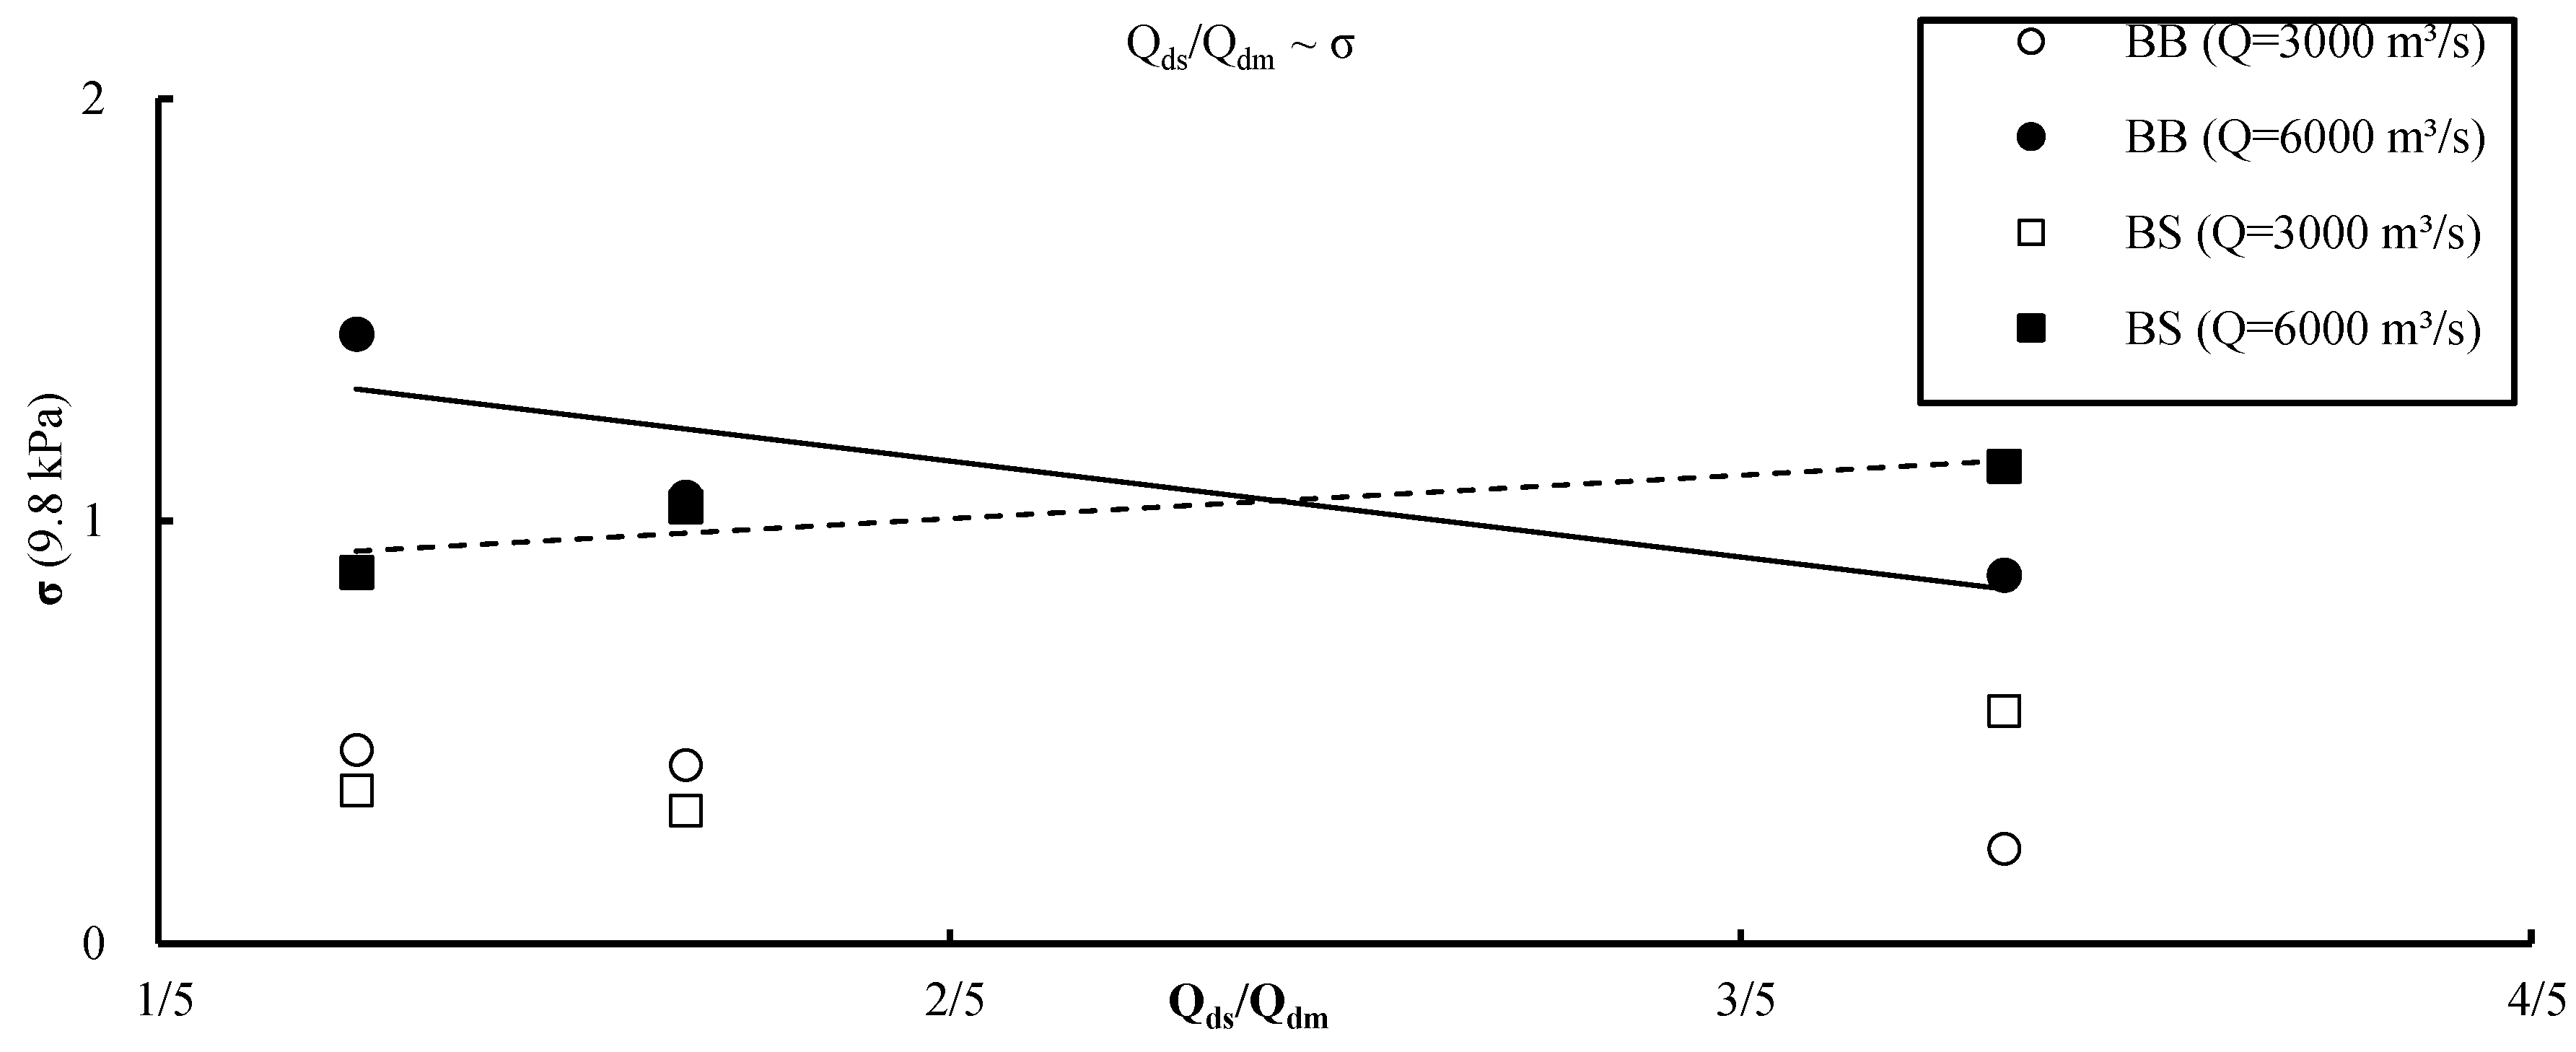
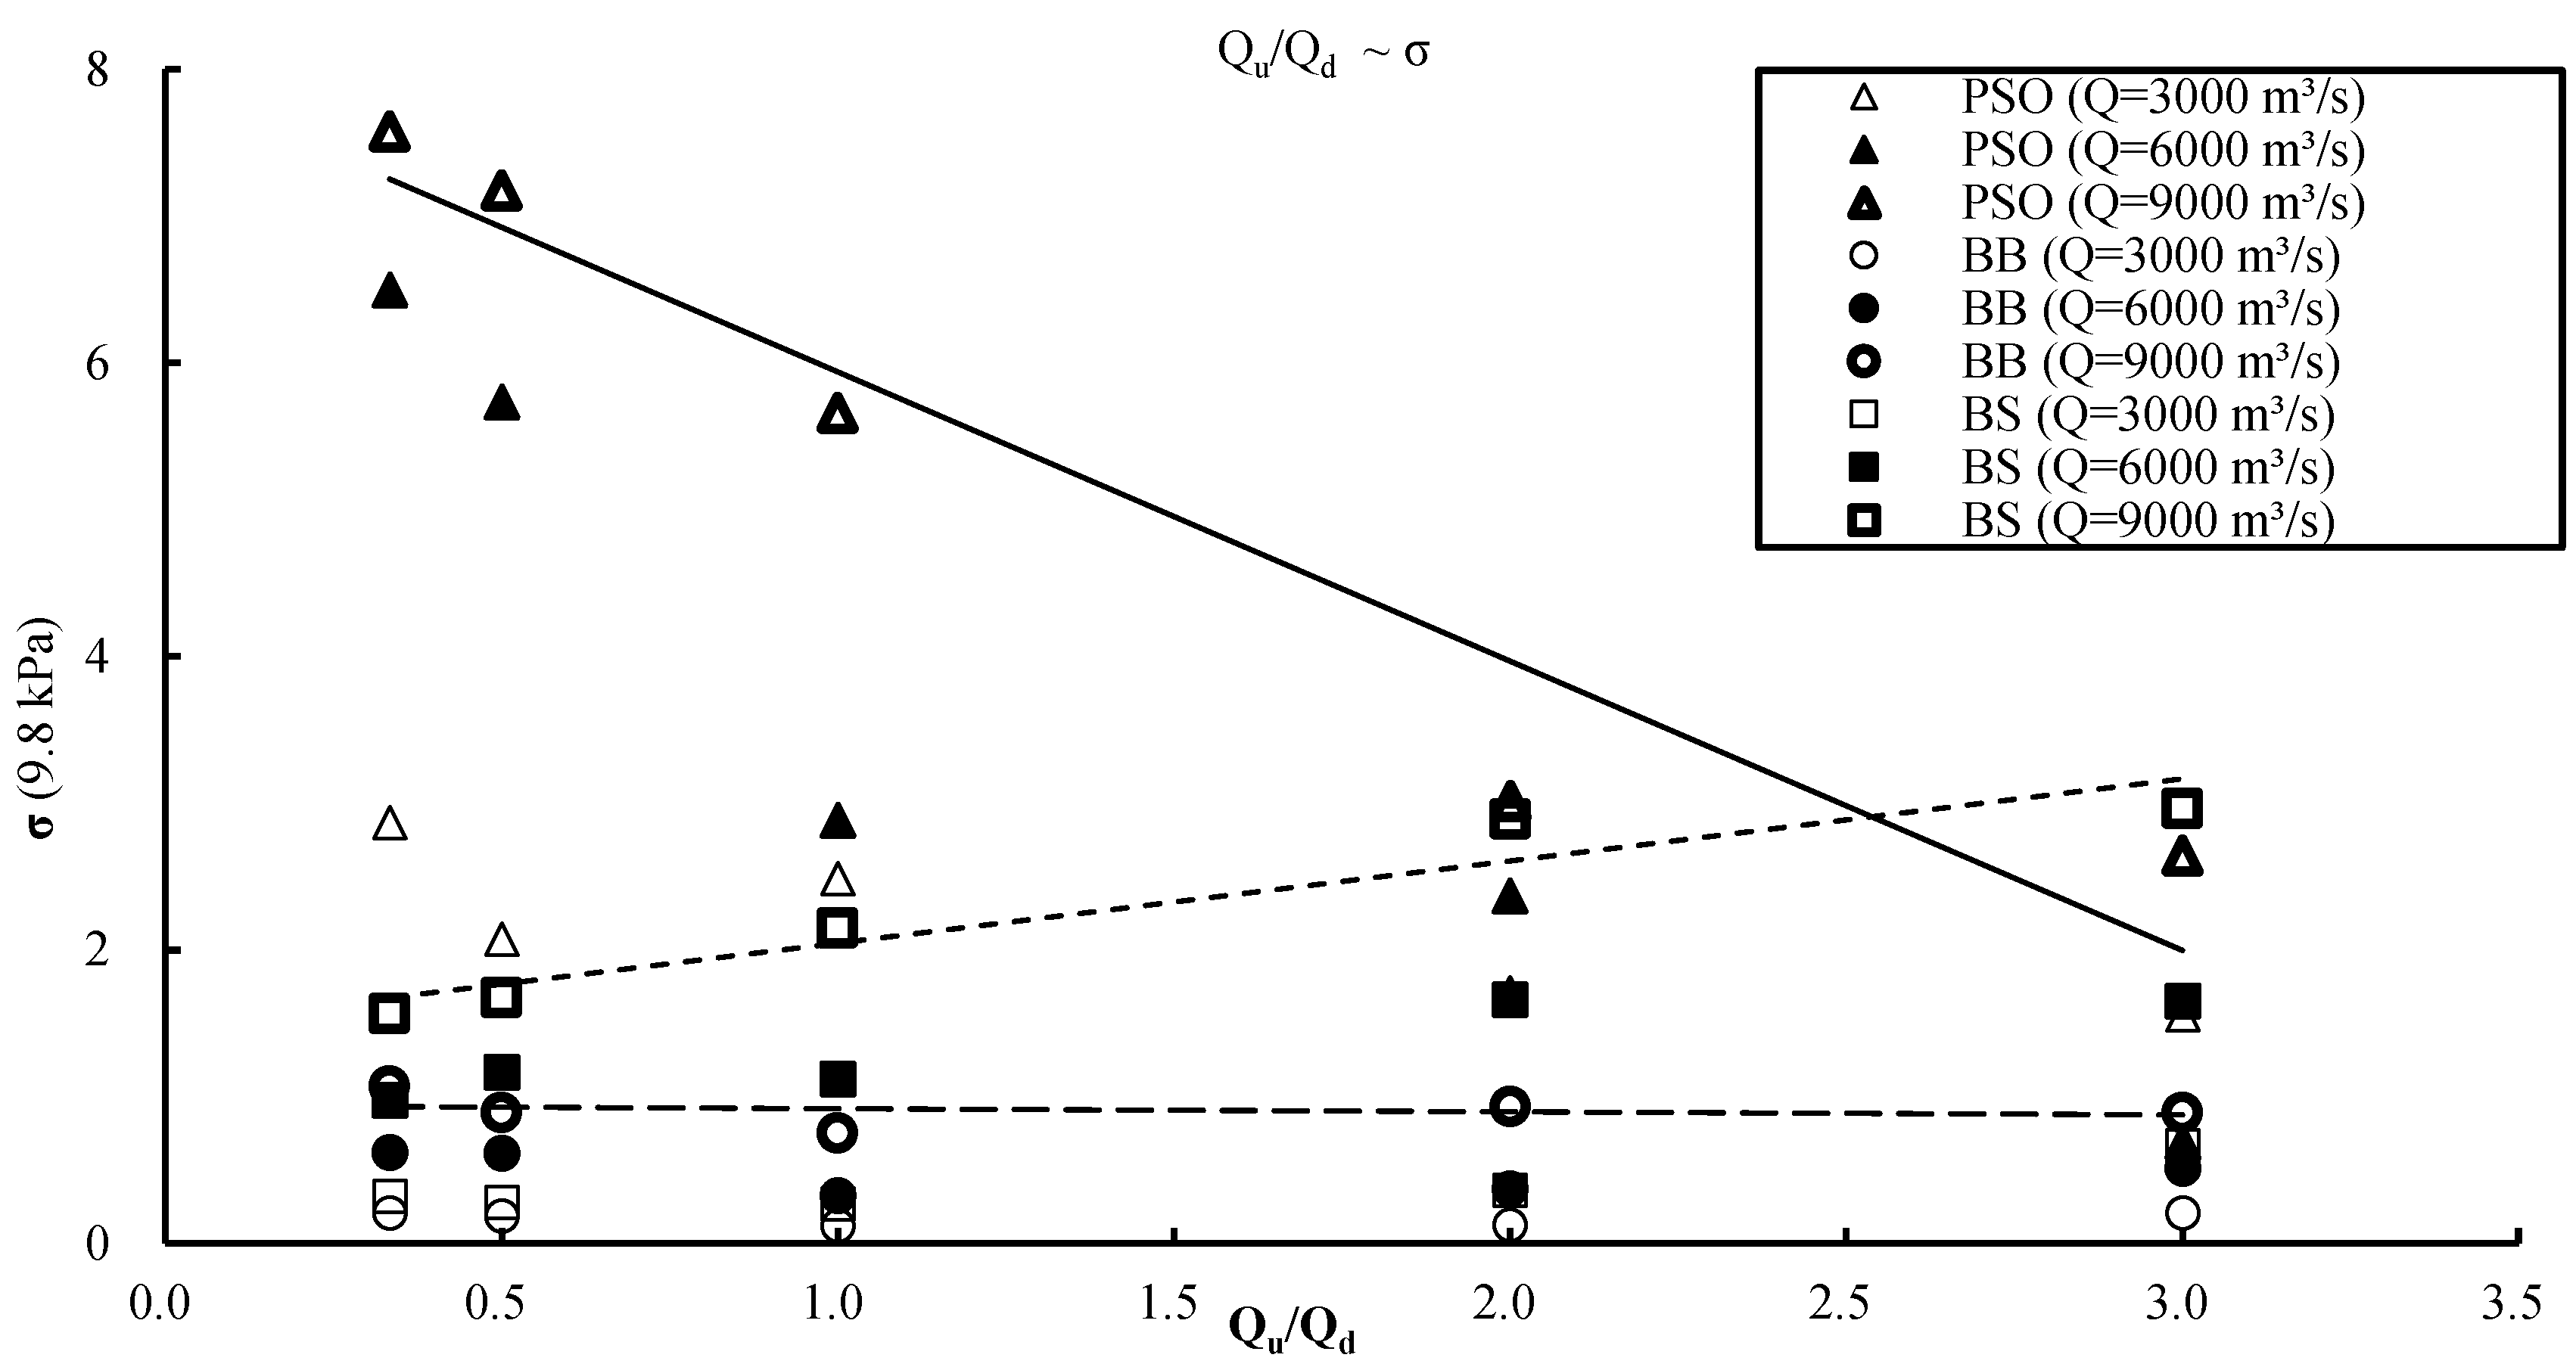
3.2. Effect of Flow Discharge Ratio and Configuration Adopted to Release the Flow on Fluctuating Pressure
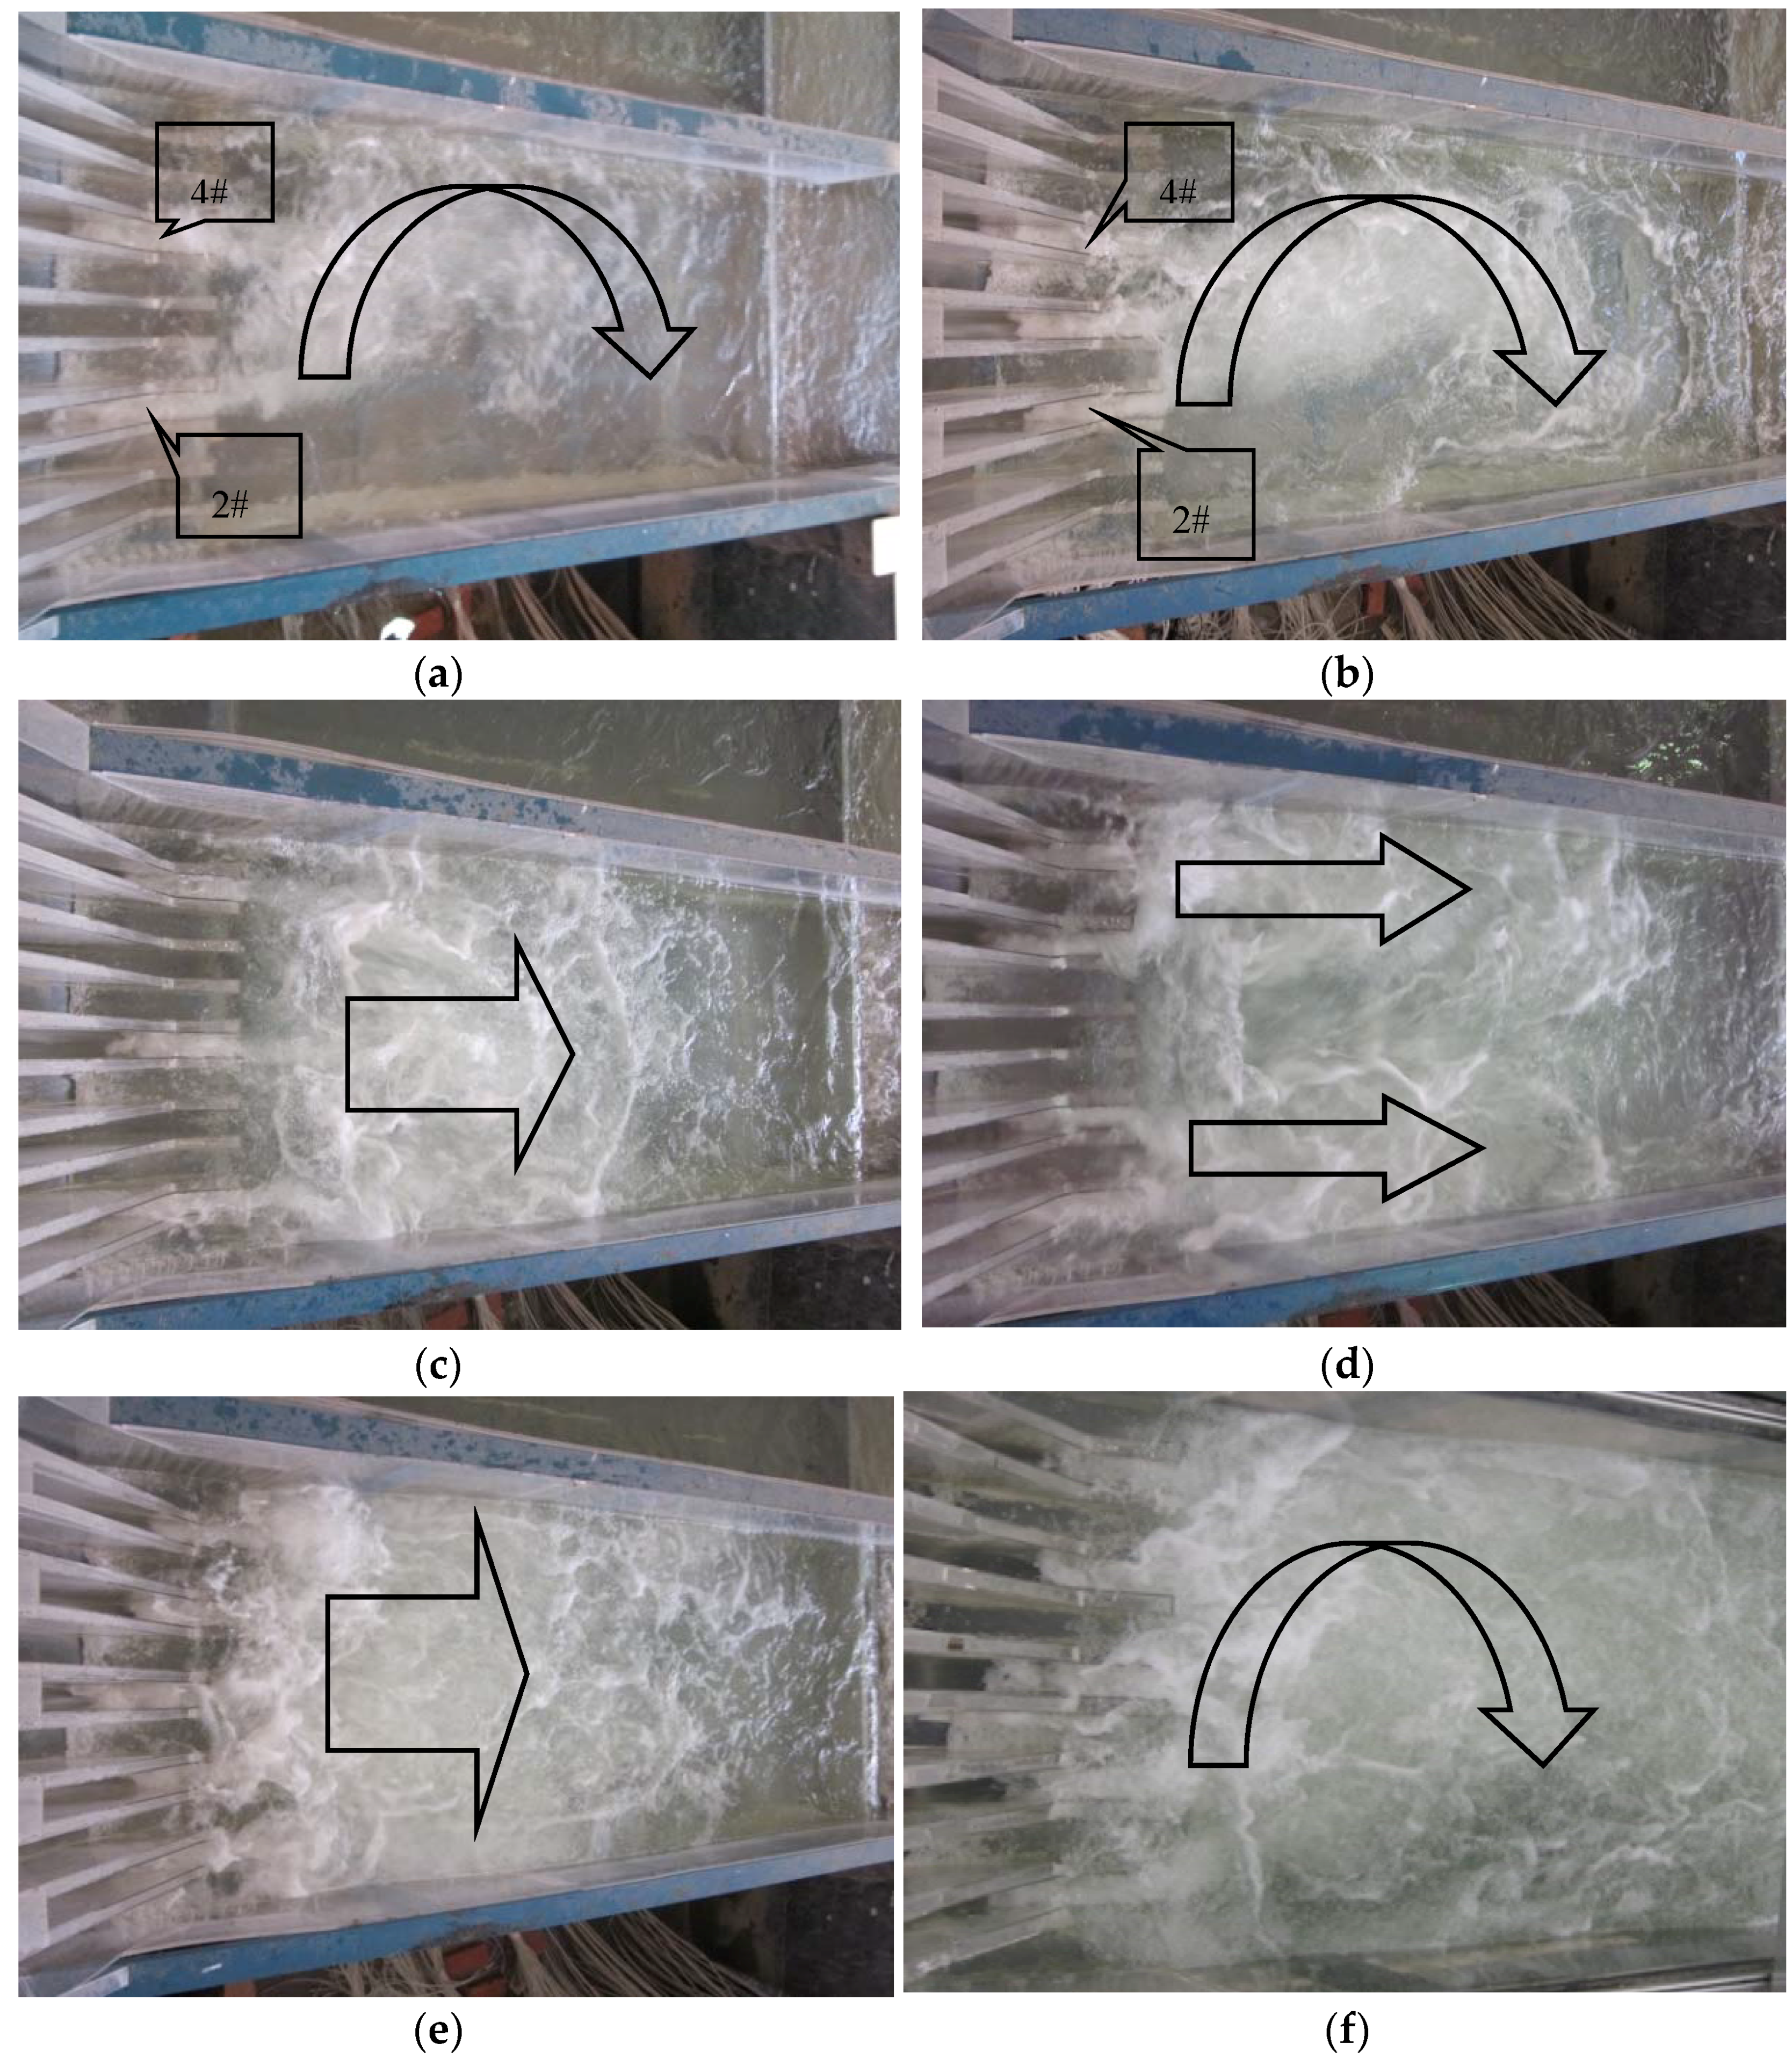
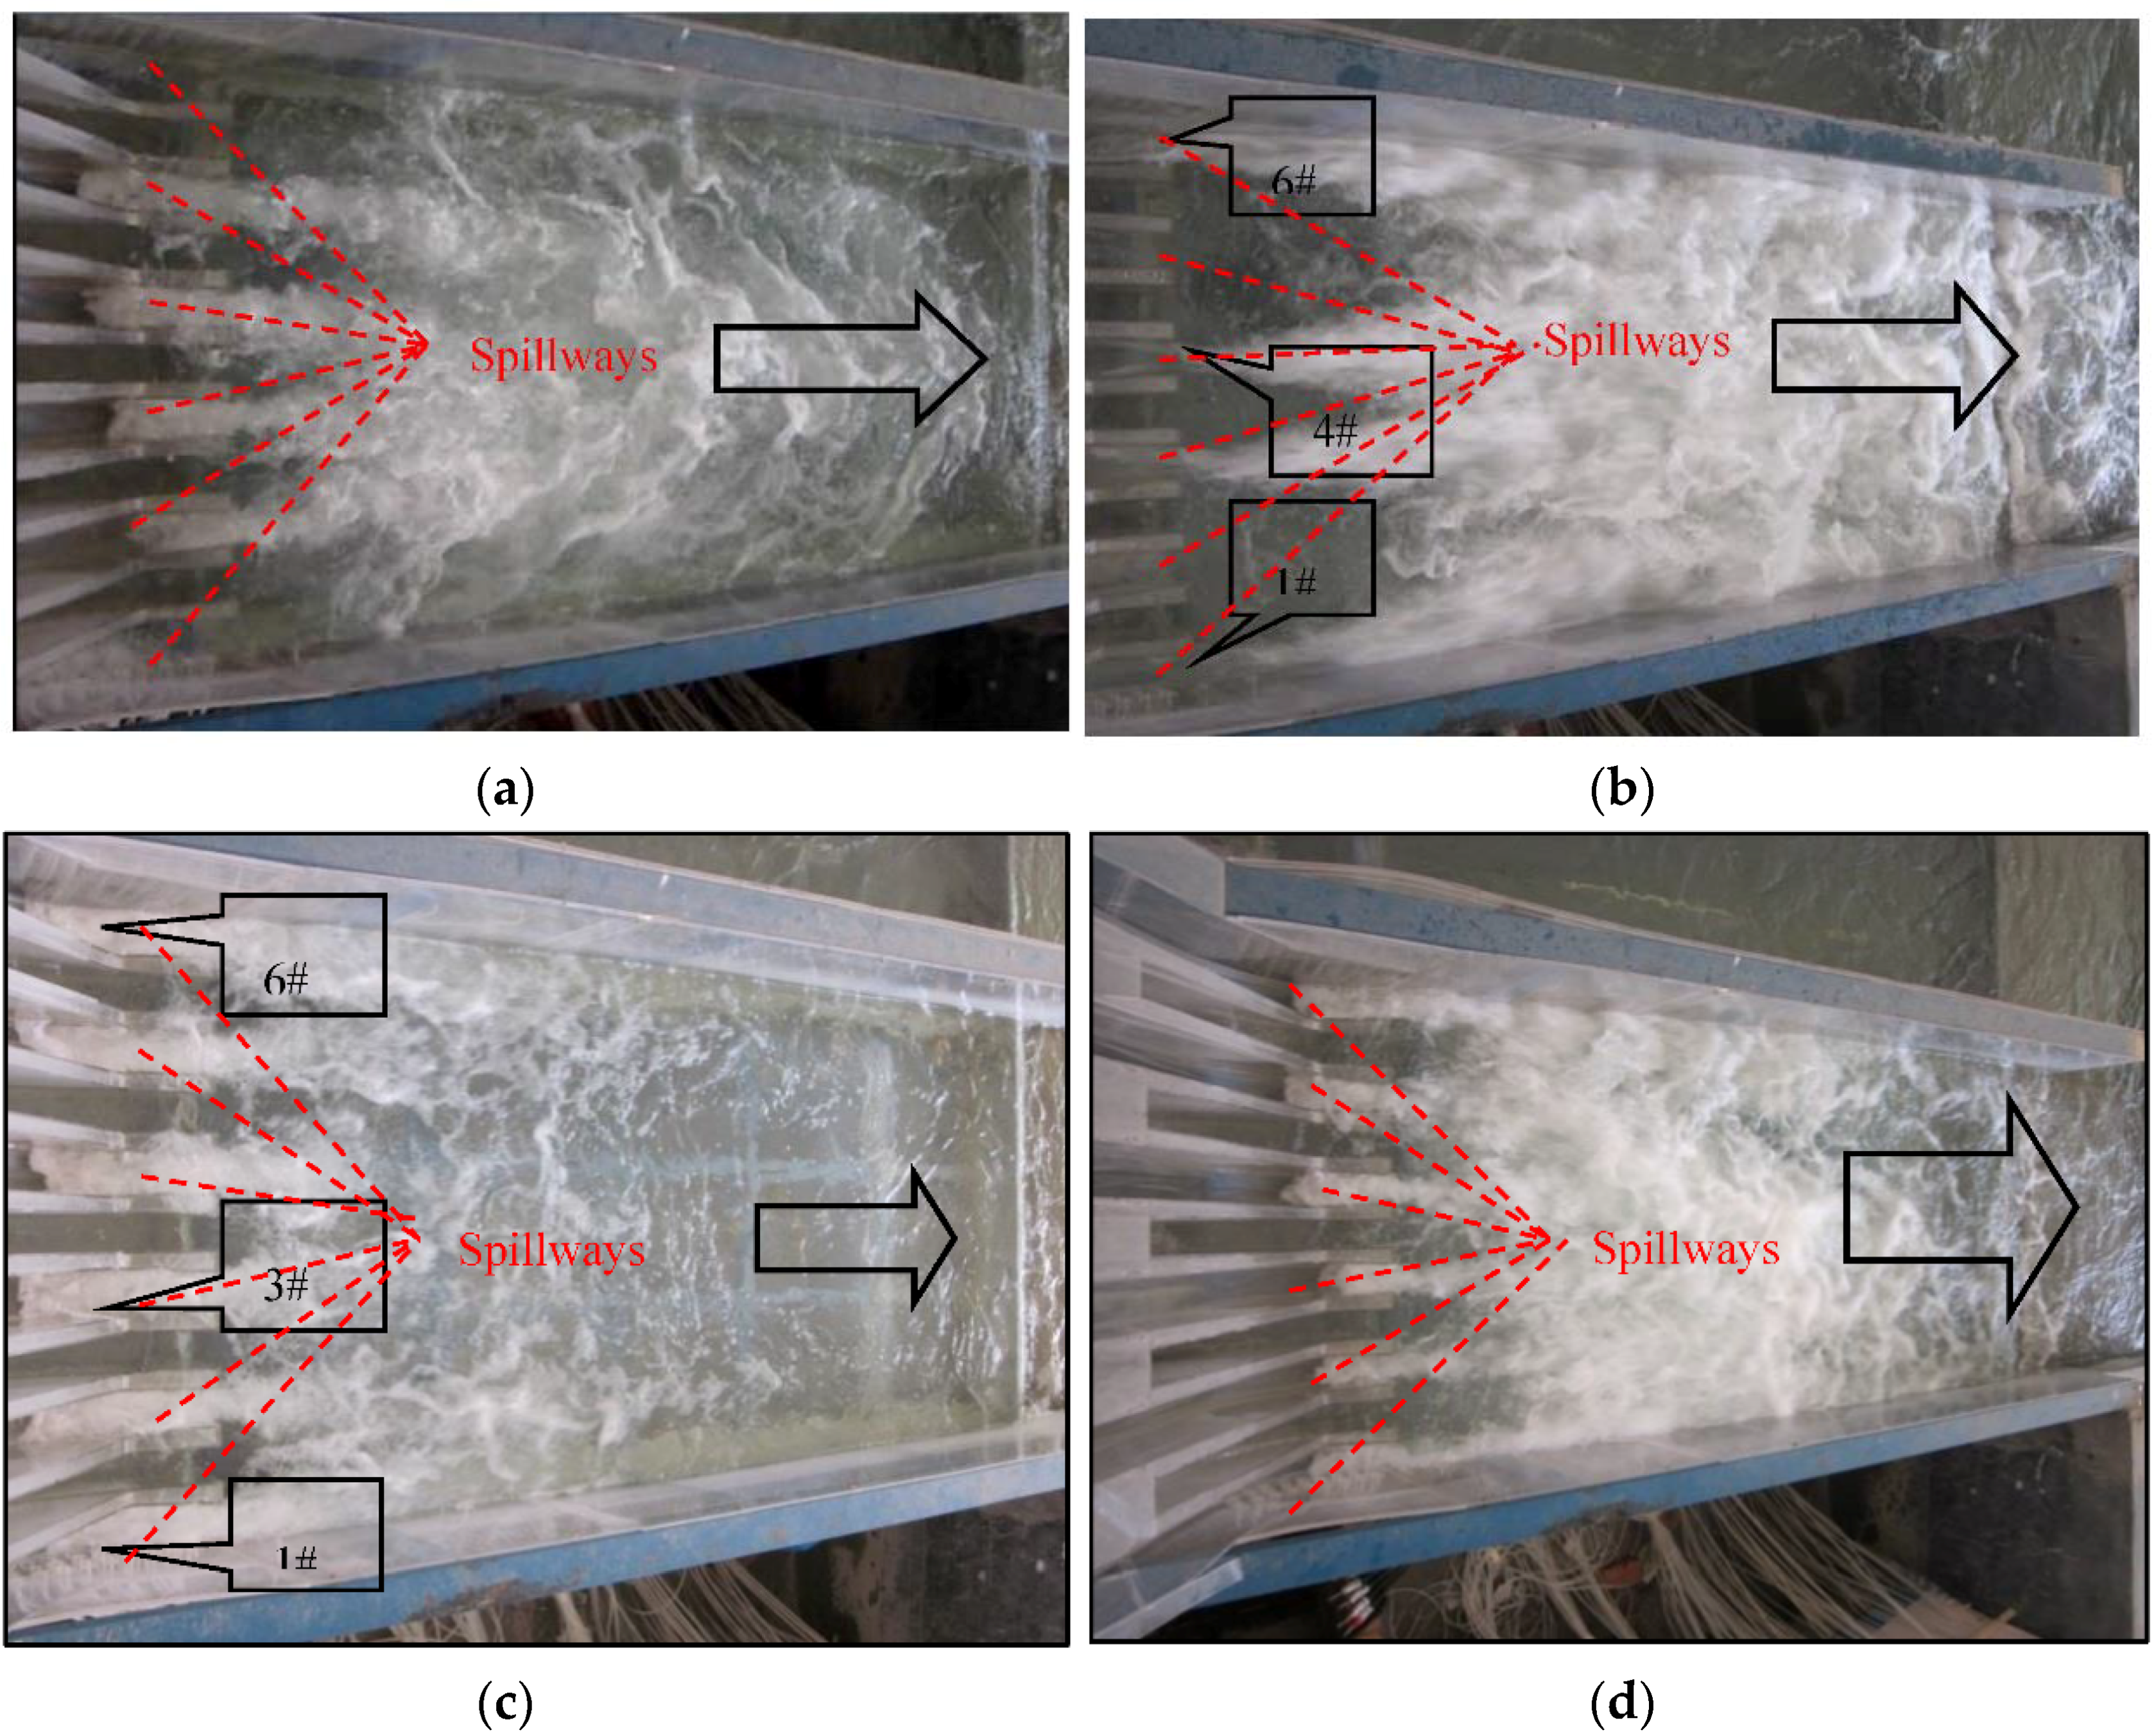
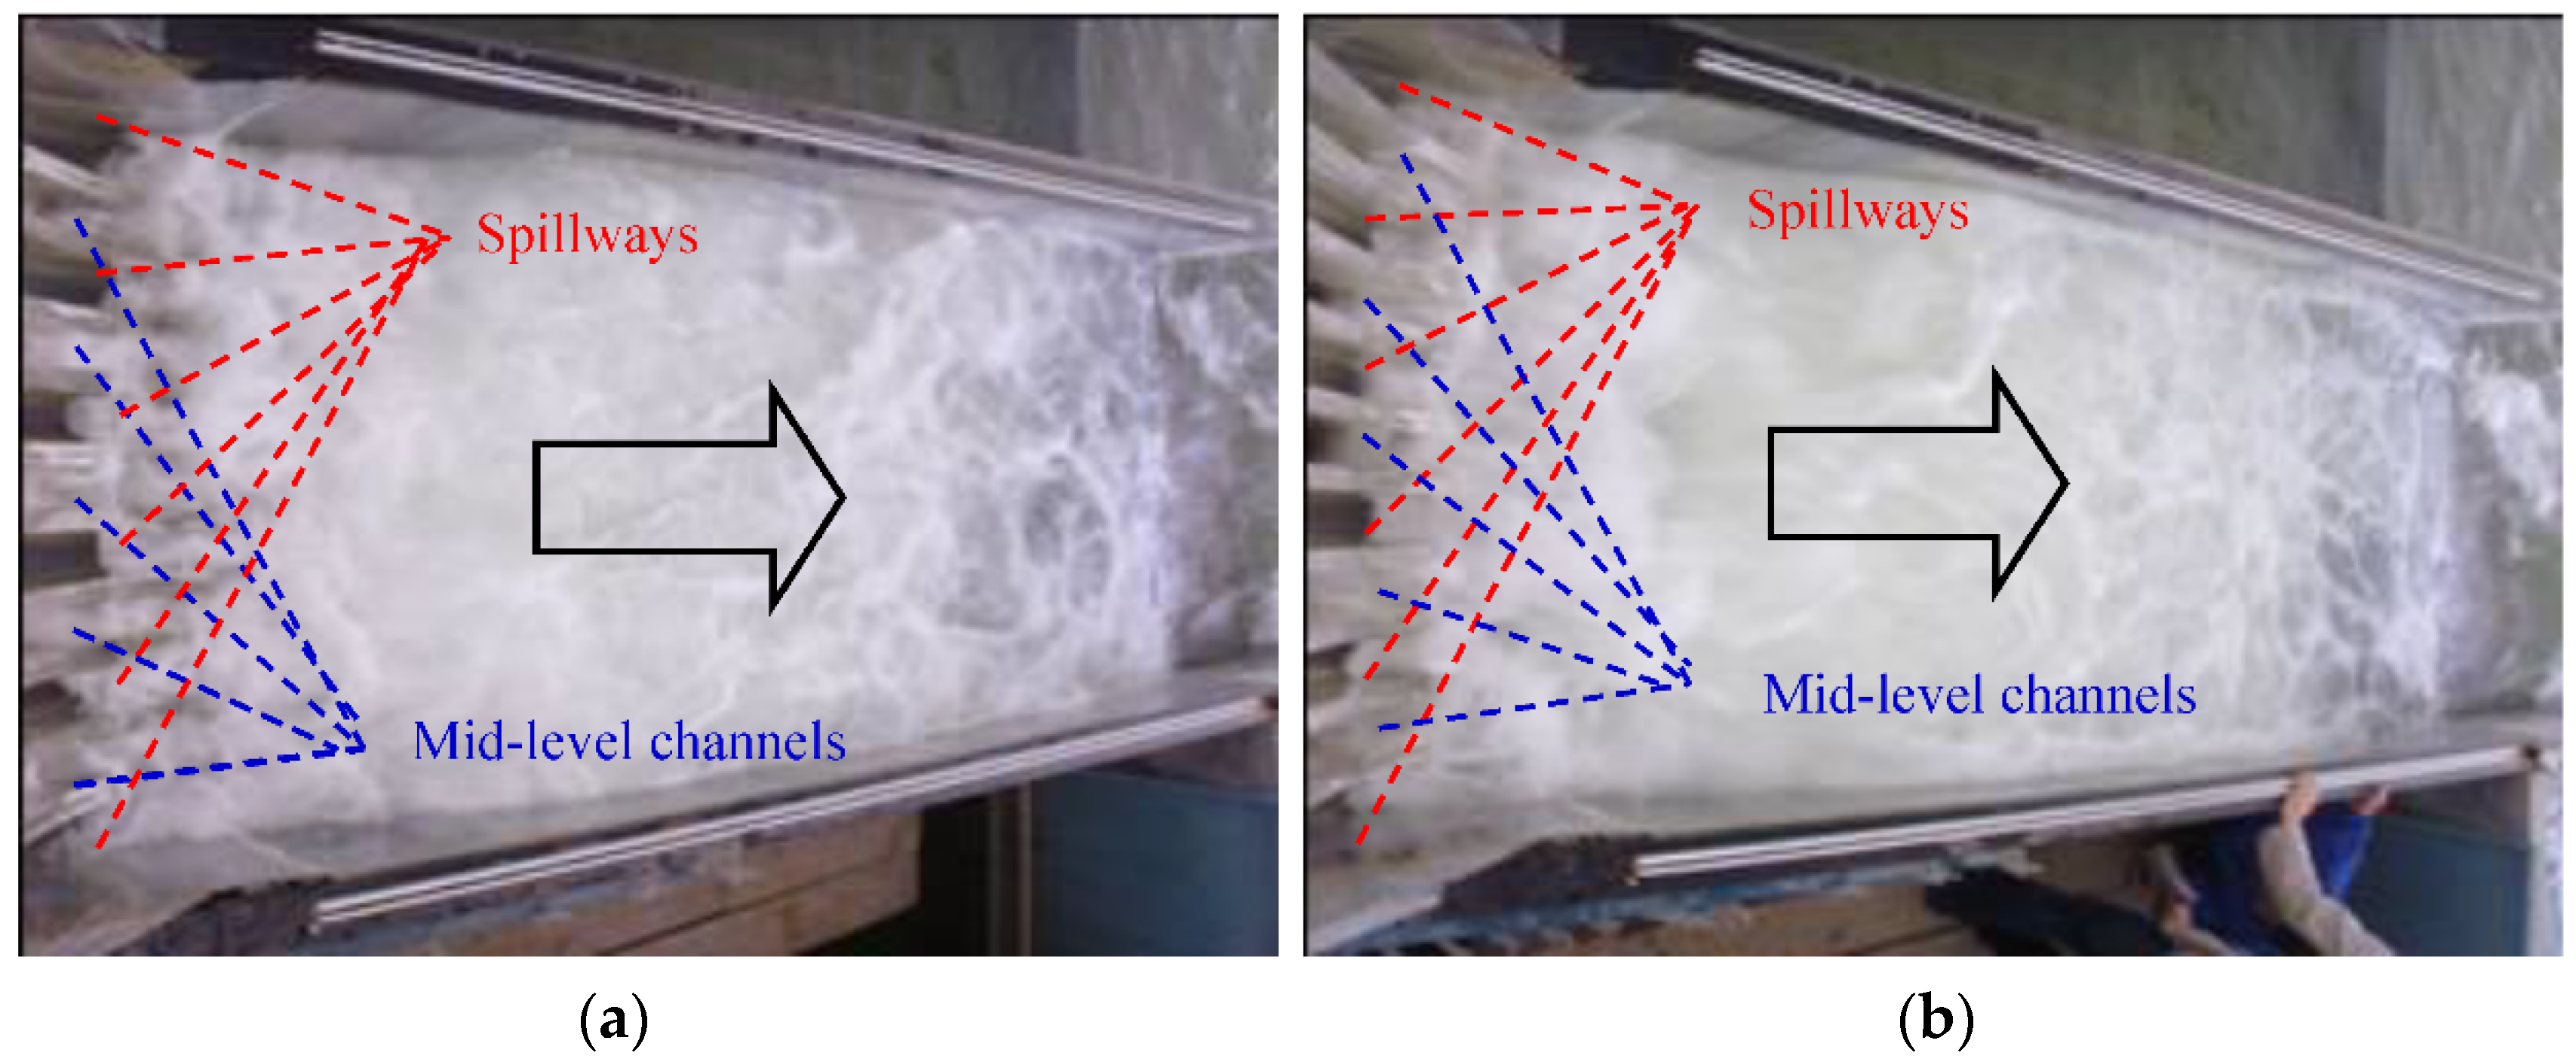
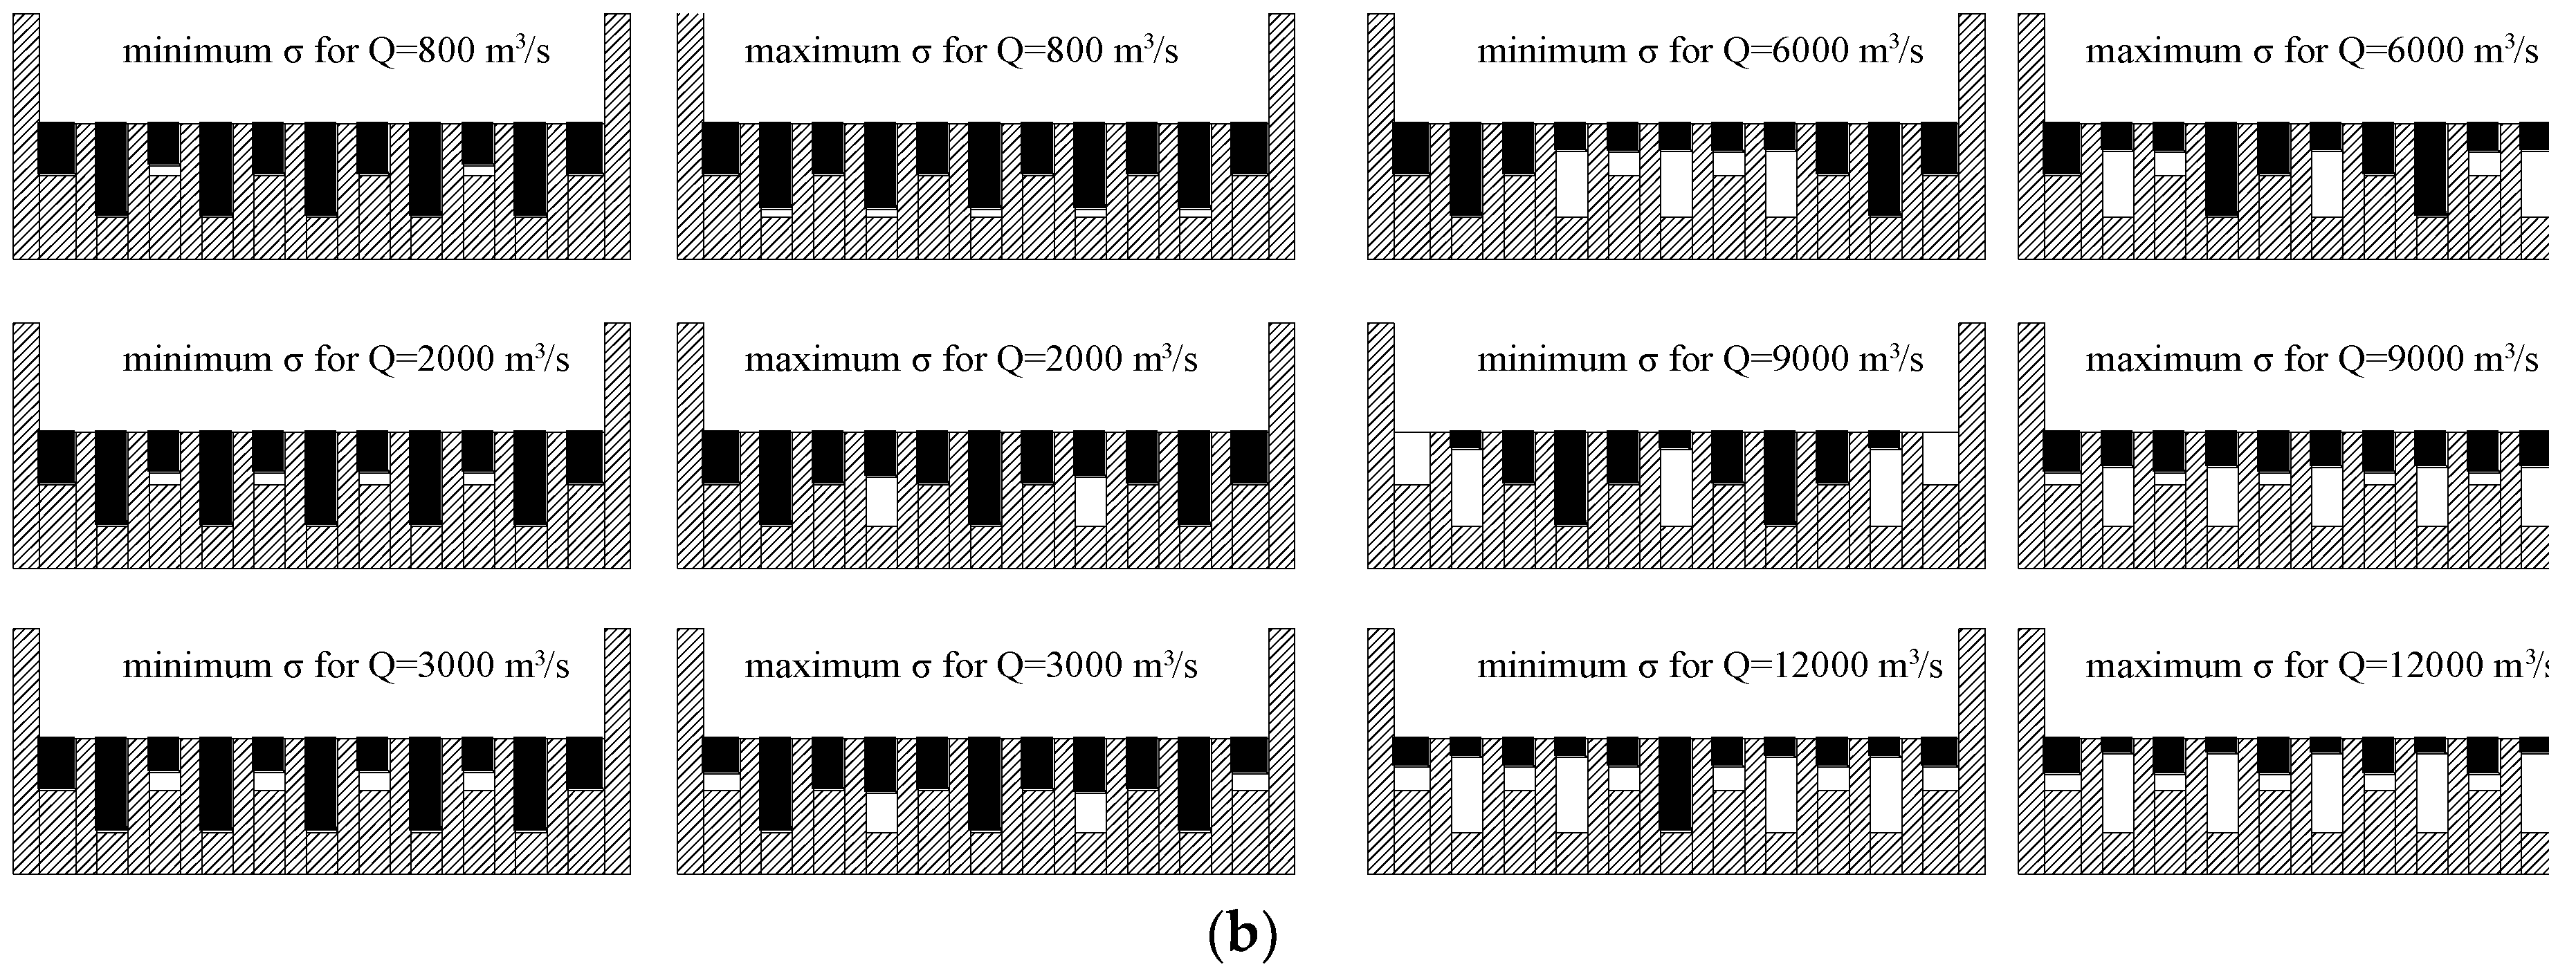
3.3. Effect of Flow Discharge Ratio and Configuration Adopted to Release the Flow on Flow Patterns in the Stilling Basin
4. Conclusions
- (1)
- Gate-opening modes are very flexible for MHSJ. Moreover, proper and strategical adjustment of gate-opening modes can be very effective in reducing fluctuating loads on overflow walls (e.g., fluctuating pressure can be reduced by nearly 50% for the same flood discharge by optimizing the opening mode of the gates).
- (2)
- To improve the overall performance and stability of the hydraulic structure, both spillways and mid-level channels should be opened uniformly, but side spillways should be opened slightly less to reduce fluctuating pressure on the side-wall of the stilling basin. The discharge ratio Qu/Qd (the ratio of spillway discharge to mid-level channel discharge) should be kept between 2–3 when side spillways and mid-level channels are used together.
- (3)
- The flow patterns in the stilling basin show remarkable differences depending on gate-opening modes. No repeatable shape was observed when trying different configurations. It is recommended to open the mid-level channels partially and uniformly when discharging orifices are used separately. The flow patterns are always stable when spillways are used separately regardless of full or partial opening. The flow patterns are relatively stable in the stilling basin when a combination of spillways and mid-level channels are used to release a high flowrate typical of flooding scenarios.
- (4)
- It is proposed to use spillways and mid-level channels separately for middle orifices and small flowrates released. The combination of mid-level channels and spillways can be used for large discharge.
Author Contributions
Funding
Conflicts of Interest
Abbreviations
| BB | stilling basin bottom |
| BS | stilling basin side-wall |
| H | height dimension (m) |
| L | length dimension (m) |
| MHSJ | Multi-Horizontal-Submerged Jets |
| PSO | piers, spillways and mid-level channels |
| RMS | root-mean-square of fluctuating pressure |
| W | width dimension (m) |
| Q | discharge (m3/s) |
| Qd | total discharge of mid-level channels (m3/s) |
| Qds | total discharge of two side mid-level channels(1# and 5#) (m3/s) |
| Qdm | total discharge of three middle mid-level channels (2–4#) (m3/s) |
| Qu | total discharge of spillways (m3/s) |
| Qum | total flood discharge of four middle spillways (2–5#) (m3/s) |
| Qus | total flood discharge of two side spillways (1# and 6#) (m3/s) |
| σ | RMS of fluctuating pressure (9.81 kPa) |
References
- Wu, J.H.; Ai, W.Z.; Zhou, Q. Head loss coefficient of orifice plate energy dissipater. J. Hydraul. Res. 2010, 48, 526–530. [Google Scholar]
- Manenti, S.; Pierobon, E.; Gallati, M.; Sibilla, S.; D’Alpaos, L.; Macchi, E.; Todeschini, S. Vajont Disaster: Smoothed Particle Hydrodynamics Modeling of the Postevent 2D Experiments. J. Hydraul. Eng. 2015, 142, 05015007. [Google Scholar] [CrossRef]
- Vacondio, R.; Mignosa, P.; Pagani, S. 3D SPH numerical simulation of the wave generated by the Vajont rockslide. Adv. Water Resour. 2013, 59, 146–156. [Google Scholar] [CrossRef]
- Xu, Y.; Zhang, L.; Jia, J. Lessons from Catastrophic Dam Failures in August 1975 in Zhumadian. China Geocongr. 2008, 178, 162–169. [Google Scholar]
- Tan, Y.T.; Xu, H.; Zhang, X.L. Sustainable urbanization in China: A comprehensive literature review. Cities 2016, 55, 82–93. [Google Scholar] [CrossRef]
- Intergovernmental Panel on Climate Change (IPCC). Summary for Policymakers, Climate Change 2014: Impacts, Adaptation and Vulnerability—Contributions of the Working Group II to the Fifth Assessment Report; IPCC: Geneva, Switzerland, 2014; pp. 1–32. [Google Scholar]
- Zhang, J.M.; Peng, Y.; Xu, W.L. Study on the Cause of Vibration Induced by Flood Discharge and Its Countermeasures in Xiangjiaba Hydropower Station; Technical Report; Sichuan University: Chengdu, China, 2013. [Google Scholar]
- Zhang, J.M.; Li, Y.L.; Yang, Y.Q.; Xu, W.L.; Zeng, X.H.; Cheng, H. Investigation on energy dissipation of multiple submerged horizontal jets with pressure flow. Water Resour. Hydropower Eng. 2004, 35, 30–33. (In Chinese) [Google Scholar]
- Zhang, J.M.; Chen, J.G.; Xu, W.L.; Peng, Y. Characteristics of the vortex structure in multi-horizontal submerged jets stilling basin. Proc. Inst. Civ. Eng.-Water Manag. 2013, 167, 322–333. [Google Scholar] [CrossRef]
- Li, Y.L.; Hua, G.C.; Zhang, J.M.; Yang, Y.Q.; Hu, Y.H. Analysis on energy dissipation of the single-lever with multi-strand and multi-lever with multi-strand horizontal submerged jets. Chin. J. Hydrodyn. 2006, 1, 26–31. (In Chinese) [Google Scholar]
- Li, Y.L.; Hua, G.C.; Zhang, J.M.; Yang, Y.Q. Factors affecting the hydraulic characteristics of horizontal submerged jets. Adv. Water Sci. 2006, 17, 761–766. (In Chinese) [Google Scholar]
- Deng, J.; Xu, W.L.; Zhang, J.M.; Qu, J.; Yang, Y. A new type of plunge pool—Multi-horizontal submerged jets. Sci. China (E Technol. Sci.) 2008, 51, 2128–2141. [Google Scholar] [CrossRef]
- Deng, J.; Xu, W.L.; Zhang, J.M.; Qu, J.X.; Yang, Y.Q. A new type of stilling pool—Multi-strand horizontal submerged jets. Sci. China (E Technol. Sci.) 2009, 39, 29–38. (In Chinese) [Google Scholar]
- Huang, Q.J.; Feng, S.R.; Li, Y.N.; Wu, J.H. Experimental study on energy dissipation characteristics of multi-horizontal submerged jets. Chin. J. Hydrodyn. 2008, 23, 694–701. (In Chinese) [Google Scholar]
- Chen, J.G.; Zhang, J.M.; Xu, W.L.; Li, S.; He, X.L. Particle image velocimetry measurements of vortex structures in stilling basin of multi-horizontal submerged jets. J. Hydrodyn. Ser. B 2013, 25, 556–563. [Google Scholar] [CrossRef]
- Chen, J.G.; Zhang, J.M.; Xu, W.L.; Wang, Y.R. Scale effects of air-water flows in stilling basin of multi-horizontal submerged jets. J. Hydrodyn. Ser. B 2010, 22, 788–795. [Google Scholar] [CrossRef]
- Chen, J.G.; Zhang, J.M.; Xu, W.L.; Wang, Y.R. Numerical simulation investigation on the energy dissipation characteristics in stilling basin of multi-horizontal submerged jets. J. Hydrodyn. 2010, 22, 732–741. [Google Scholar] [CrossRef]
- Yin, R.G.; Zhang, J.H. Vibration source and shock absorption scheme research of near-field vibration caused by flood discharge and energy dissipation of a stilling pool. Geo Shanghai Int. Congr. 2014, 237, 107–116. [Google Scholar]
- Yin, R.G.; Zhang, J.H.; Liu, X.K. 3D dynamic FEM analysis of near-field vibration caused by flood discharge and energy dissipation of a stilling pool. J. Water Resour. Arch. Eng. 2014, 12, 72–76. (In Chinese) [Google Scholar]


© 2018 by the authors. Licensee MDPI, Basel, Switzerland. This article is an open access article distributed under the terms and conditions of the Creative Commons Attribution (CC BY) license (http://creativecommons.org/licenses/by/4.0/).
Share and Cite
Peng, Y.; Zhang, J.; Xu, W.; Rubinato, M. Experimental Optimization of Gate-Opening Modes to Minimize Near-Field Vibrations in Hydropower Stations. Water 2018, 10, 1435. https://doi.org/10.3390/w10101435
Peng Y, Zhang J, Xu W, Rubinato M. Experimental Optimization of Gate-Opening Modes to Minimize Near-Field Vibrations in Hydropower Stations. Water. 2018; 10(10):1435. https://doi.org/10.3390/w10101435
Chicago/Turabian StylePeng, Yong, Jianmin Zhang, Weilin Xu, and Matteo Rubinato. 2018. "Experimental Optimization of Gate-Opening Modes to Minimize Near-Field Vibrations in Hydropower Stations" Water 10, no. 10: 1435. https://doi.org/10.3390/w10101435
APA StylePeng, Y., Zhang, J., Xu, W., & Rubinato, M. (2018). Experimental Optimization of Gate-Opening Modes to Minimize Near-Field Vibrations in Hydropower Stations. Water, 10(10), 1435. https://doi.org/10.3390/w10101435