Canopy Light Utilization and Yield of Rice under Rain-Catching and Controlled Irrigation
by
Hongfei Lu
1,2, 
Xuebin Qi
1,
Xiangping Guo
2,*,
Jacob Jeremiah Towa
2,
Bo Zhen
1,2,
Dongmei Qiao
1,
Zhenchang Wang
2,
Bo Yang
1,2 and
Yang Han
1 1
Farmland Irrigation Research Institute, Chinese Academy of Agricultural Sciences, Xinxiang 453003, China
2
School of Water Resources and Hydropower, Hohai University, Nanjing 210098, China
*
Author to whom correspondence should be addressed.
Water 2018, 10(10), 1340; https://doi.org/10.3390/w10101340
Submission received: 9 August 2018
/
Revised: 7 September 2018
/
Accepted: 26 September 2018
/
Published: 27 September 2018
(This article belongs to the Section Water Resources Management, Policy and Governance)
Abstract
:In the middle and lower reaches of the Yangtze River, the rainfall is greater in summer. The technology of rain catching and controlled irrigation of rice help to save water by raising the water depth of the field after rain while the soil water content during the rest period is maintained at 70–100% of field capacity. The objectives of this study were to evaluate rice growth, canopy light utilization, and yield of rice under different rain-catching and controlled irrigation modes (T1: light drought and low storage, T2: light drought and high storage), and to find the optimal storage depth after rain for rice. Measurements included the rice plant height, tiller number, high tiller growth, leaf angle, canopy interception rate, and yield shape. The plot experiment was conducted in 2012 and 2013 using Nanjing 44 (Oryza sativa L.) as the test material. The results showed that T1 treatment improved the height of rice plants and the number of effective tillers in the late growth stage. The number of high tillers had a great influence on the total leaf dry quality; compared with conventional irrigation (CK), the number of high tillers increased by 11.36% and 7.87% in T1 and T2, respectively; the canopy interception rate of T1 above 0 cm was higher than that in T2 and CK; and the leaf area index (LAI) was closely related to the 0–40 cm of canopy light distribution. The number of grains per panicle in T1 was lower than in CK and T2; however, the number of grains in T1 was less, and the 1000 grain weight was higher. On the 63 days and 83 days after transplanting in 2012 and 78 days after transplanting in 2013, the first, second, and third leaf angles of T1 were larger. Rain-catching and controlled irrigation can increase the dry weight and shoot dry weight of rice, and light drought and low storage (T1) conditions are good for maintaining a high yield because of more tiller number, more grains per panicle and reasonable light distribution.
1. Introduction
The photosynthetic potential productivity of rice mainly depends on two factors: the interception of photosynthetically active radiation and the conversion efficiency of photosynthetically available radiation energy. A reasonable crop population structure can form a good distribution of light within the canopy, increase the utilization of light energy, and thus increase yield [1]. Leaf morphology (such as leaf thickness, specific leaf area, and so forth) regulates plant absorptivity by changing the optical path [2]. Plants change their leaf morphology according to the surrounding light environment, making them more conducive to photosynthesis [3], and the changes in leaf morphology caused by light attenuation include the elongation of leaves [4], widening [5], and changes in leaf area [6].
Photosynthetically active radiation (PAR) in rice fields can be divided into three parts: penetration, reflection, and absorption. The leaf area index (LAI) affects the PAR interception of the canopy by affecting these three parts [7]. The interception rate of photosynthetically active radiation are different in different growth stages of rice [8]. With the advance of the growth period, the leaf inclination angle of the canopy first increases, and then decreases. The leaf angle distribution is closely related to the canopy light distribution, and the leaf angle is also the main factor determining the LAI distribution. In rice populations, the light reflectivity is low; the transmittance of light to the lower layer is higher in the upper part of the heading stage, while the larger leaf angle of the base is beneficial for the transmission of light from the upper layer and reduces the loss of light leakage [9].
The angular distribution of leaves is a key parameter determining radiation transmission within vegetation canopies [10,11]. The leaf angle between the stem and sheath (SSA) increases with the tiller age. The SSA of the same leaf rank increases with an increase in the N (nitrogen) rate. The maximum SSA increases with the leaf rank from the first to the third leaf, and then decreases from the third to the final leaf [12]. The canopy light and nitrogen distribution are related to the grain yield and nitrogen use efficiency in rice [13]. Additionally, erect leaves caused by brassinosteroid deficiency increase the biomass production and grain yield in rice [14]. Erect leaf phenotypes are desired to avoid shade when plants are grown at a high planting density [15], and plant architecture with an erect growth habit improves the light distribution and light use efficiency in the canopy [16,17].
The PROSTRATE GROWTH 1 gene has a notable quantitative influence on the canopy structure of rice, and there is a difference in the leaf inclination of different varieties of rice [18,19,20]. The typical rice HLH (helix loop helix) protein BRASSINOSTEROID UPREGULATED 1-LIKE1 (OsBUL1) is preferentially expressed in the lamina joint where it controls cell elongation and positively affects leaf angles [21]. However, leaf inclination can be adjusted by water and fertilizer management. Peng et al. [22] proved that the transmission coefficient of direct radiation decreases gradually from the upper to the lower layer, and the extinction coefficient gradually increases from the upper to the lower layer. This is beneficial for the downward transmission of light and the interception of light which lays a foundation for a high yield of rice. Water stress can effectively inhibit the growth of crops and induce the canopy structure to provide conditions for the compensation effect of rewatering after drought [23].
N is lost through surface runoff, leaching, and other ways, which can result in severe environmental pollution [24,25]. However, controlled drainage can reduce N losses from subsurface drain fields and improve farmland environments [26,27,28]. Several water-saving technologies have been developed to manage the water requirements of rice crops, with the traditional flooding irrigation mode of growing rice being gradually replaced by a water-saving irrigation mode. The water-saving irrigation practice contributes to a lower drainage potential, while controlled drainage reduces irrigation requirements. For example, alternate wetting and drying (AWD) technology can reduce the water input and increase the water use efficiency (WUE) and grain yield of rice; therefore, it has become popular in some parts of China [29,30,31,32]. Integrated water-saving irrigation and controlled drainage (WSI-CD) practices seem to have the desirable functions of water saving and pollutant reduction [33]. The water-saving irrigation mode is favorable for the early maturation of rice, while excessive water saving leads to a decrease in yield [34].
Controlled irrigation was effective in maintaining rice yield, increasing nitrogen recovery and reducing nitrogen losses from paddy fields [35], and fewer species were found in controlled irrigation fields than traditional irrigation fields [36]. Because of global warming, in the future some areas will receive more rainfall and others less, and there will be more drought and submergence stress [37,38,39,40]. A sharp alternation from drought to flooding is common during summer rice planting in China [41,42,43]. The yield of rain-fed rice is usually low [44,45], but the application of mineral fertilisers significantly increased rice yields under a rain-fed lowland rice ecosystem [46]. Combined with rain-fed planting mode and controlled irrigation, rain-catching and controlled irrigation technology has been put forward for consideration in ways that maintain different water levels in different growth stages after rain.
However, raising the water level would have some effects on the growth and development of rice, such as changes in the leaf inclination, the interception of the light layer, and the production of high tillers. Nagasawa et al. [47] indicated that axillary buds found in the leaf axils of rice could develop into tillers when the conditions are suitable, and high tillering can be controlled through temperature, light, and moisture. Rain-catching and controlled irrigation can decrease the drainage times and save water [48,49], but high water depth can cause waterlogging damage, so a suitable water depth after rain is the most important factor to rice. Leaf shape is an important feature of rice, but the leaf angle and light distribution under rain-catching and controlled irrigation have not been determined. This study aimed to determine the growth characteristics of rice and the leaf angle under rain-catching and controlled irrigation, the relationship between the LAI and canopy light distribution, and the relationship between high tillers and yield. We hope that this study will provide some reference for using rain water in southern China.
2. Materials and Methods
2.1. Site Description
Experiments were conducted under field conditions at the Water Saving Park of Hohai University Campus, of Jiangning in Nanjing (latitude 31°57 N, longitude 118°50 E, 15 m above sea level), from April–October of 2012 and May–October of 2013. The area is located downstream of the Yangtze River drainage basin and belongs to the north subtropical monsoon climate zone. It is hot in summer and cold in winter. The annual mean temperature is 16 °C; the absolute maximum and minimum temperatures of the area are 43 °C and −16.9 °C, respectively; annual precipitation is around 1062 mm; the frost free period is 224 days; the average sunshine duration is 2017.2 h; the annual evaporation is 1472.5 mm; and the average wind speed is 2.5 m/s. The depth of the groundwater in the experimental area is greater than 50 cm, the soil fertility is moderate, and the volumetric soil water content at field capacity (FC) is 43.46%. Table 1 shows the physical and chemical properties of the field soil. Table 2 shows the average monthly climate in 2012 and 2013.
2.2. Plant Material and Cultivation Practices
The rice variety Nanjing 44 (Oryza sativa L.) was used as the test material. The sowing dates were 20 April 2012 and 30 April 2013. The rice seedlings were raised in dry beds. The fertilizer application rate for urea was 10 g m−2, for calcium magnesium phosphate fertilizer it was 50 g m−2, and for potassium chloride it was 7.5 g m−2. As basal fertilizers, they were only applied once to the dry bed before sowing, and the dry bed area was 3 m2. Seedlings were transplanted on 1 June 2012 and 15 June 2013. In 2012, rice plots were fallowed after harvest, weeding and tillage were carried out in spring of 2013.
2.3. Water Regimes
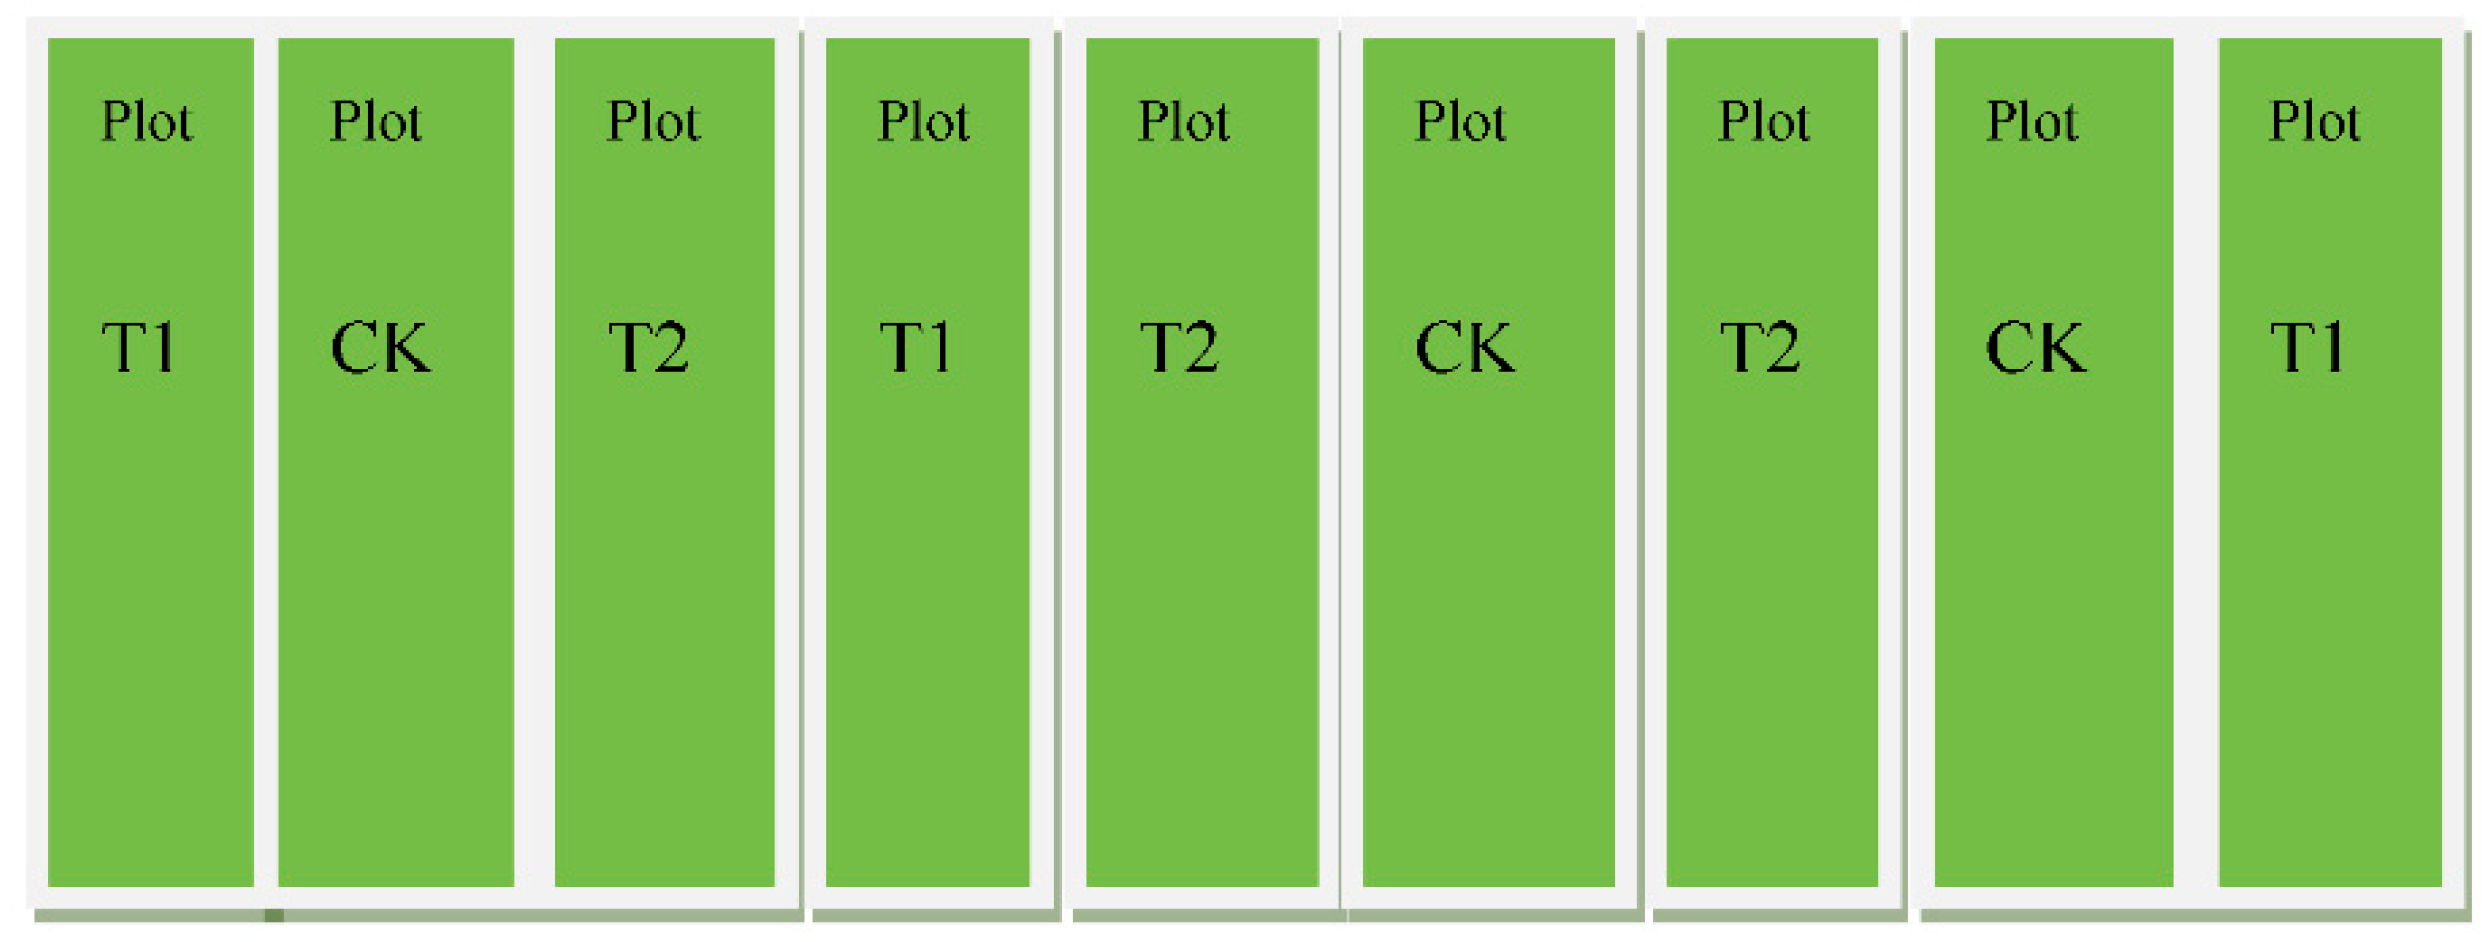
We carried out two rain-catching and controlled irrigation treatments: light drought and low storage (T1) and light drought and high storage (T2), while conventional irrigation was used as the control (CK). The maximum allowable flooding depth of the traditional submergence irrigation period, as well as the possible depth of water storage after 20 years of rainstorms in the Huaihe and Taihu basins in China, was fully taken into account in the experimental design (Table 3). The experiment was laid out in a randomized complete block design (RCBD) with the arrangements as shown in Figure 1. The average plot size was 20 m2 (2.5 m × 8 m). The plastic lining in the bunds was 45 cm deep to prevent the lateral flow of water between the plots. Seedlings were transplanted at a density of 25 holes m−2 and two plants per hole. Fertilizer at was applied at a rate of 265-80-75 kg ha−1 of N-P-K in three parts, firstly at transplanting stage, secondly at tillering stage, and thirdly at the panicle initiation stage. All fertilizers were artificially distributed. Irrigation water was pumped from the pond nearby and transported through pipes to the experimental plots, and the amount of irrigation water was measured by a water meter. Local farming practices were followed, without spraying insecticides and herbicides.
2.4. Measurements
- (1)
- The height of rice was measured using a ruler, and the tiller number per plot was calculated every 6–10 days in 2012 and 2013. The high tiller rate was also measured.
- (2)
- We used SUNSCAN (Delta-T Devices) to measure the PAR and LAI at 11:30~12:30 as the weather was clear and cloudless. The PAR interception rate was calculated based on the following equation:where FIPARh is the PAR interception rate of the canopy height (h); PARh is the PAR of the canopy height (μmol/(m2∙s)); and PART is the PAR of the top (μmol/(m2∙s)).FIPARh = 1 − PARh/PART
- (3)
- Leaf angle. We dug a soil block (5 cm × 5 cm × 5 cm) around the root of each plant at about 6:00, and then placed in an indoor water storage barrel for 1 h to maintain the natural state of the rice plant. Each tiller was photographed in a natural state. We adjusted the leaves to both sides of the background plate according to the direction of the leaves of each stem, and occasionally, when the non-half leaf sequence occurred, the rotation of the plant was adjusted to the appropriate position and a picture was added. After photographing, the leaf tilt angle was measured by Image-Pro Plus 5 software (Media Cybernetics, Inc., Rockville, MD, USA). For a straight blade, the angle between the base and the stem was measured, and the angle of the leaf was calculated. For a curved blade, the blade was divided into 2–5 segments according to the blade bending degree, and the average leaf angle was calculated from the leaf area as the weight, allowing the average leaf inclination to be obtained.
- (4)
- At the end of the growing season in 2013, the grain yield was measured in each plot, the spike length was measured by a ruler, and the effective spikes were calculated. Spikes were collected and first dried at 105 °C for 1 h, and then dried at 80 °C to a constant weight for 48 h to determine the yield component, including spike weight, filled grain, unfilled grain, setting rate, and 1000-grain weight.
2.5. Statistical Analysis
To test the significance levels of differences, the data were analysed using an analysis of variance (ANOVA) with SPSS 19.0 (IBM, Amun, NY, USA). Multiple comparisons were made using Duncan’s new multiple range test (MRT). The correlations between yield components and irrigation volume were analyzed with Pearson’s dual tests. In all cases, differences were treated as significant if p < 0.05.
3. Results
3.1. Plant Height and Tiller
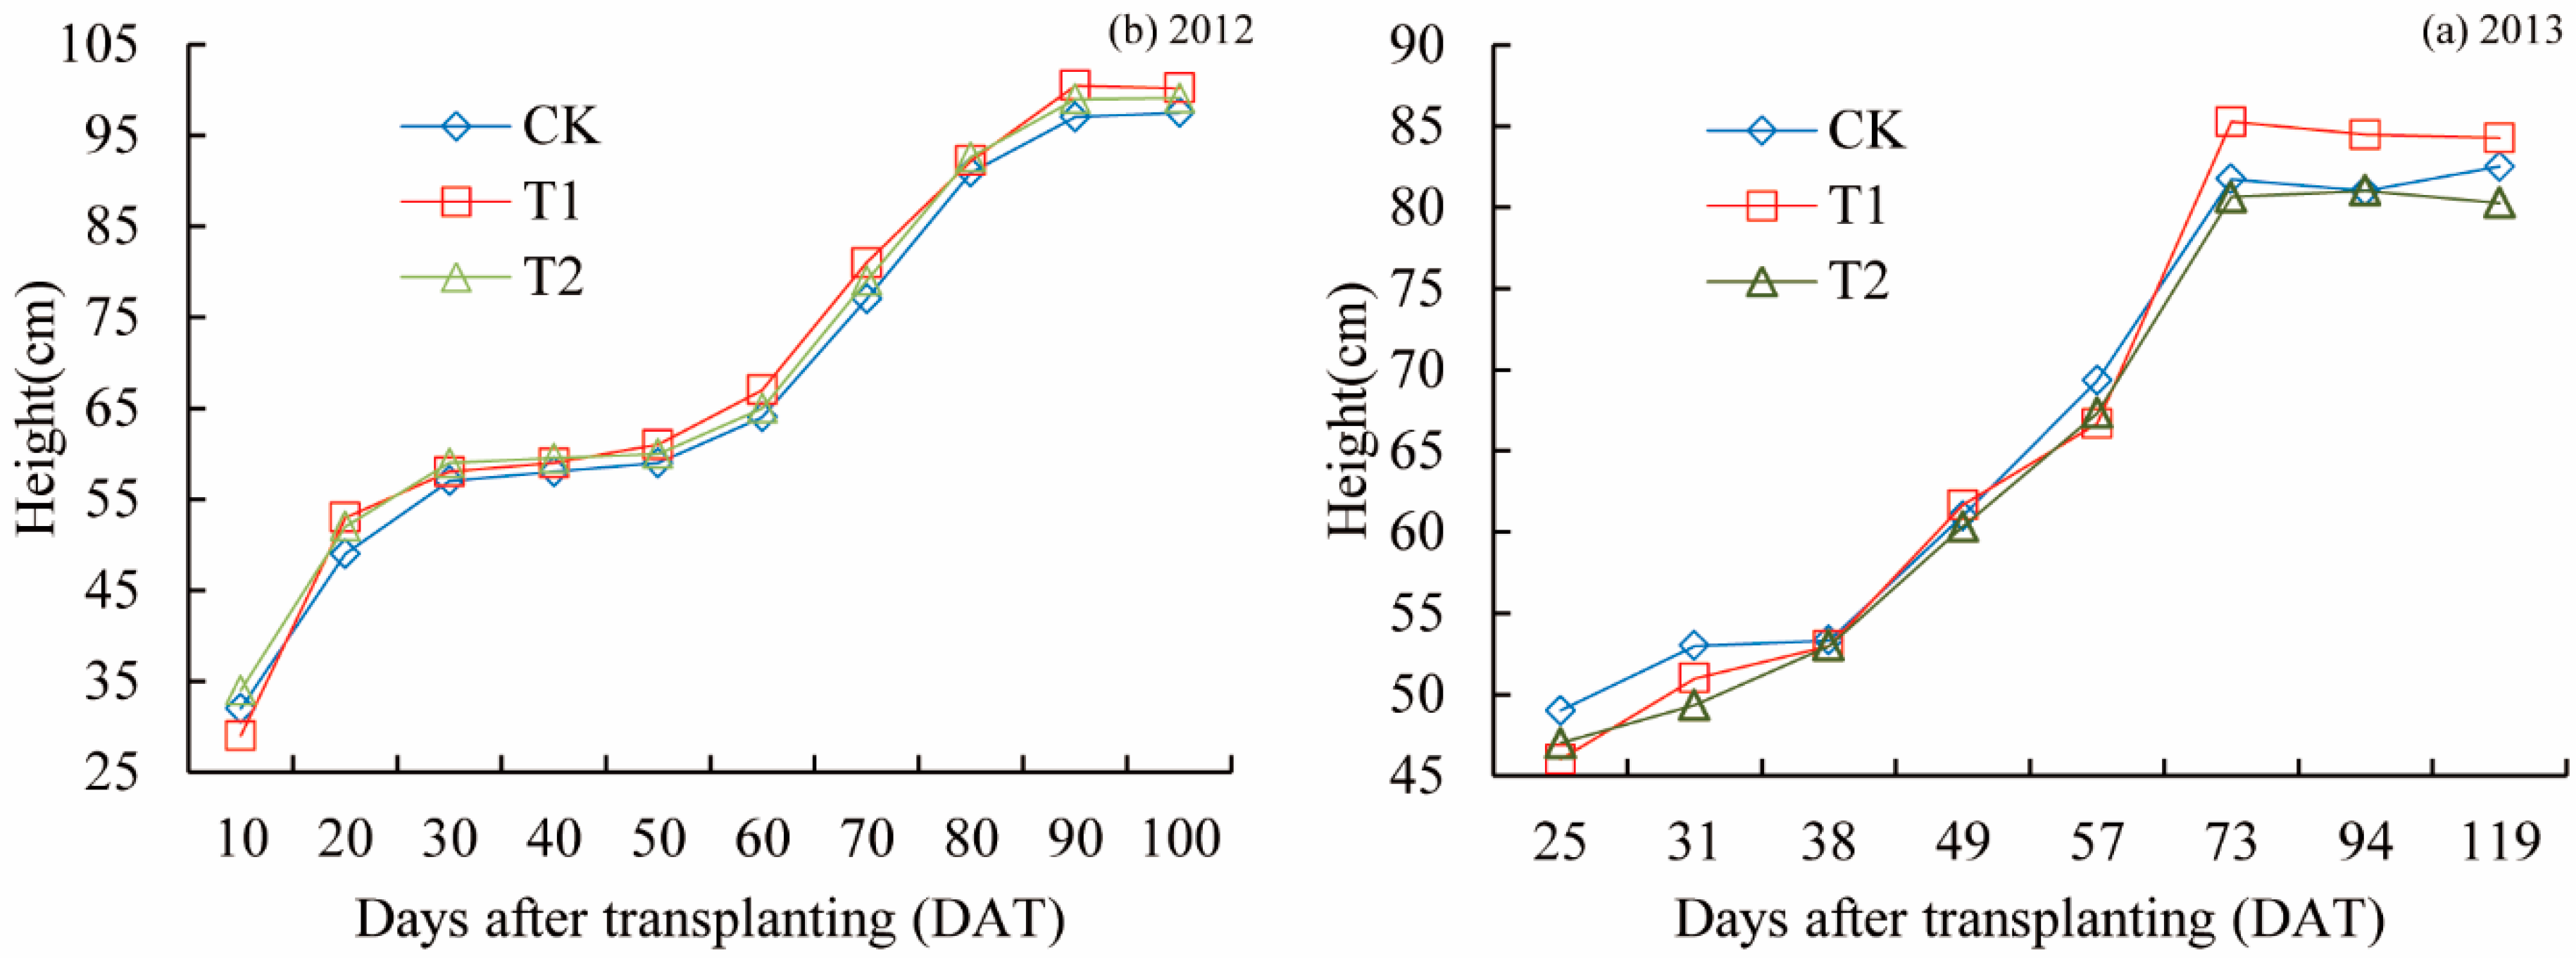
In 2012, the plant heights increased rapidly under all the three treatments (Figure 2a). The growth rate of the plant height slowed down at DAT (days after transplanting) 30, then increased rapidly at DAT 50, and tended to be stable and slightly decreased at DAT 90. After DAT 20, the plant heights of T1 and T2 were higher than that of CK. The plant height of T1 was higher than that of CK and T2 at DAT 90 and DAT 100.
In 2013, the plant heights in all three treatments increased continuously before DAT 73 and then tended to be stable and slightly decreased (Figure 2b). The height growth rate of T2 was higher than CK and T1 after DAT 57, and was significantly higher than CK and T2 at DAT 73 and 94.
The tiller number first increased and then decreased across the whole growth period in 2012 in all three treatments (Table 4), and in the later period, it became stable. The number of tillers reached the maximum at DAT 45, and the tiller number of T1 was 0.75 and 0.5 higher than those of CK and T2, respectively. The difference in the number of tillers of the three treatments in the rest period was not significant, but the number of tillers in T1 was slightly greater.
In 2013, the tiller number first increased and then decreased in all three treatments, and then increased notably, and finally decreased (Table 5). The number of tillers reached the maximum at DAT 38, the tiller number of T1 was 1 and 2 higher than those of CK and T2, respectively. The numbers of tillers in CK and T1 at DAT 119 were 1.33 and 1.66 higher than in T2, respectively, and the difference was not significant.
In the condition of CK, there was no significant difference in tiller number between 2012 and 2013 (Table 6), T1 and T2 were the same as CK. The tiller number of T2 in 2013 was the least.
3.2. Leaf Angle
In 2012, at DAT 43, both the second and third leaf angles of T1 and T2 were lower than those of CK, while the second leaf angle of the T2 treatment was 4.33° higher than that of CK at DAT 53 (Figure 3a). The first leaf angle of T1 was 11.43% higher than that of CK at DAT 63 (p < 0.05), and the second and third leaf angles were higher than those of CK and T2. At DAT 73, the first leaf angles of T1 and T2 decreased by 7.44% and 8.84% compared to CK, and the third leaf angle of T1 was significantly reduced by 12.3° and 10° compared with CK and T2. At DAT 83, the second and third leaf angles of T1 were higher than those of CK and T1. At DAT 93, the first leaf angles of T1 and T2 were lower than those of CK, and the second leaf angle of T2 was increased by 4° and 3° compared to CK and T2, respectively. At DAT 110, the three leaf angles of T were higher than those of CK and T2.
In 2013, at DAT 78, the third leaf angles of T1 and T2 were significantly higher than that of CK (Figure 3b). At DAT 93, the second leaf angle of T1 significantly decreased by 7.60% compared with CK, and the third leaf angle of T1 was also lower than those of CK and T2.
3.3. Canopy Interception
In 2012, at DAT 52 (Table 7), the interception rate of T1 was the highest (0.39). At DAT 106, the interception rates of T1 at 0 and 40 cm were higher than those of CK and T2, but the interception rate of T1 at 60 cm was 44.44% lower than that of T2 (p < 0.05), which was 37.5% lower than that of CK (p > 0.05).
In 2013, at DAT 64 (Table 8), the interception rates of T1 at 0, 5, 20, and 40 cm were significantly higher than those of CK and T2, and the interception rate of T1 at 20 cm was two times those of CK and T2. The difference between CK and T2 was not significant. At DAT 79, the interception rates of T1 at 0, 5, 20, 40, and 60 cm were higher than those of CK and T2, and the interception rates of T1 at 0, 5, and 40 significantly increased by 13.89%, 18.84%, and 38.30%, respectively, compared to those of T2. The interception rate of T2 was lower than that of CK. At DAT 93, the interception rates of T1 at all heights was higher than those of CK and T2, but the difference was not significant. The interception rates of T1 and T2 at 40 cm increased by 95.65% and 78.26% compared with CK, respectively, but the difference was not significant.
At DAT 52 and 106 in 2012 (Table 9), there was a significant positive correlation between the LAI and the 0 cm interception rate (r = 0.993, p < 0.01; r = 0.997, p < 0.01). At DAT 64 in 2013, the LAI was significantly positively correlated with the interception rates at 0 cm, 5 cm, and 20 cm (r = 0.992, 0.850, 0.826, p < 0.01). At DAT 79 in 2013, the interception rates at 0, 5, 20, and 40 cm had a significant positive correlations with the LAI (r = 0.0915, p < 0.01; r = 0.979, p < 0.01; r = 0.760, p < 0.05; r = 0.828, p < 0.01). At DAT 93 in 2013, there was a significant positive correlation between the interception rates at 0 cm, 5 cm, and 20 cm and the LAI.
3.4. Yield Characters
In 2012, the actual yield of T1 was 0.37 and 0.48 t/hm2 higher than of the yields of CK and T1, respectively, and the difference between the T1 and T2 yields was significant (Table 10). The theory yield of T1 was 0.23 and 0.0.30 t/hm2 higher than those of CK and T1, and the theory yield of T1 was significantly different from T2. Compared with CK, the ear lengths of T1 and T2 significantly increased by 6.46% and 9.78%, respectively, and the difference between T1 and T2 was also significant.
In 2013, compared with CK, the actual yields of T1 and T2 increased by 41.16% and 19.94% respectively. The theory yield of T1 significantly increased by 0.98 t/hm2, the theory yield of T2 was increased by 0.77 t/hm2, and the ear lengths of T1 and T2 increased by 8.01% and 7.60%, respectively.
In 2013, the tiller number, stem mass, leaf dry quality, spike quality, seed setting rate, and 1000 grain quality were higher for T1 and T2 than CK (Table 11). Compared with CK, the tiller numbers of T1 and T2 increased by 18.98% and 4.90%, but the difference was not significant. The spike quality of T1 and T2 increased by 27.58% and 21.61%, and the filled grain number of T1 increased by 14.67 (p > 0.05) and 23.26 (p < 0.05), while the amount of shriveled grain reduced by 5.45 (p > 0.05) and 6.2 (p > 0.05), respectively, compared with CK and T2.
Compared with CK, the number of high tillers in T1 and T2 increased by 11.36% and 7.87% (Table 12), and the spike quality of the high tillers of T1 decreased by 3.68 g (p > 0.05), while the spike quality of the high tillers in the T2 treatment increased by 3.95 g (p > 0.05). The stem mass of T1 decreased by 6.92%, and the stem lengths of T1 and T2 were lower than that of CK. After removing the high tillers, the stem masses of T1 and T2 increased by 90.65 g (p < 0.05) and 21.19 g (p > 0.05) compared with CK, the leaf dry masses increased by 24.39 g (p < 0.05) and 17.9 g (p > 0.05), and the spike quality increased by 101.79 g (p < 0.05) and 72.92 g (p > 0.05), respectively. The proportion of the spike quality of high tillers to the total spike quality was lower in T1 than in CK and T2.
The number of high tillers was not significantly correlated with the total tiller number (r = 0.614, p > 0.05) (Table 13), which was significantly positively correlated with the quality of the total stem (r = 0.698, p < 0.05). The spike quality of the high tillers was significantly positively correlated with the stem mass, dry mass, number, and stem length of the high tillers (p < 0.01); the total tiller number had a significant positive correlation with the total stem quality, leaf stem quality, and spikelet quality (r = 0.908, 0.849, 0.821, p < 0.01). The total stem and leaf dry quality had a significant positive correlation with the ear quality (r = 0.734, p < 0.05; r = 0.864, p < 0.01), and the correlations between the irrigation amount and the stem, leaf, and ear dry qualities were not significant. The dry weights of stems and leaves is the main influencing factor of panicle quality, and the number of high tillers has a great influence on the total dry weight of leaves.
4. Discussion
The height of a rice plant is directly related to the depth of water and generally increases with an increasing water depth [50]. Tillering is an important agronomic trait affecting crop biomass and grain yield [51], and the effective tillering rate of wet irrigation is the highest, followed by controlled irrigation and intermittent irrigation, with the lowest rate in flooding irrigation [52]. In our results, the height of T1 plants (lower water level after rain) was higher than that of T2 plants (high water level after rain), which may be because the rice was not always submerged in water, and the soil moisture was dry and wet alternately. The tiller number of T1 was higher than those of CK and T2, which helped to increased yield.
In rice plants, the flag leaf is metabolically most active during grain formation [53] and provides maximum carbon assimilates to the growing panicle [54]. The interception rate and LAI of the rice canopy and bending degree of the leaf can be obtained accurately using sensors [55,56], which is conducive to rapid and accurate data acquisition. Leaf traits are closely related to the LAI and canopy interception. The shapes of leaves are mainly controlled by genes [57,58,59]; however, changes in water and fertilizer can also affect the tiller number and leaf inclination. Nitrogen tends to make rice leaves droopier, and silica keeps them more erect. An increased nitrogen supply markedly increases the leaf length, width, and area [60]. Our results showed that, in 2012, after DAT 63, the second leaf angle was higher in T1 than in CK and T2. After DAT 83, the angles of the three leaves were higher, and thus more erect which promotes an increased yield in T1 than in T2. In 2013, at DAT 78, the angles of the three leaves of T1 and T2 were higher than those of CK, but at DAT 93, the angles of the three leaves of T1 were lower than those of T2. The light interception rate of T1 at 0 cm was higher than those of T2 and CK, which may be due to the higher dry mass of the total leaves in the upper part of T1, resulting in a larger total leaf area and higher leaf area index. In 2013, the light interception rate at each layer in T1 was higher than in CK and T2, which means that the proper reduction of the storage depth after rain is conducive to improving the utilization of light energy. The light interception rate at 60 cm was relatively low, indicating that the leaves above 60 cm were relatively upright which is conducive to the utilization of light energy of the lower leaves. The dry mass of the stems and leaves was higher in T1 than in CK and T2, which was the main reason for the higher final yield of T1.
The relationships between the LAI and dry matter, grain yield, and grain number were quadratic, and the LAI versus panicle number and grain number versus grain yield relationships were linear [61]. The productivity of water could be improved by making full use of rainfall at appropriate times of the year [62]. Waterlogging and drought could significantly reduce the number of tillers [63]. Waterlogging at the tillering stage can increase the occurrence rate of high tillering in rice. Under flooding conditions, applying multiple fertilizers can reduce the incidence of high tillering at the booting stage [64,65]. Studies on tillering traits and the yield of different nodes in rice have also been reported [66,67,68]. Our results showed that the number of grains per panicle was lower in T1 than in CK and T2, but T1 had less shriveled grains, a higher quality of 1000 grains, and more effective tillering, and the final total ear quality was higher than in CK and T2.
The theoretical and actual yields of T1 in 2012 and 2013 were higher than those of CK and T2, while the theoretical and actual yields of the T2 treatment in 2012 were lower than those of CK, but the difference was not significant despite being higher than CK in 2013. This indicates that lowering the storage depth properly is conducive to improving the rice yield. Although increasing the depth of water storage is more conducive to reducing nitrogen and phosphorus loss and reducing non-point source pollution in paddy fields [48,49], increasing storage depth is liable to cause waterlogging damage to rice, which is not conducive to its growth and development [69].
5. Conclusions
Light drought and low storage (T1) can promote an increase in plant height in the late growth stage, and more effective tillering promotes an increased yield. Throughout the growth period, the leaf inclination angle was shown to change more obviously in T1 compared to the other two conditions, and there was no obvious pattern. The LAI was shown to be closely related to a 0–40 cm canopy, especially below 20 cm. Rain-catching and controlled irrigation can increase the dry weight of the rice stem and leaf and the total dry weight of the aerial part, and its effect at low water storage depths is better. Also, rain-catching and controlled irrigation can increase high tiller number, but the high tiller had no significant effect on the total spike quality. The results of this study were based on plot experiments and need to be verified in field experiments. It is also necessary to strengthen the research of the dynamics of dry matter accumulation in various organs of rice as well as the leaf photosynthesis and physiological indexes after rain storage.
Author Contributions
Conceptualization, X.G.; Methodology, Z.W.; Software, B.Z.; Validation, H.L., X.Q. and X.G.; Formal Analysis, H.L. and J.J.T.; Investigation, B.Y. and Y.H.; Resources, X.G. and D.Q.; Data Curation, B.Z.; Writing-Original Draft Preparation, H.L.; Writing-Review & Editing, H.L.; Visualization, H.L.; Supervision, X.G.; Project Administration, Z.W.; Funding Acquisition, X.Q.
Funding
This research was funded by [Program of the National Natural Science Foundation of China] grant number (51070942, 51309080, 5167091281, 51879268) and (the Agricultural Science and Technology Innovation Program (ASTIP) of the Chinese Academy of Agricultural Sciences (CAAS)).
Conflicts of Interest
The authors declare no conflict of interest.
References
- Niinemets, Ü. A review of light interception in plant stands from leaf to canopy in different plant functional types and in species with varying shade tolerance. Ecol. Res. 2010, 25, 693–714. [Google Scholar] [CrossRef]
- Enríquez, S.; Pantoja-Reyes, N.I. Form-function analysis of the effect of canopy morphology on leaf self-shading in the seagrass Thalassia testudinum. Oecologia 2005, 145, 235–243. [Google Scholar] [CrossRef] [PubMed]
- Ruiz, J.M.; Romero, J. Effects of in situ experimental shading on the Mediterranean seagrass Posidonia oceanica. Mar. Ecol. Prog. Ser. 2001, 215, 107–120. [Google Scholar] [CrossRef]
- Gordon, D.M.; Grey, K.A.; Chase, S.C.; Simpson, C.J. Changes to the structure and productivity of a Posidonia sinuosa, meadow during and after imposed shading. Aquat. Bot. 1994, 47, 265–275. [Google Scholar] [CrossRef]
- Lee, K.S.; Dunton, K.H. Effect of in situ light reduction on the maintenance, growth and partitioning of carbon resources in Thalassia testudinum Banks ex Konig. J. Exp. Mar. Biol. Ecol. 1997, 210, 53–73. [Google Scholar] [CrossRef]
- Campbell, S.J.; Miller, C.J. Shoot and abundance characteristics of the seagrass Heterozostera tasmanica in Westernport estuary (South-Eastern Australia). Aquat. Bot. 2002, 3, 33–46. [Google Scholar] [CrossRef]
- Casanova, D.; Epema, G.F.; Goudriaan, J. Monitoring rice reflectance at field level for estimating biomass and LAI. Field Crops Res. 1998, 55, 83–92. [Google Scholar] [CrossRef]
- Xie, L.; Xu, Z.; Liu, H. Distribution of Photosynthetic Active Radiation in Different Panicle Type Rice Communities during Later Growth Stage. J. Jilin Agric. Univ. 2004, 26, 476–479. [Google Scholar]
- Zhang, X.; Lu, C.; Hu, N.; Yao, K.; Zhang, Q.; Dai, Q. Simulation of Leaf Inclination Angle Distribution for Rice with Different Plant Types. Chin. J. Rice Sci. 2012, 26, 205–210. [Google Scholar]
- Lemeur, R.; Blad, B.L. A critical review of light models for estimating the short-wave radiation regime of plant canopies. Agric. For. Meteorol. 1974, 14, 255–286. [Google Scholar] [CrossRef]
- Myneni, R.B.; Ross, J.; Asrar, G. A review on the theory of photon transport in leaf canopies. Agric. For. Meteorol. 1989, 45, 1–153. [Google Scholar] [CrossRef]
- Zhang, Y.; Tang, L.; Liu, X.; Liu, L.; Cao, W.; Yan, Z. Modeling the leaf angle dynamics in rice plant. PLoS ONE 2017, 12, e0171890. [Google Scholar] [CrossRef] [PubMed]
- Gu, J.; Chen, Y.; Zhang, H.; LI, Z.; Zhou, Q.; Yu, C.; Kong, X.; Liu, L.; Wang, Z.; Yang, J. Canopy light and nitrogen distributions are related to grain yield and nitrogen use efficiency in rice. Field Crops Res. 2017, 206, 74–85. [Google Scholar] [CrossRef]
- Sakamoto, T.; Morinaka, Y.; Ohnishi, T.; Sunohara, H.; Fujioka, S.; Ueguchi-Tanaka, M.; Mizutani, M.; Sakata, K.; Takatsuto, S.; Yoshida, S.; et al. Erect leaves caused by brassinosteroid deficiency increase biomass production and grain yield in rice. Nat. Biotechnol. 2006, 24, 105–109. [Google Scholar] [CrossRef] [PubMed]
- Van Camp, W. Yield enhancement genes: Seeds for growth. Curr. Opin. Biotechnol. 2005, 6, 147–153. [Google Scholar] [CrossRef] [PubMed]
- Sharma-Natu, P.; Ghildiyal, M.C. Potential targets for improving photosynthesis and crop yield. Curr. Sci. 2005, 88, 1918–1928. [Google Scholar]
- Katsura, K.; Maeda, S.; Lubis, I.; Horie, T.; Cao, W.X.; Shiraiwa, T. The high yield of irrigated rice in Yunnan, China: A cross-location analysis. Field Crops Res. 2008, 107, 1–11. [Google Scholar] [CrossRef]
- Hua, S.; Cao, B.; Zheng, B.; Lia, B.; Sun, C. Quantitative evaluation of influence of Prostrate Growth 1 gene on rice canopy structure based on three-dimensional structure model. Field Crops Res. 2016, 194, 65–74. [Google Scholar] [CrossRef]
- Kumagai, E.; Hamaoka, N.; Araki, T.; Ueno, O. Dorsoventral asymmetry of photosynthesis and photoinhibition in flag leaves of two rice cultivars that differ in nitrogen response and leaf angle. Physiol. Plant. 2014, 151, 533–543. [Google Scholar] [CrossRef] [PubMed]
- Goto, A.; Sasahara, H.; Shigemune, A.; Miura, K. Hokuriku 193: A new high-yielding indica rice cultivar bred in Japan. Jpn. Agric. Res. Q. 2012, 43, 13–18. [Google Scholar] [CrossRef]
- Jang, S.; An, G.; Li, H.Y. Rice leaf angle and grain size are affected by the OsBUL1 transcriptional activator complex. Plant Physiol. 2017, 173, 688–702. [Google Scholar] [CrossRef] [PubMed]
- Peng, S.; Liu, F. Study on canopy characteristics of rice under different water supplies. Water Sav. Irrig. 2004, 6, 1–3. [Google Scholar]
- Hao, S.; Guo, X.; Zhang, Z. Compensation Effects of Water Stress and Rewatering on the Structure of Rice Canopy. Trans. Chin. Soc. Agric. Mach. 2010, 41, 52–55. [Google Scholar]
- Ju, X.T.; Xing, G.X.; Chen, X.P.; Zhang, S.L.; Zhang, L.J.; Liu, X.J.; Cui, Z.L.; Yin, B.; Christiea, P.; Zhu, Z.L.; et al. Reducing environmental risk by improving N management in intensive Chinese agricultural systems. Proc. Natl. Acad. Sci. USA 2009, 106, 3041–3046. [Google Scholar] [CrossRef] [PubMed] [Green Version]
- Chen, X.P.; Cui, Z.L.; Fan, M.S.; Vitousek, P.; Zhao, M.; Ma, W.Q.; Wang, Z.L.; Zhang, W.J.; Yan, X.Y.; Yang, J.C.; et al. Producing more grain with lower environmental costs. Nature 2014, 514, 486–491. [Google Scholar] [CrossRef] [PubMed]
- Ng, H.Y.F.; Tan, C.S.; Drury, C.F.; Gaynor, J.D. Controlled drainage and subirrigation influences tile nitrate loss and corn yields in a sandy loam soil in Southwestern Ontario. Agric. Ecosyst. Environ. 2002, 90, 81–88. [Google Scholar] [CrossRef]
- Woli, K.P.; David, M.B.; Cooke, R.A.; McIsaac, G.F.; Mitchell, C.A. Nitrogen balance in and export from agricultural fields associated with controlled drainage systems and denitrifying bioreactors. Ecol. Eng. 2010, 36, 1558–1566. [Google Scholar] [CrossRef]
- Skaggs, R.W.; Fausey, N.R.; Evans, R.O. Drainage water management. J. Soil Water Conserv. 2012, 67, 167–172. [Google Scholar] [CrossRef] [Green Version]
- Bouman, B.A.M. A conceptual framework for the improvement of crop water productivity at different spatial scales. Agric. Syst. 2007, 93, 43–60. [Google Scholar] [CrossRef]
- Ye, Y.; Liang, X.Q.; Chen, Y.X.; Liu, J.; Gu, J.T.; Guo, R.; Liang, L. Alternate wetting and drying irrigation and controlled-release nitrogen fertilizer in late-season rice. Effects on dry matter accumulation, yield, water and nitrogen use. Field Crops Res. 2013, 144, 212–224. [Google Scholar] [CrossRef]
- Lampayan, R.M.; Samoy-Pascual, K.C.; Sibayan, E.B.; Ella, V.B.; Jayag, O.P.; Cabangon, R.J.; Bouman, B.A.M. Effects of alternate wetting and drying (AWD) threshold level and plant seedling age on crop performance, water input, and water productivity of transplanted rice in Central Luzon, Philippines. Paddy Water Environ. 2015, 13, 215–227. [Google Scholar] [CrossRef]
- Tan, X.; Shao, D.; Liu, H.; Yang, F.S.; Xiao, C.; Yang, H.D. Effects of alternate wetting and drying irrigation on percolation and nitrogen leaching in paddy fields. Paddy Water Environ. 2013, 11, 381–395. [Google Scholar] [CrossRef]
- Peng, S.; Luo, Y.; Xu, J.; Shahbaz, K.; Jiao, X.; Wang, W. Integrated Irrigation and Drainage Practices to Enhance Water Productivity and Reduce Pollution in a Rice Production System. Irrig. Drain. 2012, 61, 285–293. [Google Scholar] [CrossRef]
- Sun, Y.; Wang, Q.; Zeng, X.; Bian, J.; Feng, Y. Effect of water-saving irrigation on growth and yield of rice in Heilongjiang Province. Heilongjiang Agric. Sci. 2010, 12, 14–16. [Google Scholar]
- Yang, S.; Peng, S.; Xu, J.; He, Y.; Wang, Y. Effects of water saving irrigation and controlled release nitrogen fertilizer managements on nitrogen losses from paddy fields. Paddy Water Environ. 2015, 13, 71–80. [Google Scholar] [CrossRef]
- Luo, Y.; Fu, H.; Xiong, Y.; Xiang, Z.; Wang, F.; Bugingo, Y.C.; Khan, S.; Cui, Y. Effects of water-saving irrigation on weed infestation and diversity in paddy fields in East China. Paddy Water Environ. 2016, 15, 1–12. [Google Scholar] [CrossRef]
- Parry, M.L.; Canziani, O.F.; Palutikof, J.P. (Eds.) Contribution of Working Group II to the Fourth Assessment Report of the Intergovernmental Panel on Climate Change; Cambridge University Press: New York, NY, USA, 2007. [Google Scholar]
- Emanuel, K. Increasing destructiveness of tropical cyclones over the past 30 years. Nature 2005, 436, 686–688. [Google Scholar] [CrossRef] [PubMed]
- Ghadikolaei, M.B.; Vaghefi, N.; Shamsudin, M.N.; Makmom, A. The economic impact of climate change on the rice production in Malaysia. Int. J. Agric. Res. 2011, 6, 67–74. [Google Scholar]
- International Food Policy Research Institute (IFPRI). Food Security, Farming and Climate Change to 2050, Scenarios, Results and Policy Options; IFPRI: Washington, DC, USA, 2010. [Google Scholar]
- Guo, X.P.; Zhen, B.; Lu, H. Research advances in pile-up effects of drought and waterlogging alternative stress on rice. Adv. Sci. Technol. Water Resour. 2013, 33, 83–86. [Google Scholar]
- Feng, G.; Yang, H.; Zhang, S.; Wang, K.; Shen, B. A preliminary research on the reason of a sharp turn from drought to flood in the middle and lower reaches of the Yangtze River in late spring and early summer of 2011. Chin. J. Atmos. Sci. 2012, 36, 1009–1026. [Google Scholar]
- He, H.; Lu, H. Characteristics of the Sharp Turn from Drought to Flood over Guangxi in Summer of 2013. Trop. Geogr. 2013, 4, 767–775. [Google Scholar]
- Linquist, B.A.; Phengsouvanna, V.; Sengxue, P. Benefits of organic residues and chemical fertilizer to productivity of rain-fed lowland rice and to soil nutrient balances. Nutr. Cycling Agroecosyst. 2007, 79, 59–72. [Google Scholar] [CrossRef]
- Hasegawa, T.; Sawano, S.; Goto, S.; Konghakote, P.; Polthanee, A.; Ishigooka, Y.; Kuwagata, T.; Toritani, H.; Furuya, J. A model driven by crop water use and nitrogen supply for simulating changes in the regional yield of rain-fed lowland rice in Northeast Thailand. Paddy Water Environ. 2008, 6, 73–82. [Google Scholar] [CrossRef]
- Ly, P.; Jensen, L.S.; Bruun, T.B.; Neergaard, A.D. Methane (CH4) and nitrous oxide (N2O) emissions from the system of rice intensification (SRI) under a rain-fed lowland rice ecosystem in Cambodia. Nutr. Cycling Agroecosyst. 2013, 97, 13–27. [Google Scholar] [CrossRef]
- Nagasawa, N.; Miyoshi, M.; Sano, Y.; Nagato, Y. DL regulates both leaf and pistil development in rice. Rice Genet. Newsl. 1996, 13, 102–105. [Google Scholar]
- Guo, X.P.; Yuan, J.; Guo, F. Preliminary study on water-catching and controlled irrigation technology of rice. Trans. CSAE 2009, 25, 70–73. [Google Scholar]
- Guo, X.; Wang, F.; Wang, Z.; Huang, S.; Liu, W. Effects of Irrigation Modes on Yield and Chlorophyll Fluorescence Characteristics after Heading Stage of Rice. J. Irrig. Drain. 2017, 36, 1–6. [Google Scholar]
- De Datta, S.K. Principles and Practices of Rice Production; John Wiley & Sons: New York, NY, USA, 1981; p. 618. [Google Scholar]
- He, J.; Shao, G.; Wei, X.; Huang, F.; Sheng, Z.; Tang, S.; Hu, P. Fine mapping and candidate gene analysis of qTAC8, a major quantitative trait locus controlling tiller angle in rice (Oryza sativa L.). PLoS ONE 2017, 12, 0178177. [Google Scholar] [CrossRef] [PubMed]
- Zhu, S.; Sun, A.; Zhang, Z.; Wang, Z.; Du, P. Effects of Different Water-saving Irrigation Modes on Rice Tillering, Height and Yield in Cold Area. Water Sav. Irrig. 2013, 12, 16–19. [Google Scholar]
- Biswas, A.K.; Choudhuri, M.A. Mechanism of Monocarpic Senescence in Rice. Plant Physiol. 1980, 65, 340–345. [Google Scholar] [CrossRef] [PubMed] [Green Version]
- Mohapatra, P.K.; Masamoto, Y.; Morita, S.; Takanashi, J.; Kato, T.; Itani, T.; Adu-Gyamfi, J.J.; Shunmugasundaram, M.; Nguyen, N.T.; Fujita, K. Partitioning of C-La-belled Photosynthate Varies with Growth Stage and Panicle Size in High Yielding Rice. Funct. Plant Biol. 2004, 31, 131–139. [Google Scholar] [CrossRef]
- Zhou, L.Q.; Shi, Z.; Tian, Y.F. Rapid estimation of rice canopy LAI using multi-source proximal sensors. In Precision Agriculture 13; Stafford, J.V., Ed.; Wageningen Academic Publishers: Wageningen, The Netherlands, 2013; pp. 87–93. [Google Scholar]
- Zheng, Z.; Hiroyoshi, I.; Yutaka, H.; Yoshiyasu, T. Quantitative evaluation of the degree of sprout leaf bending of rice cultivars using P-type Fourier descriptors and rincipal component analysis. Euphytica 2008, 163, 259–266. [Google Scholar] [CrossRef]
- Dong, Y.; Kamiunten, H.; Ogawa, T.; Tsuzuki, E.; Terao, H.; Lin, D.; Matsuo, M. Mapping of QTLs for leaf developmental behavior in rice (Oryza sativa L.). Euphytica. 2004, 138, 169–175. [Google Scholar] [CrossRef]
- Li, Z.; Paterson, A.H.; Pinson, S.R.M.; Stanse, J.W. RFLP facilitated analysis of tiller and leaf angles in rice (Oryza sativa L.). Euphytica 1999, 109, 79–84. [Google Scholar] [CrossRef]
- Luo, X.; Zheng, J.; Huang, R.; Huang, Y.; Wang, H.; Jiang, L.; Fang, X. Phytohormones signaling and crosstalk regulating leaf angle in rice. Plant Cell Rep. 2016, 35, 2423–2433. [Google Scholar] [CrossRef] [PubMed]
- Yoshida, S.; Navasero, S.A.; Ramirez, E.A. Effects of silica and nitrogen supply on some leaf characters of the rice plant. Plant Soil 1969, 31, 48–56. [Google Scholar] [CrossRef]
- Venkateswarlu, B.; Rao, P.K.; Rao, A.V. Canopy analysis on the relationships between leaf area index and productivity in lowland rice, Oryza sativa L. Plant Soil 1976, 45, 49–56. [Google Scholar] [CrossRef]
- Mdemu, M.V.; Magayane, M.D.; Lankford, B.; Hatibu, N.; Kadigi, R.M.J. Conjoining rainfall and irrigation seasonality to enhance productivity of water in rice irrigated farms in the Upper Ruaha River Basin, Tanzania. Phys. Chem. Earth Parts A/B/C 2004, 29, 1119–1124. [Google Scholar] [CrossRef]
- Suralta, R.R.; Yamauchi, A. Root growth, aerenchyma development, and oxygen transport in rice genotypes subjected to drought and waterlogging. Environ. Exp. Bot. 2008, 64, 75–82. [Google Scholar] [CrossRef]
- Li, S.; Li, Y.; Wu, H.; Liao, J.; Li, D. Optimum fertilization and its corresponding mechanism under complete submergence at booting stage in rice. Acta Agron. Sin. 2002, 8, 115–120. [Google Scholar]
- Ning, J.; Huo, Z.; Long, Z.; Shen, J.; Liu, B. The Preliminary Study in Rice Morphology under Waterlogging Stress. Chin. Agric. Sci. Bull. 2013, 29, 24–29. [Google Scholar]
- Chen, J.; Duan, R.; Peng, B.; Dong, S.; Lu, Z.; Zhang, Y.; Feng, D.; Xu, H.; Chen, S.; Zhang, Q.; et al. Study on the Intensified Cultivation Techniques of Hybrid Rice for High-yield and High Quality. Chin. Agric. Sci. Bull. 2009, 25, 138–142. [Google Scholar]
- Wei, M.; Liao, X.; Li, D.; Duan, H. Comparison of tillering productivity among nodes along the mian stem of rice. Chin. J. Plant Ecol. 2012, 36, 324–332. [Google Scholar] [CrossRef]
- Zhou, H.; Lu, X.; Zheng, Q. Studies on Tiller Regularity of Middle tillering Part and Productive Forces of Rice. Acta Agric. Boreal. Sin. 2000, 15, 112–117. [Google Scholar]
- Shao, G.; Cui, J.; Yu, S.; Lu, B.; Brian, B.J.; Ding, J.; She, D. Impacts of controlled irrigation and drainage on the yield and physiological attributes of rice. Agric. Water Manag. 2015, 149, 156–165. [Google Scholar] [CrossRef]
Figure 1.
The arrangement of all treatments.

Figure 2.
Changes in the plant height of rice under rain catching and controlled irrigationin 2012 (a) and 2013 (b); DAT: days after transplanting.
Figure 2.
Changes in the plant height of rice under rain catching and controlled irrigationin 2012 (a) and 2013 (b); DAT: days after transplanting.

Figure 3.
Leaf angles of different leaves of rice under rain-catching and controlled irrigationin 2012 (a) and 2013 (b).
Figure 3.
Leaf angles of different leaves of rice under rain-catching and controlled irrigationin 2012 (a) and 2013 (b).


Table 1.
Physical and chemical properties of the soil.
| Soil Depth/cm | Soil Texture | Organic Matter/(mg∙kg−1) | pH | Total Phosphorus/(mg∙kg−1) | Available P/(mg∙kg−1) | Total N/% | Available Nitrogen/(mg∙kg−1) |
|---|---|---|---|---|---|---|---|
| 0~20 | Clay | 8.06 | 8.06 | 330.9 | 10.13 | 0.1 | 65 |
Table 2.
Nanjing monthly average climate in 2012 and 2013.
| Meteorological Index | 2012 | 2013 | ||||||||||||
|---|---|---|---|---|---|---|---|---|---|---|---|---|---|---|
| Apr | May | Jun | Jul | Aug | Sep | Oct | Apr | May | Jun | Jul | Aug | Sep | Oct | |
| Rain (mm) | 73 | 102 | 193 | 186 | 129 | 72 | 65 | 24.2 | 101.2 | 154.6 | 245.2 | 63.4 | 63.2 | 27.4 |
| Temperature (°C) | 15.5 | 21 | 25 | 28.5 | 28 | 23 | 17.5 | 13.4 | 18.6 | 21.9 | 26.9 | 29.1 | 24.8 | 20.7 |
| Humidity (%) | 73 | 74 | 78 | 81 | 81 | 79 | 77 | 62.6 | 78.7 | 82.6 | 72.2 | 72.8 | 79.6 | 76.7 |
Note: The meteorological data came from the HOBO U30-NRC automatic weather station (Onset, USA).
Table 3.
Experimental design of controllable irrigation.
| Treatment | Seedling | Early Tillering | Later Tillering | Elongation | Heading | Milky | Ripening |
|---|---|---|---|---|---|---|---|
| CK | 10~30~70 | 0~30~70 | 0~30~90 | 0~30~120 | 0~30~100 | 0~30~60 | 70~80% |
| T1 | 10~30~70 | 80%~100%~80 | 70%~100%~100 | 70%~100%~150 | 80%~100%~150 | 80%~100%~80 | 70~80% |
| T2 | 10~30~70 | 80%~100%~100 | 70%~100%~120 | 70%~100%~200 | 80%~100%~200 | 80%~100%~80 | 70~80% |
Note: The three given data points (mm), for example 10~30~70, refer to the lower limit of irrigation, the upper limit of irrigation, and the maximum water-catching depth after rain. 80%~100%~80 means that the soil moisture is maintained at 80%~100% of saturated water content of 0~30 cm soil layer as there is no rain, and the water depth is maintained at 80 mm after rain.
Table 4.
Number of tillers per plot in 2012.
| Treatment | Days after Transplanting | ||||||||||
|---|---|---|---|---|---|---|---|---|---|---|---|
| 10 | 17 | 24 | 31 | 38 | 45 | 52 | 59 | 66 | 73 | 80 | |
| CK | 2.25 a | 4.25 a | 6.50 a | 7.50 a | 9.00 a | 9.50 b | 9.50 a | 8.75 a | 8.25 a | 8.25 a | 8.00 a |
| T1 | 2.50 a | 4.50 a | 6.75 a | 8.00 a | 9.25 a | 10.25 a | 9.75 a | 8.75 a | 8.50 a | 8.25 a | 8.25 a |
| T2 | 2.75 a | 4.00 a | 6.25 a | 7.75 a | 8.75 a | 9.75 b | 9.50 a | 8.75 a | 8.00 a | 7.75 a | 8.00 a |
Note: In the column, averages followed by common letter(s) are not significantly different at a level of p < 0.05. The same applies for the table below.
Table 5.
Number of tillers per plot in 2013.
| Treatment | Days after Transplanting | |||||||
|---|---|---|---|---|---|---|---|---|
| 25 | 31 | 38 | 49 | 57 | 73 | 94 | 119 | |
| CK | 7.33 a | 7.33 a | 8.33 ab | 8.00 a | 7.67 a | 7.00 ab | 8.00 a | 8.00 a |
| T1 | 7.67 a | 8.00 a | 9.33 a | 8.33 a | 8.00 a | 8.33 a | 8.33 a | 8.33 a |
| T2 | 5.33 a | 6.67 a | 7.33 b | 7.00 a | 6.33 a | 6.67 b | 6.67 a | 6.67 a |
Table 6.
Number of tillers per plot on 31, 38 and 73 in 2012 and 2013.
| Year | Treatment | Days after Transplanting | ||
|---|---|---|---|---|
| 31 | 38 | 73 | ||
| 2012 | CK | 7.50 a | 9.00 a | 8.25 a |
| T1 | 8.00 a | 9.25 a | 8.25 a | |
| T2 | 7.75 a | 8.75 ab | 7.75 ab | |
| 2013 | CK | 7.33 a | 8.33 ab | 7.00 ab |
| T1 | 8.00 a | 9.33 a | 8.33 a | |
| T2 | 6.67 a | 7.33 b | 6.67 b | |
Table 7.
Leaf area index (LAI) and photosynthetically active radiation (PAR) in 2012.
| DAT | Treatment | t | LAI | Canopy Interception | ||||
|---|---|---|---|---|---|---|---|---|
| 0 | 20 | 40 | 60 | 80 | ||||
| 52 | CK | 0.71 ± 0.07 a | 0.99 ± 0.36 a | 0.29 ± 0.07 a | ||||
| T1 | 0.60 ± 0.12 a | 1.48 ± 0.45 a | 0.39 ± 0.12 a | |||||
| T2 | 0.73 ± 0.19 a | 0.95 ± 0.77 a | 0.28 ± 0.19 a | |||||
| 106 | CK | 0.34 ± 0.11 a | 2.67 ± 0.92 a | 0.66 ± 0.12 a | 0.52 ± 0.09 a | 0.35 ± 0.09 a | 0.16 ± 0.05 ab | 0.03 ± 0.02 a |
| T1 | 0.29 ± 0.07 a | 2.93 ± 0.70 a | 0.71 ± 0.07 a | 0.51 ± 0.03 a | 0.38 ± 0.05 a | 0.10 ± 0.03 b | 0.04 ± 0.04 a | |
| T2 | 0.43 ± 0.10 a | 2.00 ± 0.56 a | 0.57 ± 0.11 a | 0.51 ± 0.11 a | 0.35 ± 0.16 a | 0.18 ± 0.01 a | 0.04 ± 0.02 a | |
Note: In the column, averages followed by common letter(s) are not significantly different at a level of p < 0.05. T1: light drought and low storage, T2: drought and high storage, CK: conventional irrigation. The same applies for the table below.
Table 8.
LAI and PAR in 2013.
| DAT | Treatment | t | LAI | Canopy Interception at Different Height (cm) | ||||
|---|---|---|---|---|---|---|---|---|
| 0 | 5 | 20 | 40 | 60 | ||||
| 64 | CK | 0.39 ± 0.09 a | 2.15 ± 0.49 b | 0.61 ± 0.08 b | 0.52 ± 0.03 b | 0.29 ± 0.08 b | 0.05 ± 0.02 b | |
| T1 | 0.24 ± 0.05 b | 3.38 ± 0.38 a | 0.76 ± 0.05 a | 0.73 ± 0.05 a | 0.60 ± 0.05 a | 0.13 ± 0.08 a | ||
| T2 | 0.40 ± 0.04 a | 2.11 ± 0.23 b | 0.60 ± 0.04 b | 0.54 ± 0.03 b | 0.30 ± 0.05 b | 0.07 ± 0.04 b | ||
| 79 | CK | 0.20 ± 0.05 b | 3.30 ± 0.58 ab | 0.80 ± 0.03 a | 0.76 ± 0.05 ab | 0.64 ± 0.07 a | 0.50 ± 0.10 ab | 0.14 ± 0.04 a |
| T1 | 0.18 ± 0.03 b | 3.90 ± 0.17 a | 0.82 ± 0.03 a | 0.82 ± 0.03 a | 0.76 ± 0.05 a | 0.65 ± 0.07 a | 0.17 ± 0.11 a | |
| T2 | 0.28 ± 0.02 a | 2.69 ± 0.27 b | 0.72 ± 0.02 b | 0.69 ± 0.03 b | 0.63 ± 0.07 a | 0.47 ± 0.09 b | 0.13 ± 0.03 a | |
| 93 | CK | 0.23 ± 0.09 a | 2.83 ± 0.52 a | 0.77 ± 0.06 a | 0.74 ± 0.09 a | 0.67 ± 0.09 a | 0.23 ± 0.18 a | 0.10 ± 0.07 a |
| T1 | 0.22 ± 0.04 a | 3.18 ± 0.33 a | 0.78 ± 0.04 a | 0.78 ± 0.04 a | 0.69 ± 0.08 a | 0.45 ± 0.17 a | 0.17 ± 0.09 a | |
| T2 | 0.25 ± 0.09 a | 2.95 ± 0.75 a | 0.75 ± 0.09 a | 0.74 ± 0.09 a | 0.61 ± 0.15 a | 0.41 ± 0.15 a | 0.10 ± 0.06 a | |
Table 9.
The relationship between the LAI and canopy interception.
| Year | DAT | Interception Rate at Different Height (cm) | ||||||
|---|---|---|---|---|---|---|---|---|
| 0 | 5 | 20 | 40 | 60 | 80 | |||
| 2012 | 52 | LAI | 0.993 ** | |||||
| 106 | 0.977 ** | 0.582 | 0.509 | 0.004 | 0.019 | |||
| 2013 | 64 | 0.992 ** | 0.850 ** | 0.826 ** | 0.412 | |||
| 79 | 0.915 ** | 0.979 ** | 0.760 * | 0.828 ** | 0.593 | |||
| 93 | 0.954 ** | 0.973 ** | 0.886 ** | 0.538 | 0.454 | |||
Note: * and ** mean that the correlation is significant at the 0.05 and 0.01 levels (2-tailed), respectively.
Table 10.
Crop yield under the controllable irrigation regime.
| Year | Treatments | Actual Yield (t/hm2) | Theoretical Yield (t/hm2) | Ear Length (cm) |
|---|---|---|---|---|
| 2012 | CK | 4.79 ab | 5.12 ab | 17.80 c |
| T1 | 5.16 a | 5.35 a | 18.95 b | |
| T2 | 4.68 b | 5.05 b | 19.54 a | |
| 2013 | CK | 3.11 c | 3.56 b | 17.23 b |
| T1 | 4.39 a | 4.54 a | 18.61 a | |
| T2 | 3.73 b | 4.33 ab | 18.54 a |
Note: In the column, averages followed by common letter(s) are not significantly different at a level of p < 0.05. The same applies for the table below.
Table 11.
Crop yield characteristics for 1 m2 in 2013.
| Treatment | Tiller Number | Stem Mass/g | Leaf Dry Quality/g | Spike Quality/g | Filled Grain per Spike | Shriveled Grain per Spike | Seed Setting Rate | 1000 Grain Quality/g |
|---|---|---|---|---|---|---|---|---|
| CK | 120.75 ± 11.62 a | 285.00 ± 42.00 a | 52.28 ± 5.62 a | 355.75 ± 23.62 b | 122.33 ± 24.14 ab | 28.71 ± 18.77 a | 0.82 ± 0.11 a | 26.51 ± 2.15 a |
| T1 | 143.67 ± 19.76 a | 373.25 ± 57.28 a | 76.70 ± 21.46 a | 453.87 ± 73.71 a | 107.70 ± 25.89 b | 23.26 ± 18.37 a | 0.83 ± 0.12 a | 27.44 ± 3.45 a |
| T2 | 126.67 ± 2.31 a | 306.18 ± 43.37 a | 70.60 ± 14.01 a | 432.63 ± 42.99 ab | 130.96 ± 29.61 a | 29.46 ± 23.58 a | 0.83 ± 0.12 a | 26.66 ± 0.79 a |
Table 12.
Crop yield characteristics with high tillers and without high tillers for 1 m2 in 2013.
| Treatment | High Tiller | Without High Tiller | ||||||
|---|---|---|---|---|---|---|---|---|
| High Tiller Number | Stem Mass | Stem Length | Leaf Quality | Spike Quality | Stem Mass | Leaf Quality | Spike Quality | |
| CK | 66.75 ± 15.95 a | 34.66 ± 10.35 a | 35.55 ± 2.49 a | 8.92 ± 2.65 a | 32.98 ± 10.74 a (9.27%) | 250.34 ± 45.65 b | 43.36 ± 5.51 b | 322.78 ± 22.97 b (90.73%) |
| T1 | 74.33 ± 31.88 a | 32.26 ± 15.89 a | 33.17 ± 4.80 a | 8.94 ± 4.42 a | 29.30 ± 16.08 a (6.46%) | 340.99 ± 41.45 a | 67.75 ± 17.30 a | 424.57 ± 60.97 a (93.54%) |
| T2 | 72.00 ± 15.87 a | 34.65 ± 8.67 a | 34.17 ± 1.26 a | 9.34 ± 0.99 a | 36.93 ± 5.21 a (8.54%) | 271.53 ± 41.70 ab | 61.26 ± 13.39 ab | 395.70 ± 47.78 ab (91.46%) |
Note: In rank of Spike Quality, (9.27%) means the percentage of the quality to the total spike quality is 9.7%.
Table 13.
The relationship between yield character and irrigation amount in 2013.
| Index | Total Tiller Number | High Tiller | Total Stem Mass | Total Leaf Quality | Total Spike Quality | Irrigation Amount | |||||
|---|---|---|---|---|---|---|---|---|---|---|---|
| Tiller Number | Stem Mass | Stem Length | Leaf Quality | Spike Quality | |||||||
| Total tiller number | 1 | 0.614 | 0.373 | 0.227 | 0.415 | 0.248 | 0.908 ** | 0.849 ** | 0.821 ** | 0.466 | |
| High tiller | Tiller number | 1 | 0.951 ** | 0.692 * | 0.931 ** | 0.884 ** | 0.502 | 0.698 * | 0.454 | 0.054 | |
| Stem mass | 1 | 0.808 ** | 0.953 ** | 0.956 ** | 0.243 | 0.469 | 0.226 | −0.095 | |||
| Stem length | 1 | 0.828 ** | 0.825 ** | 0.073 | 0.170 | 0.142 | −0.149 | ||||
| Leaf quality | 0.964 ** | 0.295 | 0.548 | 0.391 | −0.059 | ||||||
| Spike quality | 1 | 0.116 | 0.433 | 0.264 | −0.294 | ||||||
| Total stem mass | 1 | 0.855 ** | 0.734 * | 0.493 | |||||||
| Total leaf quality | 1 | 0.864 ** | 0.167 | ||||||||
| Total leaf quality | 1 | 0.160 | |||||||||
| Irrigation amount | 1 | ||||||||||
Note: * and ** mean that the correlation is significant at the 0.05 and 0.01 levels (2-tailed), respectively.
© 2018 by the authors. Licensee MDPI, Basel, Switzerland. This article is an open access article distributed under the terms and conditions of the Creative Commons Attribution (CC BY) license (http://creativecommons.org/licenses/by/4.0/).
Share and Cite
MDPI and ACS Style
Lu, H.; Qi, X.; Guo, X.; Towa, J.J.; Zhen, B.; Qiao, D.; Wang, Z.; Yang, B.; Han, Y. Canopy Light Utilization and Yield of Rice under Rain-Catching and Controlled Irrigation. Water 2018, 10, 1340. https://doi.org/10.3390/w10101340
AMA Style
Lu H, Qi X, Guo X, Towa JJ, Zhen B, Qiao D, Wang Z, Yang B, Han Y. Canopy Light Utilization and Yield of Rice under Rain-Catching and Controlled Irrigation. Water. 2018; 10(10):1340. https://doi.org/10.3390/w10101340
Chicago/Turabian StyleLu, Hongfei, Xuebin Qi, Xiangping Guo, Jacob Jeremiah Towa, Bo Zhen, Dongmei Qiao, Zhenchang Wang, Bo Yang, and Yang Han. 2018. "Canopy Light Utilization and Yield of Rice under Rain-Catching and Controlled Irrigation" Water 10, no. 10: 1340. https://doi.org/10.3390/w10101340
Note that from the first issue of 2016, this journal uses article numbers instead of page numbers. See further details here.