The nephelometer and radiometer measurements analyzed in this Section were performed from 4 to 10 May 2015 since southeastern Italy was strongly affected by a Saharan dust outbreak on some days of the monitoring period. The selected days have hence allowed investigating the transboundary pollution impact on the daily cycle of the analyzed parameters, as previously mentioned. An overview of the dust outbreak evolution is first presented in the Section. To this end, AERONET direct sun photometer measurements, MODIS (MODerate resolution Image Spectroradiometer; satellite images [
12], analytical back-trajectories from the HYSPLIT (HYbrid Single Particle Lagrangian Integrated Trajectory) model [
13], and dust concentration profiles from the BSC-DREAM8b model [
9] have been used. The daily evolution of the particle scattering coefficient, the scattering Ångström coefficient, and the SW- and LW-irradiance from 4 to 10 May 2015 are then presented to provide an overview of the daily variability of the investigated parameters. Finally, the measurements performed on 6 and 8 May are analyzed in more detail, since 6 and 8 May were strongly and weakly affected, respectively, by the desert dust advection.
3.1. Characterization of the Dust Outbreak Evolution at the Study Site
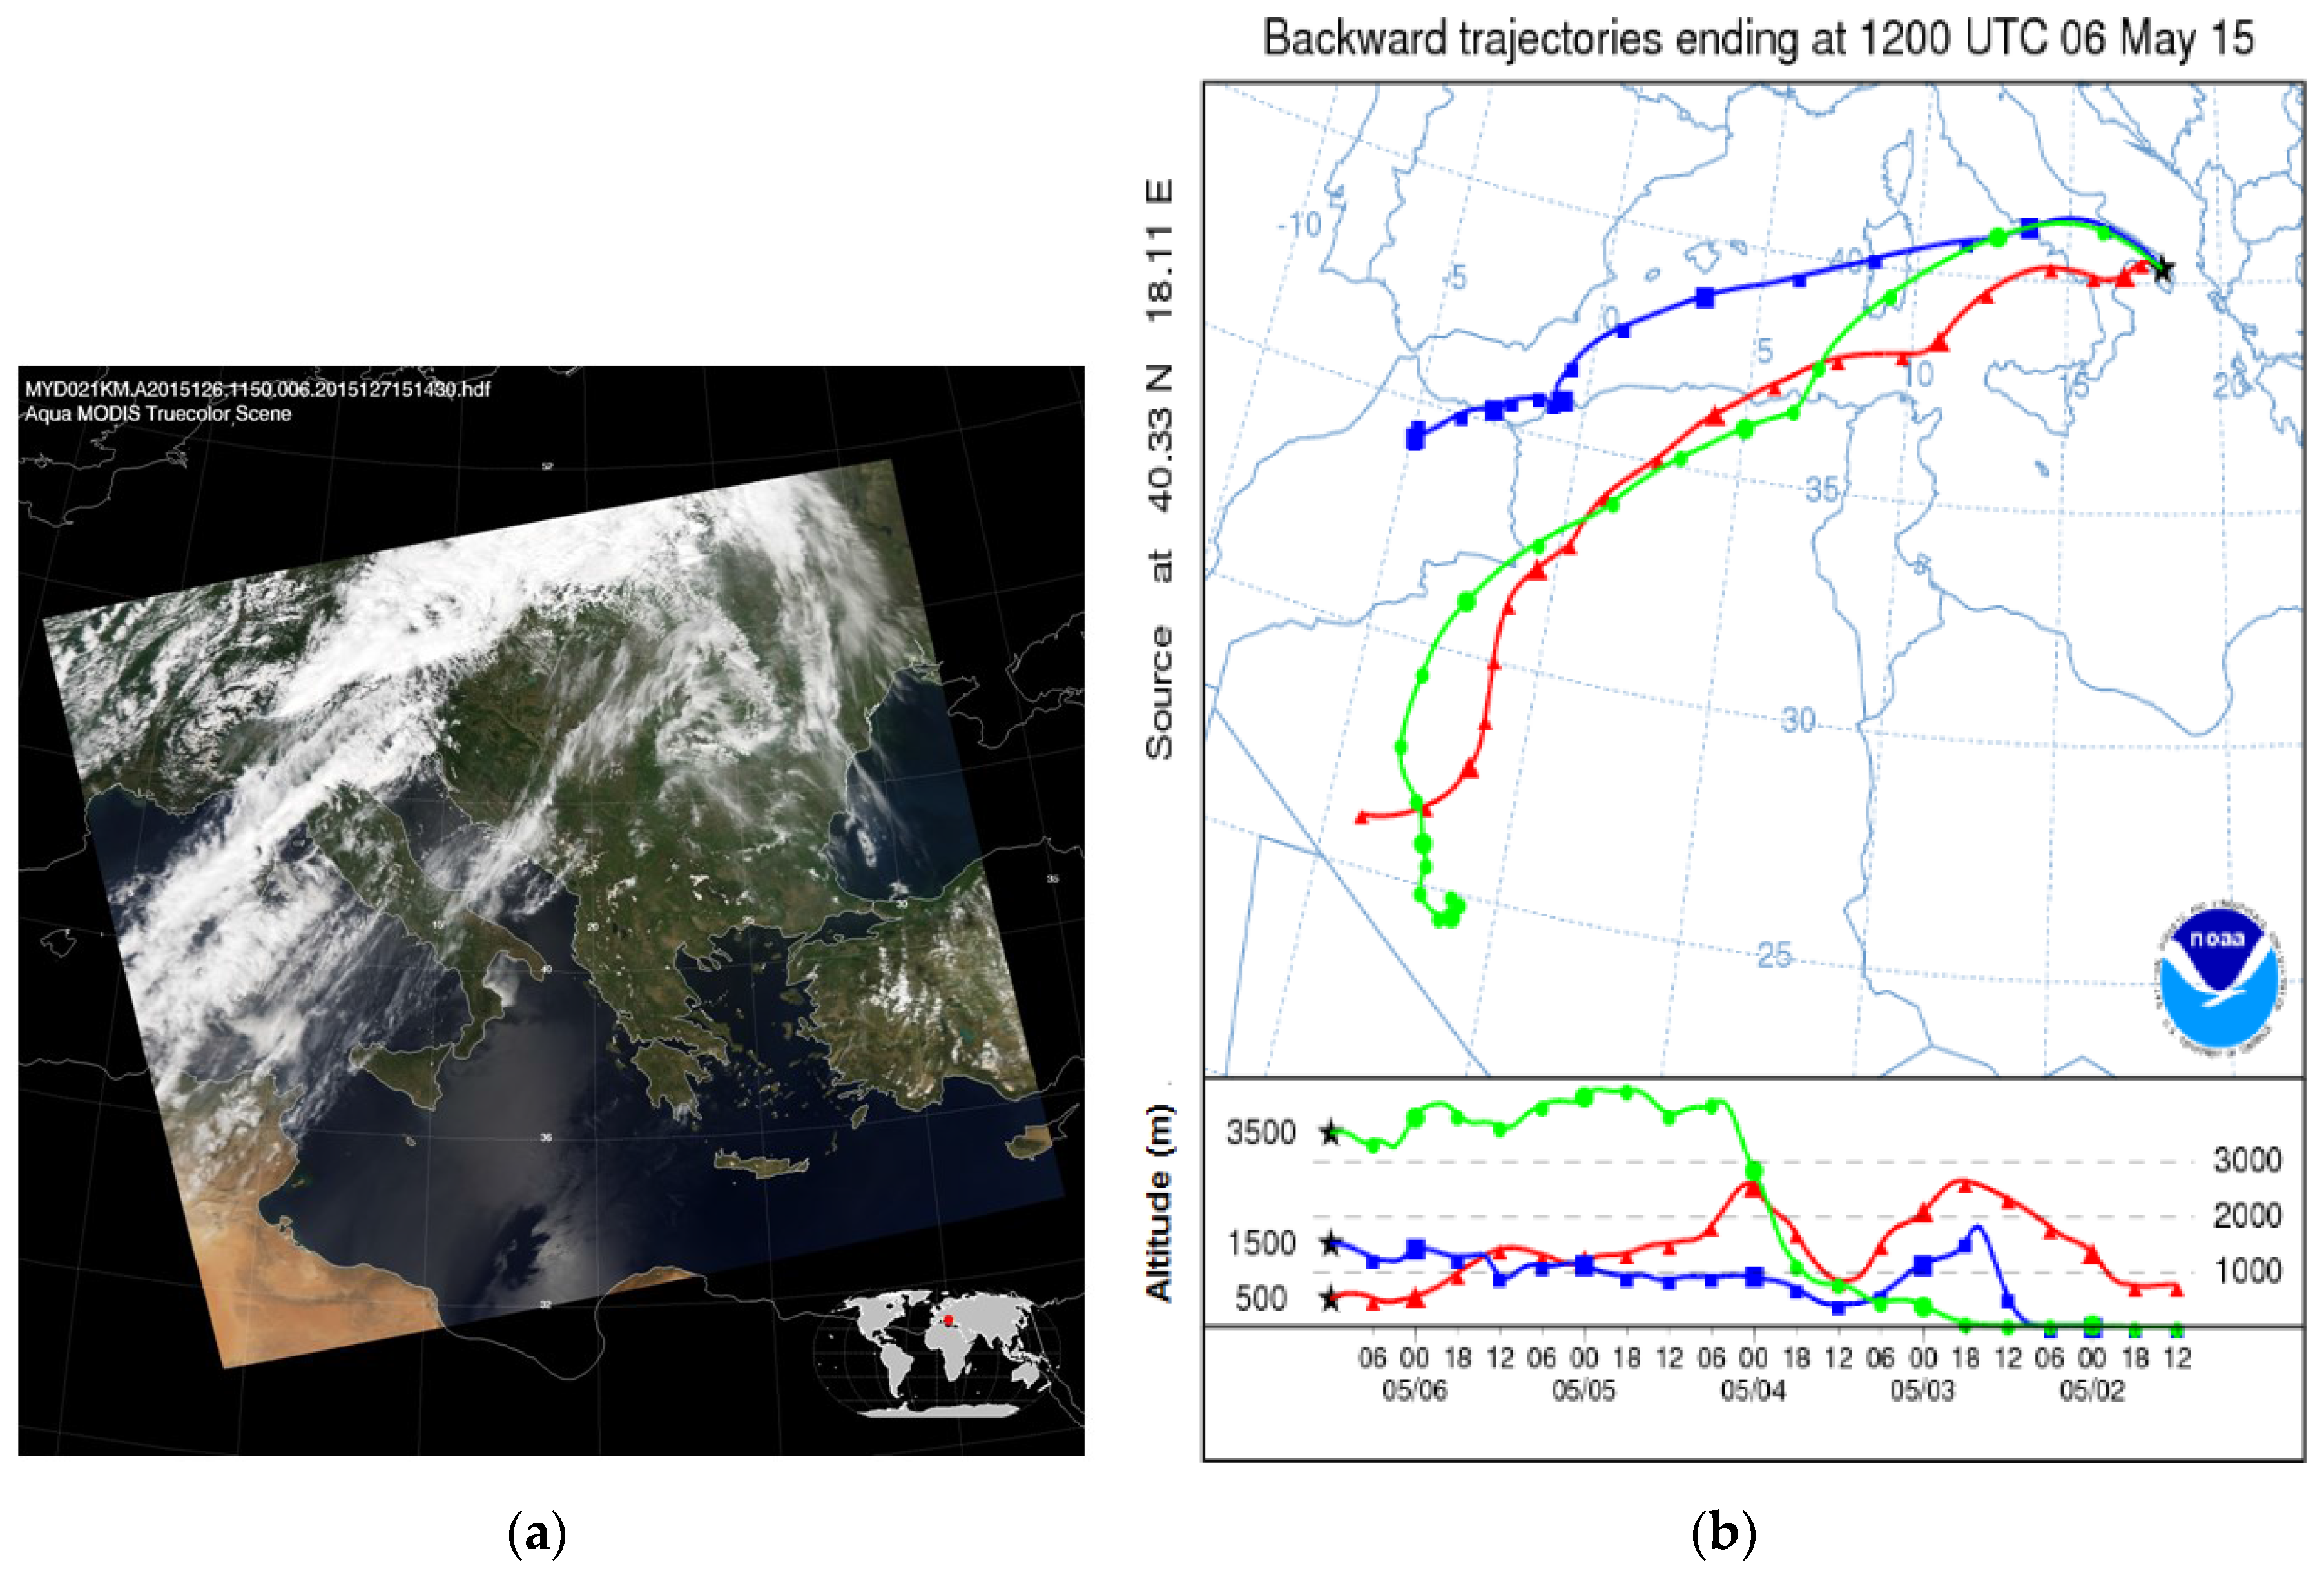
Figure 1a shows, as an example, the true color image from MODIS on board the Aqua satellite at 11:50 a.m. UTC on 6 May revealing a huge amount of dust particles over the Central Mediterranean basin. The red dot on
Figure 1a represents the study site. The five-day HYSPLIT back trajectories that reached the monitoring site at 12:00 p.m. UTC on 6 May and at 0.5, 1.5, and 3.5 km AGL are plotted on
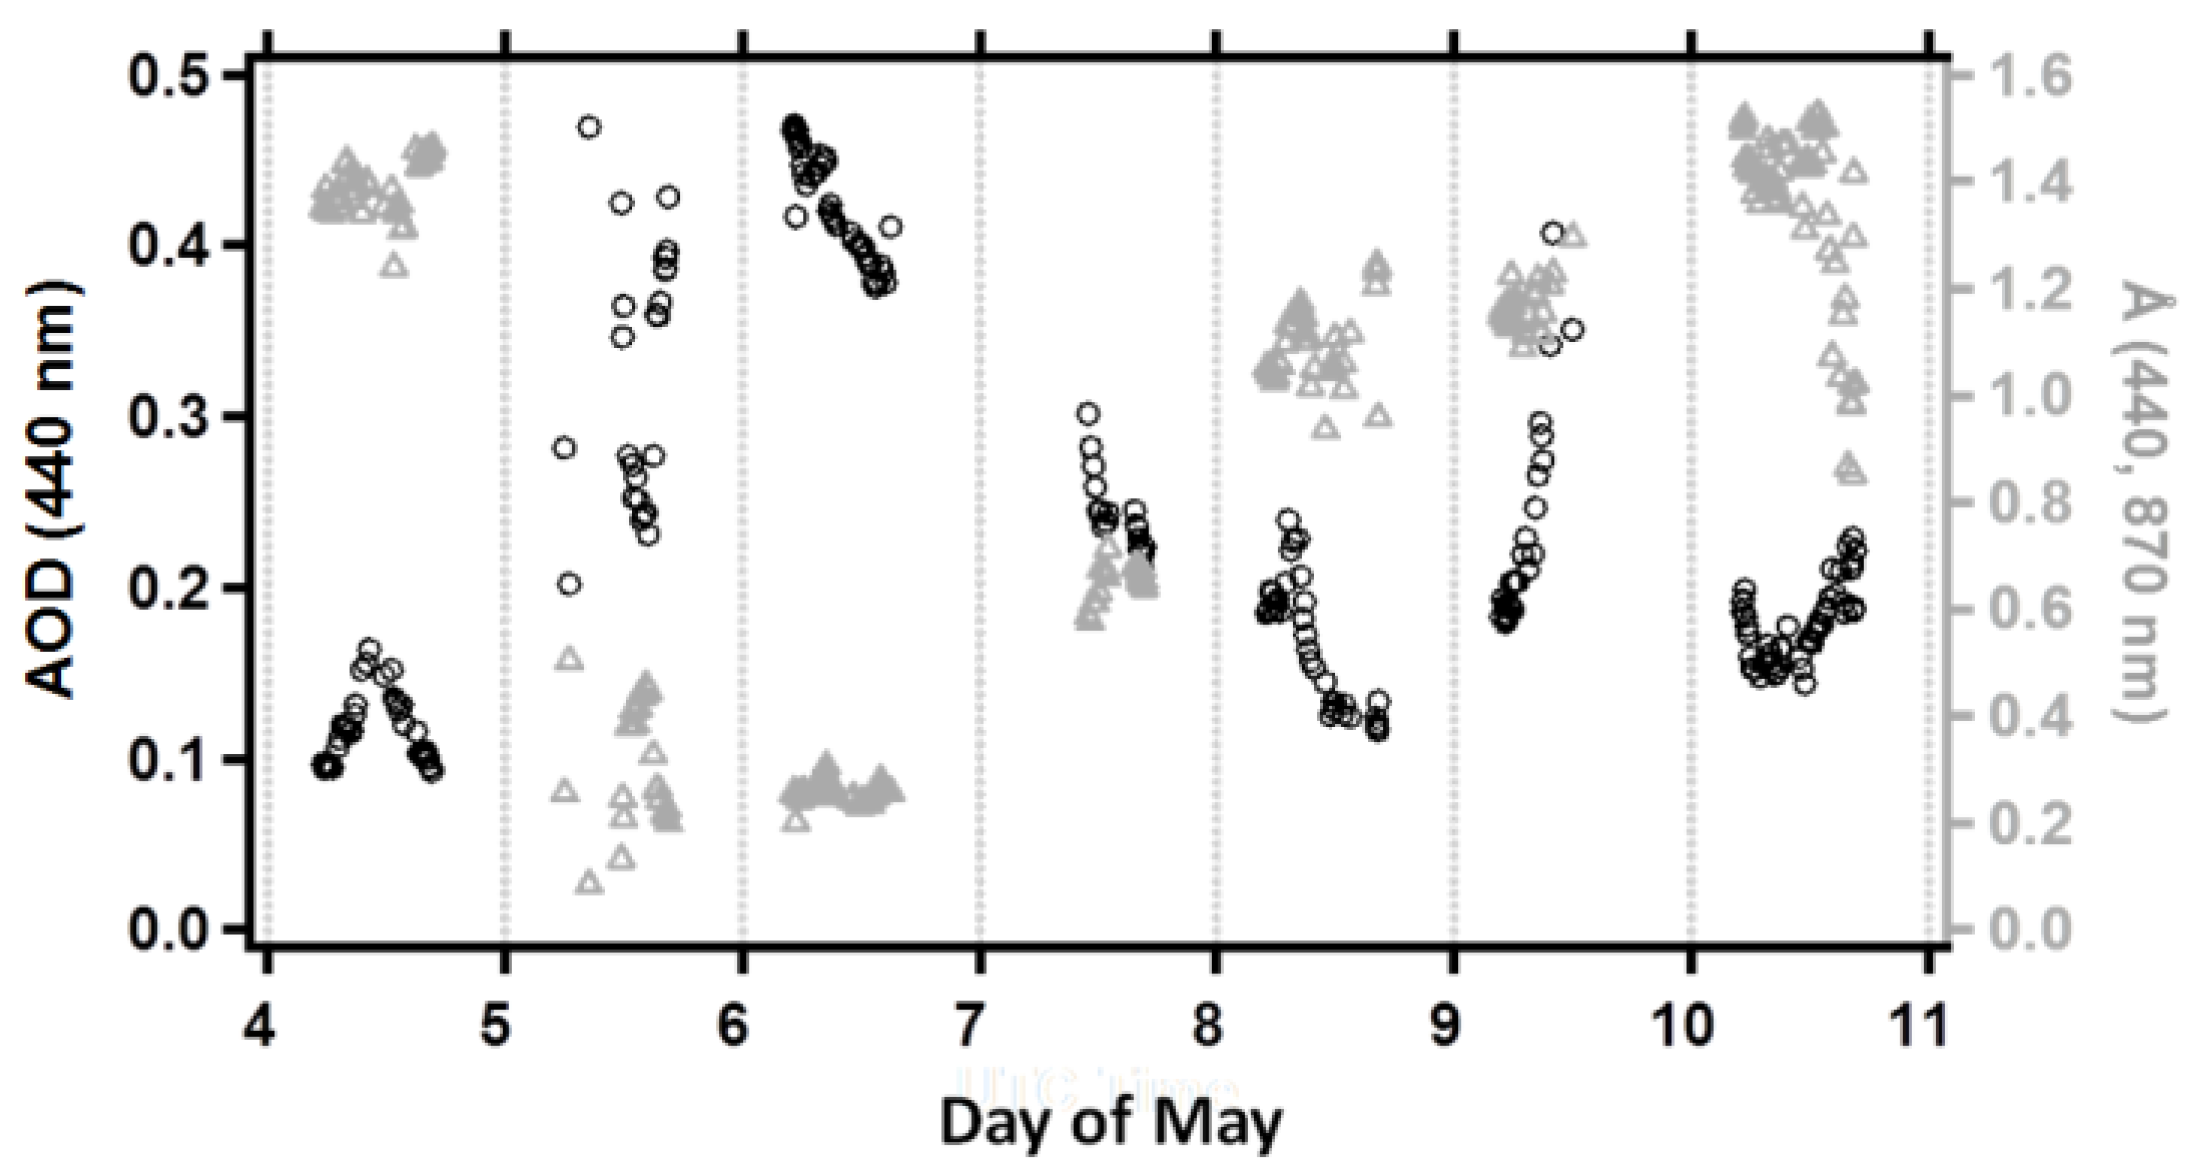
Figure 1b. One observes that the advected air masses were originated over northwestern Africa. The instantaneous values of the aerosol optical depth (AOD) at 440 nm, retrieved from the AERONET direct sun photometer measurements performed from 4 to 10 May, have been used to trace the evolution of the columnar aerosol load (
Figure 2, open black dots). The columnar Ångström coefficient (Å) was used as a qualitative indicator of the dominant particle size [
3]. In fact, coarse mode particles as desert dust and sea-salt lead to Å values close to zero, while fine mode particles as the ones due to the anthropogenic pollution lead to Å values larger than one. The open grey triangles on
Figure 2 show the instantaneous values of Å calculated at the 440–870 nm wavelength pair by the following relationship [
1]:
A discussion on the uncertainties of the AERONET aerosol products is provided in [
14].
Figure 2 reveals that the AOD and Å values were characterized by a rather high day-to-day variability. The AOD values varied within the 0.09–0.15 and the 0.38–0.48 range on 4 and 6 May, respectively. Note that 6 May was the day most affected by Saharan dust during the analyzed period. On the contrary, the Å values that were larger than 1.2 on 4 May (dust-free day) decreased up to about 0.2 on 6 May because of the Saharan dust advection. The dust concentration vertical profiles from the BSC-DREAM8b model for the monitoring site of this study were used to have some information on the daily changes of the dust load distribution up to the ground level.
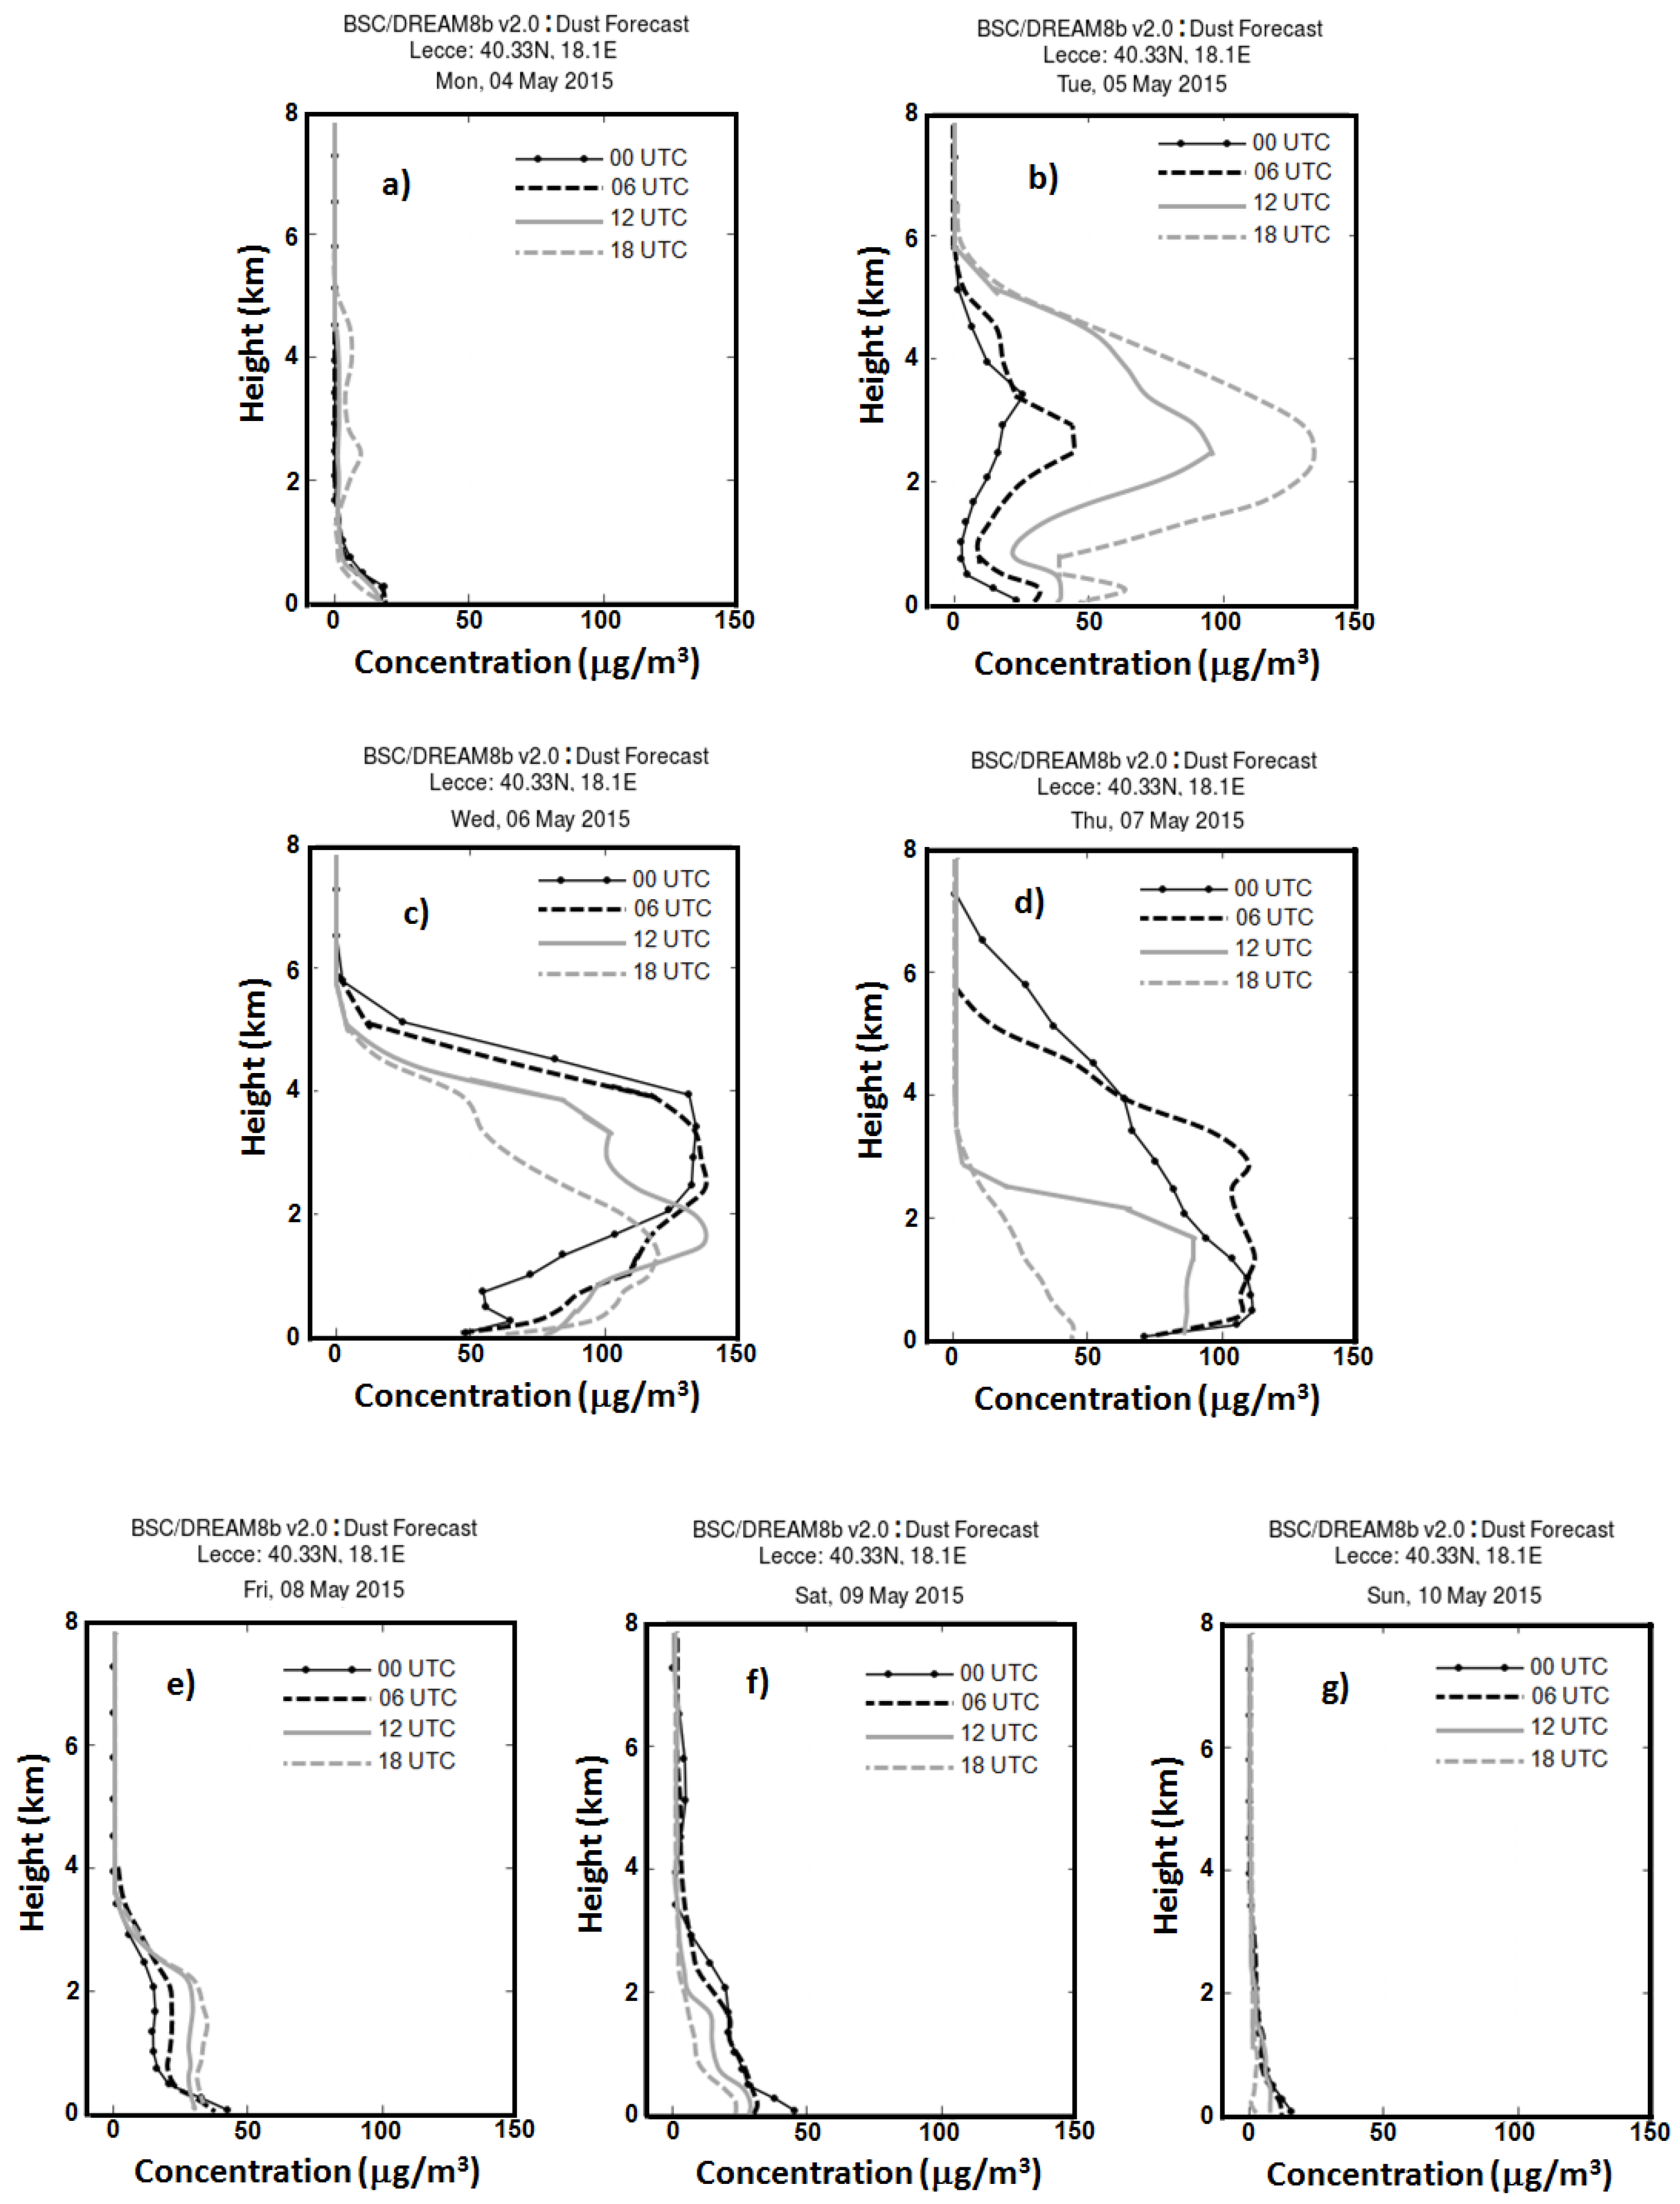
Figure 3 shows the dust concentration as a function of the height above sea level at 12:00 a.m. (black solid line), 6:00 a.m. (black dotted line), 12:00 p.m. (grey solid line), and 6:00 p.m. UTC (grey dotted line) of (a) 4, (b) 5, (c) 6, (d) 7, (e) 8, (f) 9, and (g) 10 May, respectively. One observes that 4 May was very weekly affected by dust particles, while 6 May was the day most affected by dust particles throughout the day, in good accordance with the AERONET retrievals (
Figure 2). Dust particles that were located at altitudes smaller than 1 km at 12:00 p.m. UTC of 4 May (
Figure 3a, grey solid line) extended up to about 6 km on 5 (
Figure 3b), 6 (
Figure 3c), and 7 May (
Figure 3d). One also observes from
Figure 3b–d that the dust load and the corresponding vertical profile varied significantly with the day hours, in good accordance with the AOD time evolution (
Figure 2, open black dots). The high daily and day-to-day variability of the dust particle AOD and of the particle vertical distribution resulting from
Figure 2 and
Figure 3, respectively, is typical of dust outbreaks, in accordance with lidar measurements performed at the study site [
15]. Note that both AERONET (
Figure 2) and model results (
Figure 3) indicate that the dust advection was nearly over on 10 May.
Figure 2.
Temporal evolution of the instantaneous values of the AOD (Aerosol Optical Depth) at 440 nm (open black dots) and of the columnar Ångström coefficient calculated at the 440–870 nm wavelength pair (open grey triangles) from AERONET (Aerosol Robotic Network) direct sun measurements, from 4 to 10 May 2015.
Figure 3.
Dust concentration versus the height above sea level at 12:00 a.m. (black solid line), 6:00 a.m. (black dotted line), 12:00 p.m. (grey solid line), and 6:00 p.m. UTC (grey dotted line) of (a) 4, (b) 5, (c) 6, (d) 7, (e) 8, (f) 9, and (g) 10 May 2015, respectively, from the BSC-DREAM8b model.
3.2. Radiative Fluxes and Particle Scattering Coefficients from 4 to 10 May 2015
Radiometer and nephelometer measurements referring to the studied period are presented in this sub-section to provide an overview of their spanning range and day-to-day variability, and to highlight main effects of the daily variability of the SW and LW irradiance on the particle scattering properties at the surface.
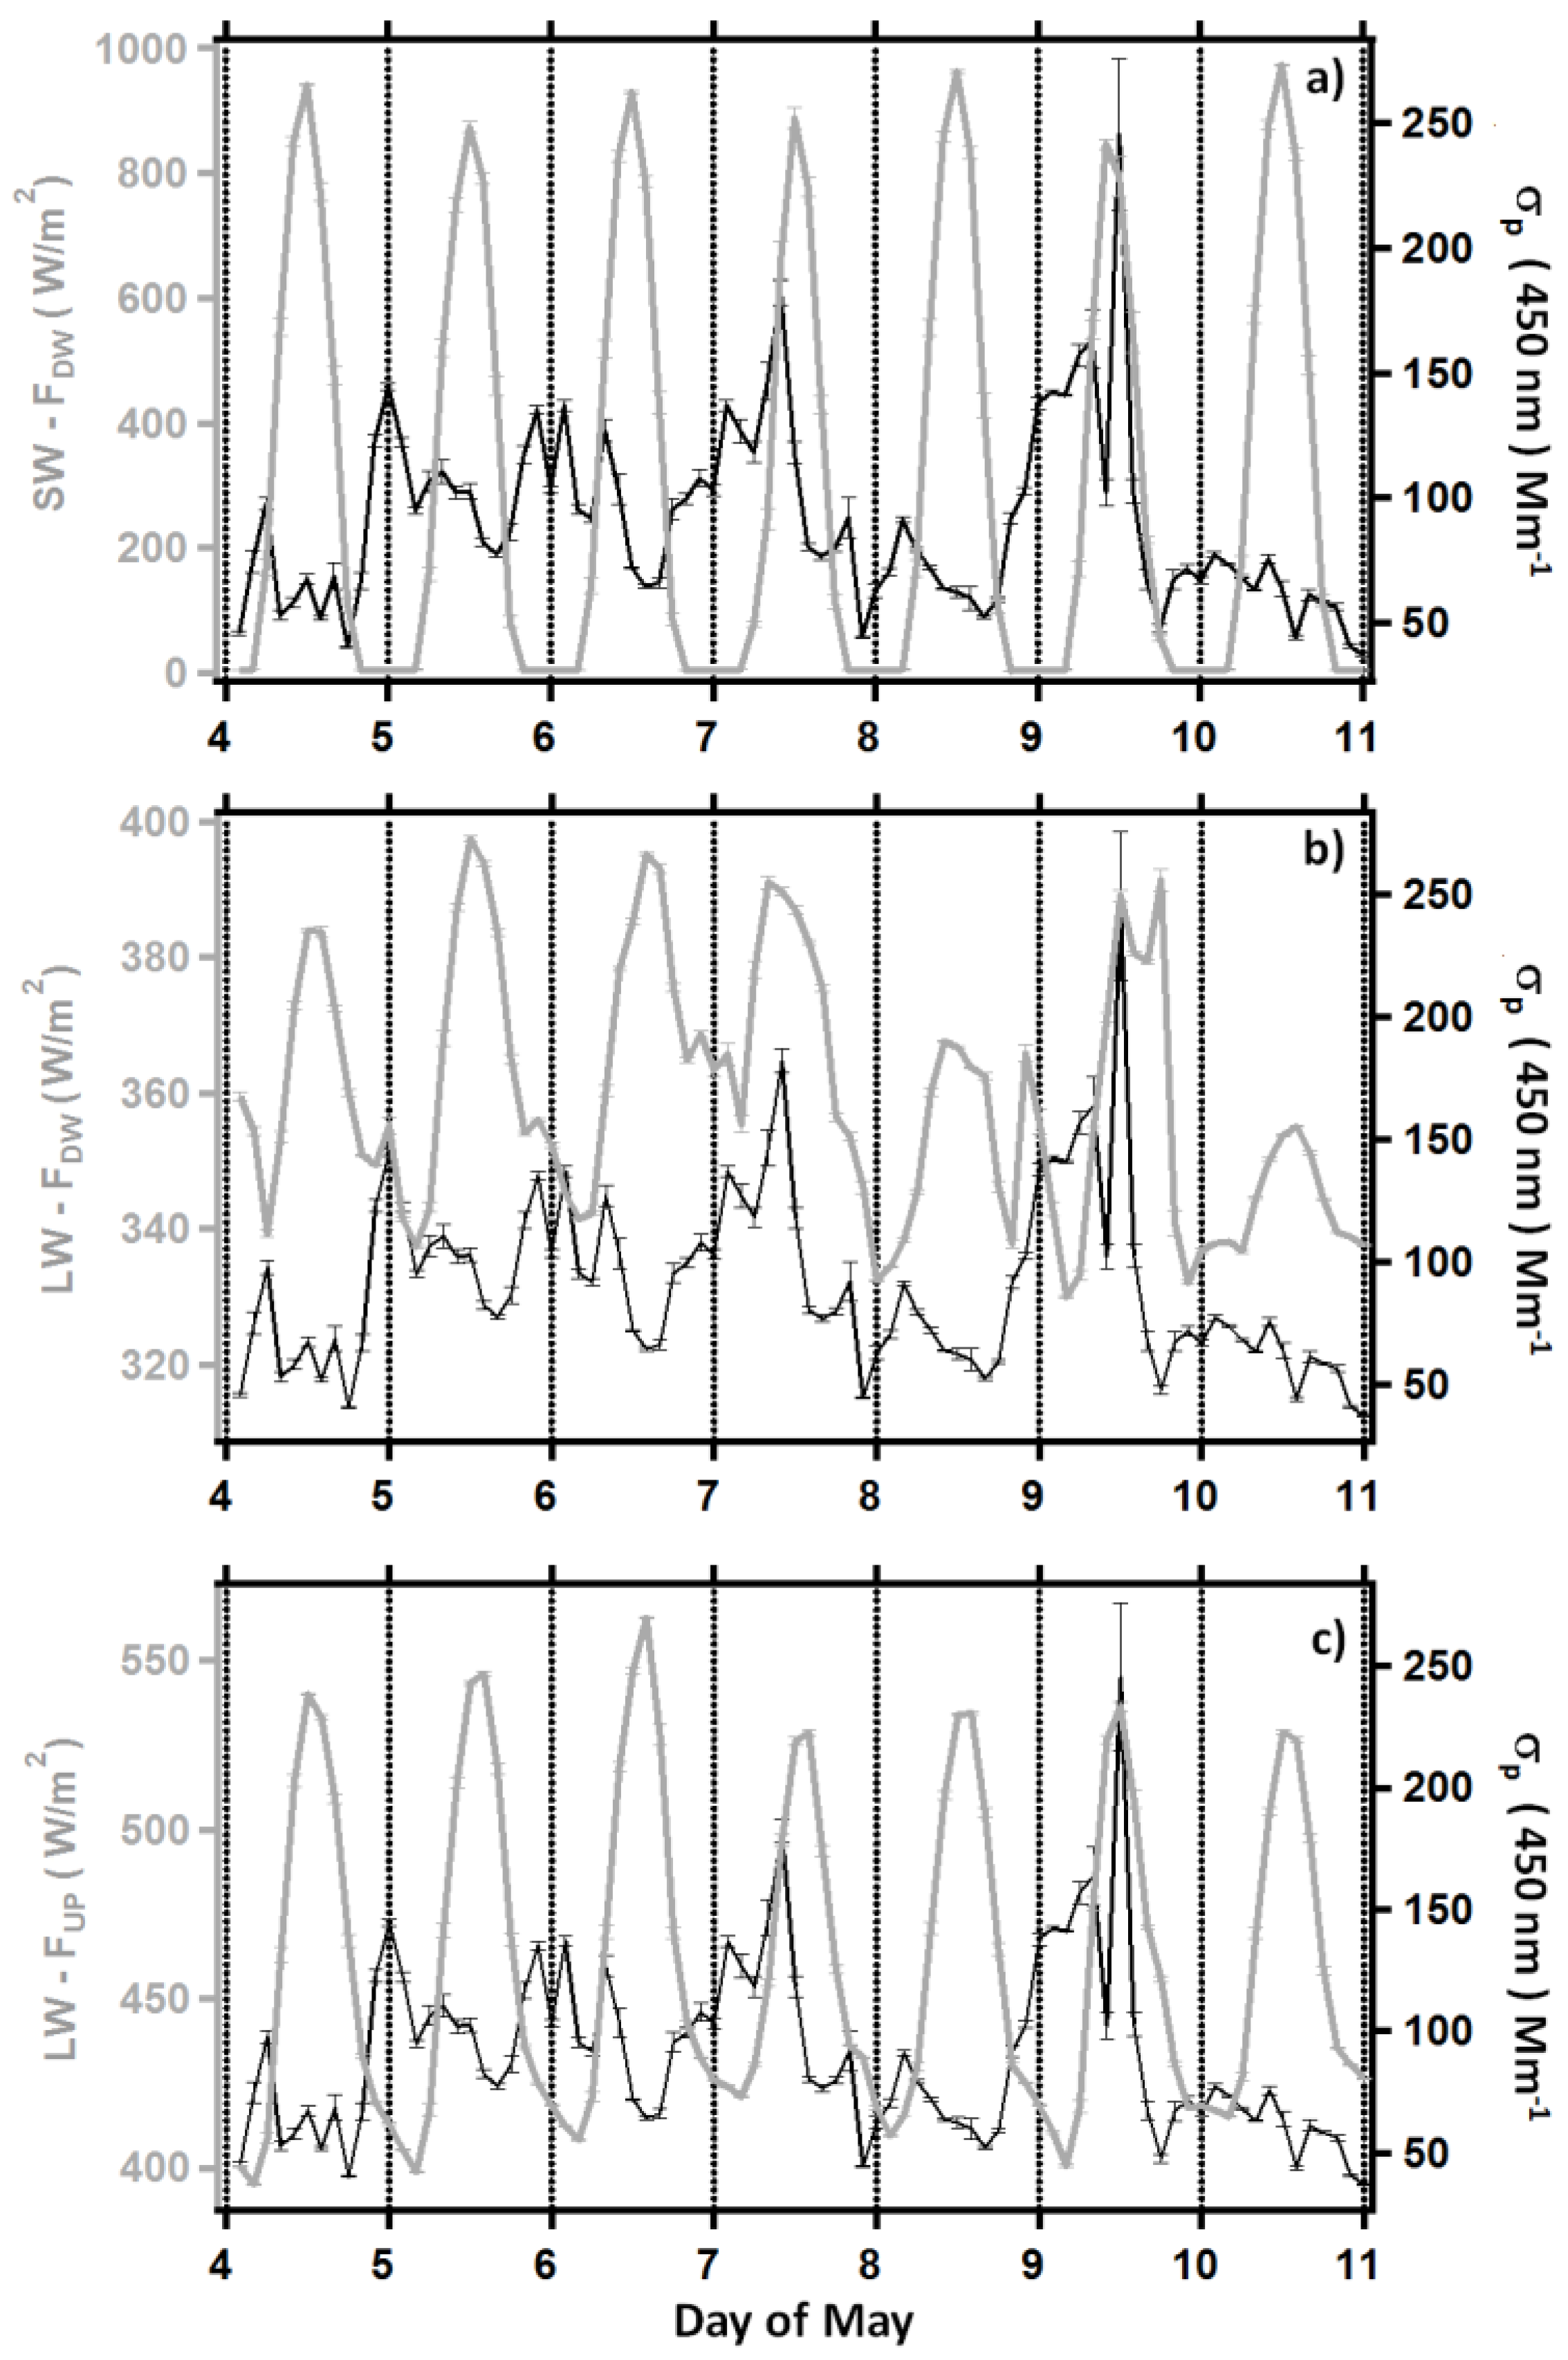
Figure 4 (grey lines) shows the time evolution of the two hour-averaged (a) SW downward flux (SW-F
DW), (b) LW downward flux (LW-F
DW), and (c) LW upward flux (LW-F
UP) with the corresponding Standard Errors of the Mean (SEM). The time evolution of the SW upward flux has not been shown since it was quite similar to the SW-F
DW to less than the surface albedo multiplicative factor. The solar zenith angle, the surface albedo, the aerosol optical and microphysical properties (mainly AOD, particle size distribution, asymmetry parameter, and SSA), which in turn depend on the particle composition and mixing state [
16], and the cloud properties represent some of the most important parameters affecting the irradiance and its daily cycle. Note that the AERONET AODs (
Figure 2) were retrieved under clear sky conditions from 4:45 a.m. to 4:40 p.m. UTC of each day. Therefore, any lack of AERONET AOD values was due to the presence of clouds. Consequently, the AOD values allow identifying the clear sky daytime hours. Open dots on
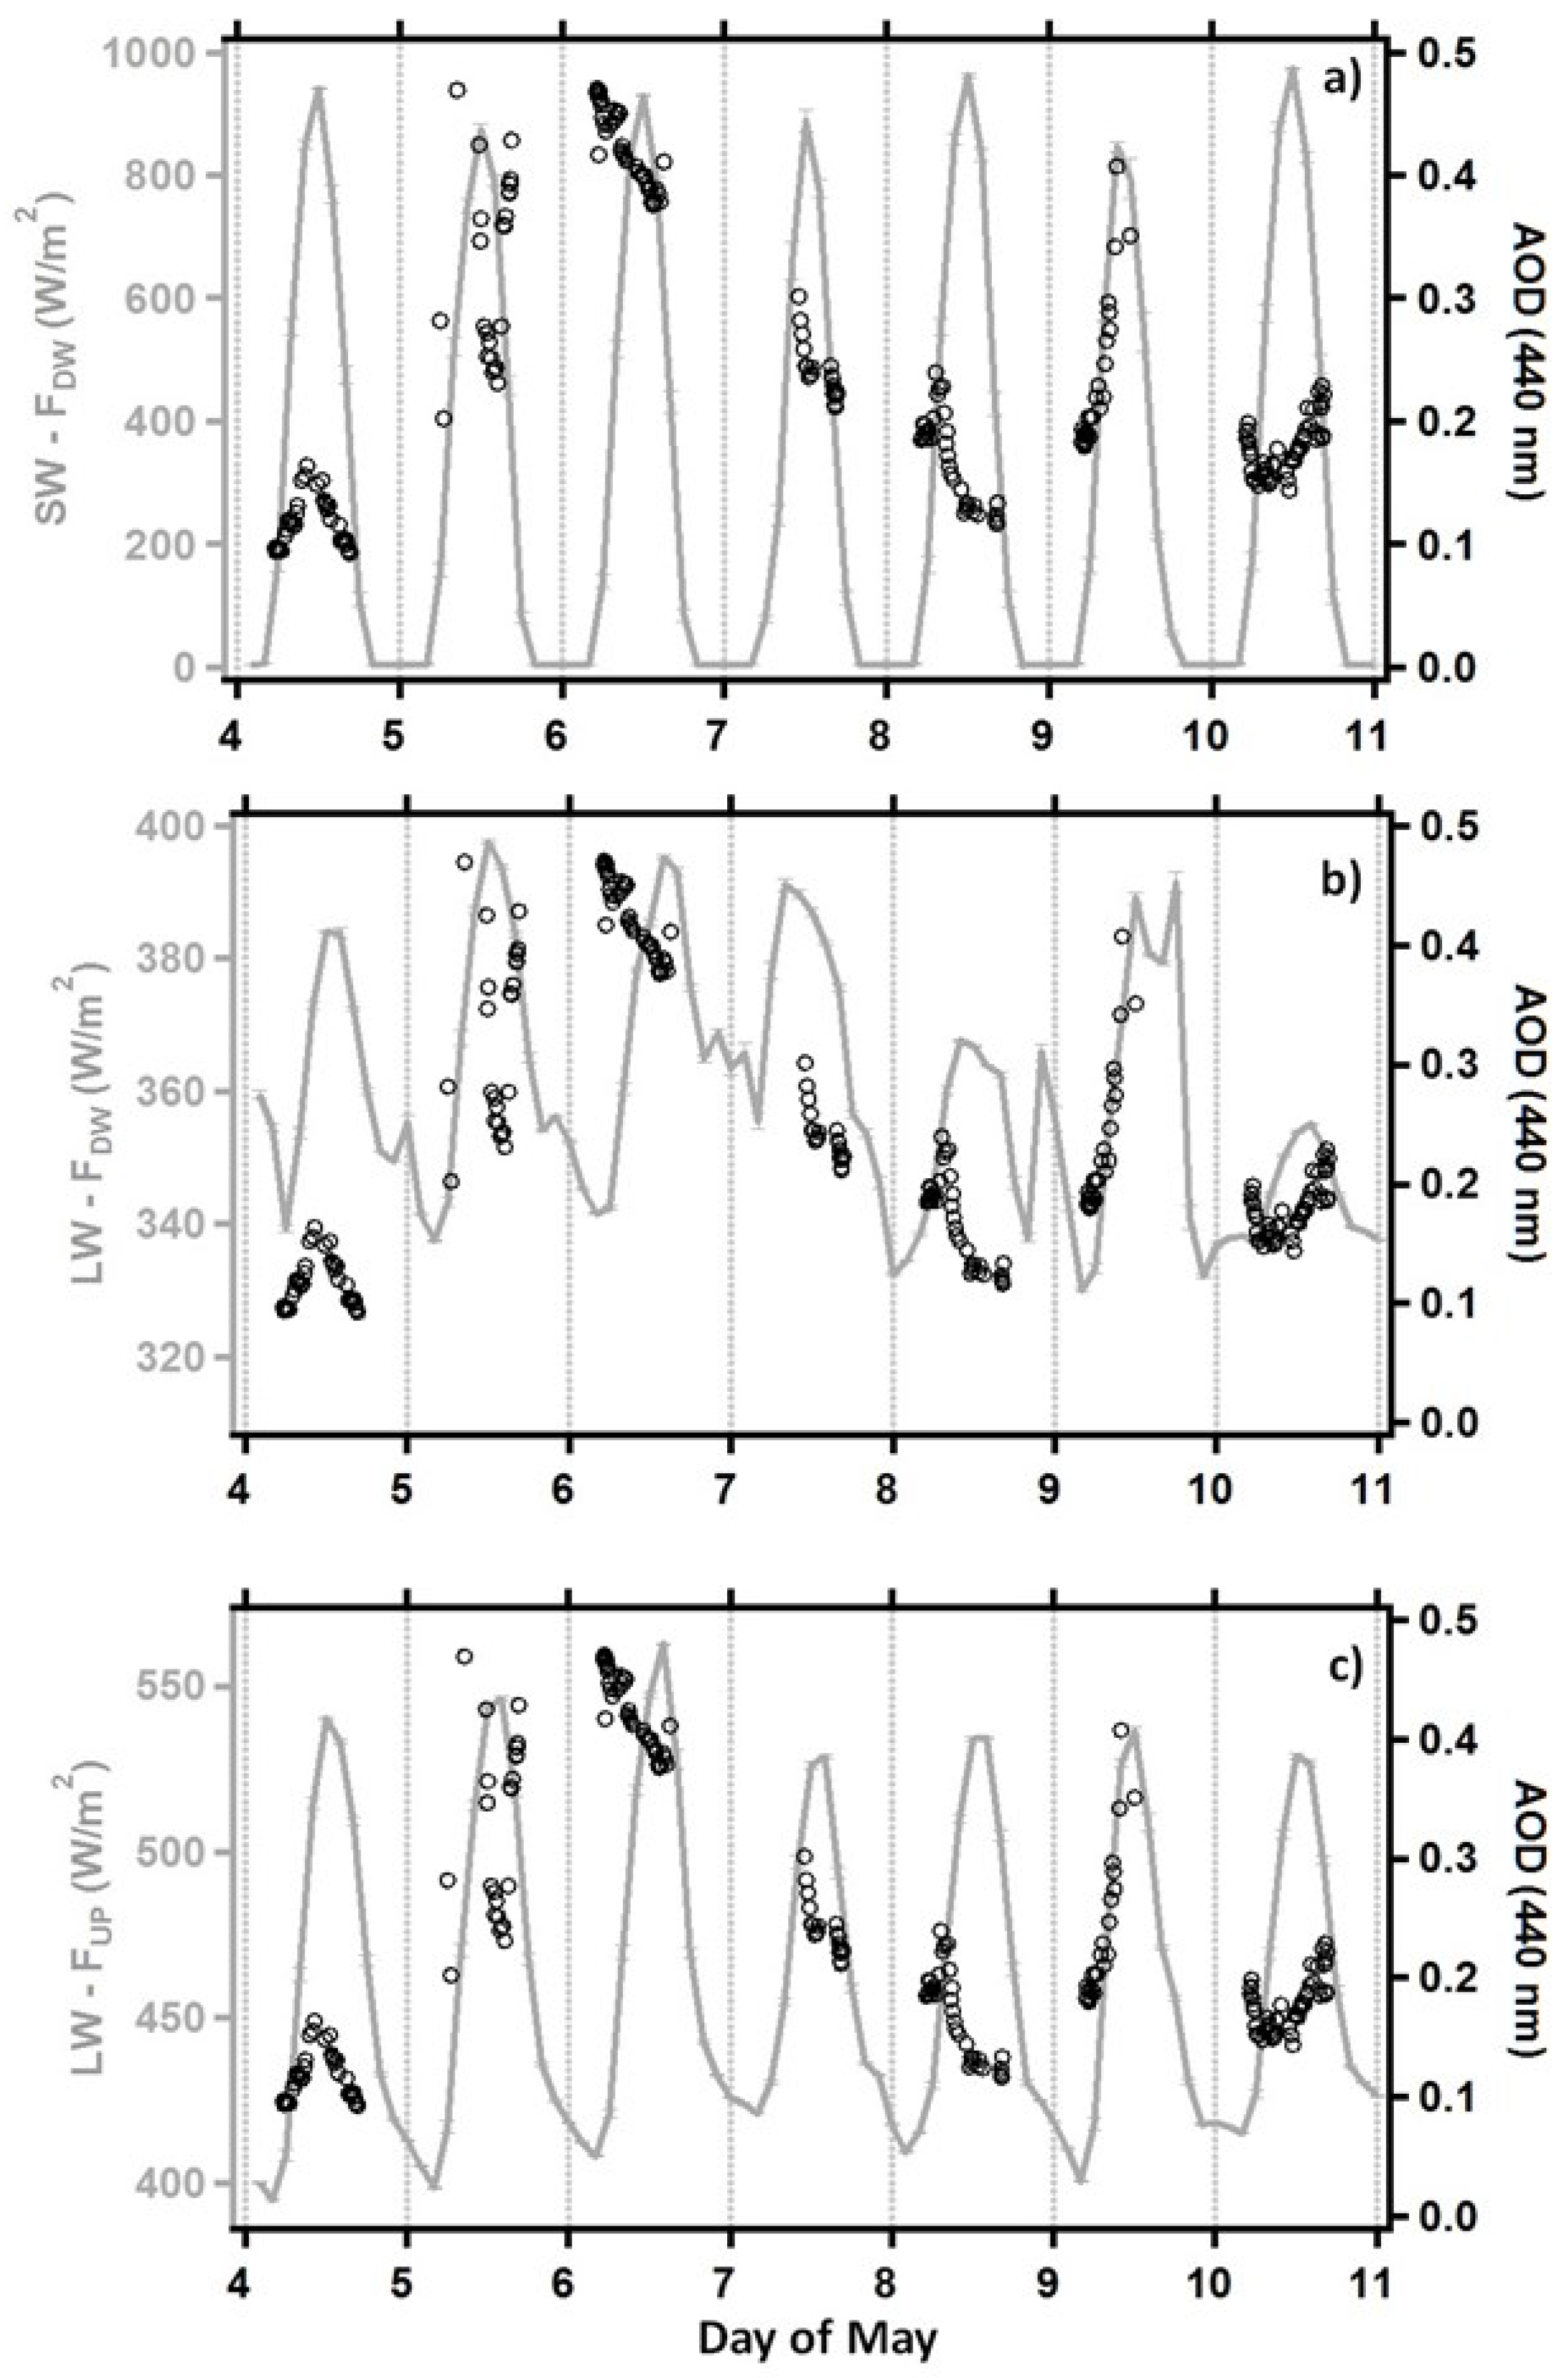
Figure 4 show the instantaneous AODs (440 nm) to highlight the aerosol load impact on the irradiance measurements at the surface. In particular,
Figure 4a reveals that smaller SW-F
DW peak values were reached on the days characterized by greater AODs. The SW-F
DW peak value, which was equal to 941 Wm
−2 around 12:00 p.m. UTC of 4 May, decreased down to 930 Wm
−2 (about 1% decrease) around 12:00 p.m. UTC of 6 May because of the desert dust advection and, consequently, the AOD (440 nm) increase from 0.15 up to 0.40, which corresponds to the AOD increase by a factor 2.7. Note that Romano
et al. [
17] found that an AOD (675 nm) increase of about a factor of five determined a SW-F
DW decrease of 9% at the same site of this study, by analyzing the 9–13 July 2012 dust outbreak.
Figure 4c also reveal that greater LW-F
DW and -F
UP peak values, respectively, were reached on the days characterized by greater AOD values. In particular, the LW-F
UP and -F
DW peak values that were equal to 540 and 384 Wm
−2, respectively, around 12:00 p.m. UTC of 4 May increased up to 567 and 395 Wm
−2 around 12:00 p.m. UTC of 6 May, respectively, because of the AOD increase by a factor 2.7. The absorption [
18] and the scattering effects [
19] of desert dust particles in the LW domain enhance the greenhouse effect by trapping the outgoing terrestrial radiation and, consequently, may lead to greater LW-F
DW (
Figure 4b) and LW-F
UP (
Figure 4c) values. However, one must be aware that the LW irradiance is also dependent on the effective radiating temperatures and emissivity of both the atmosphere and the surface, while it is less affected by surface albedo and solar zenith angle (SZA) changes with respect to the SW irradiance [
20]. Consequently, we found that the daily evolution of the LW-F
DW was characterized by a less regular daily cycle than the SW-F
DW.
Figure 4.
The grey lines show the time evolution of the two hour-averaged (a) short-wave downward flux (SW-FDW), (b) long-wave downward flux (LW-FDW), and (c) long-wave upward flux (LW-FUP) from 4 to 10 May 2015. Error bars represent the SEMs (standard errors of the mean). Open dots represent the instantaneous AOD (440 nm) values from AERONET direct sun measurements.
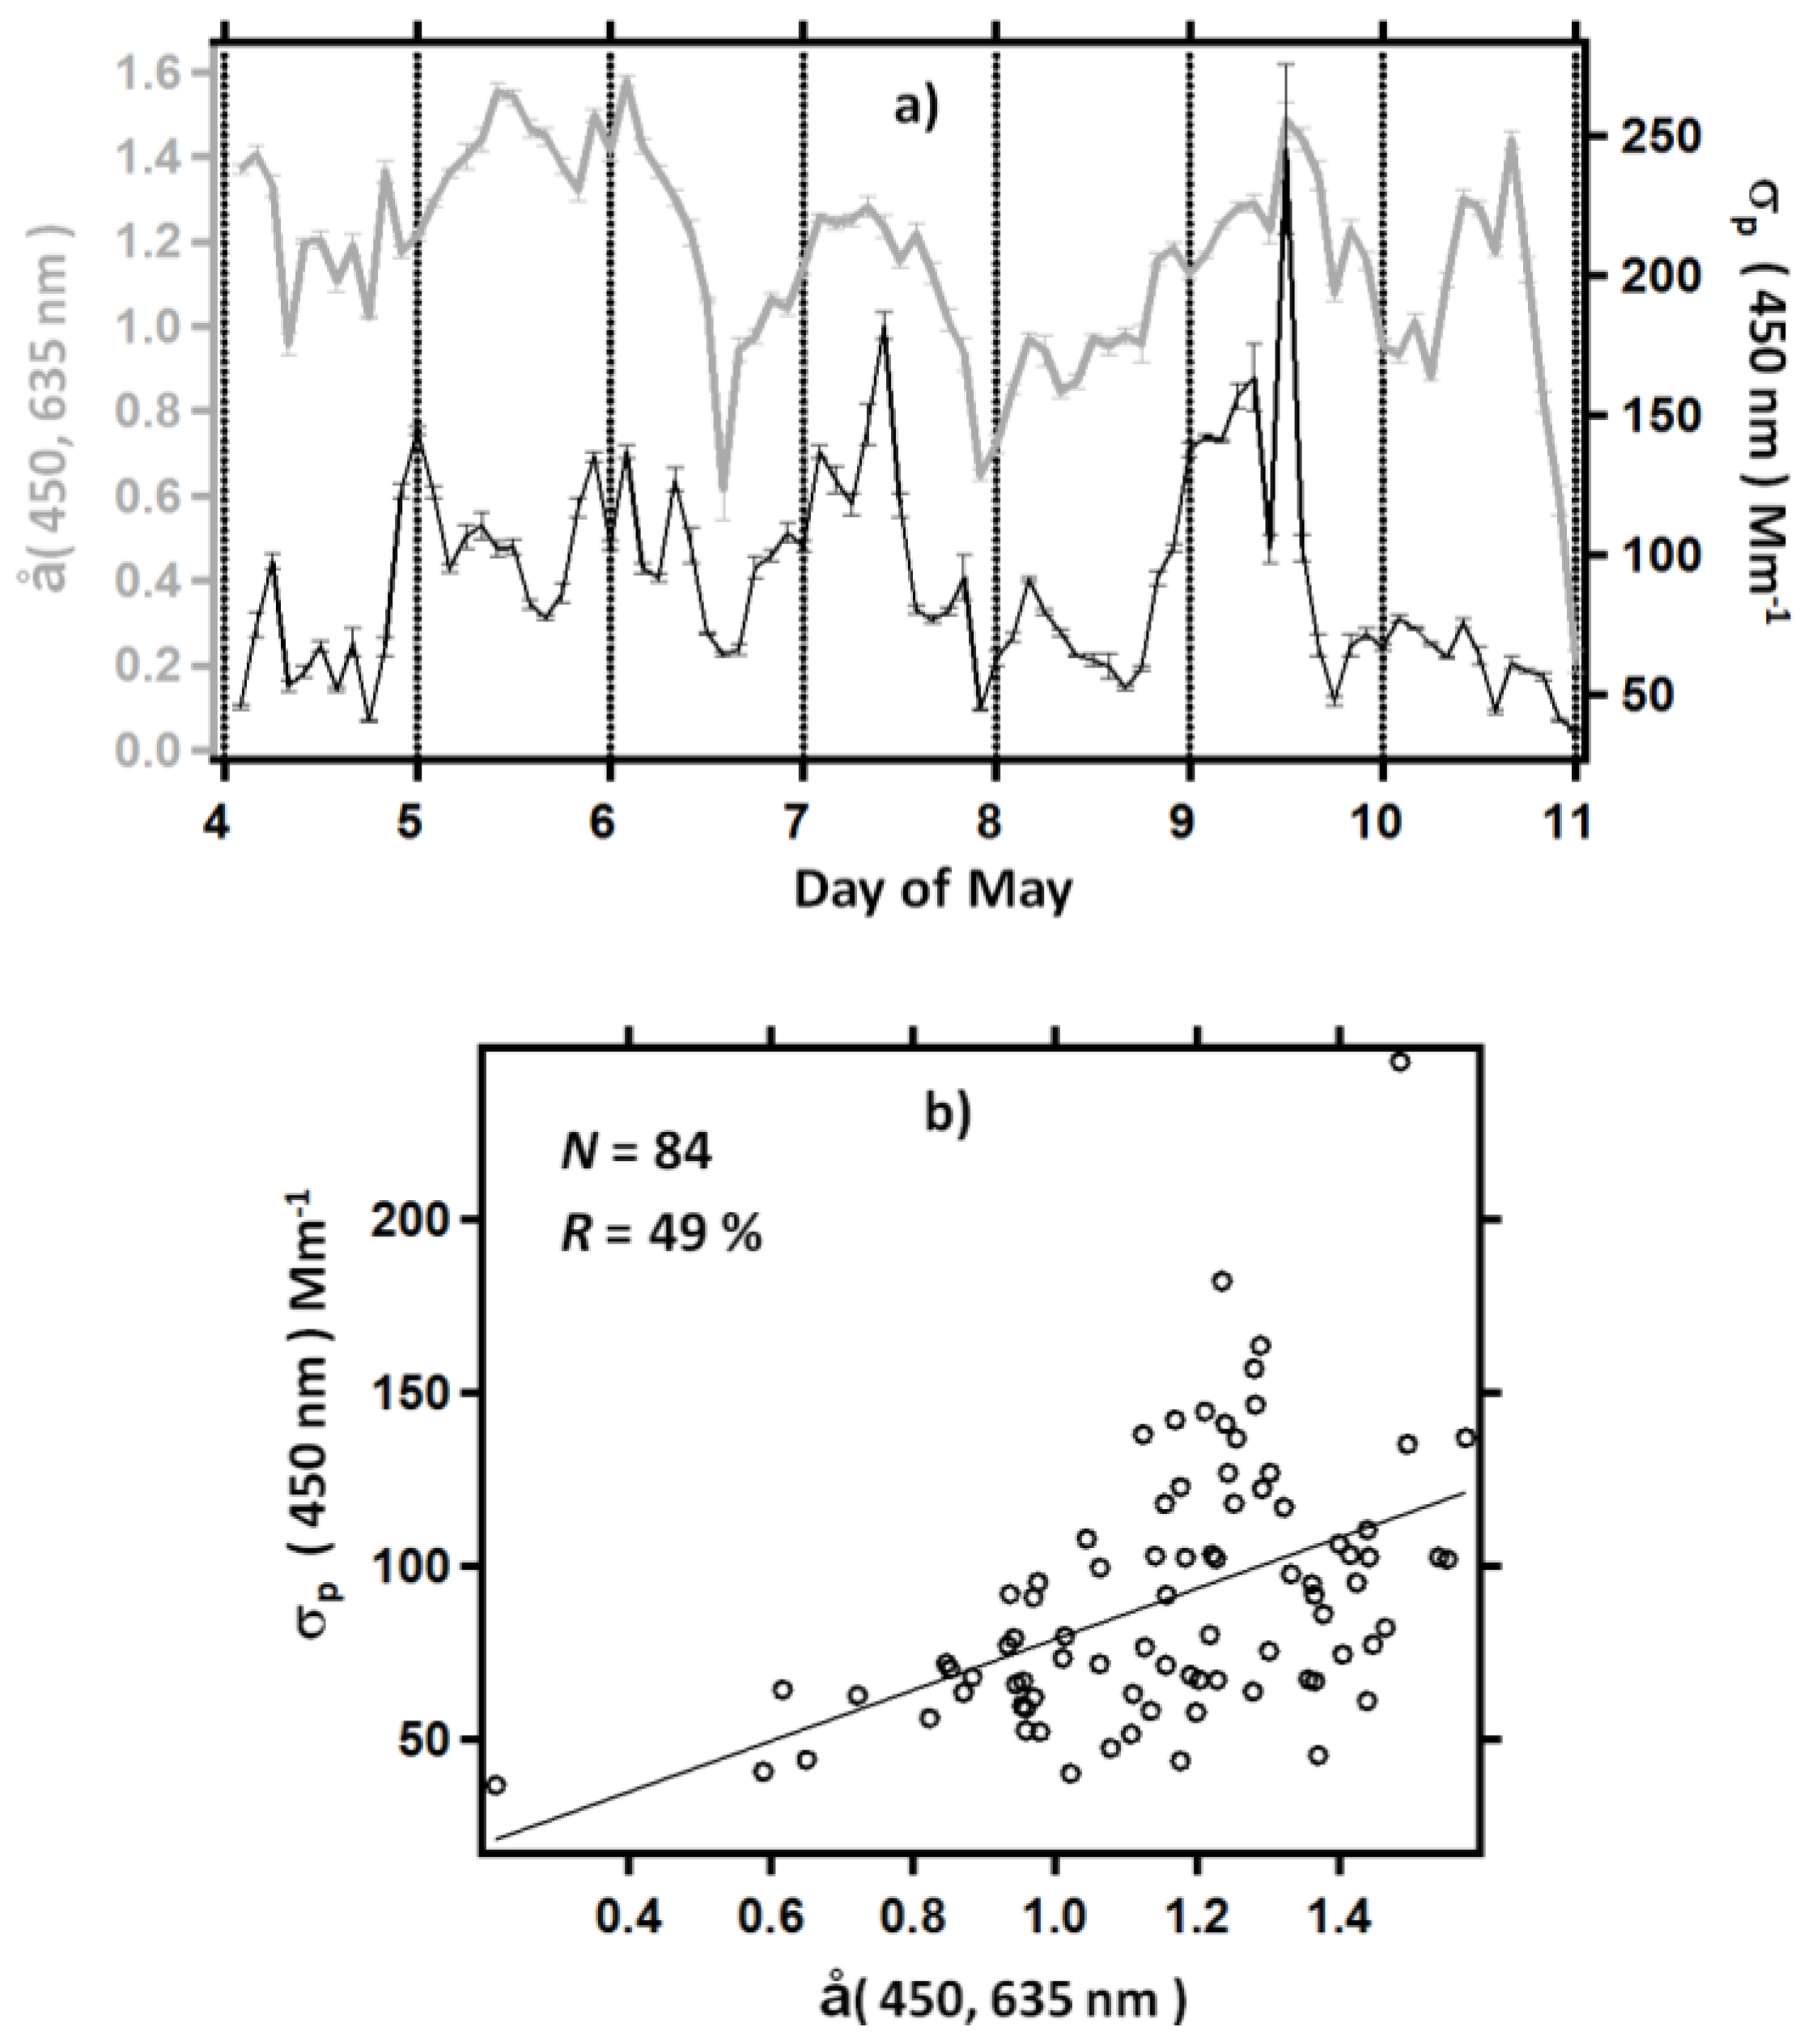
Figure 5a (black line) shows the time evolution of the particle scattering coefficient at 450 nm averaged over 2 hours with corresponding SEM from 4 to 10 May 2015.
σp values that spanned the 37–245 Mm
−1 range were characterized by a rather high daily and day-to-day variability, because of the high variability of the optical and microphysical properties of the atmospheric particles due to both the local production and the long-range transport. Scattering coefficients depend on the number concentration, the size, the shape, and the absorption of the sampled particles. The changes of the synoptic and local meteorological conditions, which affect the optical and microphysical properties of particles, also have a large impact on the σ
p daily cycle and variability [
1,
6], in addition to the particle’s source changes. The grey line on
Figure 5a shows the time evolution of the two hour-averaged scattering Ångström coefficient values with corresponding SEMs. The scattering Ångström coefficient at the 450–635 nm wavelength pair was calculated from the following relation [
1]:
and describes the
σp spectral dependence. å, a qualitative indicator of the dominant particle size, spanned the 0.1–1.6 range, indicating that also the contribution of fine and coarse mode particles at the ground level significantly varied during the studied period. The rather low å values around midday of 6 May and around 10:00 p.m. UTC on 7 May were likely due to the large dust concentration near the ground level, in accordance with the modeled dust vertical profiles of
Figure 3c,d, respectively.
Figure 5a shows also that small å values were on average associated with small
σp values. The σ
p decrease with the particle size increase and, hence, with the å decrease has likely contributed to this last result. Note that the σ
p decrease may also be associated with the decrease of the fine-mode particle contribution, as it will be shown in the following.
Figure 5b shows the
σp (450 nm)
versus å (450, 635 nm) plot. The data points have been fitted with a linear regression. The linear correlation coefficient
R that is equal to 0.49 and the corresponding significance level that is larger than 99% indicate that the two parameters were satisfactorily correlated. The data spread revealed by
Figure 5b mainly at å > 1 was due to the variability of the particle concentration, being σ
p and å an extensive and an intensive particle parameter, respectively.
Figure 5.
(a) The black and grey lines show the 2-hour averaged values of σp (450 nm) and å (450, 635 nm), respectively, retrieved from nephelometer measurements, from 4 to 10 May 2015. Error bars represent the SEMs; (b) σp (450 nm) versus å (450, 635 nm) plot. The solid line represents the best fitting regression line, N is the total number of data, and R represents the linear correlation coefficient.
The σ
p time evolution has been compared with the one of the SW-F
DW, LW-F
DW, and LW-F
UP on
Figure 6a–c, respectively, to highlight the irradiance effects on the σ
p daily changes and, hence, on the ground level particle properties. One observes from
Figure 6 that on each day σ
p reached on average the smallest values around noon, when the SW and LW fluxes reached the highest values. The high irradiance values around noon, which favor the air convective motions and hence the dispersion of the atmospheric particles at the surface, were responsible for these results. The high σ
p values monitored around midday of 7 and 9 May were likely due to the advection of a large amount of fine mode particles, being the
σp values associated with å values larger than 1.2 (
Figure 5a).
Figure 6 also reveals that
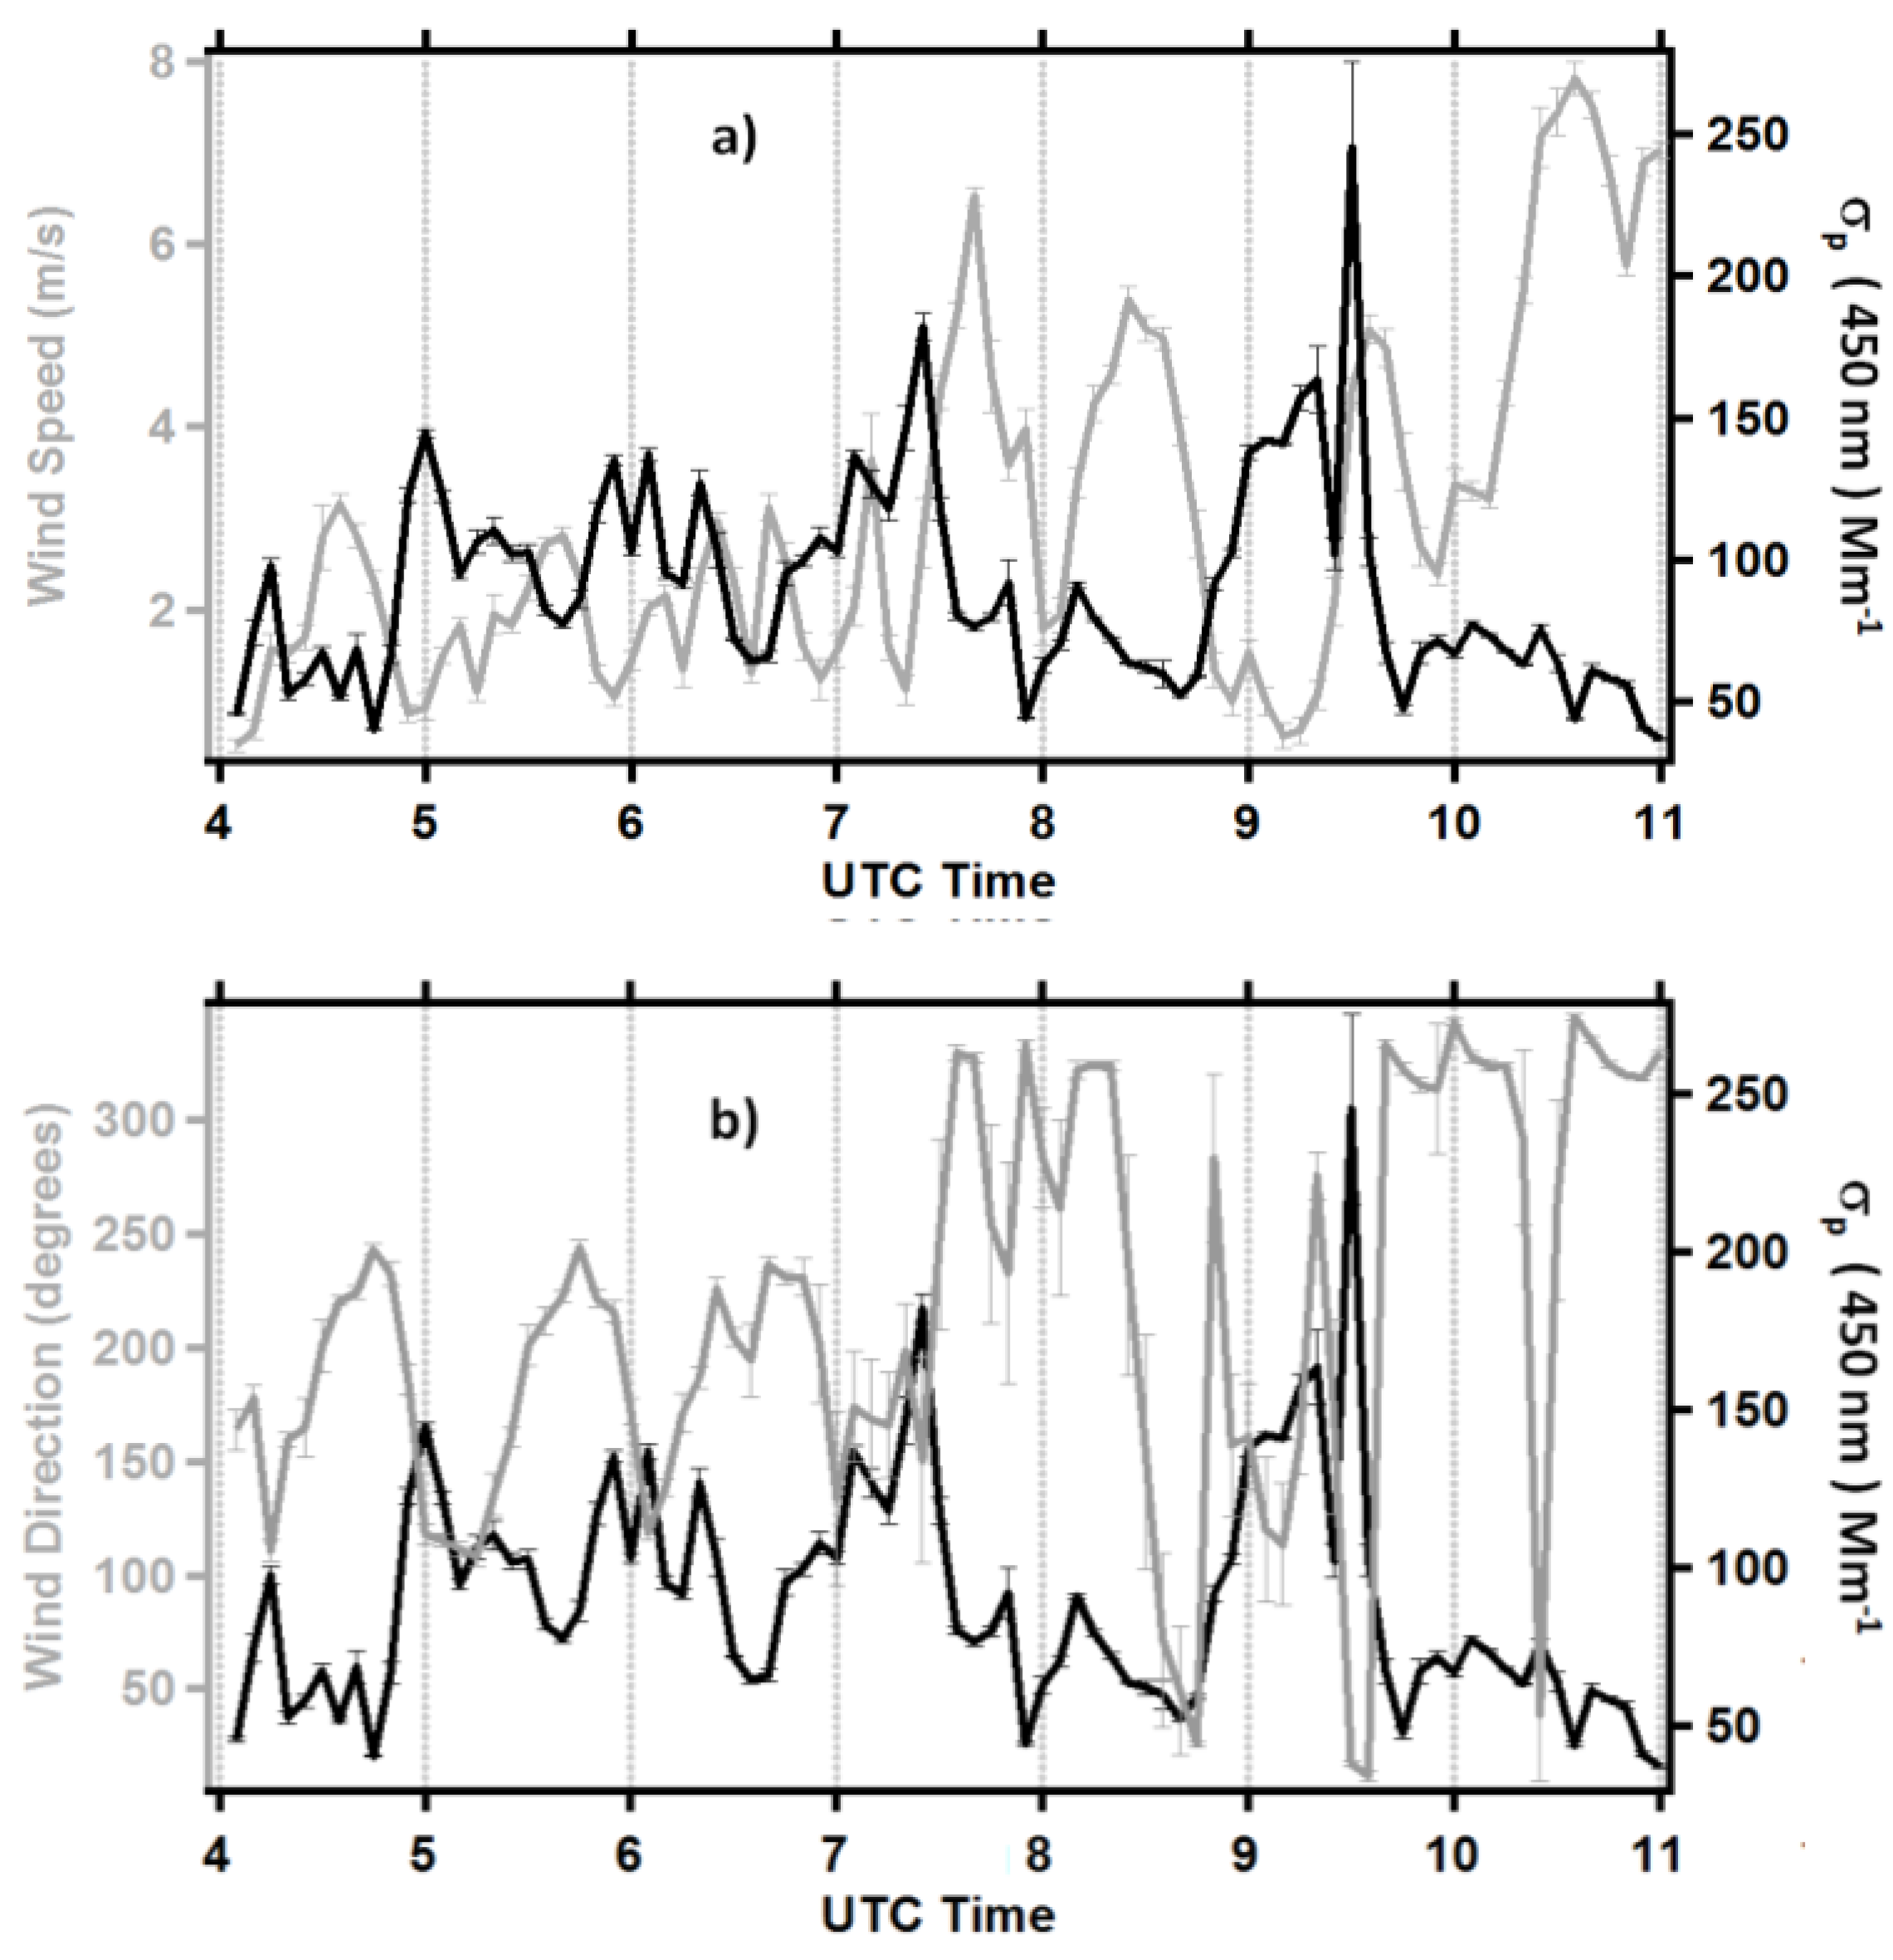
σp on average increased at night-time when the SW and LW irradiance reached minimum values and the air convective motions decreased, favoring the particle accumulation at the ground level. Surface wind speed and direction measurements from a local meteorological station have also been used to obtain a better understanding of the
σp daily evolution from 4 to 10 May.
Figure 7 (grey lines) shows the time evolution of the two hour-averaged (a) wind speed and (b) direction from 4 to 10 May 2015. The
σp daily evolution is also shown on each plot of
Figure 7 for comparison (black lines). One observes at first from
Figure 7a that the wind speed on average reached largest values around midday when the SW and LW irradiances also reached peak values. Consequently,
Figure 7a reveals that
σp decreased (increased) with the increase (decrease) of the wind speed, since the wind speed affected the vertical dispersion of the ground-level aerosols [
1].
Figure 6.
Comparison of the time evolution of the two hour-averaged σp (black line) with one of (a) SW-FDW (grey line), (b) LW-FDW (grey line), and (c) LW-FUP (grey line), from 4 to 10 May 2015. The error bars represent the corresponding SEMs.
Figure 6.
Comparison of the time evolution of the two hour-averaged σp (black line) with one of (a) SW-FDW (grey line), (b) LW-FDW (grey line), and (c) LW-FUP (grey line), from 4 to 10 May 2015. The error bars represent the corresponding SEMs.
Figure 7b allows inferring that the
σp daily evolution might also be affected by the surface wind direction. In fact,
Figure 7b (grey line) shows that the wind direction daily cycle that was rather similar on 4, 5, and 6 May, changed day-to-day since midday of 7 May. Then,
Figure 7b (black line) reveals that the σ
p daily cycle was characterized by a greater day-to-day variability on 8, 9, and 10 May than on 4, 5, and 6 May.
Figure 7.
Time evolution of the two-hour averaged values of (a) wind speed (grey line) and σp (black line), and (b) wind direction (grey line) and σp (black line). The error bars represent the corresponding SEMs.
Figure 7.
Time evolution of the two-hour averaged values of (a) wind speed (grey line) and σp (black line), and (b) wind direction (grey line) and σp (black line). The error bars represent the corresponding SEMs.
3.3. Scattering and Irradiance Measurements on 6 and 8 May 2015: Case Studies
The daily evolution of the SW and LW irradiance and of the aerosol scattering coefficient monitored on 6 and 8 May are analyzed in more detail in this subsection to present and discuss the irradiance impact on the dispersion and the size distribution of the surface particles, by two case studies. The Saharan dust advection was largest on 6 May and weak on 8 May, as the columnar Ångström coefficient values of
Figure 2 (triangles) indicate.
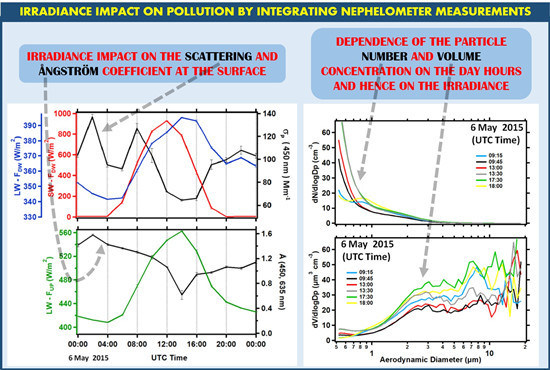
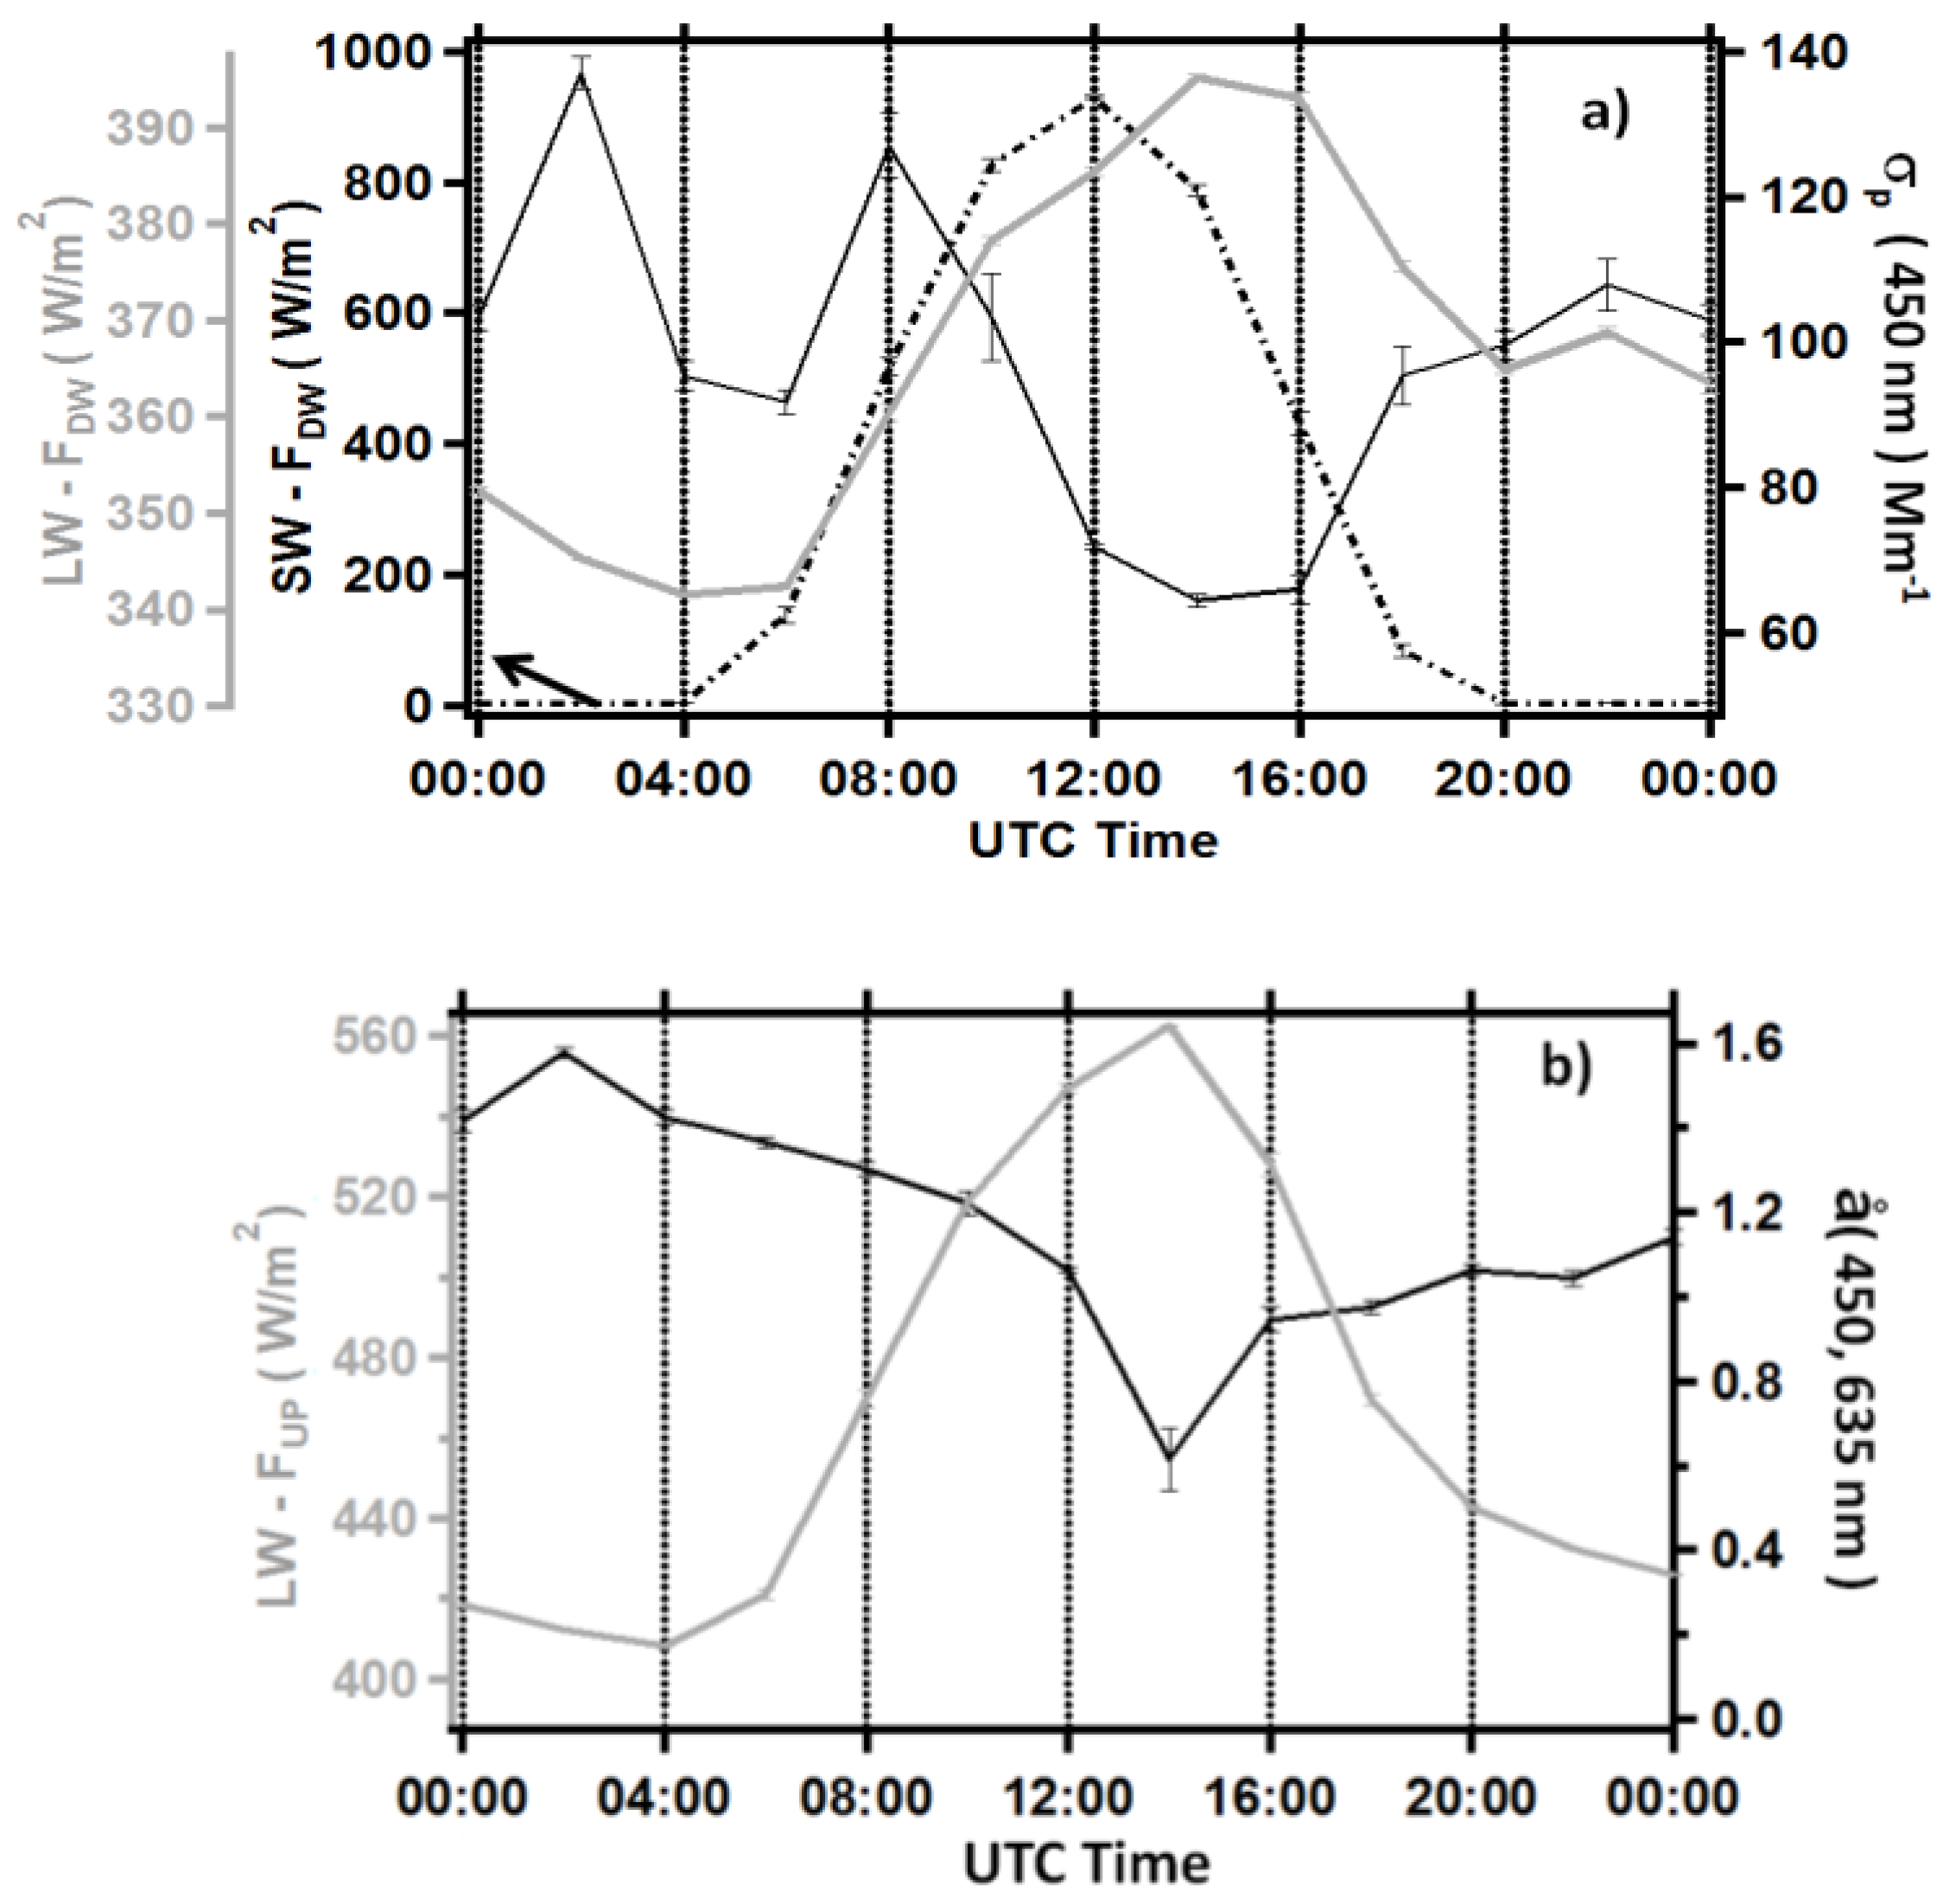
Figure 8a shows the time evolution of the two hour-averaged
σp (black solid line), SW-F
DW (black dotted line), and LW-F
DW (grey solid line) on 6 May 2015. The time evolution of the two hour-averaged scattering Ångström coefficient is plotted on
Figure 8b (black line). The grey line on
Figure 8b shows the time evolution of the two hour-averaged LW-F
UP. The
σp peak value around 2:00 a.m. UTC, revealed by
Figure 8a (black solid line), was likely due to the advection of a “cloud” of fine mode particles of anthropogenic origin. To support the last comment, note that å (450, 635 nm) reached the peak value of 1.6 around 2:00 a.m. UTC (
Figure 8b, black solid line) and then decreased. In fact, å values larger than one are observed when fine mode particles are dominant, as mentioned.
Figure 8a also shows that
σp reached a peak value around 8:00 a.m. UTC and, then, rapidly decreased with the time up to about 2:00 p.m. UTC. The
σp decrease was associated with the fast increase of the SW and LW irradiance, which favored the planetary boundary layer increase and, hence, the particle dispersion.
Figure 8b (black line) reveals that å also decreased with the time reaching the minimum value of 0.6 at around 2:00 p.m. UTC, when the LW-F
DW and -F
UP reached the maximum value. The combined decrease of both the
σp and the å values could be due to several processes. It would be possible that the increased irradiance resulted in a more vigorous and turbulent convection, which favored the mixing of the upper air enriched with long range transported African dust particles, with the air below containing mostly fine particles. This would result in an overall reduction of the scattering coefficient through dilution, and an increase of the fraction of larger particles with respect to the smaller ones. Note that 6 May was a clear sky day characterized by a large amount of coarse mode particles due to African dust up to the ground level (
Figure 3c). The irradiance increase could also have favored more the dispersion of the fine mode particles than that of the coarse mode particles, being the latter on average “heavier” than fine mode particles. Vehicles, which enhance the re-suspension of road dust (large particles) into the air on the diurnal traffic rush hours, could also have contributed to the å decrease around midday as mentioned in some studies [
4]. Size distribution measurements at the surface support the decrease of the fine-mode particle contribution with the increase of the SW and LW irradiance, as is shown in the following.
Figure 8.
(a) Daily evolution of the two hour-averaged values of σp (black solid line), SW-FDW (black dotted line), and LW-FDW (grey solid line) on 6 May 2015; (b) Two hour-averaged å (450, 635 nm) (black line) and LW-FUP (grey line) daily evolution on 6 May 2015. The error bars represent the corresponding SEMs.
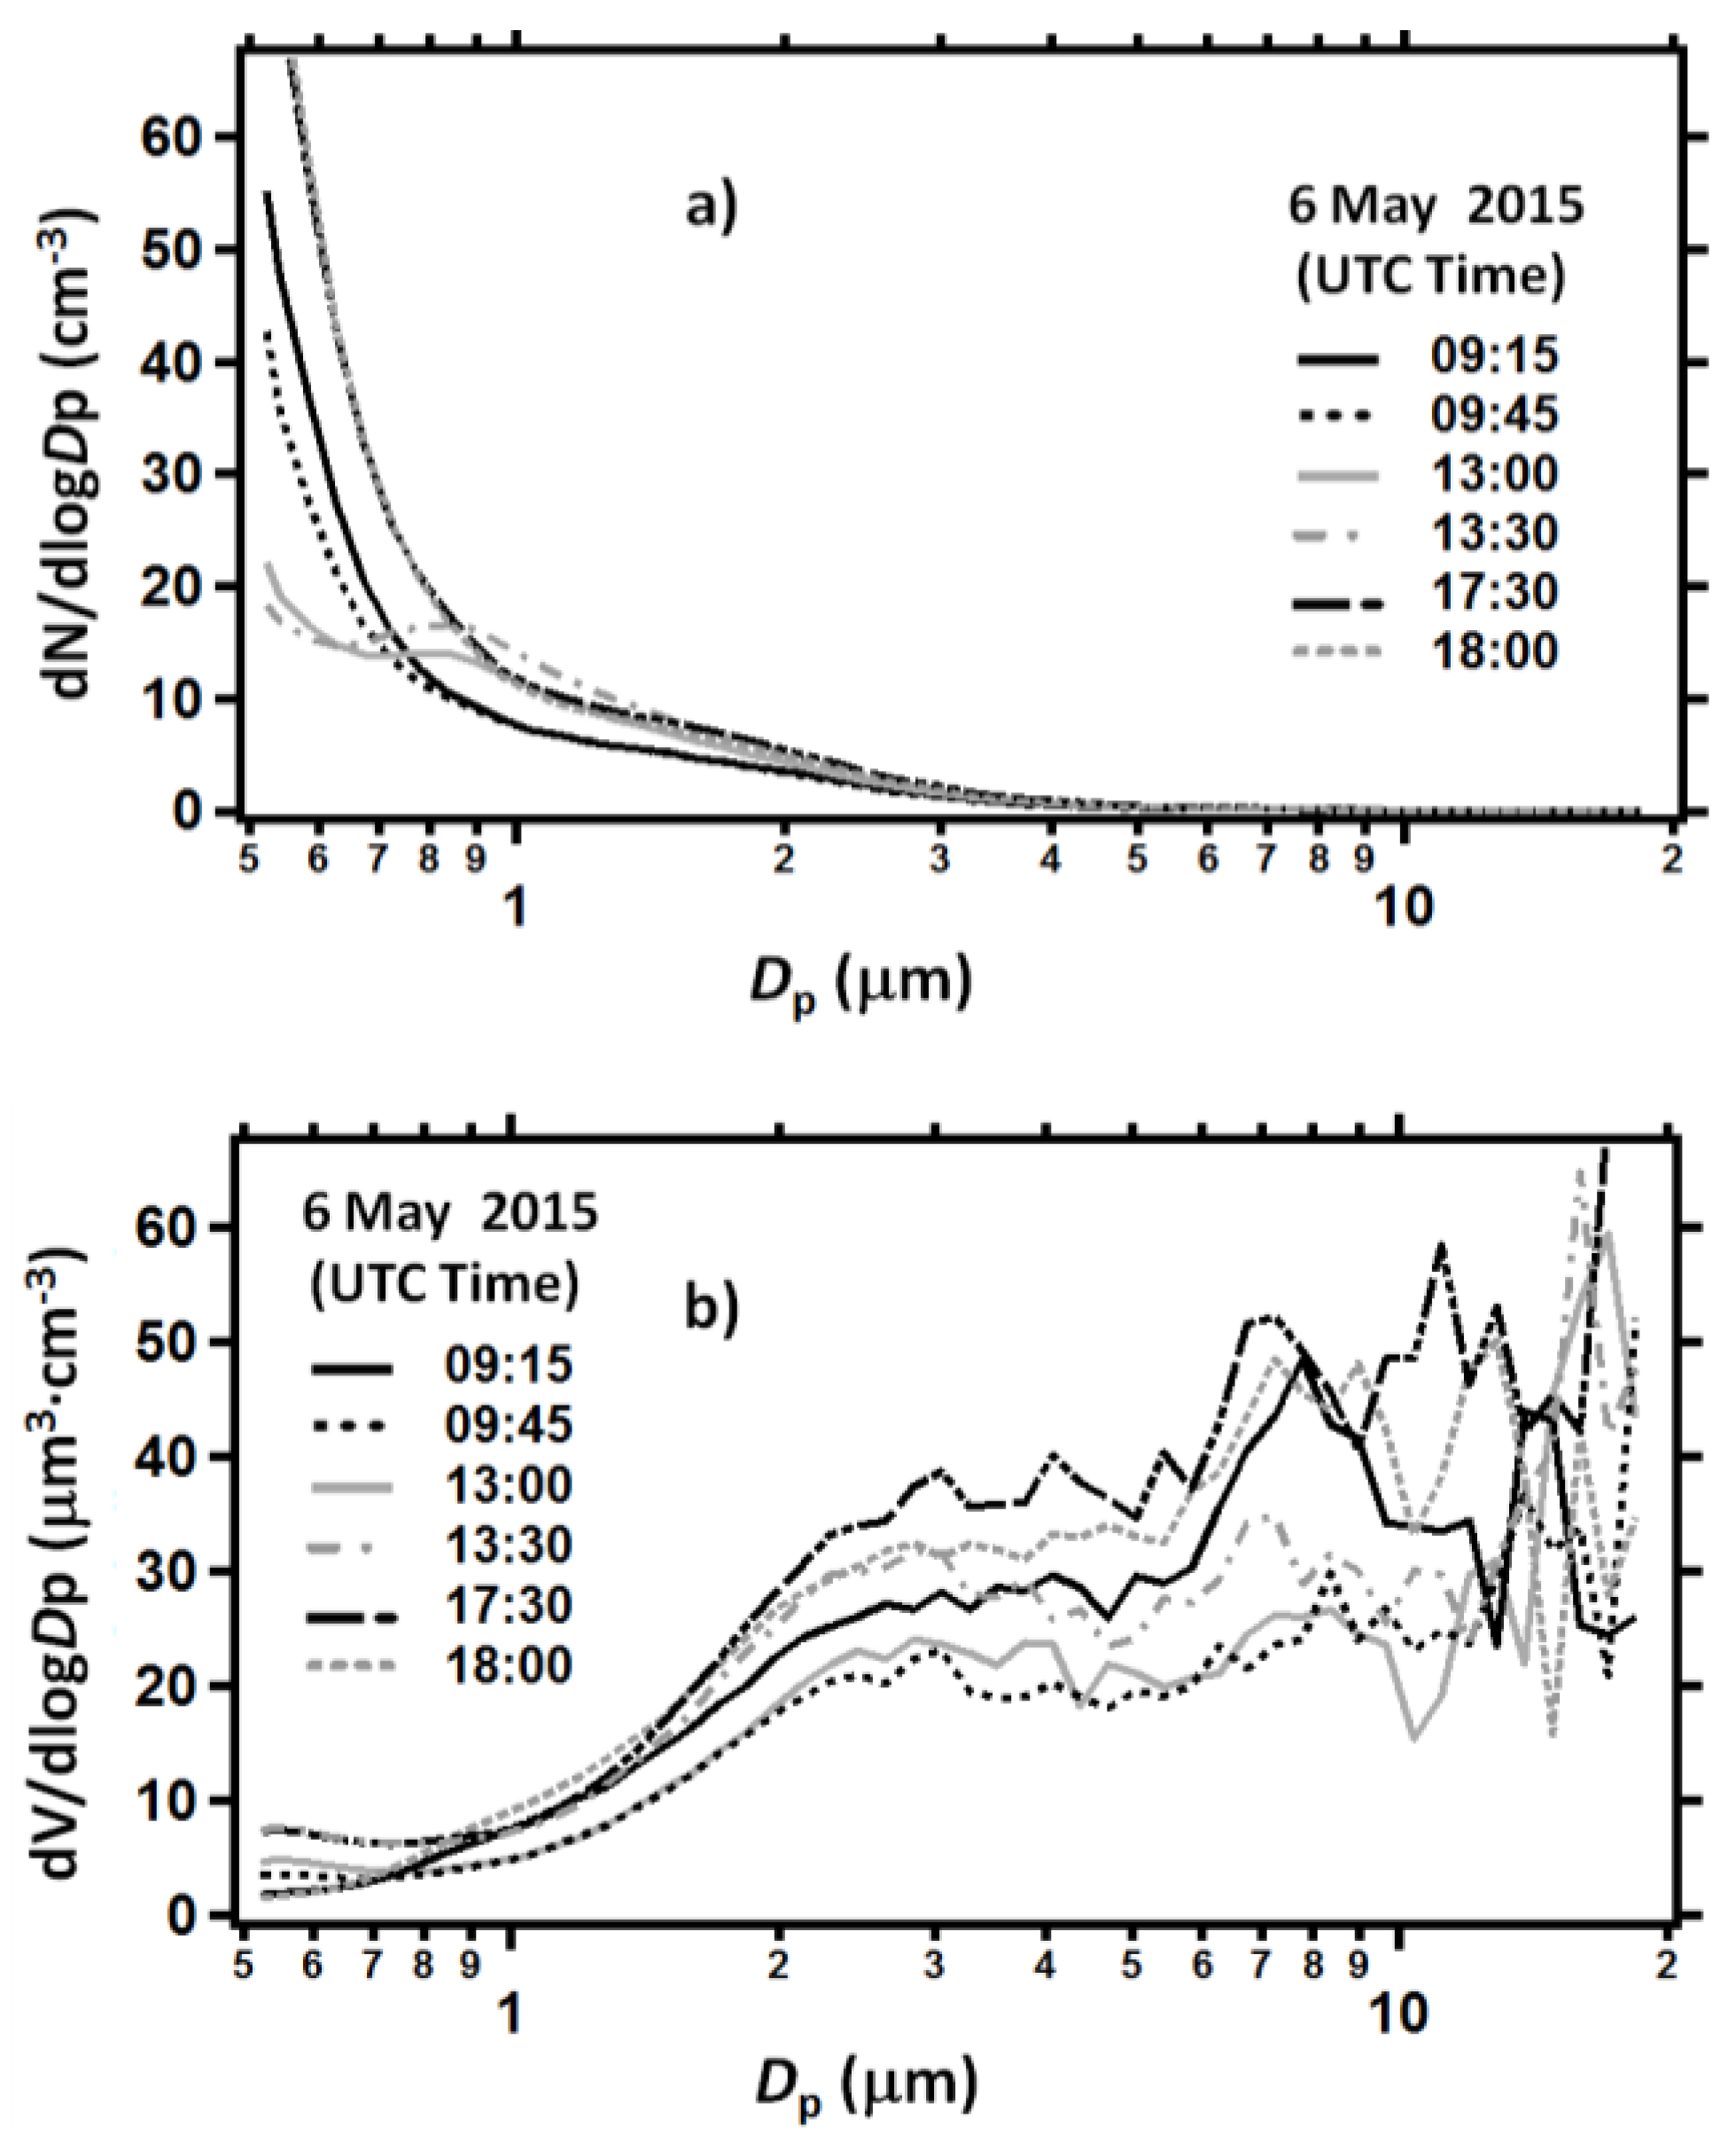
Figure 9 shows the aerosol size distributions within the 0.52–20 μm range obtained at different day hours on 6 May from the APS 3321 measurements averaged over 30 min. More specifically,
Figure 9a,b show the number (
N) and the volume (
V) particle concentrations, respectively, as a function of the particle diameter (
Dp) on a logarithmic scale. Note that the volume particle concentrations are commonly used to highlight the contribution of coarse mode particles, which have a number concentration significantly smaller than the one of fine mode particles, as
Figure 9a reveals. One observes from
Figure 9a that the number concentration of the fine mode particles rapidly decreased reaching a rather small value around 1:30 p.m. UTC. On the contrary, it increased reaching a large value around 8:30 p.m. UTC, when the SW and LW irradiance reached minimum values and favored the particle accumulation at the surface because of the decrease of the planetary boundary layer height. In addition,
Figure 9b shows that the volume concentration of the coarse mode particles at the surface increased with the fine mode particle decrease and
vice versa. Note that the time evolution of the size distribution revealed by
Figure 9a,b is in good accordance with the å temporal trend of
Figure 8b (black line).
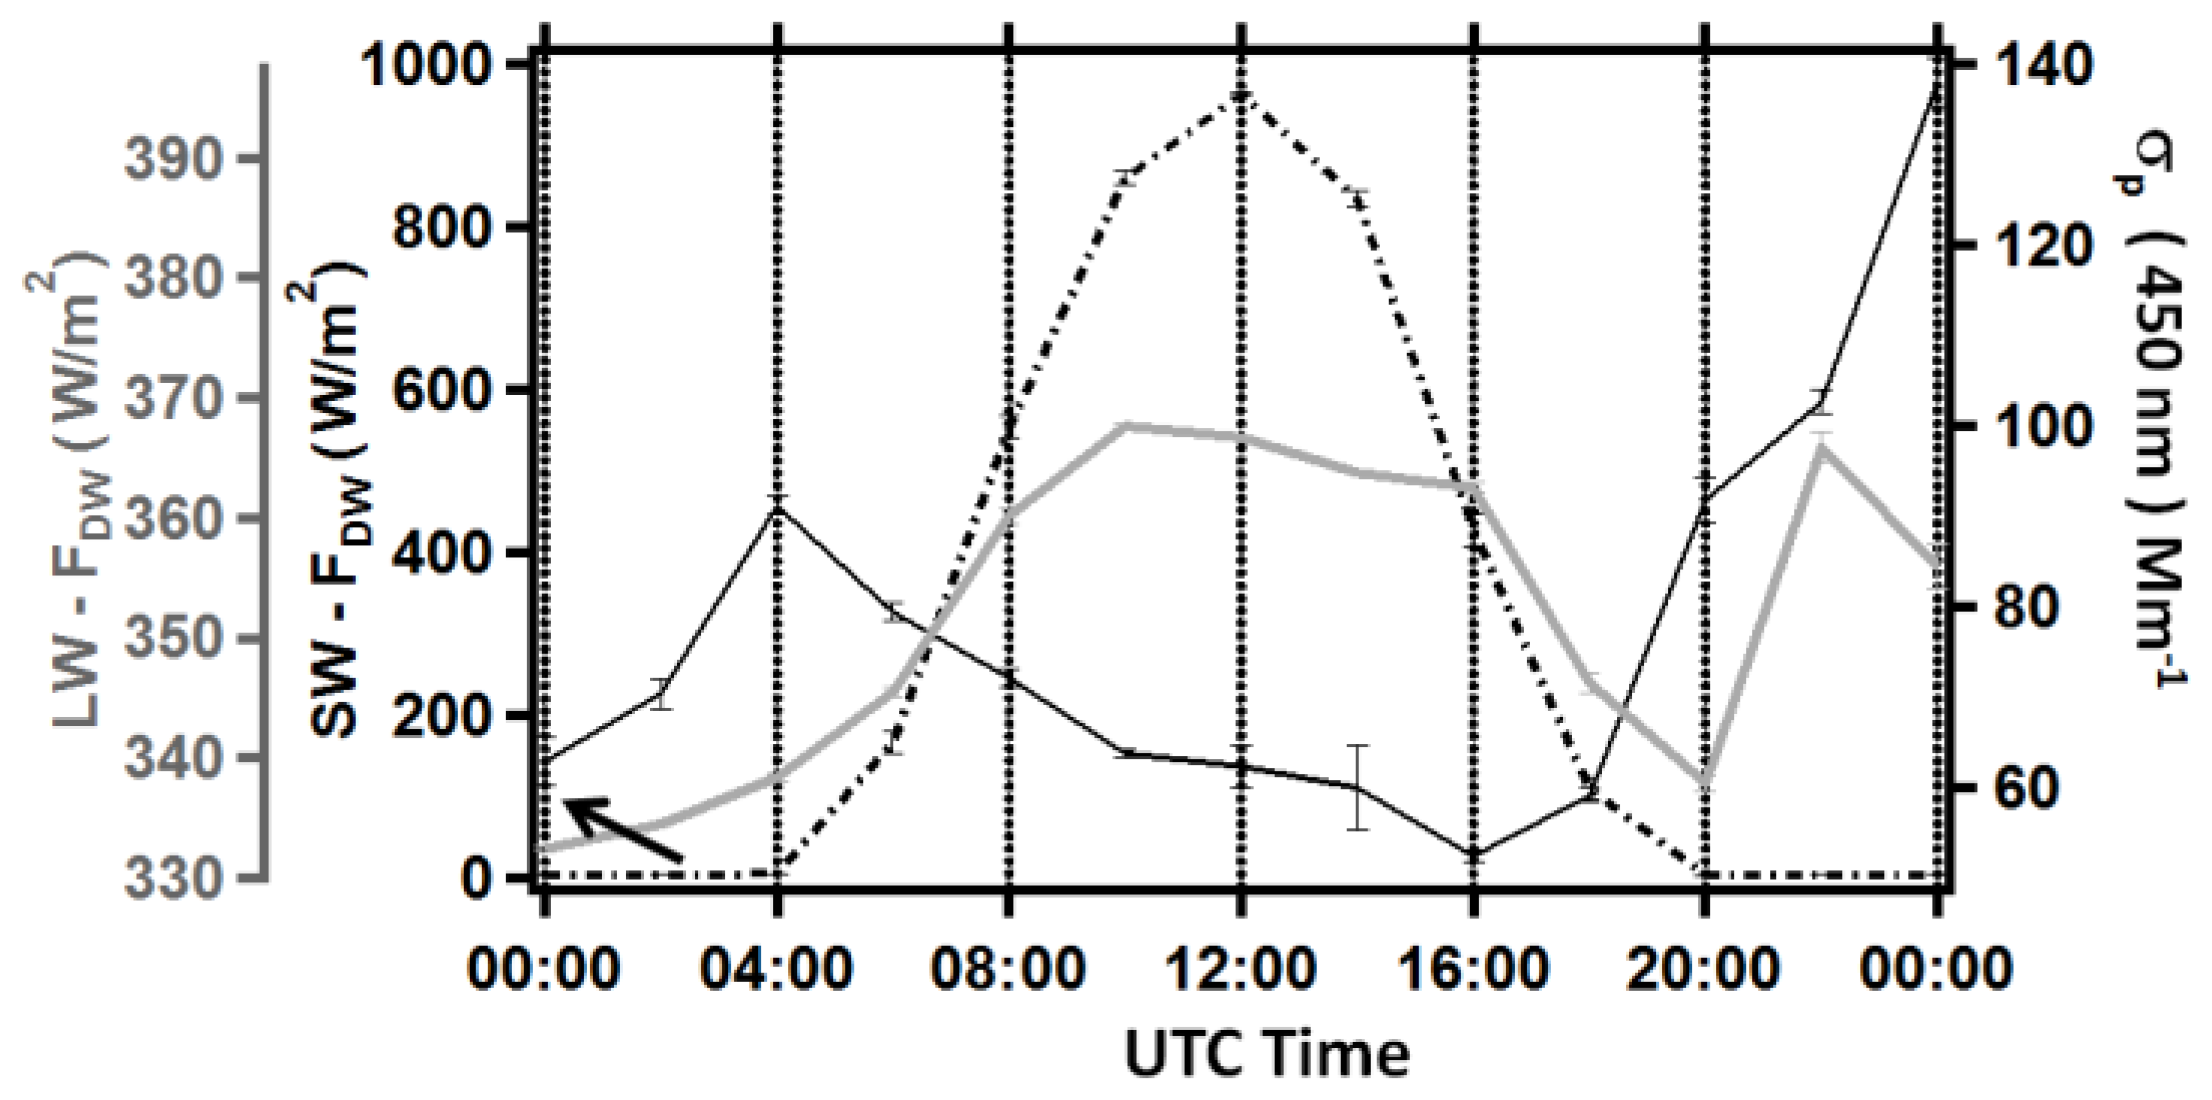
Figure 10 shows the time evolution of the two hour-averaged
σp (black solid line), SW-F
DW (black dotted line), and LW-F
DW (grey solid line) on 8 May 2015. Observe that
σp reached a peak value around 4:00 a.m. UTC, decreased with the increase of the SW and LW irradiance reaching a minimum value around 4:00 p.m. UTC, and increased fast with the time after sunset. Therefore, one can note from
Figure 10 (black solid line) that the
σp daily evolution on 8 May (day weakly affected by dust) was similar to the one on 6 May (dusty day) from sunrise to sunset, as revealed by the comparison with
Figure 8a (black solid line). This last outcome indicates that the desert dust advection on 6 May has not determined a significant variation of the
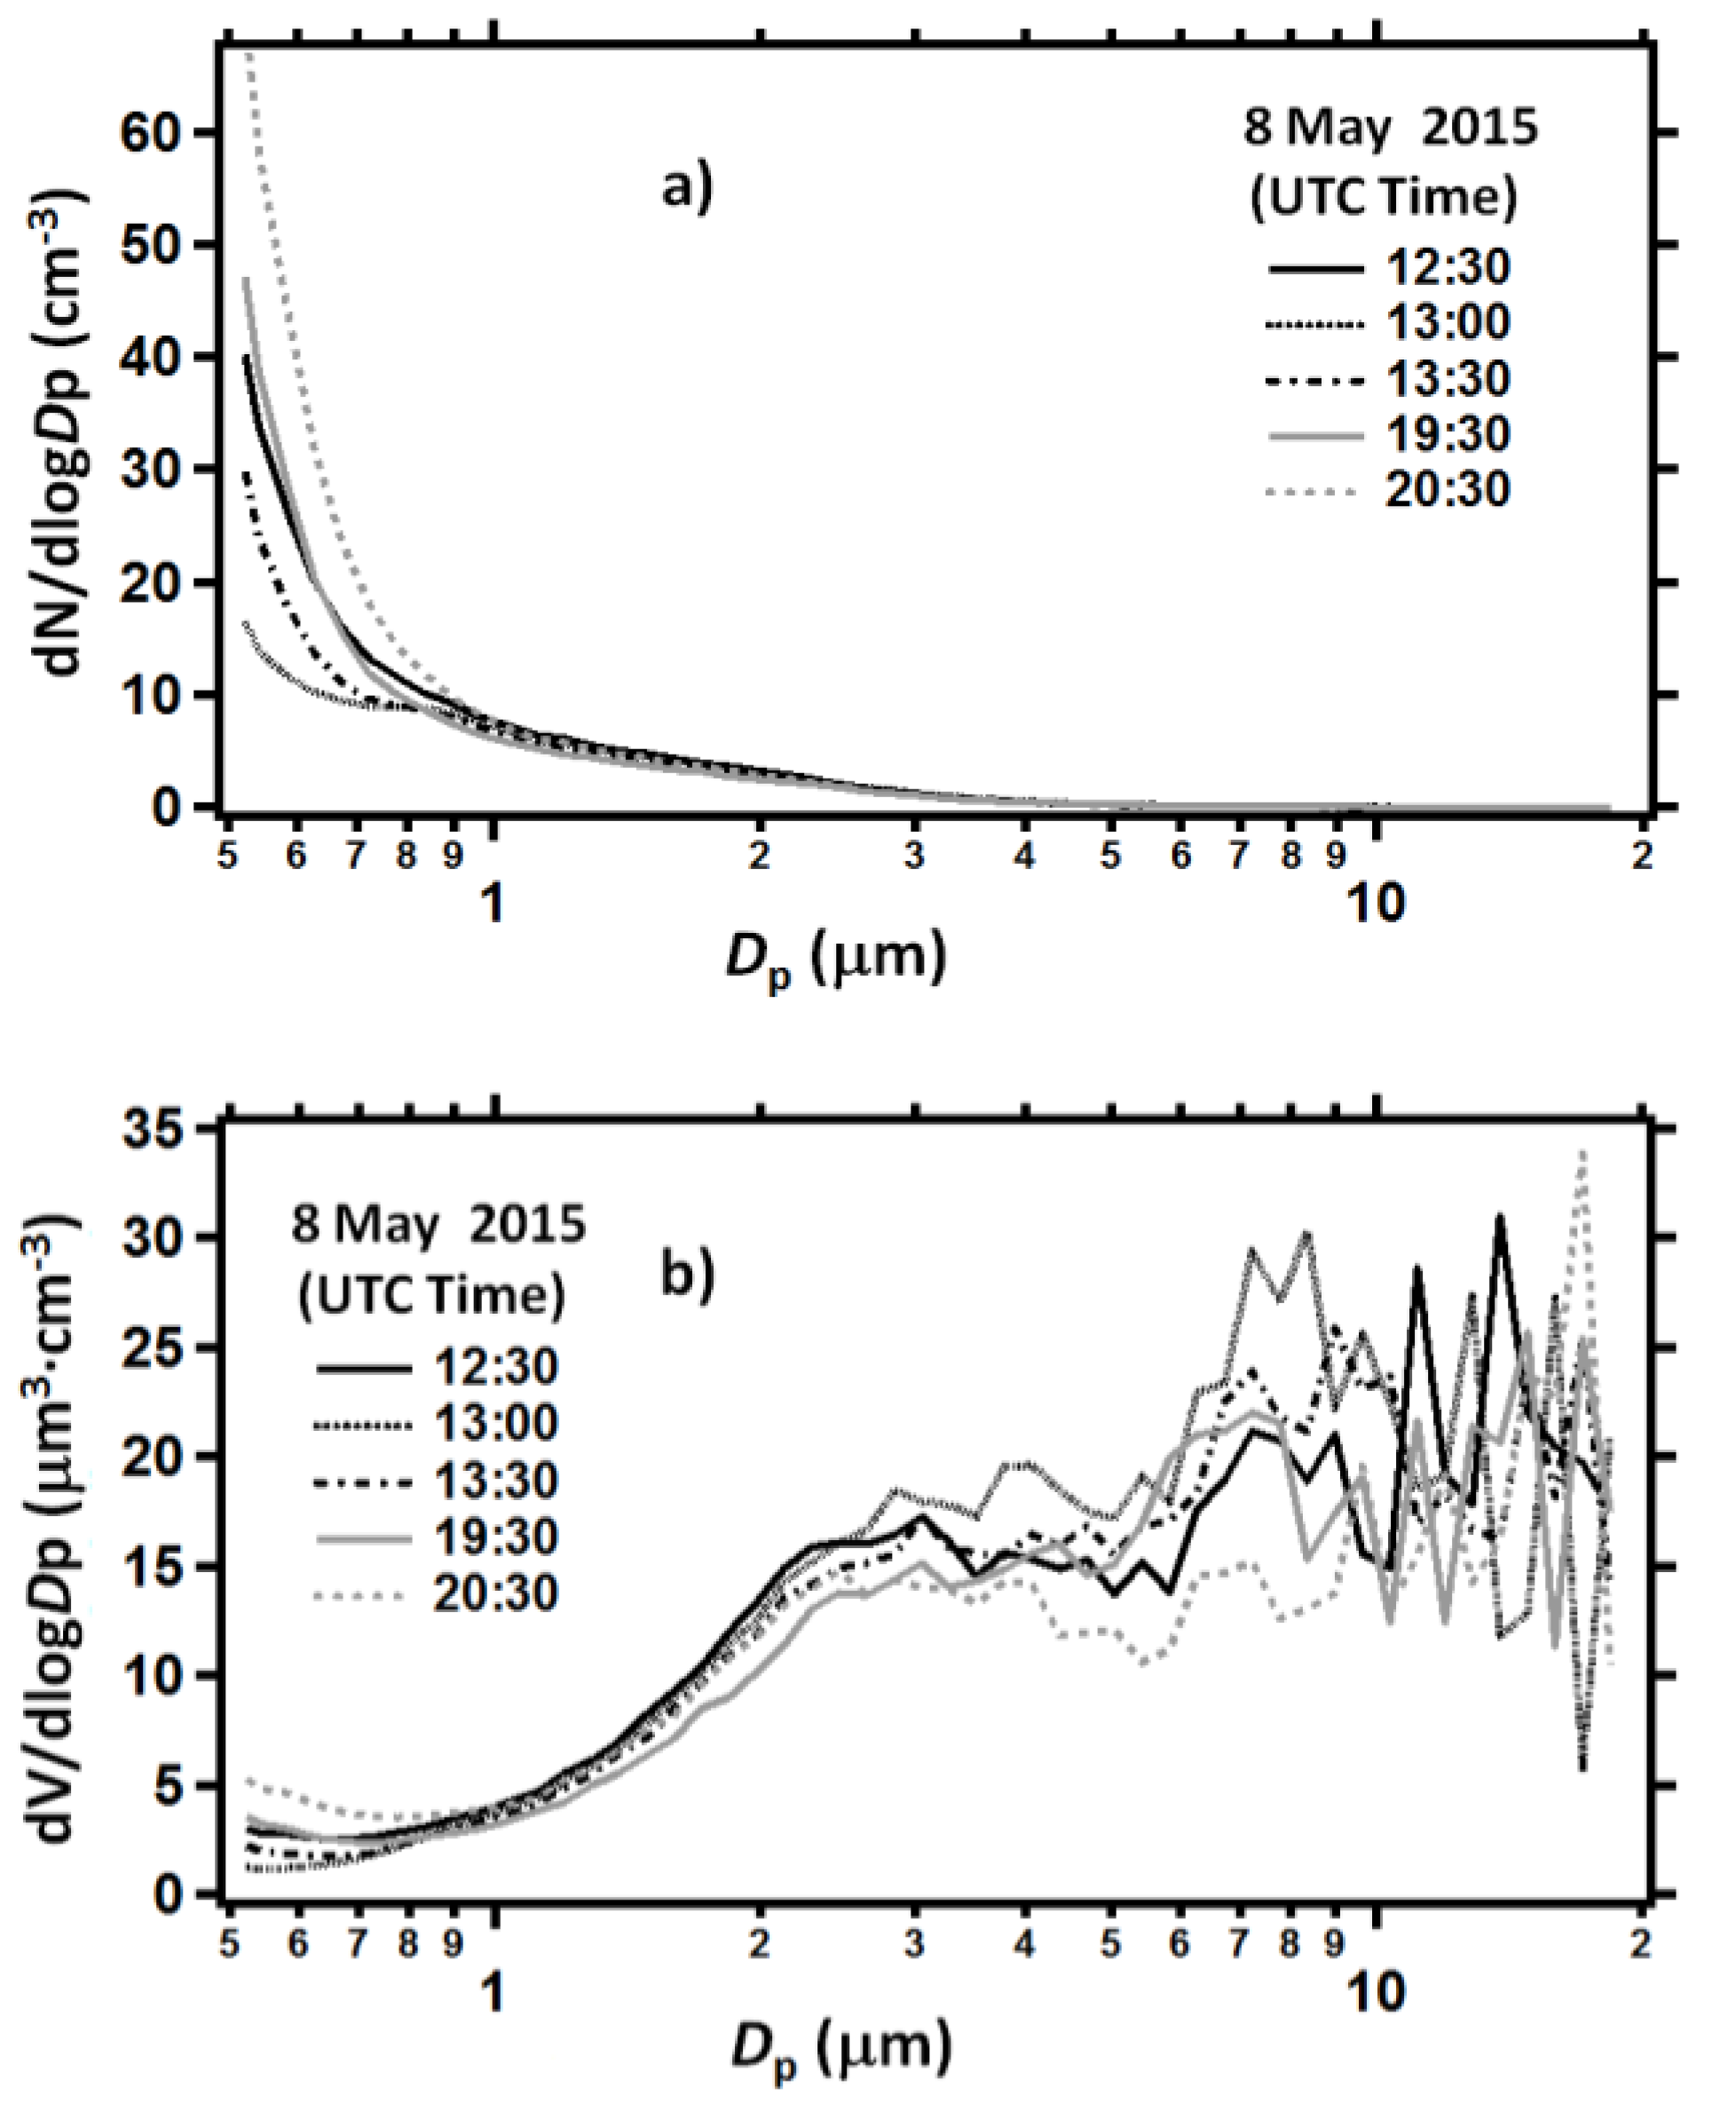
σp daily cycle, since the latter was mostly dependent on the diurnal evolution of the irradiance and, hence, of the planetary boundary layer height. The number (
N) and volume (
V) particle concentrations
versus the particle diameter (
Dp) at different day hours are shown in
Figure 11a,b, respectively. In particular,
Figure 11a reveals that the number concentration of the fine particles decreased/increased with the
σp decrease/increase. Conversely,
Figure 11b reveals that the volume concentration of the coarse particles increased with the
σp decrease. As mentioned, several factors have likely contributed to the increase (decrease) of the coarse (fine) particle contribution. We believe that the presented results highlight the large effects of the local SW and LW irradiance on the land–atmosphere interaction and particle dispersion even when the local pollution at the surface was largely affected by the contribution of transboundary particles.
Figure 9.
(a) Number (N) and (b) volume (V) particle concentrations versus the particle diameter (Dp) on a logarithmic scale within the 0.52–20 μm range at different day hours on 6 May 2015.
Figure 9.
(a) Number (N) and (b) volume (V) particle concentrations versus the particle diameter (Dp) on a logarithmic scale within the 0.52–20 μm range at different day hours on 6 May 2015.
Figure 10.
Daily evolution of the two hour-averaged values of σp (black solid line), SW-FDW (black dotted line), and LW-FDW (grey solid line) on 8 May 2015. The error bars represent the corresponding SEMs.
Figure 10.
Daily evolution of the two hour-averaged values of σp (black solid line), SW-FDW (black dotted line), and LW-FDW (grey solid line) on 8 May 2015. The error bars represent the corresponding SEMs.
Figure 11.
(a) Number (N) and (b) volume (V) particle concentrations versus the particle diameter (Dp) on a logarithmic scale within the 0.52–20 μm range at different day hours on 8 May 2015.
Figure 11.
(a) Number (N) and (b) volume (V) particle concentrations versus the particle diameter (Dp) on a logarithmic scale within the 0.52–20 μm range at different day hours on 8 May 2015.


