

Impact of Hydroclimatic Changes on Water Security in the Cantareira Water Production System, Brazil


Department of Hydraulic and Environmental Engineering, Universidade de São Paulo, São Paulo 05508-070, Brazil
*
Author to whom correspondence should be addressed.
Atmosphere 2023, 14(12), 1836; https://doi.org/10.3390/atmos14121836
Submission received: 26 October 2023
/
Revised: 24 November 2023
/
Accepted: 29 November 2023
/
Published: 18 December 2023
(This article belongs to the Special Issue The Impact of Climate Change on Water Resources)
Abstract
:The Cantareira Water Production System (CWPS), which supplies water to the most populous region in Brazil, is facing significant challenges due to hydroclimate change, thus threatening its water security. This research integrates data from climate models and field observations with hydrological modeling, aimed at quantifying trends in key variables of the hydrological cycle. The GFDL-CM4 climate model, the most suitable for the study area, was employed to generate runoff data under both current conditions and future scenarios (SSP2-4.5 and SSP5-8.5). Our analysis reveals an increasing trend in the frequency of dry hydrological years. The Standard Precipitation Index (SPI) and Drought Magnitude (DM) confirm an increase in both the occurrence and duration of droughts in future scenarios. The runoff in all basins was reduced, causing a substantial decrease in minimum flows of 16.9%, medium flows of 11.8%, and high flows of 9.2% for the SSP5-8.5 scenario. This research introduces an approach to hydroclimate impact assessment, combining rigorous data analysis with advanced modeling techniques. Our findings not only provide a comprehensive understanding of the challenges faced by the CWPS, but also offer critical quantitative insights essential for developing effective public policies and adaptive strategies for sustainable water resource management.
1. Introduction
The availability of freshwater is essential for the sustainability and well-being of societies, and its efficient management becomes even more critical in the face of the challenges posed by climate change [1]. The Cantareira Water Production System (CWPS), which supplies the Metropolitan Region of São Paulo (MRSP), thus stands out as an important subject of study to understand the impacts of hydroclimatic changes on water security [2].
The CWPS, which supplies about 14 million people, faced challenges in its design and operation due to uncertainties and unreliable data during its inception in the 1970s. Over 30 years, it operated in a centralized manner until a new institutional arrangement allowed increased participation in decision-making and rule implementation based on more reliable historical data and crisis-induced learning [3].
The strategic relevance of the CWPS is undeniable, considering the fundamental role water plays in socioeconomic development and quality of life. However, in recent years, the CWPS has faced significant challenges due to a drought that spanned 9 years, from 2013 to 2021, jeopardizing the water security of the region [4,5].
Climate change has affected the hydrological cycle and precipitation patterns worldwide, with direct consequences for water availability and quality [6]. Ref. [7] addresses the dilemma of resisting or retreating in vulnerable areas, while [8] delves into the interconnectedness of globalization and climate change. Ref. [9] reveals deteriorating water quality and reduced availability in three Brazilian rivers under future climate conditions. Ref. [10] underscores the susceptibility of drinking water sources to climate-induced contamination, especially in high-latitude regions. Ref. [11] predicts significant reductions in water yield and hydropower generation on the Tungabhadra basin in India due to climate change. Lastly, Ref. [12] stresses the importance of climate-resilient water supplies in Florida amidst threats from sea level rise, saline water intrusion, and precipitation pattern changes.
In the case of the CWPS, an increase in climatic variability is observed, with extreme droughts and heavy rains becoming more frequent. This climate variability, combined with increasing water consumption, makes the CWPS susceptible to periods of scarcity and instability in supply [3,13,14].
The operating rules of the CWPS established by the current water resource management system do not consider the impacts of climate change. The hypothesis of this study is based on the idea that the current infrastructure and operating rules will not be able to ensure water security in the future, as these challenges require more complex management measures. The expeditious establishment of pertinent water governance frameworks is imperative to conduct effective water management and enhance adaptation to evolving climatic conditions [15,16].
Computational simulations are hybrid scientific tools that allow both the reproduction of a phenomenon and intervention in its behavior. Evaluating the impact of climate change on the hydrological regime has been presented by researchers as a useful technique for addressing the problem [17,18]. Reliable information on potential changes in future hydrological conditions requires knowledge of the influence of heterogeneity on the soil–vegetation–atmospheric relationships [19]; equally, basic data related to climate, topography, and land cover and soil characteristics are necessary for the hydrological simulation of basins [20].
The Database for Policy Decision-Making for Future Climate Change (d4PDF) is important in the context of the risk assessment of climate change [21]. However, post-processing techniques are necessary to be applied to the d4PDF data for regional water management purposes [22]. Additionally, utilizing multi-source precipitation together with a hydrological model for streamflow prediction contributes to understanding the surface water hydrology [23].
The lack of a hydroclimatic change database hinders the support for policy decision-making when planning for the CWPS. This paper aims mainly to quantify the trend of the major variables of the hydrological cycle (precipitation, evapotranspiration, and runoff) in the study area, the CWPS. Understanding these impacts is crucial for shaping public policies directed toward effective water resource management and adaptation to climate change.
2. Study Area
The study area is in Brazil and comprises a portion of the Paraíba do Sul River basin, which flows into the Atlantic Ocean, and another portion of the Tietê River basin, which is a tributary of the Paraná River, ultimately forming the River Plate basin in South America (Figure 1).
The study area shown in Figure 1 is a delineation of four hydrographic basins representing the CWPS: the Jaguari River, with its outlet at the Buenópolis stream gauge, and the Atibaia River, with its outlet at the Valinhos stream gauge, both rivers being sources of the Piracicaba River; the Juqueri River, with its outlet at the Paiva Castro dam; and the Jaguari River, a tributary of the Paraíba do Sul River, with its outlet at the Jaguari hydroelectric power plant.
The study area was further analyzed using the Digital Elevation Model (DEM) developed by [24], employing machine learning techniques to remove buildings and forests from the Copernicus DEM to produce a global elevation map with a grid spacing of 1 arc second (∼30 m). To extract and analyze the hydrographic information from the MDE, the TauDEM 5.3.7 software was used. This tool, employing flow direction methods, facilitated the delineation of contribution areas and the determination of stream networks [25,26]. Figure 2 shows a map of the study area.
As described in Figure 2, the Jaguari/Jacareí basin, with its outlet being the reservoir of the same name (JAG), discharges into the downstream Buenópolis basin with its outlet at the stream gauge of the same name (BUE). The Cachoeira and Atibainha basins, with outlets at their respective reservoirs (CAC and ATA, respectively), flow into the Atibaia basin with a stream gauge of the same name (ATI). Subsequently, the waters proceed to the Valinhos stream gauge (VAL), incorporating the contribution area of the same name. A schematic model of the study area is shown in Figure 3.
The Paiva Castro basin (PAI), with its outlet being the reservoir of the same name, and Jaguari of Paraíba do Sul basin (JPS), with its outlet being the reservoir of a hydroelectric plant, are shown in Figure 2 and Figure 3. The reservoirs are interconnected by tunnels and conduits. The main demands include the Santa Inês Pumping Station (SIPS), the Hydroelectric Power Plant (HPP), and maintaining the minimum flow at the stream gauges. When required, dam releases are adjusted to meet the specified thresholds. Table 1 presents the drainage area of the incremental basins within the study area.
3. Materials and Methods
The study method began with the data collection on precipitation and temperature from climate models, as well as precipitation, potential evapotranspiration, and discharge from field observations. The climate models for the study area were evaluated, and once the most suitable model had been selected, future potential evapotranspiration values were calculated for this model. The hydrological model was calibrated for the CWPS basins. Runoff data were generated for the observed and future scenarios. Figure 4 shows the research flowchart.
This section describes how the data were handled, with potential evapotranspiration calculation methods and hydrological model methods.
3.1. Data
The meteorological data observed were extracted from [20], who generated a dataset of daily gridded meteorological data with a spatial resolution of 0.1° for the period from 1961 to 2020 for the whole of Brazil. The information includes the minimum and maximum temperatures, precipitation, solar radiation, wind speed, relative humidity, and potential evapotranspiration. Data observed from 11,473 rain gauges and 1252 meteorological stations were used.
Simulated meteorological data were extracted from [27], who provided a dataset based on a set of 19 CMIP6 climate models with and without bias correction for projections over the Brazilian territory, based on the SSP2-4.5 and SSP5-8.5 scenarios. Bias correction was performed using the quantile delta mapping method [28] to correct biases in daily time series of precipitation, maximum and minimum temperature, solar radiation, wind speed, and relative humidity. The data are available for both historical (1980–2013) and future (2015–2100) simulations at a spatial resolution of 0.25°.
Discharge data from the stream gauges were obtained from the hydrological database of the State of São Paulo, and information about the inflow discharge of the reservoirs was obtained from the reservoir monitoring system of the Brazilian National Water Agency.
The data were collected, extracted for the area of interest, and stored in a dimensional database [29]. This facilitated data aggregation for generating information and statistics. The database was built on the PostgreSQL platform, organizing information by basin, daily time basis, parameter, model, and scenario.
3.2. Climate Model Evaluation
Multicriteria decision analysis was used to evaluate the climate models based on the proposal by [30]. The analysis is based on comparing the precipitation from the models with data observed in the study area. The criteria applied aimed to assess the overall ability of the models, both with and without bias correction, to replicate the main statistics of the observed data relevant to hydrological studies. The indicators include the time series (a) daily, (b) monthly, (c) annual, and (d) hydrological year (from October to September); average seasonality (e) day of the year and (f) month of the year; wet extreme (g) day of the year and (h) month of the year; and dry extreme (i) day of the year and (j) month of the year.
The performance of the ten indicators was evaluated using the modified Kling–Gupta Efficiency KGE′ coefficient initially proposed by [31] as an improvement over the Nash–Sutcliffe coefficient, and later modified by [32]. The coefficient was applied to evaluate the projected precipitation in Brazil, showing satisfactory results [33]. Equation (1) shows KGE′.
where: r (dimensionless) is the correlation coefficient, μ (mm) is the mean precipitation, σ (mm) is the standard deviation of the precipitation series, and the indices obs and sim indicate the observed and simulated series, respectively. The KGE′ varies from −∞ to 1, with 1 indicating the best fit. The KGE′ values corresponding to the selected criteria were scored according to the categories presented in Table 2 [34].
The sum of the scores for each indicator was used for ranking the climate models, from the highest to the lowest. The maximum value is 20, whereby all 10 indicators are classified as high, and the minimum value is 0, whereby all indicators are low.
3.3. Potential Evapotranspiration
The potential evapotranspiration (PE in mm) from the climate models was calculated using the PyEt library [35] using the Hargreaves methodology [36] presented in Equation (2).
where k is an empirical constant, with an adopted value of 0.0135; Ra is the extraterrestrial solar radiation in MJ·m−2d−1; λ is the latent heat of evaporation in MJ·kg−1; Tmax is the maximum air temperature in °C; and Tmin is the minimum air temperature in °C. The values of Ra and λ are calculated using the latitude grid values.
3.4. Hydrological Model
The hydrological model used here is based on [37], a conceptual model based on some physical reasoning that represents the catchment processes of several interconnected buckets, which mimic water storage and transfer within a homogeneous area. This model has been successfully applied in Brazil [38]. This deterministic model operates continuously over time and considers a daily time step. It employs a lumped approach at the watershed scale and adopts a conceptual framework incorporating linear transfer functions, considering the direct runoff, soil moisture depletion, unsaturated zone dynamics, groundwater recharge, and three linear reservoirs representing the surface, soil, and aquifer retention characteristics (Figure 5).
As shown in Figure 5, a fraction of the precipitation (P in mm) is conveyed as direct runoff (DR in mm) using Equation (3). This DR is routed through a linear reservoir reaching the basin outlet as the routed direct runoff (RDR in mm) using Equation (4).
where IA is the initial abstraction (mm), SAT is the soil saturation capacity (mm), RSOIL is the level of the soil reservoir (mm), RSURF is the level of the reservoir surface (mm), and KDR is the direct runoff recession constant (d−1).
The remaining water depth (P − DR) is subject to depletion at the potential evapotranspiration rate (PE in mm). The excess water (P − DR − PE) infiltrates into a linear reservoir that represents the upper soil horizon (unsaturated zone). Moisture is lost from this zone at an evapotranspiration rate (ER in mm) proportional to the moisture content (MC in %, shown in Equation (5)) and PE. The output from the unsaturated zone reservoir corresponds to the recharge (REC in mm) of the groundwater reservoir. If RSOIL exceeds the field capacity (FC in mm), REC occurs following Equation (6).
where CREC (%) is the recharge coefficient, a parameter related to the movement of water in the unsaturated soil zone, the water transferred into the groundwater reservoir being regulated by this parameter. The output of the groundwater reservoir is the base flow component (BF in mm) shown in Equation (7).
where RGR is the level of the groundwater reservoir (mm) and KBF is the base flow recession constant (d−1). The runoff (RO, in m3s−1) is obtained by Equation (8).
where A is the drainage area in km2. Following the above procedure, the levels in each reservoir are continuously updated for each simulation day. This calculation applies to the headwater basins. To calculate the discharge for the downstream basins, an additional method is employed for the routed upstream discharge (RUD in m3s−1), calculated by the routing model [39], described in Equation (9).
where RUD is the routed upstream discharge (m3s−1), K is the parameter to represent the time release is delayed (d), and X is the parameter referring to the reduction in the release peak in the stream. Index i is the value at a time interval and i−1 is a previous interval value. The downstream discharge (UD in m3s−1) is the sum of RO and RUD. To ensure the calculation stability, the channel is divided into sections to K fits within the limits shown in Equation (10).
The hydrological model calibration was performed using data from October 2011 to September 2019 (8 hydrological years) for the sub-basins. The choice of this period aims to cross-reference the observed daily discharge data available with the precipitation and evapotranspiration data in the watersheds. Unlike the traditional approach, no specific period was selected for model validation, as suggested by [40], who evaluated the performance of two conceptual hydrological models in 463 watersheds using 50 different data-splitting schemes. They demonstrated that it is more robust to use the complete available dataset for calibration and skip model validation.
The parameters were optimized using the minimize function from the scipy.optimize library [41], which provides a unified interface for finding the local minima of non-linear optimization problems. Within a trust region, a local model of the objective function is built based on first- and second-derivative information. It approximates the best point until reaching a local minimum of the original objective function. The parameters varied for SAT [100, 2000], FC [30, 50], IA [2.5, 5], CREC [0, 20], KDR [0.2, 5], KBF [30, 180], K [1, 10], and X [0.25, 0.35].
Three criteria, namely the KGE (Kling–Gupta Efficiency), NSE (Nash–Sutcliffe Efficiency), and Log-NSE, were used to support this selection. Also, the R2 (coefficient of determination) and PBIAS (percent bias) were analyzed to enrich the results.
4. Results
The simulation data from the climate models were extracted and analyzed. The historical scenarios from climate models span from 1980 to 2013. Figure 6 shows the comparison of the accumulated precipitation for the hydrological year with different climate models, with a focus on the observed data.
The multicriteria analysis was applied to the 38 datasets on climate models (19 bias correction and 19 row data). Table 3 shows the ranking. The model that best represents the CWPS region is GFDL-CM4 [42,43].
Given the comparison with the past, the time series composition of the precipitation in the study area ranged from January 1961 to July 2020 for the observed data. From August 2020 to December 2100, two scenarios, SSP2-4.5 and SSP5-8.5, from the GFDL-CM4 model are performed. Figure 7 displays the precipitation time series to hydrological year.
There is an upward trend in the frequency of dry hydrological years, with 2 extremely dry years observed in 1968/69 (984.6 mm) and 2013/14 (1009.8 mm) within a span of 58 years. This trend progresses to five such events in an 81-year period projected in the SSP 245 scenario, occurring in 2040/41, 2048/49, 2057/58, 2071/72, and 2073/74. In the SSP 585 scenario, there are nine such events in an 81-year period, happening in 2036/37, 2045/46, 2059/60, 2079/80, 2081/82, the biennium 2084/85/86, 2089/90, and 2099/100.
Figure 8a shows a downward trend in the average monthly accumulated precipitation in the projected scenarios for the last four months of the dry season, with a more pronounced change for September. The observed data indicate an average of 75.6 mm, compared to 41.3 mm in the SSP2-4.5 scenario and 33.2 mm in the SSP5-8.5 scenario.
Figure 8b shows a small variation in the wet semester, but a trend of less precipitation in the dry period, with an average of 350.4 mm accumulated between the months of April and September in the period observed, compared to 269.2 mm and 268 mm accumulated in the dry semester for the projected scenarios, SSP2-4.5 and SPP5-8.5, respectively. In other words, there was a reduction of approximately 23% in precipitation during the dry period. The Standardized Precipitation Index (SPI) of the 6-month moving average precipitation (SPI6) is presented in Figure 9, calculated according to [44].
Figure 10 presents the Drought Magnitude (DM) exceedance curve for both the observed data and simulated scenarios. Dry events in the study area will tend to have a higher frequency, increasing from about 30% in the analysis of the observed data to 40% and 50% in the scenarios SSP2-4.5 and SSP5-8.5. In addition, the magnitude of drought, already challenging in the current CWPS configuration, was at 29.01 in April 2015, and it could reach around 40 in both scenarios.
Table 4 shows the performance indicators for each objective function used in the calibration of the hydrological model for the CWPS basins. The best results were from indicators that used their own equations as objective functions to calibrate the model parameters. However, the highest values were obtained for the KGE objective function, followed by Log-NSE in all basins. The correlation coefficients (R2) between the observed and calculated series were higher for Log-NSE. The smallest deviations (PBIAS) occurred for the KGE objective function, except for the ATI and ATA basins.
The Log-NSE objective functions allowed a better adjustment of the minimum flows in the basins without regularization of the reservoirs (VAL, BUE, and ATI). In these basins, flows with a probability of non-exceedance greater than the median are closer to the observed flows, as shown in Figure 11.
The runoff estimated by the hydrological model based on the precipitation projections of the GFDL-CM4 model for the two climate scenarios (SSP2-4.5 and SSP5-8.5) are shown in Table 5. The larger angular coefficients of the regression equations of the SSP2-4.5 scenario indicate a greater ability to respond to precipitation. Higher intercept values indicate a greater contribution of the base flow and greater water availability in this scenario. The regression coefficients of the estimates were greater than 0.5 for six basins, indicating a strong correlation between variables. The estimated runoffs for the SSP5-8.5 scenario were lower for the 25%, 50%, and 75% quartiers in all basins. This indicates lower water availability in the SSP5-8.5 scenario, reflecting an average reduction of 16.9%, 11.8%, and 9.2% in flows corresponding to quartiers Q25, Q50, and Q75. The largest impact on minimum flows (Q25) was recorded in the VAL basin, with a reduction of 19.6%. The CAC and PAI basins showed a higher reduction in the median flow (13.4%), and the BUE basin showed the largest reduction in Q75 (12.5%).
Figure 12 shows the frequency of non-exceedance of the ratio between the precipitation and runoff (P/Q) of the average of seven consecutive days. The relationship represents the degree to which precipitation deficits influence runoff over the continuous seven-day period. Very low ratio values (P/Q = 0.2) tend to occur on average during 10.8% and 11.6% of the simulation period (2020–2100) in the scenarios SSP2-4.5 and SSP5-8.5. In this case, the JPS and CAC basins showed greater sensitivity to the precipitation deficits in the SSP2-4.5 scenario, as well as the JPS, CAC, PAI, and ATA basins for SSP5-8.5. Less pronounced deficits (P/Q = 0.5) are more frequent, occurring on average 20.9% (SSP2-4.5) and 21.3% (SSP5-8.5) of the time. The JPS, CAC, PAI, and ATA basins have greater sensitivity to this level of deficit in both scenarios.
5. Discussion
Daily flow is influenced by variations in soil moisture, infiltration, and precipitation. The physical water characteristics of the soil influence infiltration, water storage, and aquifer recharge. These variables were adjusted in the calibration of the hydrological model by parameters such as the direct flow recession constant (KDR), the base flow recession constant (KBF), and the recharge coefficient (CREC). The intra-annual distribution of precipitation is an important condition for the performance of the hydrological model.
We selected 10 indicators for a representative climate model, 4 for the accumulated precipitation of the time series (day, month, year, hydrological year), 2 for the daily and monthly seasonality, and 4 for the daily and monthly extremes in the wet and dry periods. Of the 19 models surveyed, GFDL-CM4 presented the best performance for the study area in terms of the modified the Kling–Gupta efficiency coefficient (KGE′). According to [43], the model appears to produce a reasonable multidecadal modulation of the El Niño–Southern Oscillation due to a slight weakening of the annual cycle, and relatively small biases in the seasonal spatial patterns of top-of-atmosphere fluxes, surface temperature, and precipitation. Despite recommendations for bias correction in hydroclimate simulations [45], the multicriteria analysis evaluation indicates that row data fit better than bias correction using the quantile delta mapping method.
GFDL-CM4 without bias correction better represents the time series of annual and hydrological years, as well as the maximum monthly precipitation, than the other models. In the CWPS basins, the model adequately represents the precipitation during the wet period (October to March) and tends to underestimate it by 23.3% during the dry period (April to September). The SPI and DM indicate a higher projected drought frequency, especially for scenario SSP5-8.5. These results are consistent with the study by [46], which identified the GFDL model for the Piracicaba River basin using the tool developed by [47].
Regarding the SPI6 distribution, the observed time series revealed a disparity between severe floods and severe droughts, with four instances of the former and seven instances of the latter. This pattern was the same obtained by [48] in the Xinyang region of China in 1961–2015. However, under the SSP2-4.5 scenario, there is a notable escalation in the frequency of extreme events, reaching eight severe floods and 38 severe droughts. Similarly, under the SSP5-8.5 scenario, the frequency of extreme events experiences an increase to 10 severe floods and 42 severe droughts.
The choice of performance criteria depends on the purpose of the model [49]. The performance indicators indicated a satisfactory adjustment of the hydrological model calibrated to the time series observed with objective functions KGE and log-NSE. The projected flows in the basins without a reservoir were estimated using parameters calibrated with an objective function, Log-NSE, which best adjusted the minimum flows. The basins with reservoirs were simulated with parameters calibrated with the KGE.
The simulated runoffs were strongly correlated with the projected precipitation for both climate scenarios. The SSP5-8.5 scenario indicates the lowest water availability in all basins, and VAL and ATI are the ones that show the greatest reduction in minimum flows. Considering the frequency of the average of seven consecutive days of the P/Q ratio, the JPS, CAC, PAI, and ATA basins show faster reactions in runoff to the precipitation deficit in both climate scenarios. For a more pronounced deficit (P/Q = 0.2), the VAL basin showed greater sensitivity in the SSP2-4.5 scenario. According to [50], basins with low P/Q values are subject to longer streamflow droughts, possibly due to lower subsurface storage.
In systems with high water demand, such as the CWPS, a deficit of seven consecutive days is enough to cause operational disruptions and supply conflicts. The expected moderate (P/Q = 0.5) and severe (P/Q = 0.2) deficits are high.
Regarding the reliability of the data produced by this study, inherent uncertainties are associated with climate models [51], which may be further amplified in hydrological modeling [52]. Despite these challenges, we have ensured that our data sources are reliable, and the hydrological model has undergone meticulous calibration. Additionally, our process has been conducted with transparency and is replicable. Therefore, we believe this to be the best available data for addressing hydroclimatic change in the CWPS.
6. Conclusions
This study provides a comprehensive analysis of the hydroclimate changes impacting the CWPS, a critical water resource for 14 million people in Brazil. By integrating extensive climate model data and field observations, our research has quantified significant trends in key hydrological variables (precipitation, evapotranspiration, and runoff), offering a detailed understanding of the challenges posed by climate change to this vital water production system.
Employing the GFDL-CM4 climate model, the most suitable for the CWPS area, we have projected both current and future scenarios under SSP2-4.5 and SSP5-8.5. Our findings indicate a notable increase in the frequency of dry hydrological years and severe drought events, as evidenced by historical data and future projections.
The analyses of the Standard Precipitation Index (SPI) indicate an increase in the occurrence of severe droughts by 442.9% for the SSP2-4.5 scenario, and 500% for the SSP5-8.5 scenario, both compared to the scenario observed. The Drought Magnitude (DM), numerically equivalent to the duration of the drought, increased 37.9% from the observed to the future scenarios.
The study also reveals a significant reduction in runoff in all the CWPS basins, causing a substantial decrease in minimum flows (Q25%) of 16.9%, medium flows (Q50%) of 11.8%, and high flows (Q75%) of 9.2% for the SSP5-8.5 scenario. Severe hydrological deficits (P/Q = 0.2) tend to occur, on average, in 10.8% and 11.6% of the scenarios SSP2-4.5 and SSP5-8.5, respectively. These findings highlight the urgency of adaptive water management strategies to address the increased frequency and magnitude of droughts and the associated challenges in water availability.
Our research contributes to understanding the hydroclimate impacts on a crucial region for Brazil’s water security. The insights gained are invaluable for policymakers and stakeholders to formulate effective strategies for water resource management and climate change adaptation. As climate patterns continue to evolve, this study underscores the need for continuous monitoring and adaptive planning to safeguard water resources in the face of environmental uncertainties.
In conclusion, the research presented here not only advances our understanding of the hydroclimate dynamics affecting the CWPS, but also provides a foundation for future studies and policymaking aimed at ensuring sustainable water management in the face of evolving climate conditions in the MRSP and similar regions worldwide.
Author Contributions
Conceptualization, J.R.B.T. and A.V.M.J.; methodology, J.R.B.T. and A.V.M.J.; software, J.R.B.T.; validation, J.R.B.T. and A.V.M.J.; formal analysis, J.R.B.T. and A.V.M.J.; investigation, J.R.B.T. and A.V.M.J.; resources, J.R.B.T. and A.V.M.J.; data curation, J.R.B.T.; writing—original draft preparation, J.R.B.T. and A.V.M.J.; writing—review and editing, J.R.B.T. and A.V.M.J.; visualization, J.R.B.T. and A.V.M.J.; supervision, A.V.M.J.; funding acquisition, A.V.M.J. All authors have read and agreed to the published version of the manuscript.
Funding
This research received no external funding.
Institutional Review Board Statement
Not applicable.
Informed Consent Statement
Not applicable.
Data Availability Statement
The data supporting this study are openly available in HydroShare at https://www.hydroshare.org/resource/c816015d97e74be5adb984ce65f6d8e4/ (accessed on 25 October 2023).
Acknowledgments
We extend our gratitude to our colleagues dedicated to researching and advancing scientific understanding and adaptation strategies in response to hydroclimatic changes.
Conflicts of Interest
The authors declare no conflict of interest.
References
- Warziniack, T.; Arabi, M.; Brown, T.C.; Froemke, P.; Ghosh, R.; Rasmussen, S.; Swartzentruber, R. Projections of Freshwater Use in the United States Under Climate Change. Earths Future 2022, 10, e2021EF002222. [Google Scholar] [CrossRef]
- Domingues, L.M.; de Abreu, R.C.; da Rocha, H.R. Hydrologic Impact of Climate Change in the Jaguari River in the Cantareira Reservoir System. Water 2022, 14, 1286. [Google Scholar] [CrossRef]
- Zuffo, A.C.; Duarte, S.N.; Jacomazzi, M.A.; Cucio, M.S.; Galbetti, M.V. The Cantareira System, the Largest South American Water Supply System: Management History, Water Crisis, and Learning. Hydrology 2023, 10, 132. [Google Scholar] [CrossRef]
- Domingues, L.M.; da Rocha, H.R. Serial Droughts and Loss of Hydrologic Resilience in a Subtropical Basin: The Case of Water Inflow into the Cantareira Reservoir System in Brazil during 2013–2021. J. Hydrol. Reg. Stud. 2022, 44, 101235. [Google Scholar] [CrossRef]
- Santana, M.L.T.; de Faria, V.L.; Barbosa, S.M.; Serafim, M.E.; Uezu, A.; Silva, B.M.; Avanzi, J.C. Impacts of Land Use Changes on Soil Functions and Water Security: Insights from a Three-Year-Long Study in the Cantareira System, Southeast of Brazil. Sustainability 2023, 15, 13395. [Google Scholar] [CrossRef]
- Konapala, G.; Mishra, A.K.; Wada, Y.; Mann, M.E. Climate Change Will Affect Global Water Availability through Compounding Changes in Seasonal Precipitation and Evaporation. Nat. Commun. 2020, 11, 3044. [Google Scholar] [CrossRef] [PubMed]
- Scott, M.; Lennon, M.; Tubridy, F.; Marchman, P.; Siders, A.R.; Main, K.L.; Herrmann, V.; Butler, D.; Frank, K.; Bosomworth, K.; et al. Climate Disruption and Planning: Resistance or Retreat? Plan. Theory Pract. 2020, 21, 125–154. [Google Scholar] [CrossRef]
- Jakob, M. Globalization and Climate Change: State of Knowledge, Emerging Issues, and Policy Implications. WIREs Clim. Chang. 2022, 13, e771. [Google Scholar] [CrossRef]
- Tercini, J.R.B.; Perez, R.F.; Schardong, A.; Garcia, J.I.B. Potential Impact of Climate Change Analysis on the Management of Water Resources under Stressed Quantity and Quality Scenarios. Water 2021, 13, 2984. [Google Scholar] [CrossRef]
- Leveque, B.; Burnet, J.-B.; Dorner, S.; Bichai, F. Impact of Climate Change on the Vulnerability of Drinking Water Intakes in a Northern Region. Sustain. Cities Soc. 2021, 66, 102656. [Google Scholar] [CrossRef]
- Bejagam, V.; Keesara, V.R.; Sridhar, V. Impacts of Climate Change on Water Provisional Services in Tungabhadra Basin Using InVEST Model. River Res. Appl. 2022, 38, 94–106. [Google Scholar] [CrossRef]
- Maliva, R.G.; Manahan, W.S.; Missimer, T.M. Climate Change and Water Supply: Governance and Adaptation Planning in Florida. Water Policy 2021, 23, 521–536. [Google Scholar] [CrossRef]
- Braga, B.; Kelman, J. Facing the Challenge of Extreme Climate: The Case of Metropolitan Sao Paulo. Int. J. Water Resour. Dev. 2020, 36, 278–291. [Google Scholar] [CrossRef]
- de Freitas, G.N. São Paulo Drought: Trends in Streamflow and Their Relationship to Climate and Human-Induced Change in Cantareira Watershed, Southeast Brazil. Hydrol. Res. 2020, 51, 750–767. [Google Scholar] [CrossRef]
- Chiquito Gesualdo, G.; Sone, J.S.; Galvão, C.d.O.; Martins, E.S.; Montenegro, S.M.G.L.; Tomasella, J.; Mendiondo, E.M. Unveiling Water Security in Brazil: Current Challenges and Future Perspectives. Hydrol. Sci. J. 2021, 66, 759–768. [Google Scholar] [CrossRef]
- Tzanakakis, V.; Angelakis, A.; Paranychianakis, N.; Dialynas, Y.; Tchobanoglous, G. Challenges and Opportunities for Sustainable Management of Water Resources in the Island of Crete, Greece. Water 2020, 12, 1538. [Google Scholar] [CrossRef]
- Kour, R.; Patel, N.; Krishna, A.P. Climate and Hydrological Models to Assess the Impact of Climate Change on Hydrological Regime: A Review. Arab. J. Geosci. 2016, 9, 544. [Google Scholar] [CrossRef]
- Hakala, K.; Addor, N.; Teutschbein, C.; Vis, M.; Dakhlaoui, H.; Seibert, J. Hydrological Modeling of Climate Change Impacts. In Encyclopedia of Water; Wiley: Hoboken, NJ, USA, 2019; pp. 1–20. [Google Scholar]
- Méllo Júnior, A.V.; Olivos, L.M.O.; Billerbeck, C.; Marcellini, S.S.; Vichete, W.D.; Pasetti, D.M.; da Silva, L.M.; Soares, G.A.S.; Tercini, J.R.B. Rainfall Runoff Balance Enhanced Model Applied to Tropical Hydrology. Water 2022, 14, 1958. [Google Scholar] [CrossRef]
- Xavier, A.C.; Scanlon, B.R.; King, C.W.; Alves, A.I. New Improved Brazilian Daily Weather Gridded Data (1961–2020). Int. J. Climatol. 2022, 42, 8390–8404. [Google Scholar] [CrossRef]
- Lamptey, B.; Kolli, R.K.; Amo-Boateng, M. Editorial: Climate Change Information for Regional Impact and Risk Assessment. Front. Environ. Sci. 2023, 11, 1–2. [Google Scholar] [CrossRef]
- Maneechot, L.; Wong, Y.J.; Try, S.; Shimizu, Y.; Bharambe, K.P.; Hanittinan, P.; Ram-Indra, T.; Usman, M. Evaluating the Necessity of Post-Processing Techniques on D4PDF Data for Extreme Climate Assessment. Environ. Sci. Pollut. Res. 2023, 30, 102531–102546. [Google Scholar] [CrossRef] [PubMed]
- Usman, M.; Ndehedehe, C.E.; Farah, H.; Ahmad, B.; Wong, Y.; Adeyeri, O.E. Application of a Conceptual Hydrological Model for Streamflow Prediction Using Multi-Source Precipitation Products in a Semi-Arid River Basin. Water 2022, 14, 1260. [Google Scholar] [CrossRef]
- Hawker, L.; Uhe, P.; Paulo, L.; Sosa, J.; Savage, J.; Sampson, C.; Neal, J. A 30 m Global Map of Elevation with Forests and Buildings Removed. Environ. Res. Lett. 2022, 17, 024016. [Google Scholar] [CrossRef]
- Tesfa, T.K.; Tarboton, D.G.; Watson, D.W.; Schreuders, K.A.T.; Baker, M.E.; Wallace, R.M. Extraction of Hydrological Proximity Measures from DEMs Using Parallel Processing. Environ. Model. Softw. 2011, 26, 1696–1709. [Google Scholar] [CrossRef]
- Yildirim, A.A.; Watson, D.; Tarboton, D.; Wallace, R.M. A Virtual Tile Approach to Raster-Based Calculations of Large Digital Elevation Models in a Shared-Memory System. Comput. Geosci. 2015, 82, 78–88. [Google Scholar] [CrossRef]
- Ballarin, A.S.; Sone, J.S.; Gesualdo, G.C.; Schwamback, D.; Reis, A.; Almagro, A.; Wendland, E.C. CLIMBra—Climate Change Dataset for Brazil. Sci. Data 2023, 10, 47. [Google Scholar] [CrossRef]
- Cannon, A.J.; Piani, C.; Sippel, S. Bias Correction of Climate Model Output for Impact Models. In Climate Extremes and Their Implications for Impact and Risk Assessment; Elsevier: Amsterdam, The Netherlands, 2020; pp. 77–104. [Google Scholar]
- Tercini, J.R.B.; Méllo Júnior, A.V. Dimensional Database to Support Water Resources Decisions. Braz. J. Dev. 2022, 8, 77190–77202. [Google Scholar] [CrossRef]
- Billerbeck, C.; da Silva, L.M.; Marcellini, S.S.; Méllo Junior, A. Multi-Criteria Decision Framework to Evaluate Bias Corrected Climate Change Projections in the Piracicaba River Basin. Rev. Bras. Meteorol. 2021, 36, 339–349. [Google Scholar] [CrossRef]
- Gupta, H.V.; Kling, H.; Yilmaz, K.K.; Martinez, G.F. Decomposition of the Mean Squared Error and NSE Performance Criteria: Implications for Improving Hydrological Modelling. J. Hydrol. 2009, 377, 80–91. [Google Scholar] [CrossRef]
- Kling, H.; Fuchs, M.; Paulin, M. Runoff Conditions in the Upper Danube Basin under an Ensemble of Climate Change Scenarios. J. Hydrol. 2012, 424–425, 264–277. [Google Scholar] [CrossRef]
- Bozzini, P.L.; Méllo Júnior, A.V. Atmospheric Model Precipitation Forecast Analysis to Support Reservoir Systems Operation. Rev. Bras. Meteorol. 2020, 35, 99–109. [Google Scholar] [CrossRef]
- Irving, K.; Kuemmerlen, M.; Kiesel, J.; Kakouei, K.; Domisch, S.; Jähnig, S.C. A High-Resolution Streamflow and Hydrological Metrics Dataset for Ecological Modeling Using a Regression Model. Sci. Data 2018, 5, 180224. [Google Scholar] [CrossRef] [PubMed]
- Vremec, M.; Collenteur, R. PyEt—A Python Package to Estimate Potential and Reference Evapotranspiration. In Proceedings of the EGU21 Copernicus Meetings, Online, 19–30 April 2021. [Google Scholar] [CrossRef]
- Jensen, M.E.; Allen, R.G. Evaporation Evapotranspirationand Irrigation Water Requirements; American Society of Civil Engineers (ASCE): Reston, VA, USA, 2016; pp. 1–744. [Google Scholar] [CrossRef]
- Lopes, J.E.G.; Braga, B.P.F.; Conejo, J.G.L. SMAP—A Simplified Hydrological Model, Applied Modelling in Catchment Hydrology; Singh, V.P., Ed.; Water Resources Publications: Littleton, CO, USA, 1982. [Google Scholar]
- Raulino, J.B.S.; Silveira, C.S.; Lima Neto, I.E. Assessment of Climate Change Impacts on Hydrology and Water Quality of Large Semi-Arid Reservoirs in Brazil. Hydrol. Sci. J. 2021, 66, 1321–1336. [Google Scholar] [CrossRef]
- Collischonn, W.; Dornelles, F. Hidrologia Para Engenharias e Ciências Ambientais; ABRHidro, Ed.; Associação Brasileira de Recursos Hídricos: Porto Alegre, Brazil, 2021; Volume 1. [Google Scholar]
- Shen, H.; Tolson, B.A.; Mai, J. Time to Update the Split-Sample Approach in Hydrological Model Calibration. Water Resour. Res. 2022, 58, e2021WR031523. [Google Scholar] [CrossRef]
- Virtanen, P.; Gommers, R.; Oliphant, T.E.; Haberland, M.; Reddy, T.; Cournapeau, D.; Burovski, E.; Peterson, P.; Weckesser, W.; Bright, J.; et al. SciPy 1.0: Fundamental Algorithms for Scientific Computing in Python. Nat. Methods 2020, 17, 261–272. [Google Scholar] [CrossRef]
- Adcroft, A.; Anderson, W.; Balaji, V.; Blanton, C.; Bushuk, M.; Dufour, C.O.; Dunne, J.P.; Griffies, S.M.; Hallberg, R.; Harrison, M.J.; et al. The GFDL Global Ocean and Sea Ice Model OM4.0: Model Description and Simulation Features. J. Adv. Model Earth Syst. 2019, 11, 3167–3211. [Google Scholar] [CrossRef]
- Held, I.M.; Guo, H.; Adcroft, A.; Dunne, J.P.; Horowitz, L.W.; Krasting, J.; Shevliakova, E.; Winton, M.; Zhao, M.; Bushuk, M.; et al. Structure and Performance of GFDL’s CM4.0 Climate Model. J. Adv. Model Earth Syst. 2019, 11, 3691–3727. [Google Scholar] [CrossRef]
- Faro, G.T.C.; Garcia, J.I.B.; Oliveira, C.d.P.M.; Ramos, M.R.S. Application of Indices for Water Resource Systems Stress Assessment. Rev. Bras. Recur. Hidr. 2019, 24, 1–13. [Google Scholar] [CrossRef]
- Chen, J.; Arsenault, R.; Brissette, F.P.; Zhang, S. Climate Change Impact Studies: Should We Bias Correct Climate Model Outputs or Post-Process Impact Model Outputs? Water Resour. Res. 2021, 57, e2020WR028638. [Google Scholar] [CrossRef]
- Castro, E.L.H. Avaliação Dos Impactos Das Mudanças Climáticas e Das Mudanças No Uso Da Terra Na Bacia Do Rio Piracicaba, Utilizando Modelagem Hidrológica; Universidade de São Paulo: São Carlos, Brazil, 2022. [Google Scholar]
- Parding, K.M.; Dobler, A.; McSweeney, C.F.; Landgren, O.A.; Benestad, R.; Erlandsen, H.B.; Mezghani, A.; Gregow, H.; Räty, O.; Viktor, E.; et al. GCMeval—An Interactive Tool for Evaluation and Selection of Climate Model Ensembles. Clim. Serv. 2020, 18, 100167. [Google Scholar] [CrossRef]
- Gu, X.; Zhang, P.; Zhang, W.; Liu, Y.; Jiang, P.; Wang, S.; Lai, X.; Long, A. A Study of Drought and Flood Cycles in Xinyang, China, Using the Wavelet Transform and M-K Test. Atmosphere 2023, 14, 1196. [Google Scholar] [CrossRef]
- Cinkus, G.; Mazzilli, N.; Jourde, H.; Wunsch, A.; Liesch, T.; Ravbar, N.; Chen, Z.; Goldscheider, N. When Best Is the Enemy of Good—Critical Evaluation of Performance Criteria in Hydrological Models. Hydrol. Earth Syst. Sci. 2023, 27, 2397–2411. [Google Scholar] [CrossRef]
- Odongo, R.A.; De Moel, H.; Van Loon, A.F. Propagation from Meteorological to Hydrological Drought in the Horn of Africa Using Both Standardized and Threshold-Based Indices. Nat. Hazards Earth Syst. Sci. 2023, 23, 2365–2386. [Google Scholar] [CrossRef]
- Howland, M.F.; Dunbar, O.R.A.; Schneider, T. Parameter Uncertainty Quantification in an Idealized GCM With a Seasonal Cycle. J. Adv. Model. Earth Syst. 2022, 14, e2021MS002735. [Google Scholar] [CrossRef]
- Ávila, L.; Silveira, R.; Campos, A.; Rogiski, N.; Gonçalves, J.; Scortegagna, A.; Freita, C.; Aver, C.; Fan, F. Comparative Evaluation of Five Hydrological Models in a Large-Scale and Tropical River Basin. Water 2022, 14, 3013. [Google Scholar] [CrossRef]
Figure 1.
Location of the study area.
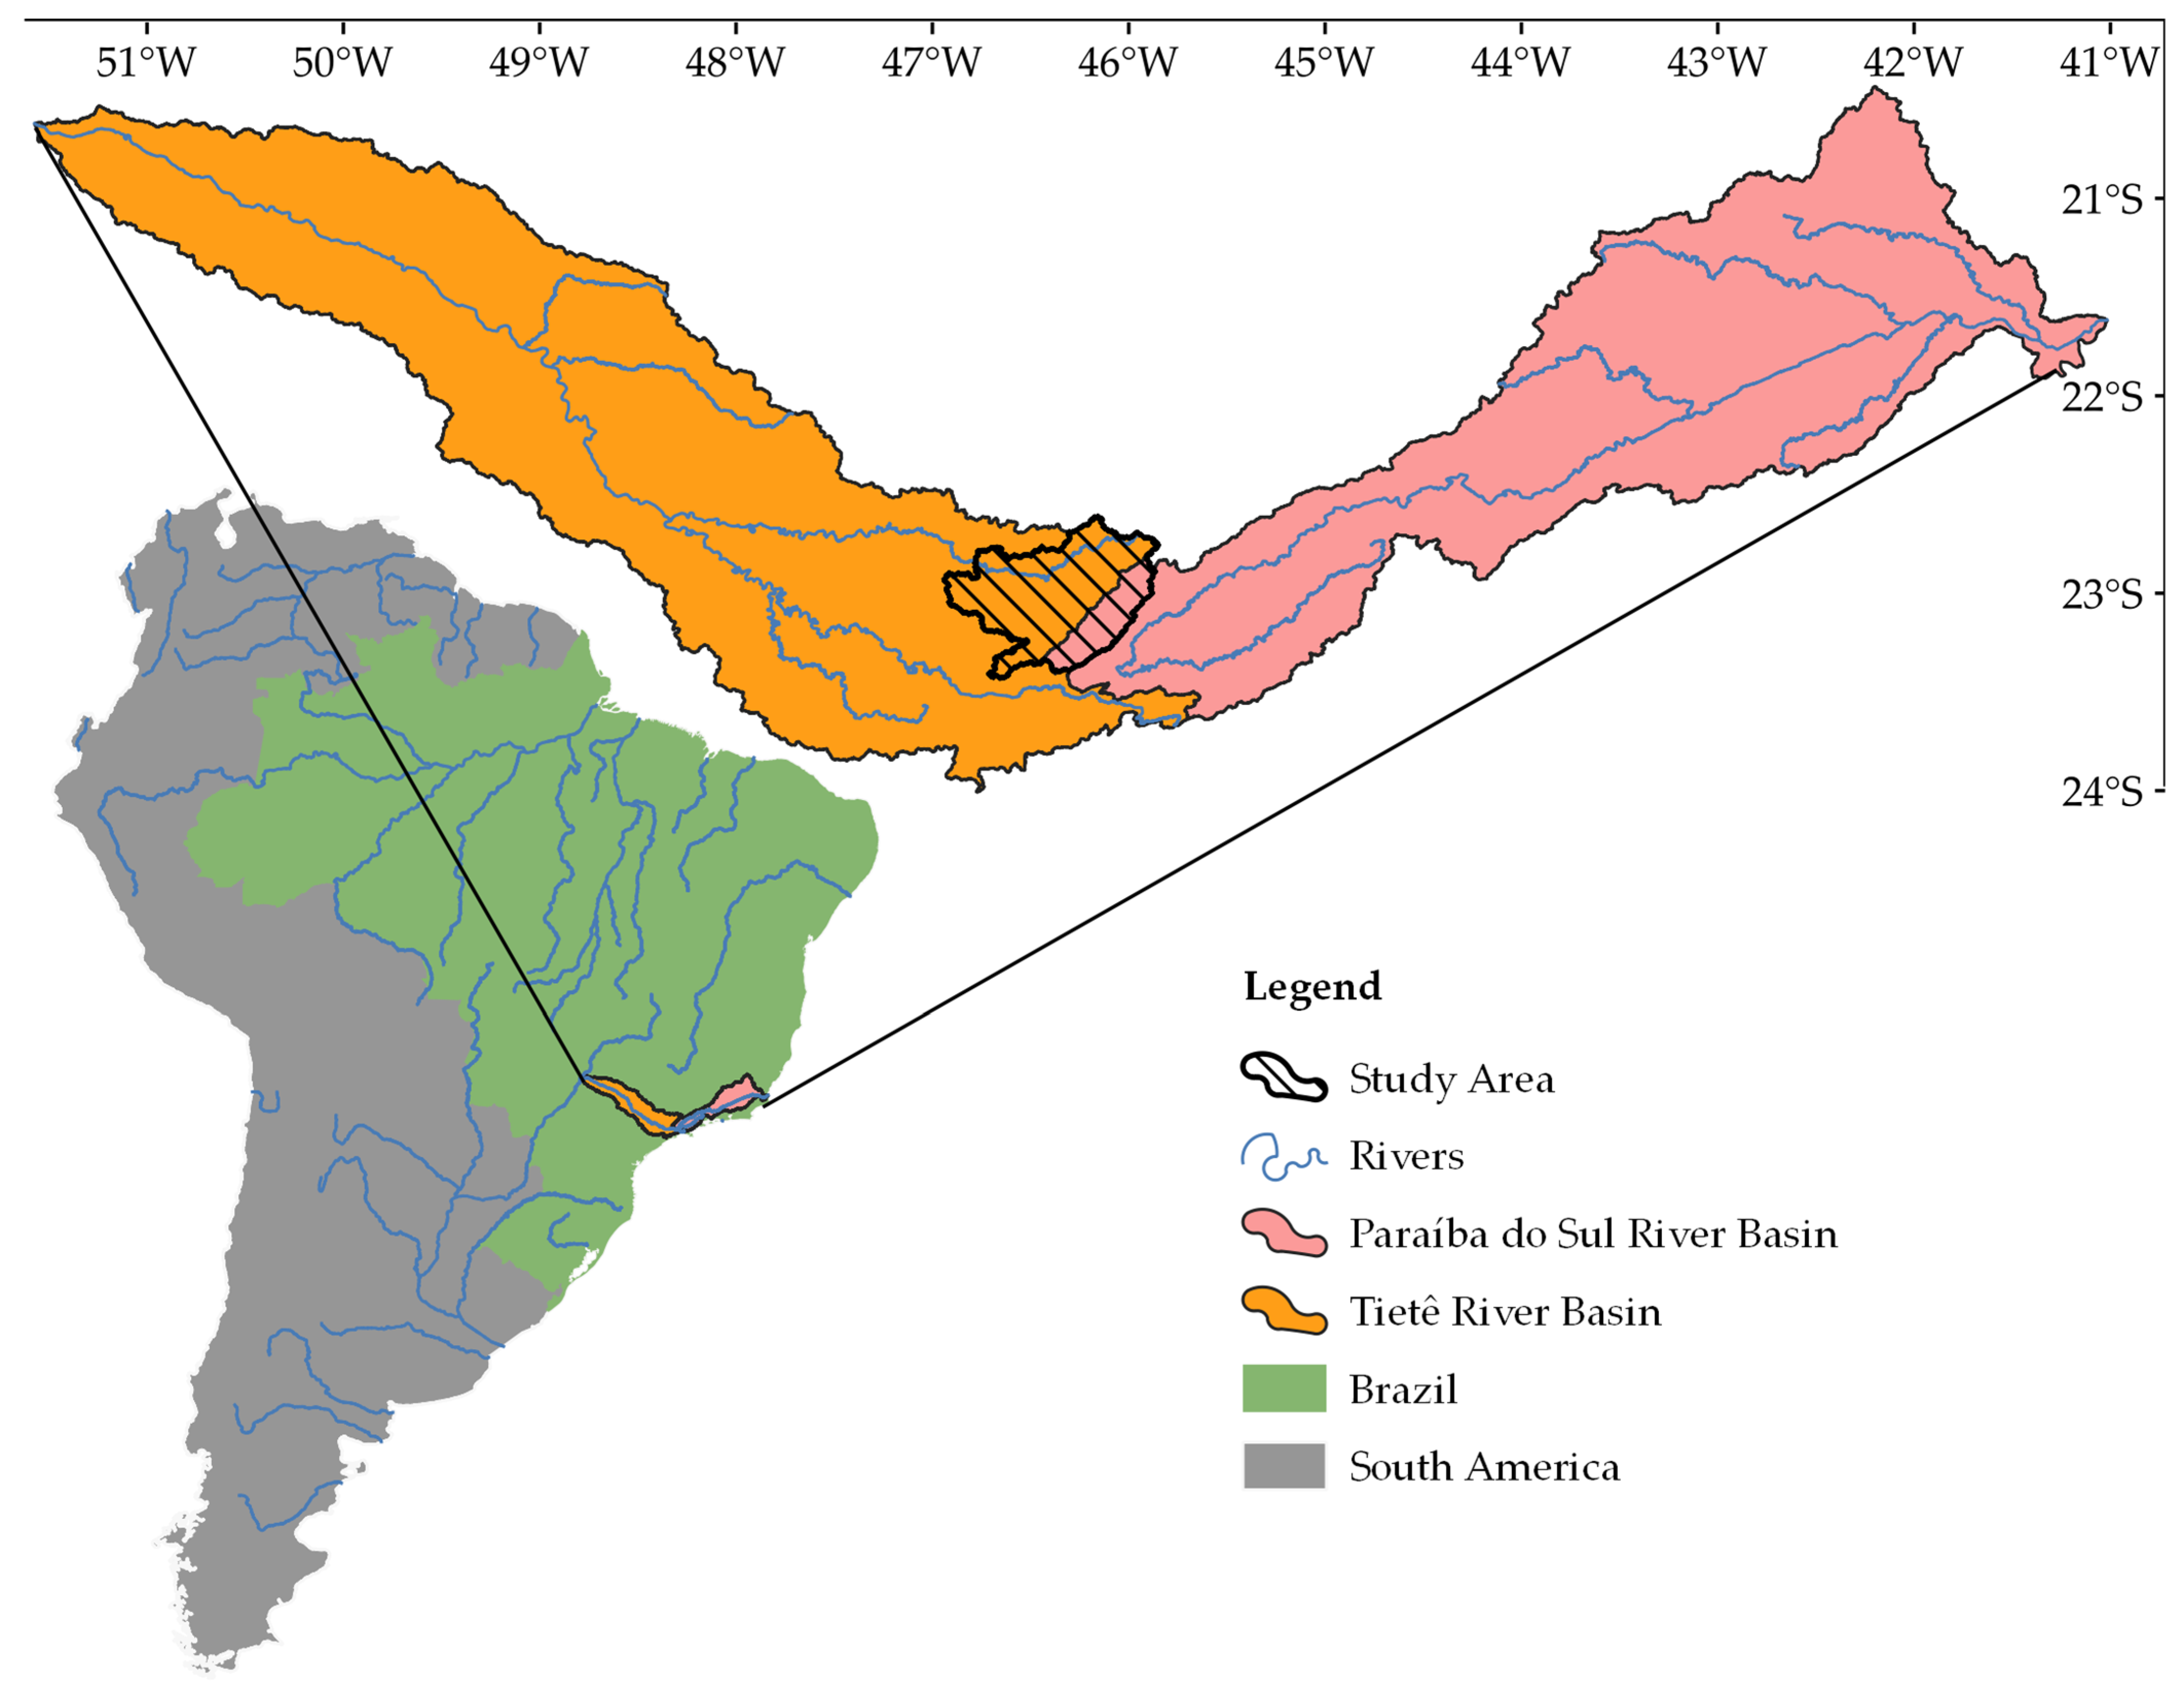
Figure 2.
Map of the study area.
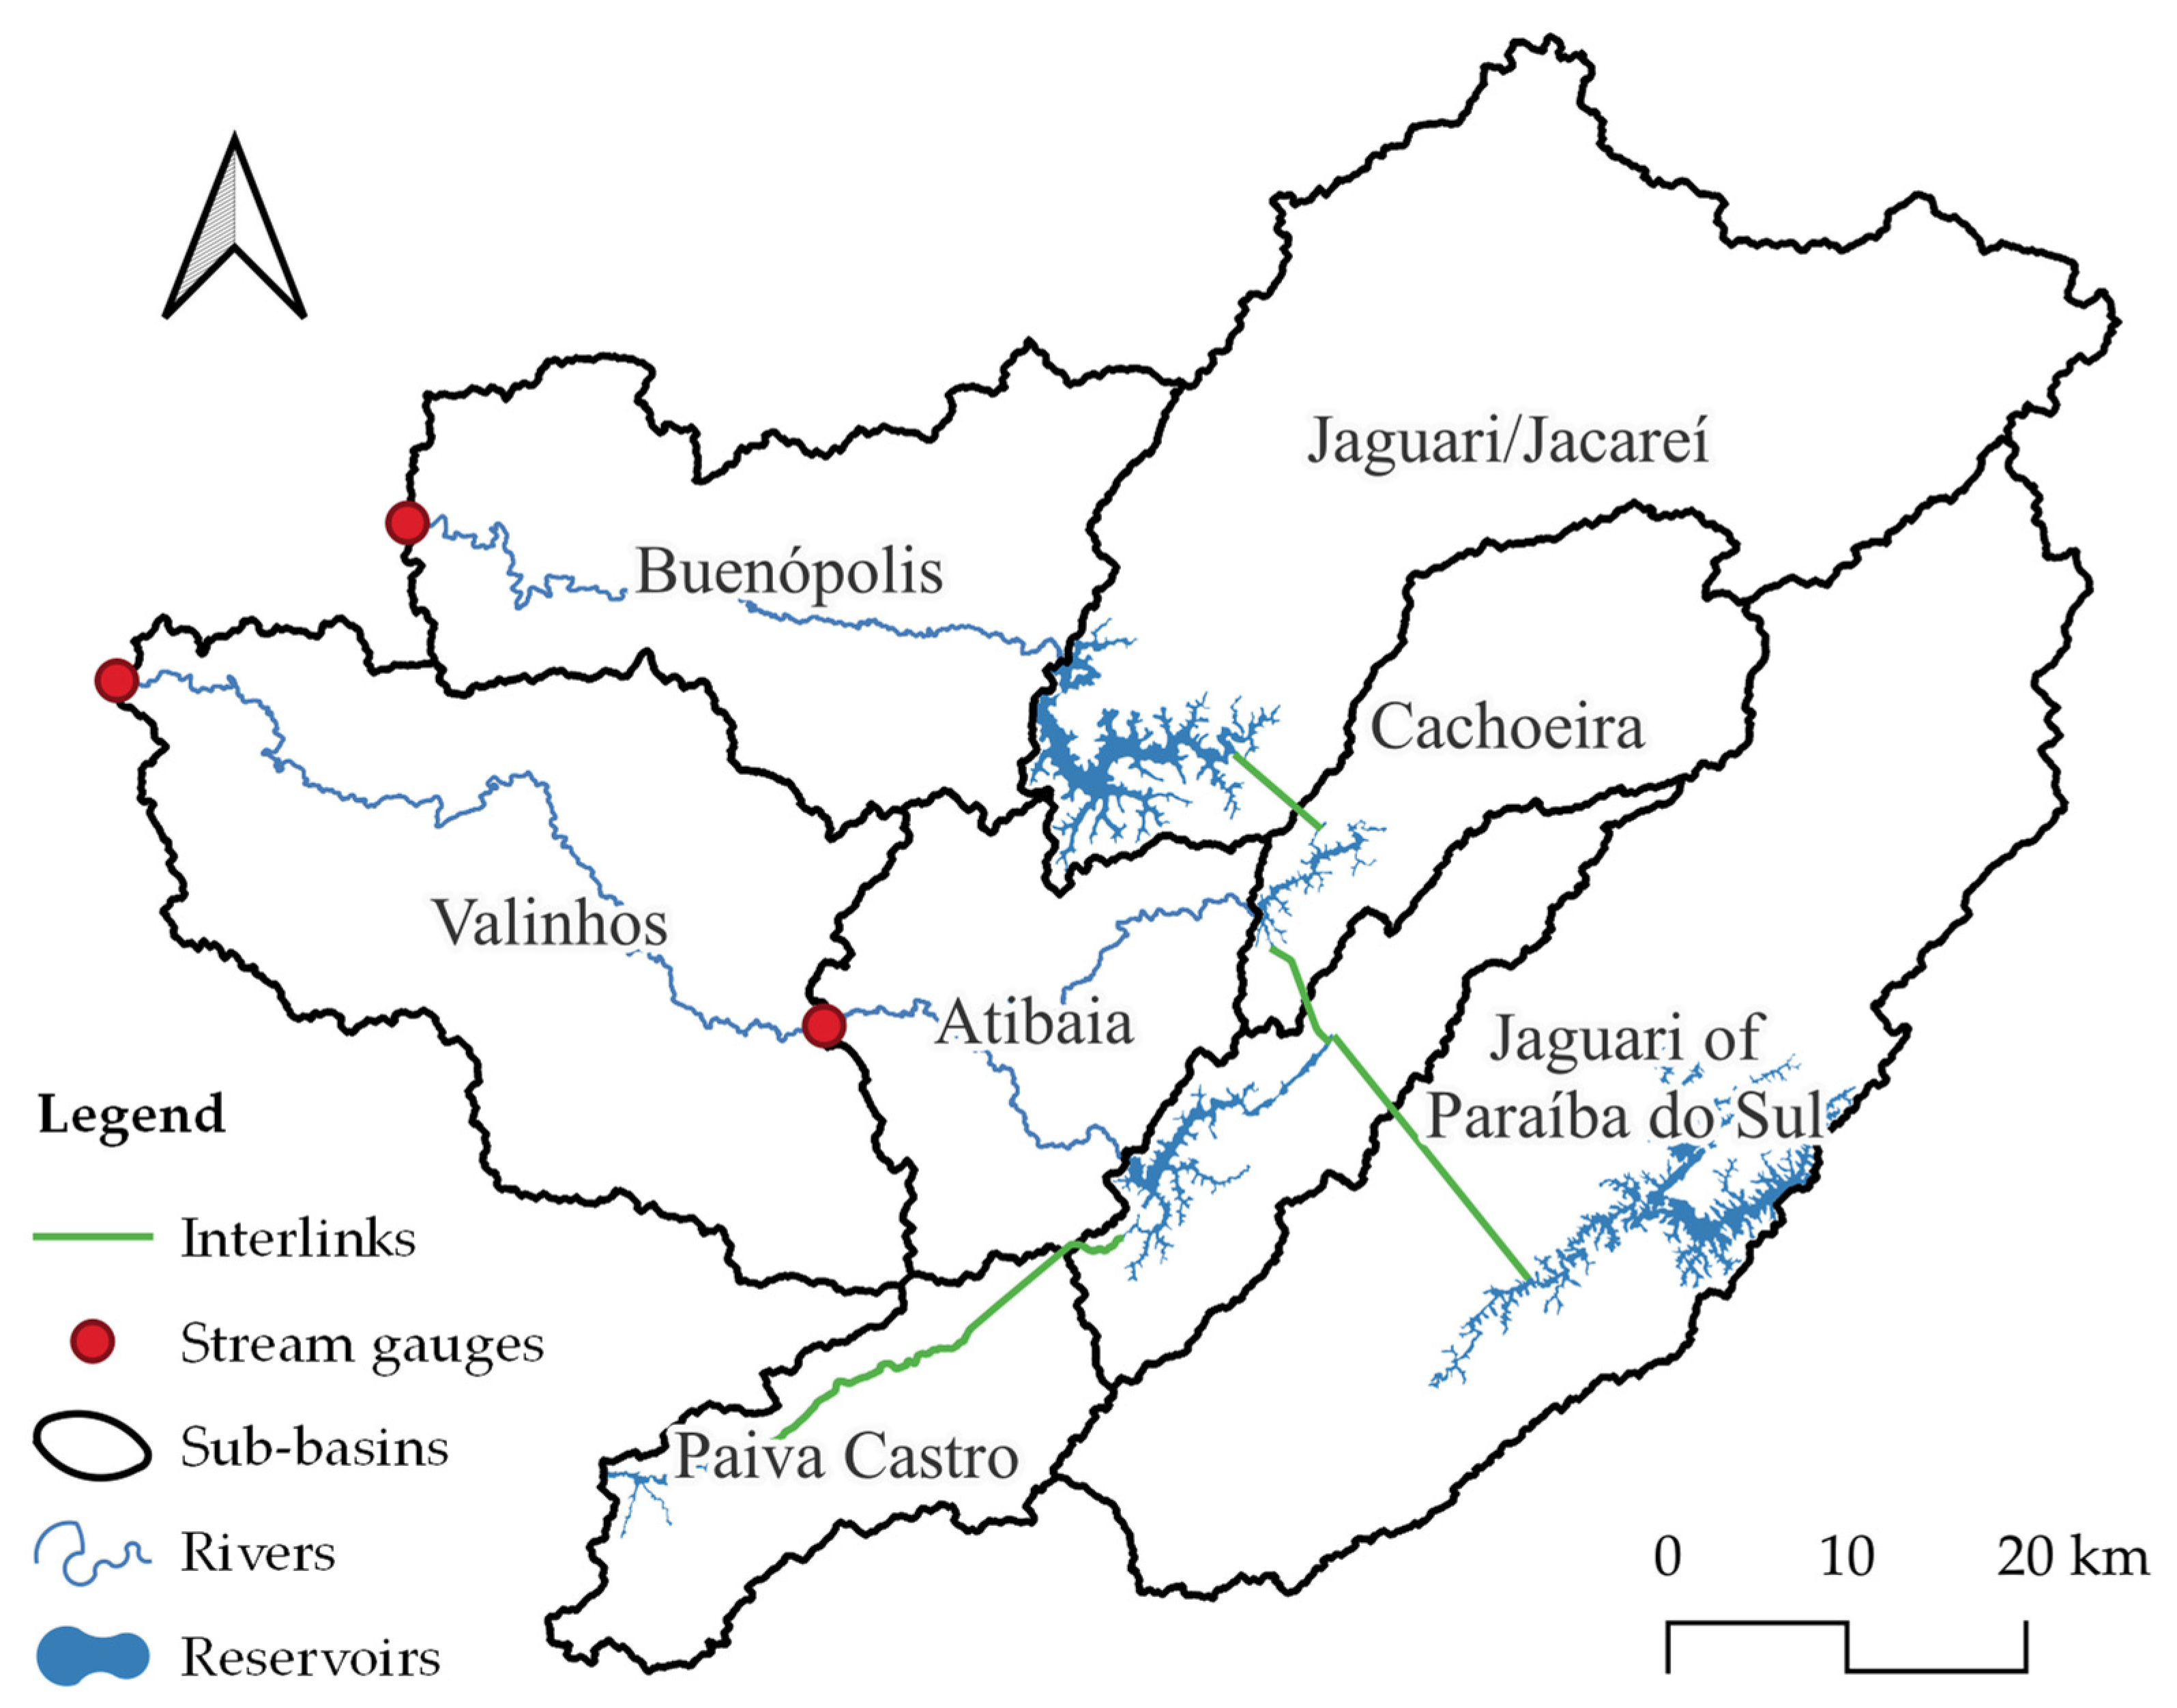
Figure 3.
Schematic model of the study area.
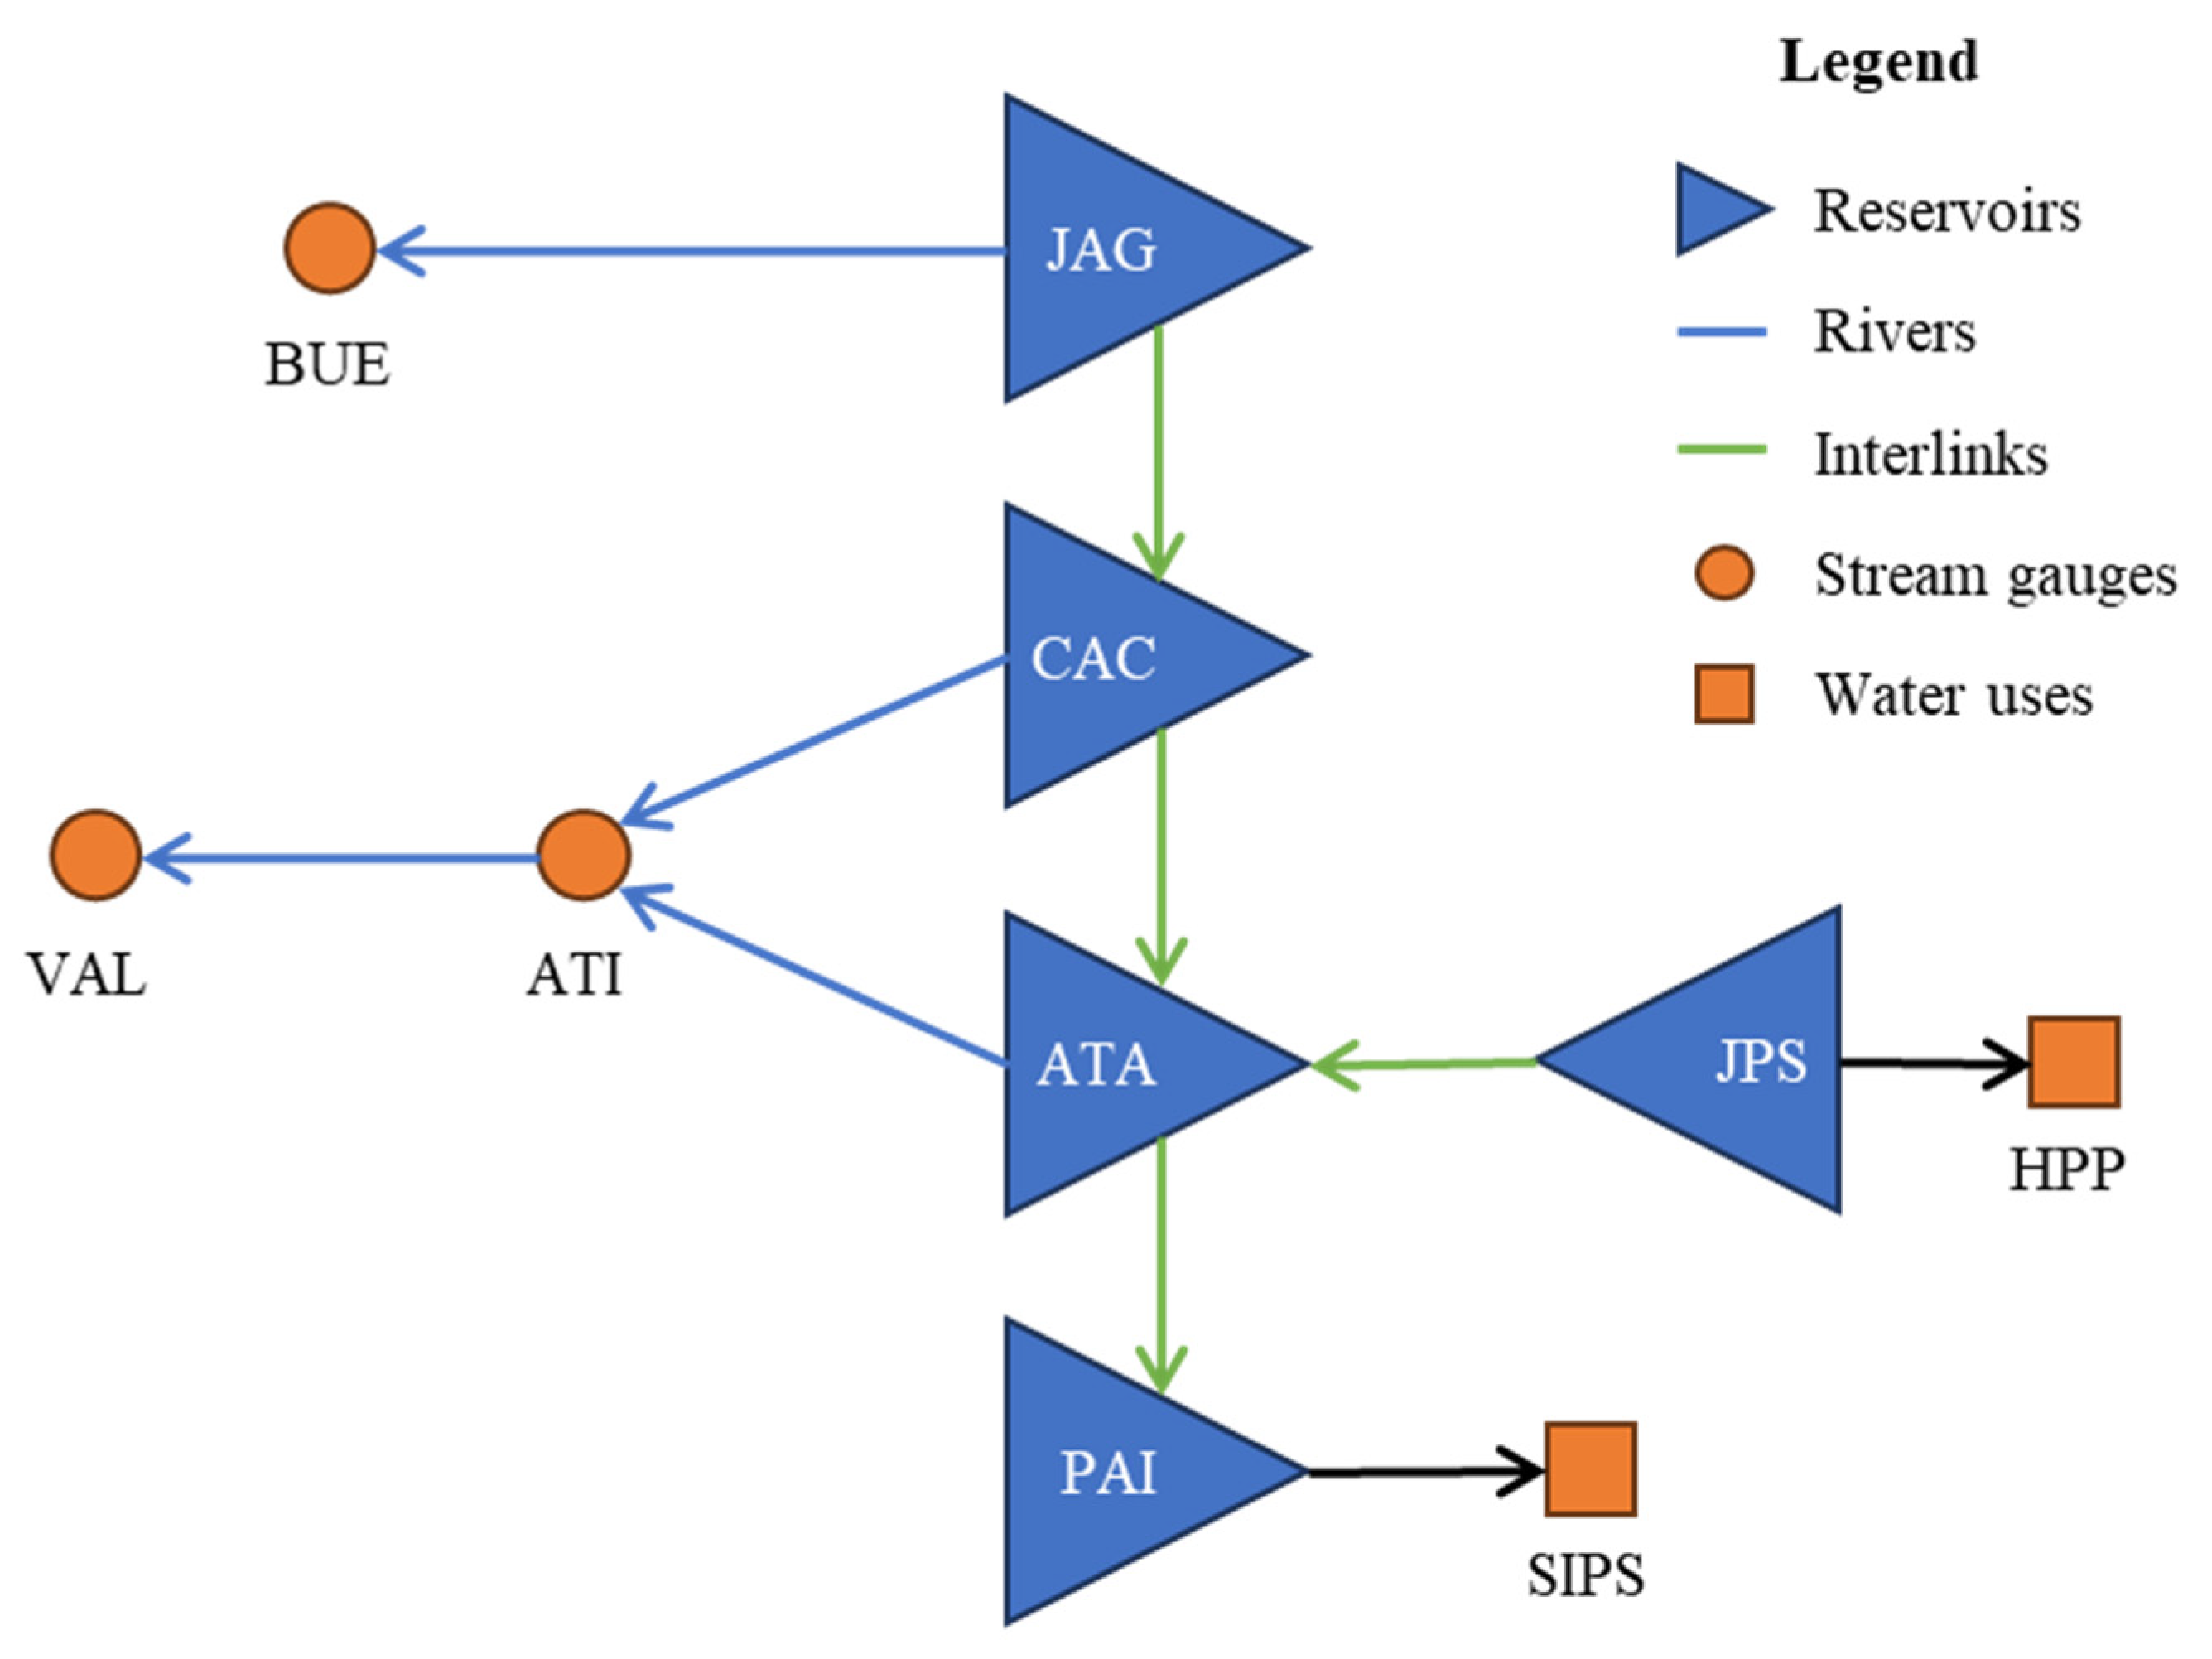
Figure 4.
Research flowchart.
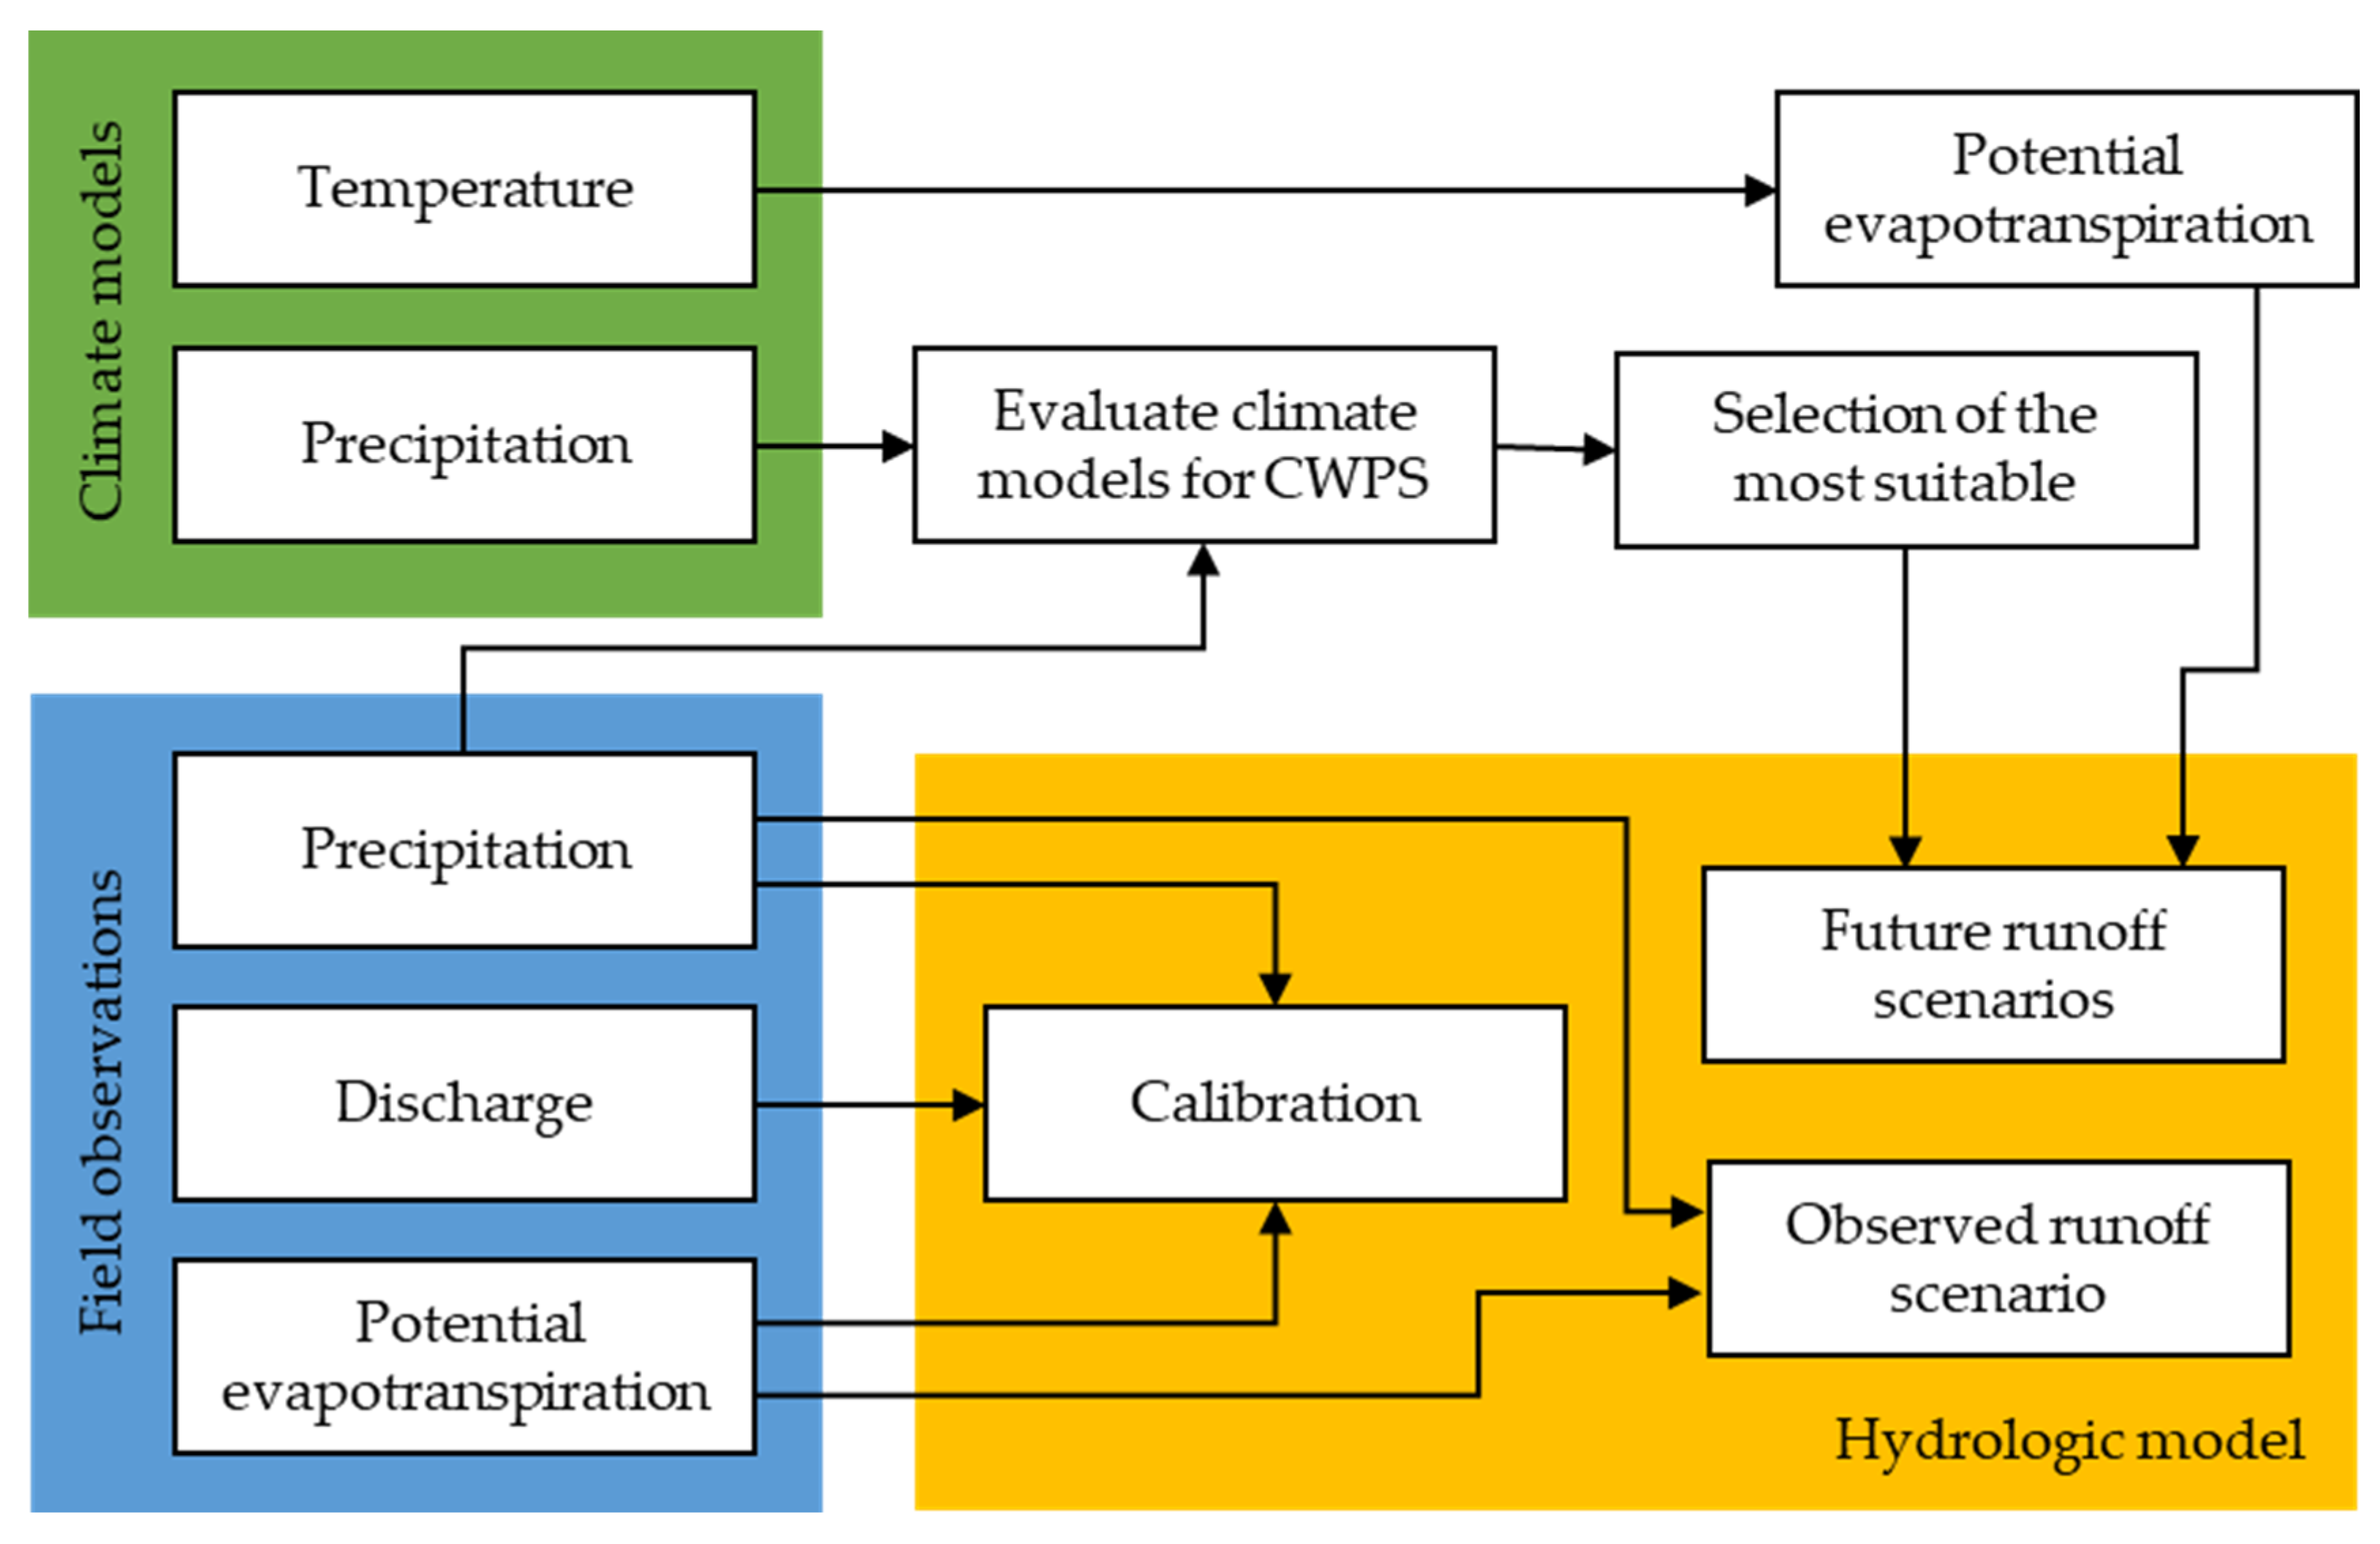
Figure 5.
Hydrological model scheme.
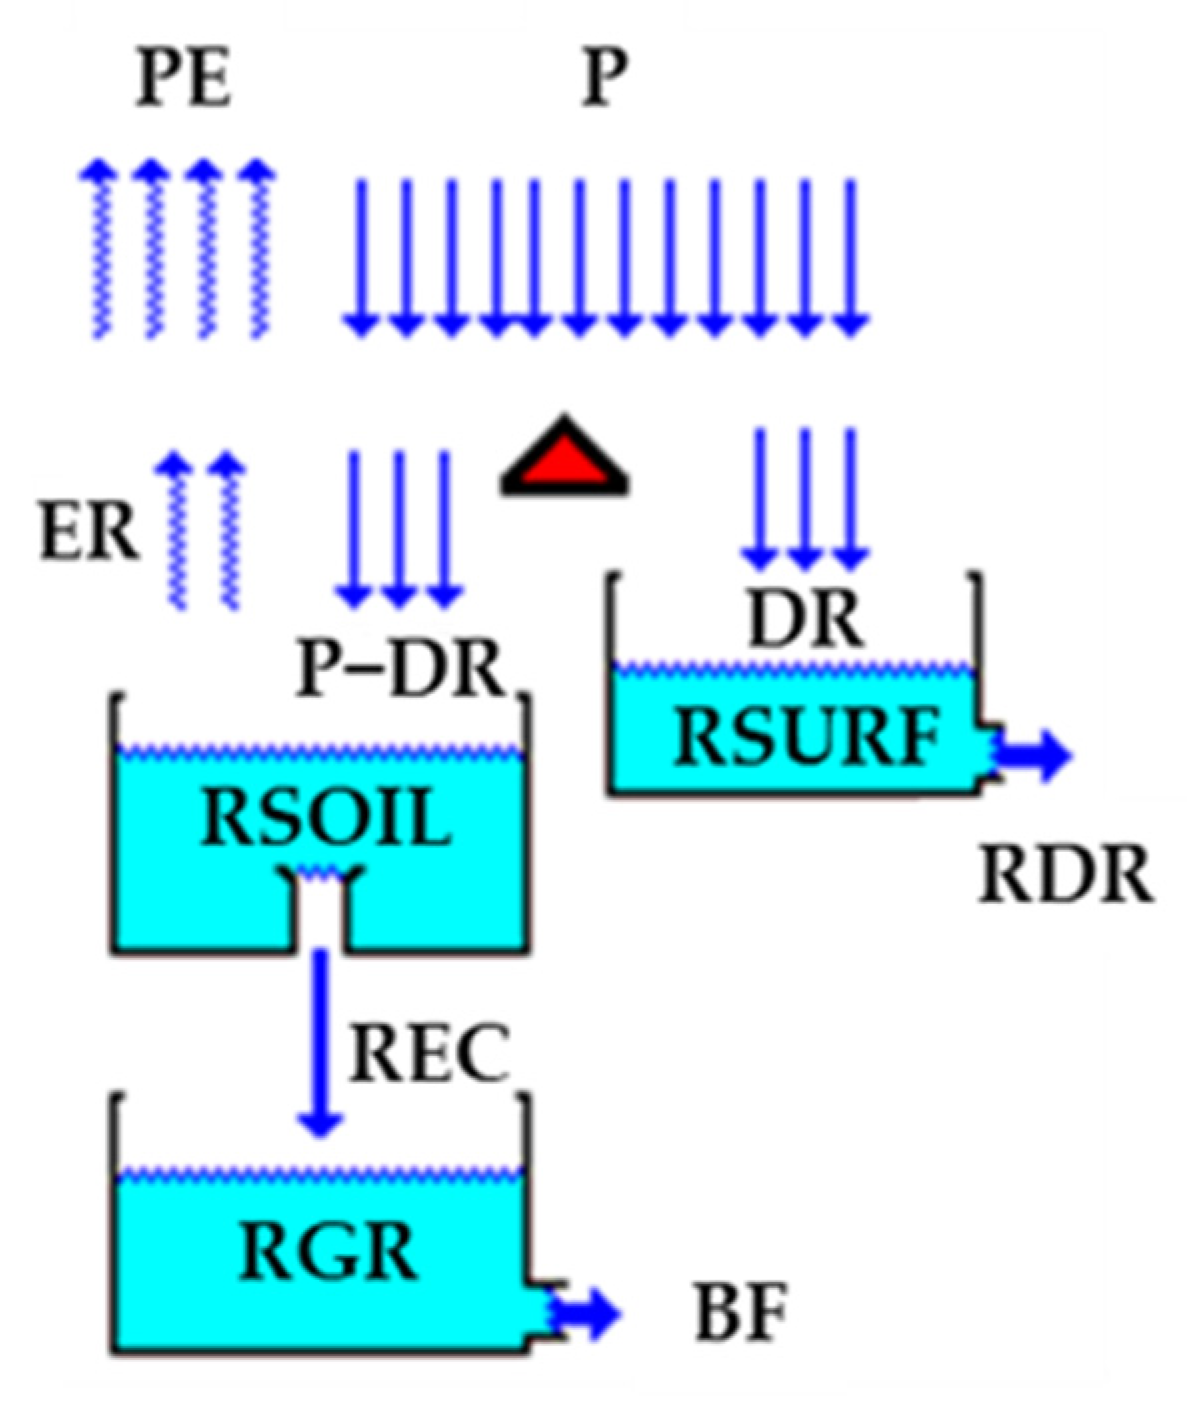
Figure 6.
Time series of accumulated precipitation for the hydrological year from the climate models and observed data, * dataset with bias correction.
Figure 6.
Time series of accumulated precipitation for the hydrological year from the climate models and observed data, * dataset with bias correction.
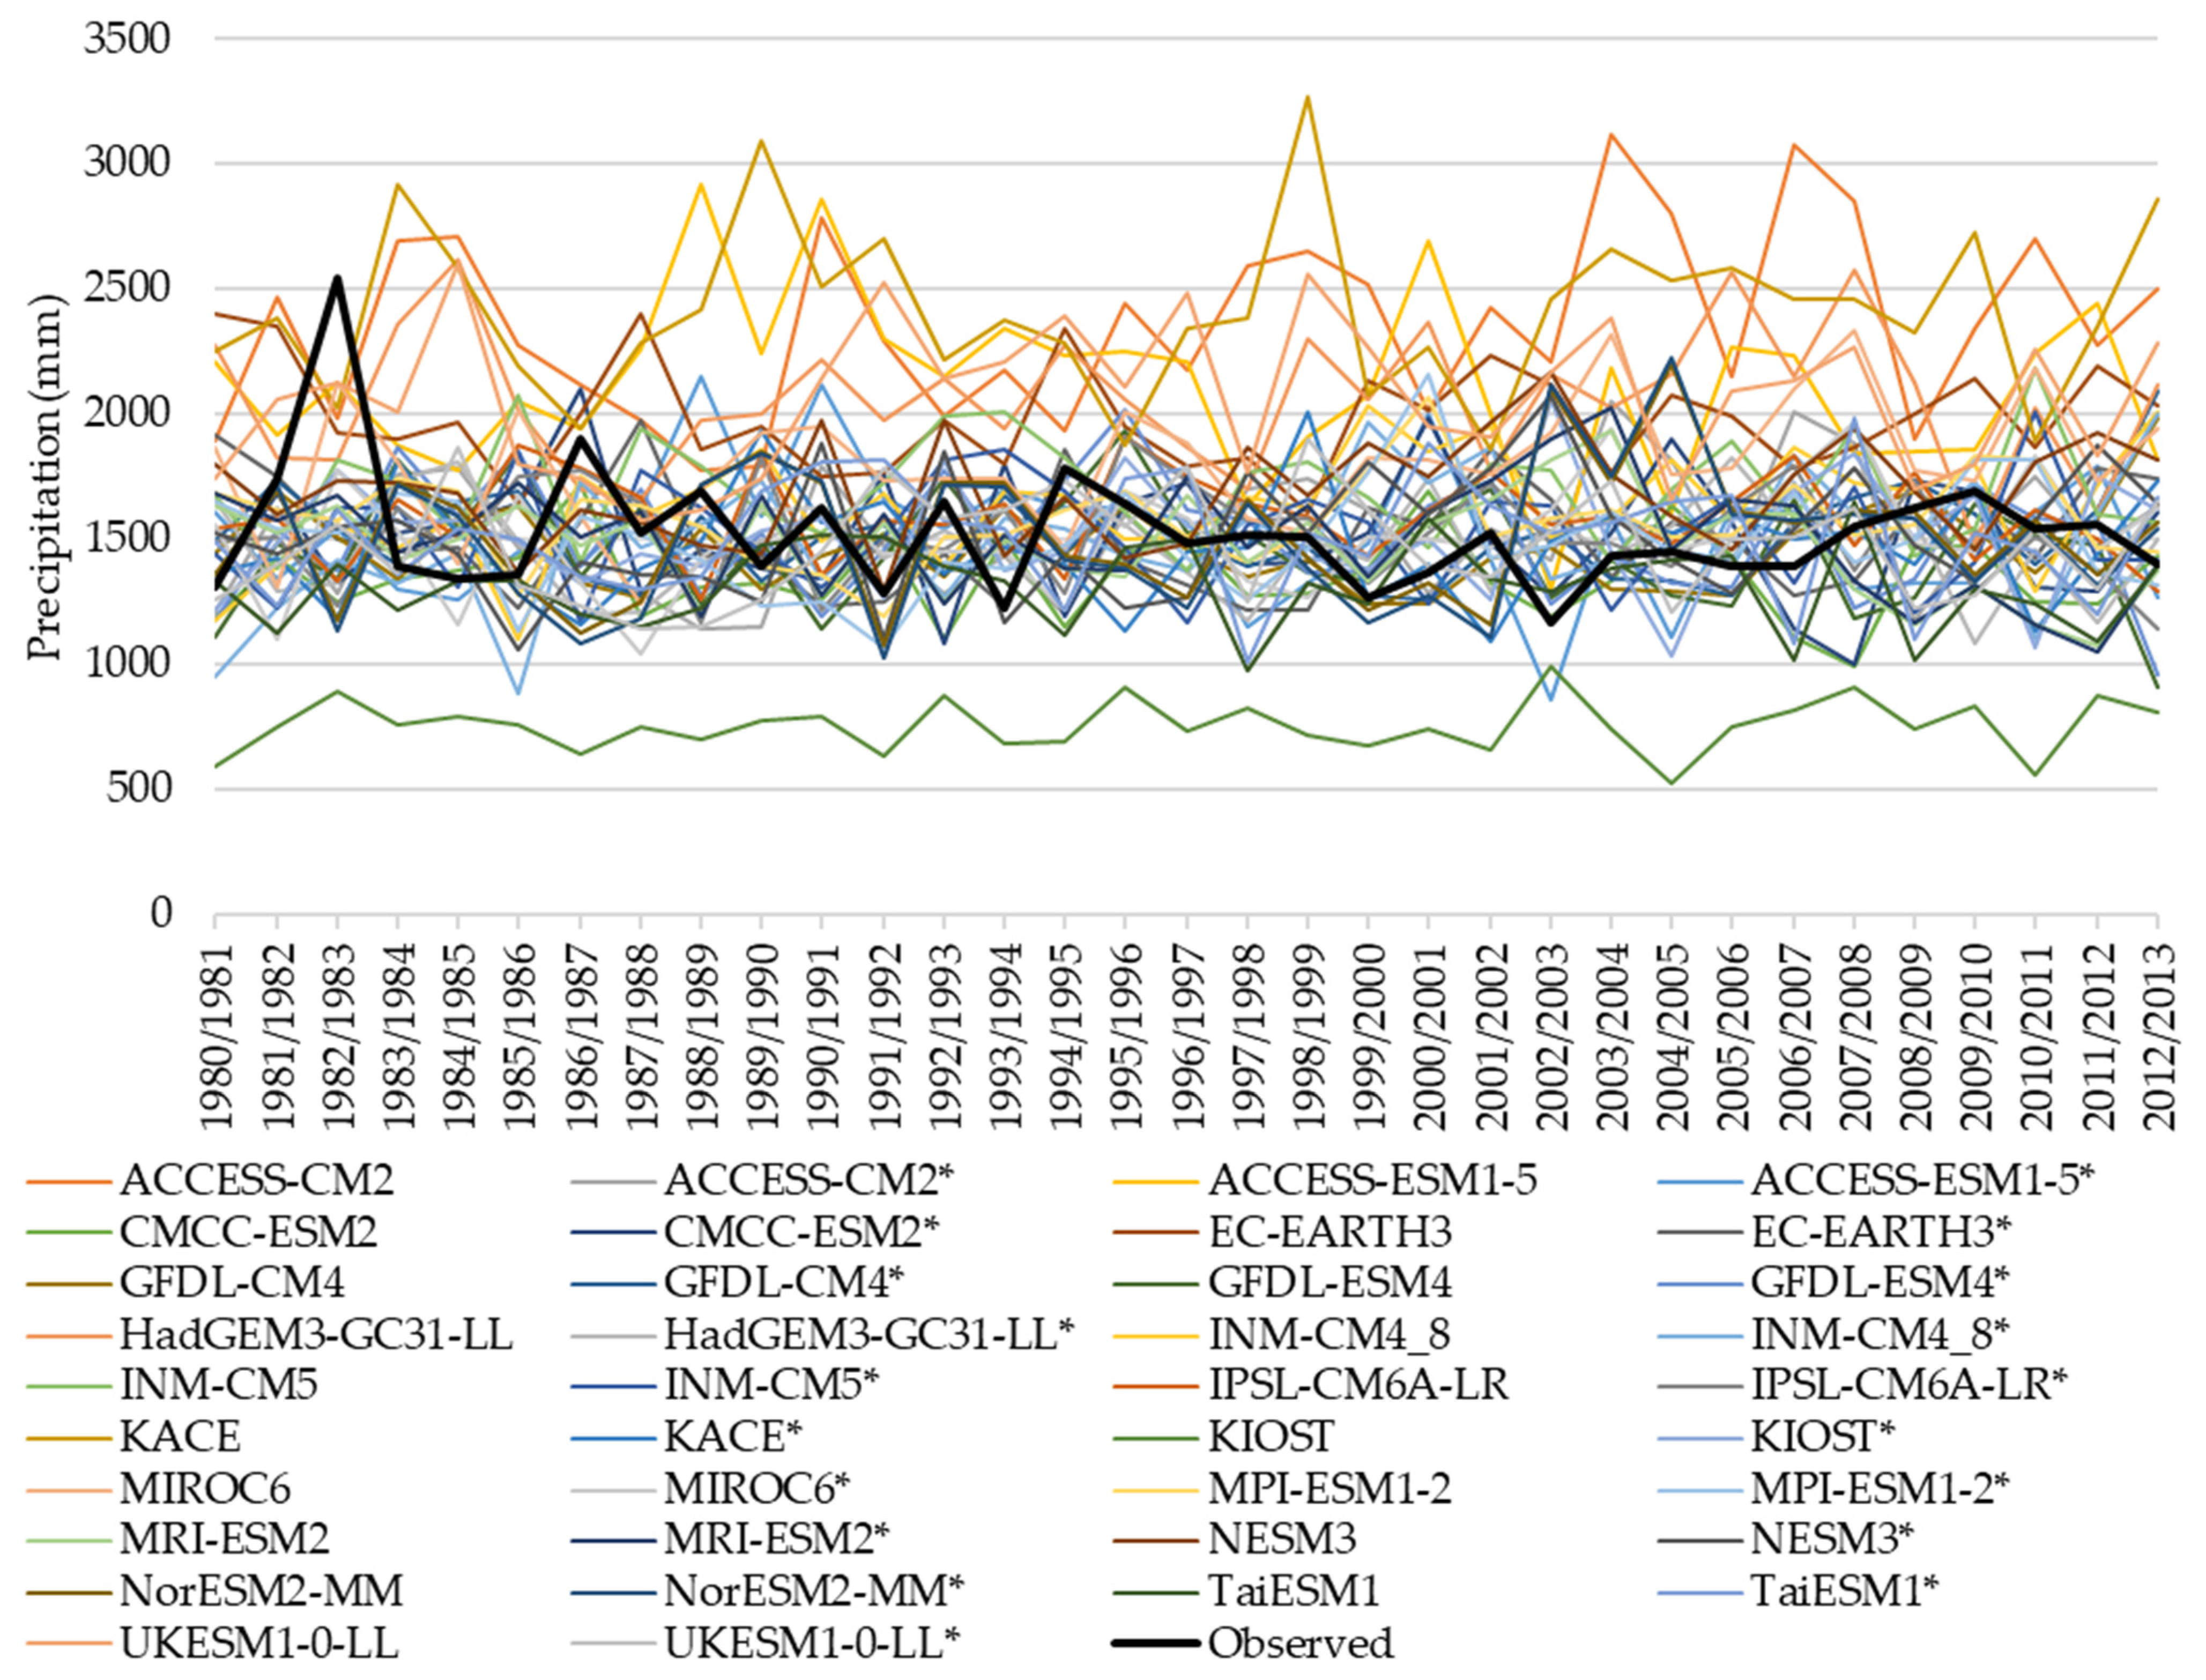
Figure 7.
Time series of accumulated precipitation for the hydrological year from observed data and two scenarios, SSP2-4.5 and SSP5-8.5.
Figure 7.
Time series of accumulated precipitation for the hydrological year from observed data and two scenarios, SSP2-4.5 and SSP5-8.5.

Figure 8.
Seasonal trends for (a) average precipitation accumulated for the month of the year, and (b) average precipitation accumulated for the hydrologic semester from observed data and two scenarios, SSP2-4.5 and SSP5-8.5.
Figure 8.
Seasonal trends for (a) average precipitation accumulated for the month of the year, and (b) average precipitation accumulated for the hydrologic semester from observed data and two scenarios, SSP2-4.5 and SSP5-8.5.
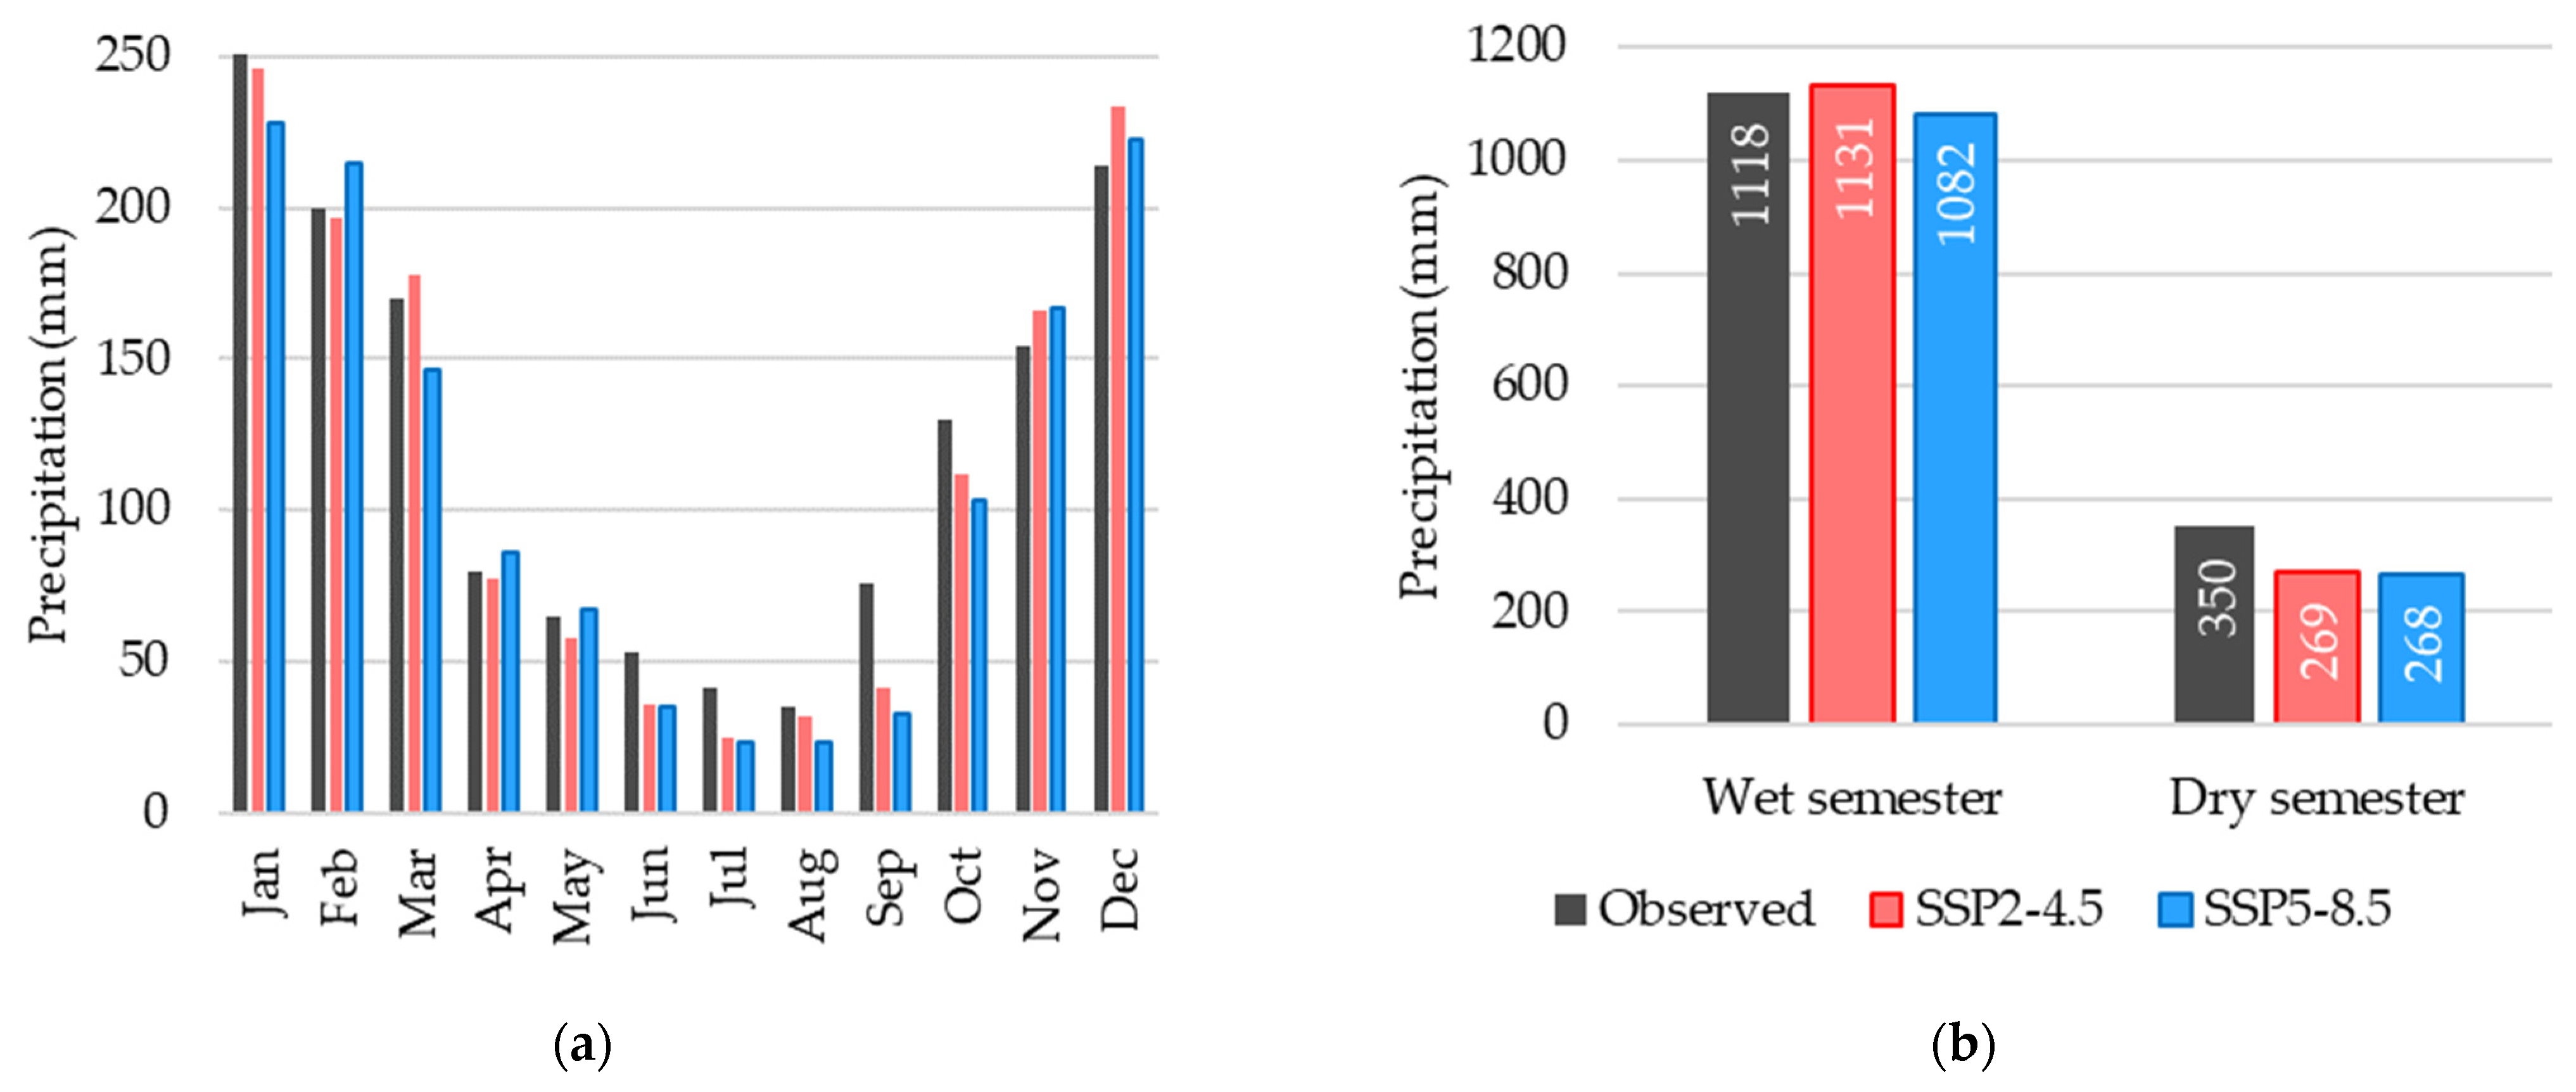
Figure 9.
The SPI6 time series from observed data and two scenarios, SSP2-4.5 and SSP5-8.5.

Figure 10.
Drought Magnitude (DM) exceedance curves for observed and projected time series.
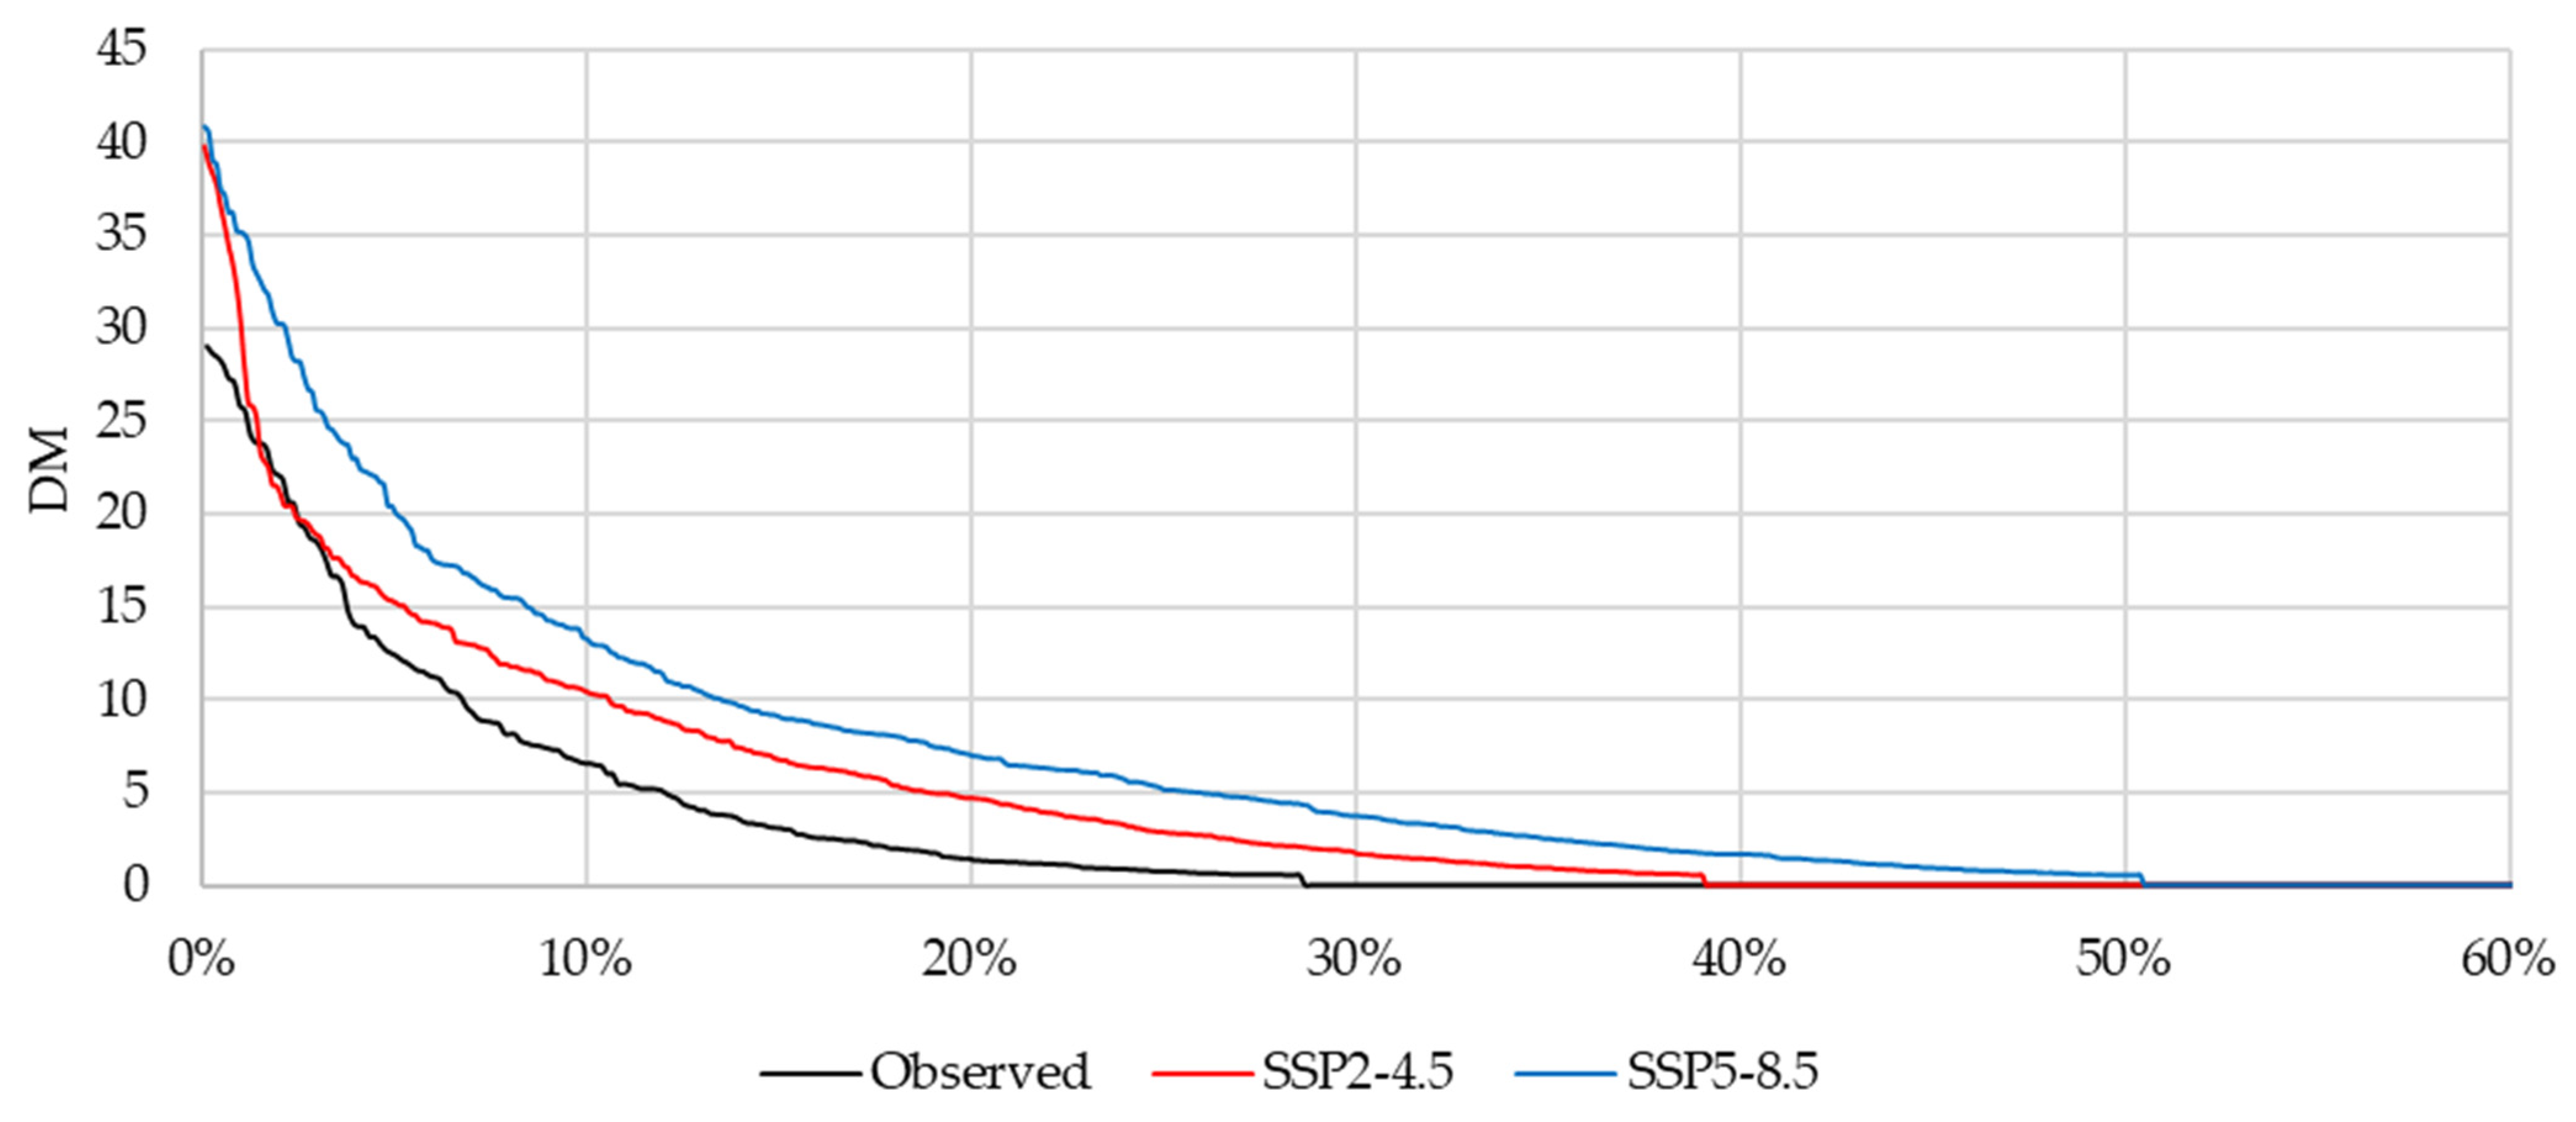
Figure 11.
Frequency curves with a probability of over 50% of the observed and estimated flows in the calibration of basins: (a) BUE, (b) ATI and (c) VAL.
Figure 11.
Frequency curves with a probability of over 50% of the observed and estimated flows in the calibration of basins: (a) BUE, (b) ATI and (c) VAL.
Figure 12.
Frequency of non-exceedance of the ratio between precipitation and runoff (P/Q) of the average of seven consecutive days in the climate scenarios studied: (a) P/Q = 0.5, (b) P/Q = 0.2.
Figure 12.
Frequency of non-exceedance of the ratio between precipitation and runoff (P/Q) of the average of seven consecutive days in the climate scenarios studied: (a) P/Q = 0.5, (b) P/Q = 0.2.

Table 1.
Basin drainage area.
| Basin | Abbr. | Drainage Area (km2) |
|---|---|---|
| UHE Jaguari | JPS | 1309.2 |
| Jaguari/Jacareí | JAG | 1240.6 |
| Valinhos | VAL | 982.3 |
| Buenópolis | BUE | 713.9 |
| Atibaia | ATI | 437.0 |
| Cachoeira | CAC | 392.1 |
| Paiva Castro | PAI | 337.1 |
| Atibainha | ATA | 314.3 |
Table 2.
Score to evaluate climate models.
| Category | Condition | Score |
|---|---|---|
| Low | KGE′ ≤ 0 | 0 |
| Medium | 0 ≥ KGE′ ≤ 0.4 | 1 |
| High | KGE′ ≥ 0.4 | 2 |
Table 3.
Ranking of climate models best evaluated for CWPS.
| Dataset | Score | ∑Score | ∑KGE′ | |||||||||
|---|---|---|---|---|---|---|---|---|---|---|---|---|
| a | b | c | d | e | f | g | h | i | j | |||
| GFDL-CM4 | 1 | 2 | 1 | 1 | 2 | 2 | 1 | 1 | 2 | 2 | 15 | 4.58 |
| GFDL-ESM4 | 1 | 2 | 1 | 1 | 2 | 2 | 1 | 1 | 2 | 2 | 15 | 3.56 |
| GFDL-CM4 * | 1 | 2 | 1 | 1 | 2 | 2 | 1 | 0 | 2 | 2 | 14 | 3.61 |
| ACCESS-ESM1-5 * | 1 | 2 | 1 | 1 | 2 | 2 | 1 | 0 | 2 | 2 | 14 | 3.18 |
| ACCESS-ESM1-5 | 1 | 2 | 0 | 1 | 2 | 2 | 1 | 1 | 2 | 2 | 14 | 3.02 |
| KIOST * | 1 | 2 | 1 | 1 | 2 | 2 | 1 | 0 | 2 | 2 | 14 | 2.91 |
| GFDL-ESM4 * | 1 | 2 | 1 | 1 | 2 | 2 | 1 | 0 | 2 | 2 | 14 | 2.70 |
| EC-EARTH3 * | 1 | 2 | 1 | 1 | 2 | 2 | 1 | 0 | 2 | 2 | 14 | 1.45 |
| MPI-ESM1-2 * | 1 | 2 | 0 | 1 | 2 | 2 | 1 | 0 | 2 | 2 | 13 | 3.02 |
| CMCC-ESM2 * | 1 | 2 | 1 | 0 | 2 | 2 | 1 | 0 | 2 | 2 | 13 | 2.33 |
| CMCC-ESM2 | 1 | 2 | 1 | 0 | 2 | 2 | 1 | 0 | 2 | 2 | 13 | 0.19 |
| IPSL-CM6A-LR * | 1 | 2 | 1 | 0 | 2 | 2 | 1 | 0 | 2 | 2 | 13 | −0.14 |
| EC-EARTH3 | 1 | 2 | 1 | 0 | 2 | 2 | 1 | 0 | 2 | 2 | 13 | −3.03 |
| NESM3 | 1 | 2 | 0 | 0 | 2 | 2 | 1 | 0 | 2 | 2 | 12 | 3.65 |
| IPSL-CM6A-LR | 1 | 2 | 0 | 0 | 2 | 2 | 1 | 0 | 2 | 2 | 12 | 3.59 |
| MIROC6 | 1 | 2 | 0 | 0 | 2 | 2 | 1 | 0 | 2 | 2 | 12 | 3.46 |
| MRI-ESM2 | 1 | 2 | 0 | 0 | 2 | 2 | 1 | 0 | 2 | 2 | 12 | 3.34 |
| MIROC6 * | 1 | 2 | 0 | 0 | 2 | 2 | 1 | 0 | 2 | 2 | 12 | 3.19 |
| ACCESS-CM2 * | 1 | 2 | 0 | 0 | 2 | 2 | 1 | 0 | 2 | 2 | 12 | 2.85 |
| KACE * | 1 | 2 | 0 | 0 | 2 | 2 | 1 | 0 | 2 | 2 | 12 | 2.56 |
| NESM3 * | 1 | 2 | 0 | 1 | 2 | 2 | 1 | 0 | 1 | 2 | 12 | 2.47 |
| HadGEM3-GC31-LL * | 1 | 2 | 0 | 0 | 2 | 2 | 1 | 0 | 2 | 2 | 12 | 2.28 |
| TaiESM1 | 1 | 2 | 0 | 0 | 2 | 2 | 1 | 0 | 2 | 2 | 12 | 2.11 |
| TaiESM1 * | 1 | 2 | 0 | 0 | 2 | 2 | 1 | 0 | 2 | 2 | 12 | 2.06 |
| MPI-ESM1-2 | 1 | 2 | 0 | 0 | 2 | 2 | 1 | 0 | 2 | 2 | 12 | 1.48 |
| INM-CM5 | 1 | 2 | 0 | 0 | 2 | 2 | 1 | 0 | 2 | 2 | 12 | 0.12 |
| MRI-ESM2 * | 1 | 2 | 0 | 0 | 2 | 2 | 1 | 0 | 2 | 2 | 12 | −0.40 |
| UKESM1-0-LL * | 1 | 2 | 0 | 0 | 2 | 2 | 1 | 0 | 1 | 2 | 11 | 2.77 |
| NorESM2-MM | 1 | 2 | 0 | 0 | 2 | 2 | 1 | 0 | 1 | 2 | 11 | 1.95 |
| NorESM2-MM * | 1 | 2 | 0 | 0 | 2 | 2 | 1 | 0 | 1 | 2 | 11 | 1.27 |
| INM-CM5 * | 1 | 2 | 0 | 0 | 2 | 2 | 1 | 0 | 1 | 2 | 11 | −0.31 |
| INM-CM4_8 | 1 | 2 | 0 | 0 | 2 | 2 | 1 | 0 | 1 | 2 | 11 | −1.02 |
| UKESM1-0-LL | 0 | 2 | 0 | 0 | 2 | 2 | 0 | 1 | 1 | 2 | 10 | 2.14 |
| HadGEM3-GC31-LL | 0 | 2 | 0 | 0 | 2 | 2 | 0 | 1 | 1 | 2 | 10 | 1.42 |
| INM-CM4_8 * | 1 | 2 | 0 | 0 | 2 | 2 | 1 | 0 | 0 | 2 | 10 | −0.01 |
| KIOST | 0 | 1 | 0 | 1 | 2 | 2 | 0 | 0 | 1 | 2 | 9 | 1.85 |
| KACE | 0 | 1 | 0 | 0 | 1 | 1 | 0 | 1 | 2 | 2 | 8 | 0.91 |
| ACCESS-CM2 | 0 | 1 | 0 | 0 | 2 | 2 | 0 | 0 | 2 | 1 | 8 | −3.23 |
* Dataset with bias correction. Column a daily time series, b monthly time series, c annual time series, d hydrological year time series (from October to September), e average precipitation for the day of the year, f average precipitation for the month of the year, g maximum precipitation for the day of the year, h maximum precipitation for the month of the year, i minimum precipitation for the day of the year, and j minimum precipitation for the month of the year.
Table 4.
Performance indicators for the objective functions used to calibrate the hydrological model in the CWPS basins.
Table 4.
Performance indicators for the objective functions used to calibrate the hydrological model in the CWPS basins.
| Performance Indicator | Objective Function | Basin | |||||||
|---|---|---|---|---|---|---|---|---|---|
| JPS | JAG | VAL | BUE | ATI | CAC | PAI | ATA | ||
| KGE | NSE | 0.81 | 0.57 | 0.86 | 0.76 | 0.38 | 0.39 | 0.50 | 0.29 |
| Log-NSE | 0.39 | 0.20 | 0.53 | 0.53 | 0.11 | −0.34 | 0.15 | −0.39 | |
| KGE | 0.83 | 0.71 | 0.90 | 0.83 | 0.68 | 0.53 | 0.62 | 0.51 | |
| NSE | NSE | 0.67 | 0.45 | 0.84 | 0.71 | 0.23 | 0.24 | 0.35 | 0.31 |
| Log-NSE | 0.16 | −0.21 | 0.55 | 0.39 | −0.49 | −1.99 | −0.82 | −2.29 | |
| KGE | 0.66 | 0.40 | 0.81 | 0.66 | 0.36 | 0.04 | 0.24 | −0.02 | |
| R2 | NSE | 0.69 | 0.48 | 0.85 | 0.76 | 0.26 | 0.36 | 0.37 | 0.33 |
| Log-NSE | 0.72 | 0.69 | 0.85 | 0.74 | 0.66 | 0.52 | 0.43 | 0.47 | |
| KGE | 0.69 | 0.52 | 0.82 | 0.70 | 0.55 | 0.33 | 0.38 | 0.29 | |
| PBIAS (%) | NSE | 6.72 | 14.73 | 10.44 | 19.32 | −8.13 | 32.65 | 9.19 | 4.81 |
| Log-NSE | 10.23 | 18.59 | 8.10 | 9.61 | 18.68 | 28.37 | 8.14 | 31.67 | |
| KGE | 4.04 | 6.43 | 2.00 | 4.94 | 18.20 | 17.86 | 3.59 | 15.67 | |
| Log-NSE | NSE | 0.53 | 0.11 | 0.74 | 0.51 | 0.19 | −0.24 | −0.02 | −0.07 |
| Log-NSE | 0.69 | 0.64 | 0.89 | 0.78 | 0.60 | 0.35 | 0.22 | 0.40 | |
| KGE | 0.57 | 0.43 | 0.80 | 0.64 | 0.33 | −0.01 | 0.07 | 0.07 | |
The underlined values are the performance indicator of objective function adopted for each basin.
Table 5.
Daily runoff (mm) predicted for precipitation (mm) by the GFDL-CM4 model in two climate scenarios in CWPS basins.
Table 5.
Daily runoff (mm) predicted for precipitation (mm) by the GFDL-CM4 model in two climate scenarios in CWPS basins.
| Basin | SSP2-4.5 | SSP5-8.5 | ||||||||
|---|---|---|---|---|---|---|---|---|---|---|
| Equation (Q) | r | Q25 | Q50 | Q75 | Equation (Q) | r | Q25 | Q50 | Q75 | |
| JPS | 0.148P + 0.990 | 0.67 | 0.88 | 1.14 | 1.52 | 0.141P + 0.889 | 0.67 | 0.75 | 1.01 | 1.37 |
| JAG | 0.047P + 0.779 | 0.33 | 0.53 | 0.65 | 0.86 | 0.038P + 0.649 | 0.32 | 0.43 | 0.58 | 0.76 |
| VAL | 0.135P + 0.813 | 0.53 | 0.46 | 0.69 | 1.17 | 0.125P + 0.732 | 0.53 | 0.37 | 0.61 | 1.04 |
| BUE | 0.125P + 0.654 | 0.51 | 0.40 | 0.55 | 0.88 | 0.113P + 0.578 | 0.50 | 0.33 | 0.48 | 0.77 |
| ATI | 0.167P + 0.866 | 0.58 | 0.48 | 0.67 | 1.35 | 0.155P + 0.801 | 0.57 | 0.42 | 0.60 | 1.20 |
| CAC | 0.050P + 0.787 | 0.45 | 0.70 | 0.82 | 0.97 | 0.039P + 0.691 | 0.46 | 0.58 | 0.73 | 0.89 |
| PAI | 0.066P + 0.842 | 0.56 | 0.81 | 0.93 | 1.10 | 0.054P + 0.746 | 0.56 | 0.68 | 0.83 | 1.01 |
| ATA | 0.129P + 0.661 | 0.61 | 0.65 | 0.82 | 1.01 | 0.114P + 0.573 | 0.60 | 0.53 | 0.71 | 0.92 |
Disclaimer/Publisher’s Note: The statements, opinions and data contained in all publications are solely those of the individual author(s) and contributor(s) and not of MDPI and/or the editor(s). MDPI and/or the editor(s) disclaim responsibility for any injury to people or property resulting from any ideas, methods, instructions or products referred to in the content. |
© 2023 by the authors. Licensee MDPI, Basel, Switzerland. This article is an open access article distributed under the terms and conditions of the Creative Commons Attribution (CC BY) license (https://creativecommons.org/licenses/by/4.0/).
Share and Cite
MDPI and ACS Style
Tercini, J.R.B.; Mello Júnior, A.V. Impact of Hydroclimatic Changes on Water Security in the Cantareira Water Production System, Brazil. Atmosphere 2023, 14, 1836. https://doi.org/10.3390/atmos14121836
AMA Style
Tercini JRB, Mello Júnior AV. Impact of Hydroclimatic Changes on Water Security in the Cantareira Water Production System, Brazil. Atmosphere. 2023; 14(12):1836. https://doi.org/10.3390/atmos14121836
Chicago/Turabian StyleTercini, João Rafael Bergamaschi, and Arisvaldo Vieira Mello Júnior. 2023. "Impact of Hydroclimatic Changes on Water Security in the Cantareira Water Production System, Brazil" Atmosphere 14, no. 12: 1836. https://doi.org/10.3390/atmos14121836
Note that from the first issue of 2016, this journal uses article numbers instead of page numbers. See further details here.