Article

Evaluating the Effectiveness of Best Management Practices in Adapting the Impacts of Climate Change-Induced Urban Flooding

1
Arcadis U.S., Inc., 7575 Huntington Park Dr Suite 130, Columbus, OH 43235, USA
2
FTN Associates, Ltd., 3 Innwood Cir #220, Little Rock, AR 72211, USA
3
School of Civil, Environmental, and Infrastructure Engineering, Southern Illinois University, 1230 Lincoln Drive, Carbondale, IL 62901, USA
4
Department of Civil Engineering, Southern Illinois University Edwardsville, 61 Circle Dr, Edwardsville, IL 62026, USA
5
AECOM Technical Services Inc., 1350 Deming Way, Suite 100, Middleton, WI 53562, USA
*
Author to whom correspondence should be addressed.
Atmosphere 2024, 15(3), 281; https://doi.org/10.3390/atmos15030281
Submission received: 12 December 2023 / Revised: 20 February 2024 / Accepted: 21 February 2024 / Published: 26 February 2024
(This article belongs to the Special Issue The Impact of Climate Change on Water Resources)

Abstract

:
Floods are amongst the most destructive and costly natural disasters impacting communities around the globe. The severity and reoccurrence of flooding events have been more common in recent years as a result of the changing climate and urbanization. Best Management Practices (BMPs) are commonly used flood management techniques that aim to alleviate flooding and its impacts by capturing surface runoff and promoting infiltration. Recent studies have examined the effectiveness of BMPs in countering the effects of flooding; however, the performance of such strategies still needs to be analyzed for possible future climate change. In this context, this research employs climate model-driven datasets from the North American Regional Climate Change Assessment Program to evaluate the effects of climate change on urban hydrology within a study region by calculating historical and projected 6 h 100-year storm depths. Finally, the climate-induced design storms are simulated in the PCSWMM model, and the three BMP options (i.e., porous pavement, infiltration trench, and green roof) are evaluated to alleviate the impact of flooding events. This study quantifies the impact of changing climate on flood severity based on future climate models. The results indicate that peak discharge and peak volume are projected to increase by a range of 5% to 43% and 8% to 94%, respectively. In addition, the results demonstrated that green roofs, Permeable Pavement, and infiltration trenches help to reduce peak discharge by up to 7%, 14%, and 15% and reduce flood volume by up to 19%, 24%, and 29%, respectively, thereby presenting a promising solution to address the challenges posed by climate change-induced flooding events.

1. Introduction

Recent flood experience demonstrates a rise in the occurrence and magnitude of extreme weather events that caused significant floods in many regions of the world. Floods are typically caused by excessive runoff, often due to heavy rainfall or the overflow of rivers and streams, particularly detrimental in urban watersheds with a high concentration of vital infrastructure, economic assets, and densely populated areas. Despite the findings of the latest Intergovernmental Panel on Climate Change (IPCC) report, which indicate low confidence in directly attributing the effects of climate change to the increase in flooding events, [1] numerous global severe flooding reports and scientific studies suggested a direct link between climate change and the rise in flooding events. For example, in the Pernambuco, Alagoas, and Paraiba states in Brazil, severe flooding in May 2022 killed 79 people, and 3957 people were displaced from their homes [2]. On 11 July 2022, in Gujarat, India, catastrophic flooding due to heavy rainfall affected over a million people [3]. Similarly, In the Henan Province of China in July 2021, flash floods affected around 15 million people, resulting in 302 fatalities and 50 missing persons and causing economic losses of approximately USD 17 billion [4]. During the same year, the summer flooding event killed at least 160 persons in Germany and 31 in Belgium [5]. Hurricane Harvey in 2017 and Hurricane Florence in 2018 were the two wettest storms to hit the United States in the previous 70 years, causing severe flooding [6]. A rising amount of flooding events and scientific evidence indicate that extreme flooding disasters are projected to become more regular and intense over the next decades [7,8].
Similarly, numerous scientific studies worldwide suggested that climate change and urbanization are the two most critical factors increasing the frequency and severity of extreme flooding events worldwide [9,10,11,12]. Climate change has significantly impacted the water cycle and extreme precipitation patterns, increasing the frequency and severity of floods [13]. Similarly, urbanization due to anthropogenic activities and infrastructural developments decreased the amount of natural vegetation in the watershed, which increases the percentage of impervious areas and significantly reduces the infiltration capacity during rainfall events, resulting in increased surface runoff and consequently increasing the severity of flooding [13].
Best Management Practice (BMP) is a commonly used flood control technique that aims to alleviate the impact of flooding events during a high-intensity rainfall event. The usage of BMP has increased along with the United Nation’s 11th sustainable goal of making cities safer, more durable, and sustainable. BMPs are an effective method of green infrastructure (GI) practices that are considered to manage urban runoff quantity and quality [14,15,16]. Urban BMPs can be structural and nonstructural measures to manage urban runoff by increasing the perviousness of the land, consequently decreasing the surface runoff [17]. Previous studies determined the effectiveness of different BMPs such as green roofs [18,19], rain gardens [20], bioretention ponds [21], bioretention swales [16], porous pavement [22,23], infiltration trench [24], rainwater harvesting [25,26], rain barrel [14,27] in mitigating the impact of flooding events by lowering peak discharge and flooding volume. However, most of the current hydrological studies considered statistical evaluations of past rainfall events’ intensity and frequency to determine the effectiveness of BMP in urban watersheds. These methods are tested to justify certain discharges that account for the recurrence of events such as 100-year storm events. The statistical parameters of the hydrological variables in this design are typically thought to be constant across time without significant fluctuations. However, many previous studies found that impacts of climate change will increase the intensity of rainfall events, and 100-year return period flooding events are expected to become more common [7,8,28]. Major cities with extensive drainage systems are encountering more difficulties because of rising flood volumes, which are anticipated to raise infrastructure failure risks, property damage, and probable fatalities [29]. Therefore, considering potential changes in storm patterns and intensity because of future climate change, it is essential to evaluate the effectiveness of BMP for future climatic conditions.
In this context, this study used climate model-driven datasets provided by the North American Regional Climate Change Assessment Program (NARCCAP) to evaluate the impact of climate change on urban hydrology within a proposed study area. The NARCCAP developed several high-resolution climate scenarios by applying multiple RCMs to evaluate their impacts on North America [30]. This international program employs an RCM, coupled GCM, and time-slice experiment to provide high-resolution climate scenarios for continental North America [30]. The climate change information provided by RCMs and GCMs is available on the gridded precipitation formats. The gridded data for precipitation from climate models are areal averages rather than point estimates, and it is not simple to connect catchment-scale hydrologic analysis with gridded climate change estimates. The targeted watershed-level hydrological implementation of climate change impacts is typically connected to the projected climatic outputs using one of two downscaling techniques: statistical downscaling or dynamical downscaling [31]. The application of these downscaling techniques is complex.
Therefore, in this study, the future climate data, which are available in gridded format, are converted to point-rainfall data using the delta change method (DCM), a less complicated downscaling technique [32]. DCMs include relevant data for evaluating the hydrological effects of climate change, and their application is straightforward [32]. Delta change factors are typically calculated by taking the differences between the future climate data and the corresponding historical data for a specific time period and geographical area. These factors are then applied to the historical climate data to estimate what the climate conditions might be in the future under a certain climate change model [33].
In this context, this study used the PCSWMM model to simulate increased hydrology runoff caused by increased precipitation. Similarly, three BMP options (porous pavement, infiltration trench, and green roof) were used to determine their effectiveness in reducing the impacts of urban flooding.

2. Site Description and Data
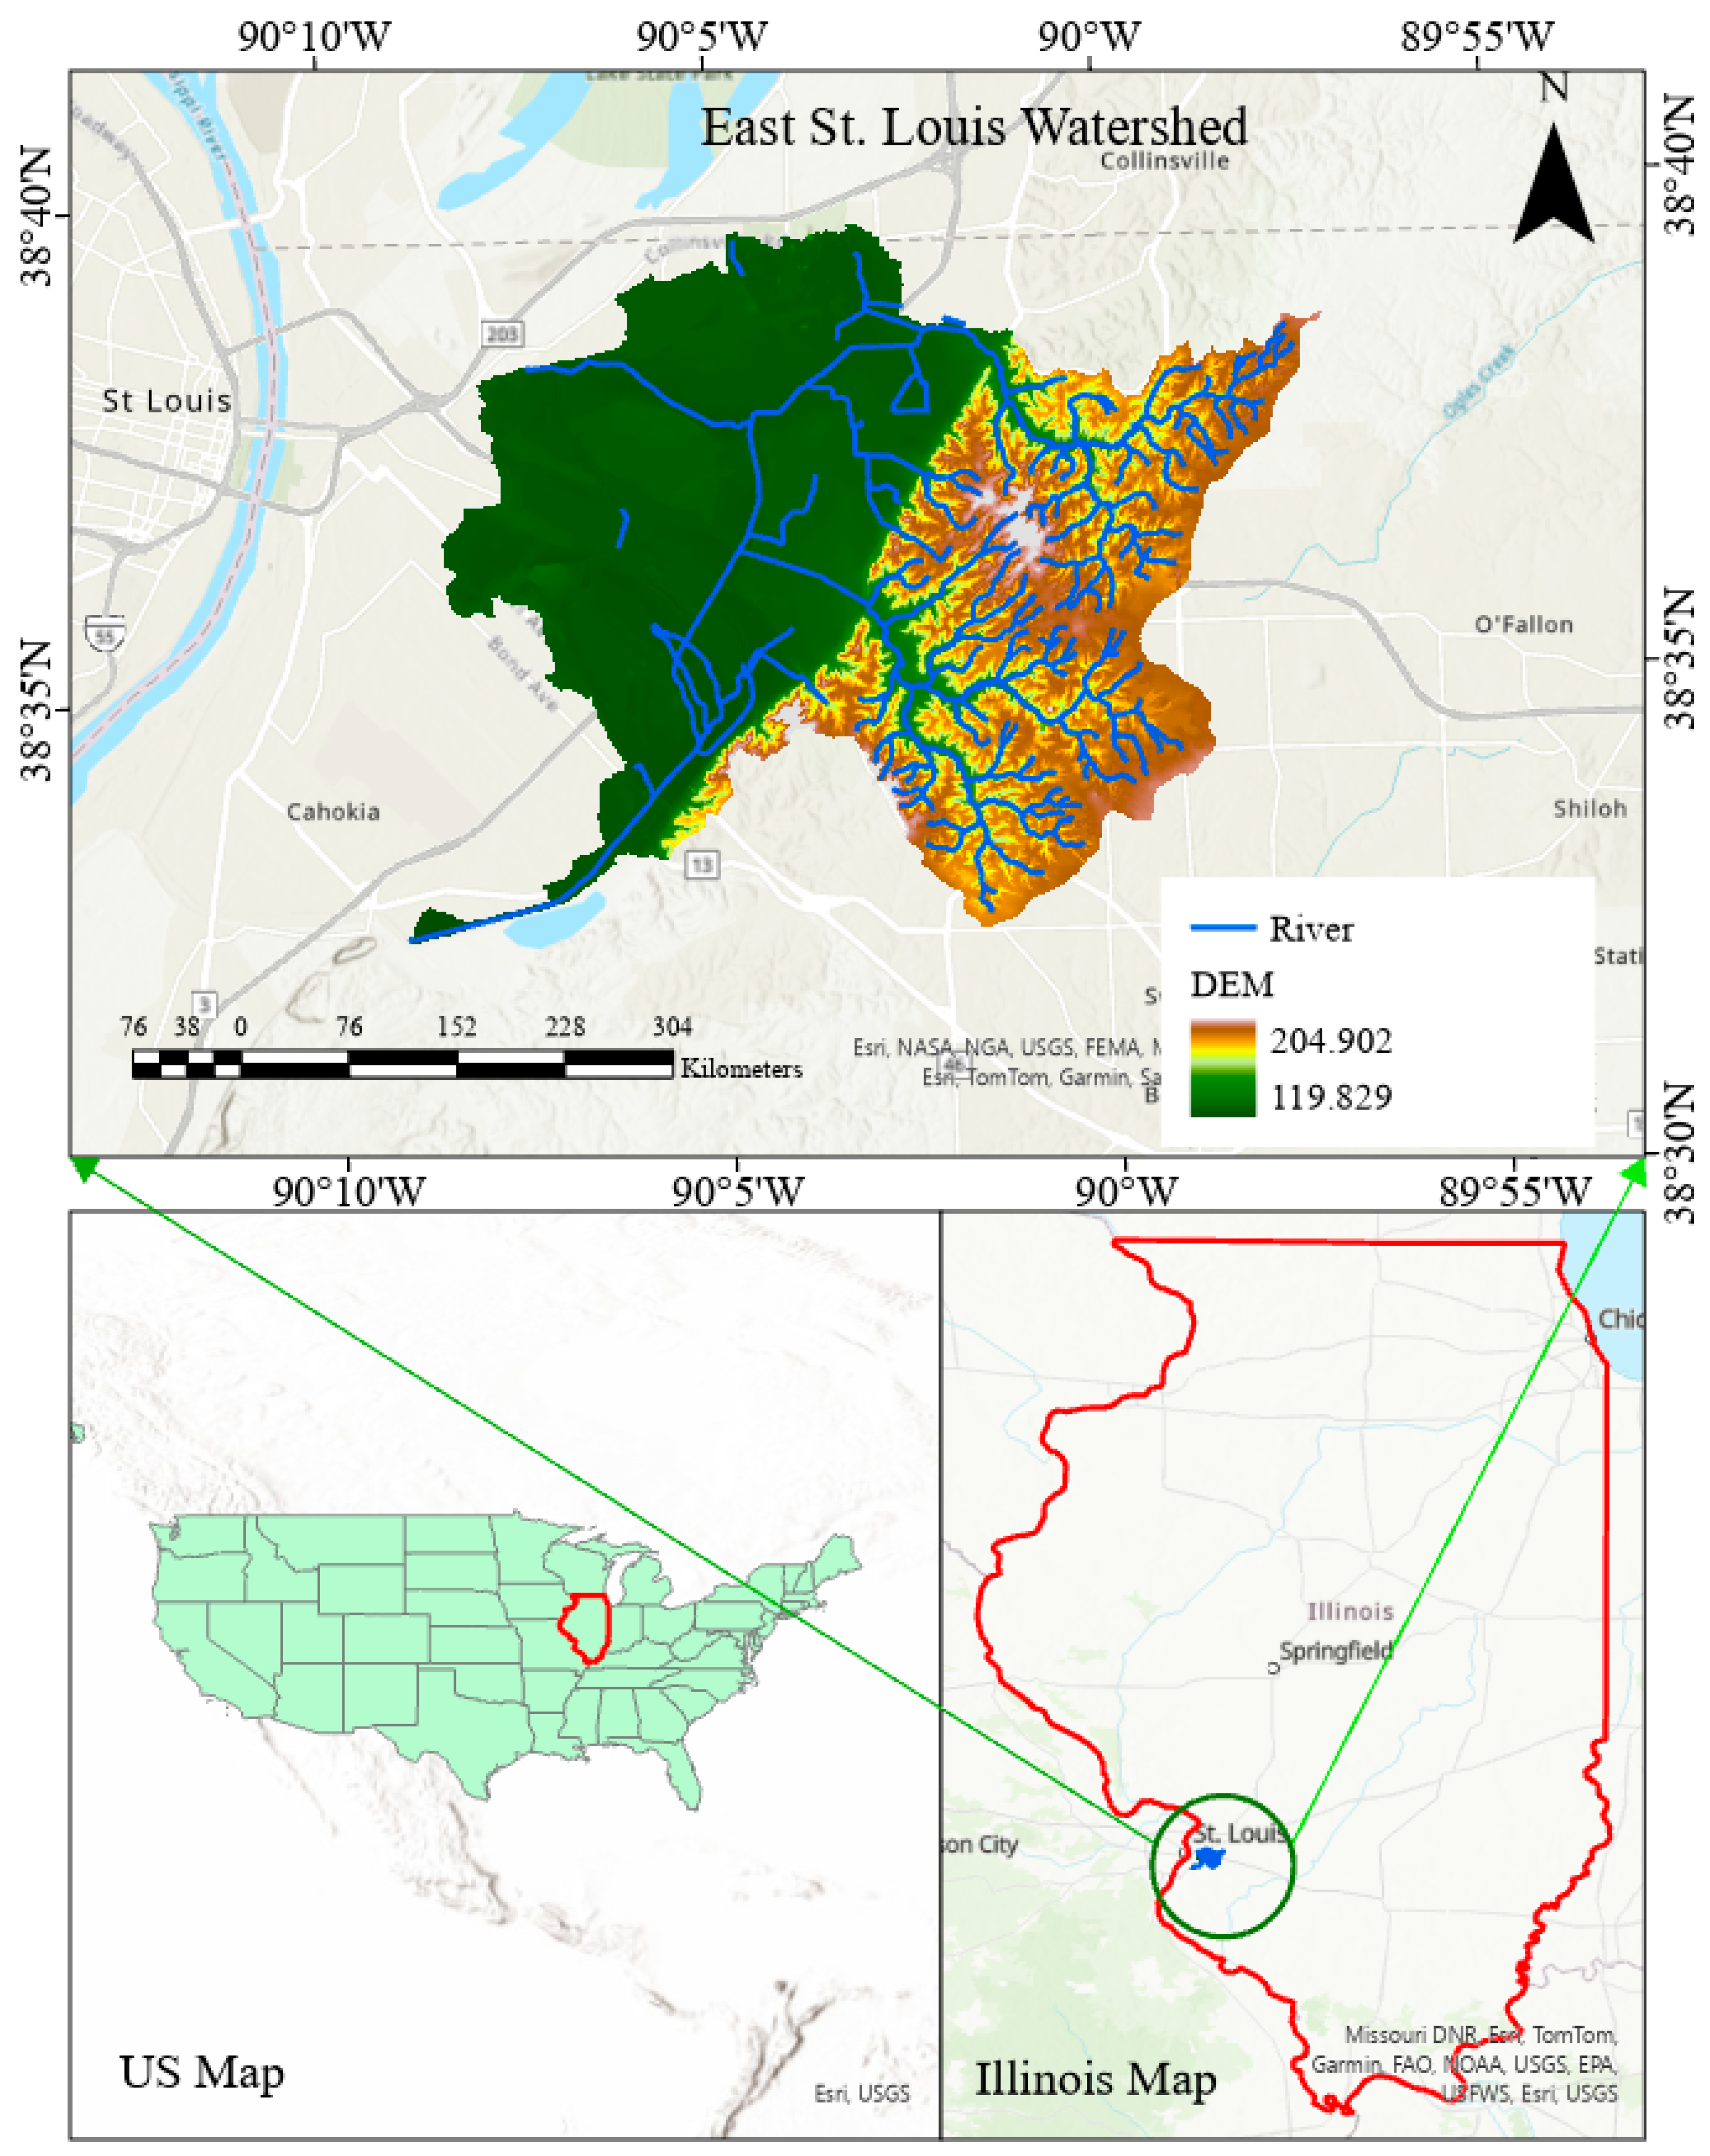
2.1. Study Area

The methodological approach is applied to the study of East St. Louis, which is located in Illinois, United States. The geographical location of the study area is shown in Figure 1 with the Digital Elevation Model (DEM) and river stretch. The study watershed has a total area of 120 km2 and drains into the Mississippi River. The latitude of the proposed study area ranges from 38°33′00″ N to 38°34′00″ N, and its longitude ranges from 89°57′00″ W to 90°09′00″. The elevation of the study area is from 120 m to 204 m above sea level. The study region has a very high level of urbanization and is primarily comprised of impervious areas. The choice of this study area was driven by the significant annual flooding issue affecting a large population of this region [34]. The watershed has experienced numerous land use changes from the 1990s to the present, increasing the percentage of the built-up area from 23% to 62% between 1987 and 2022.

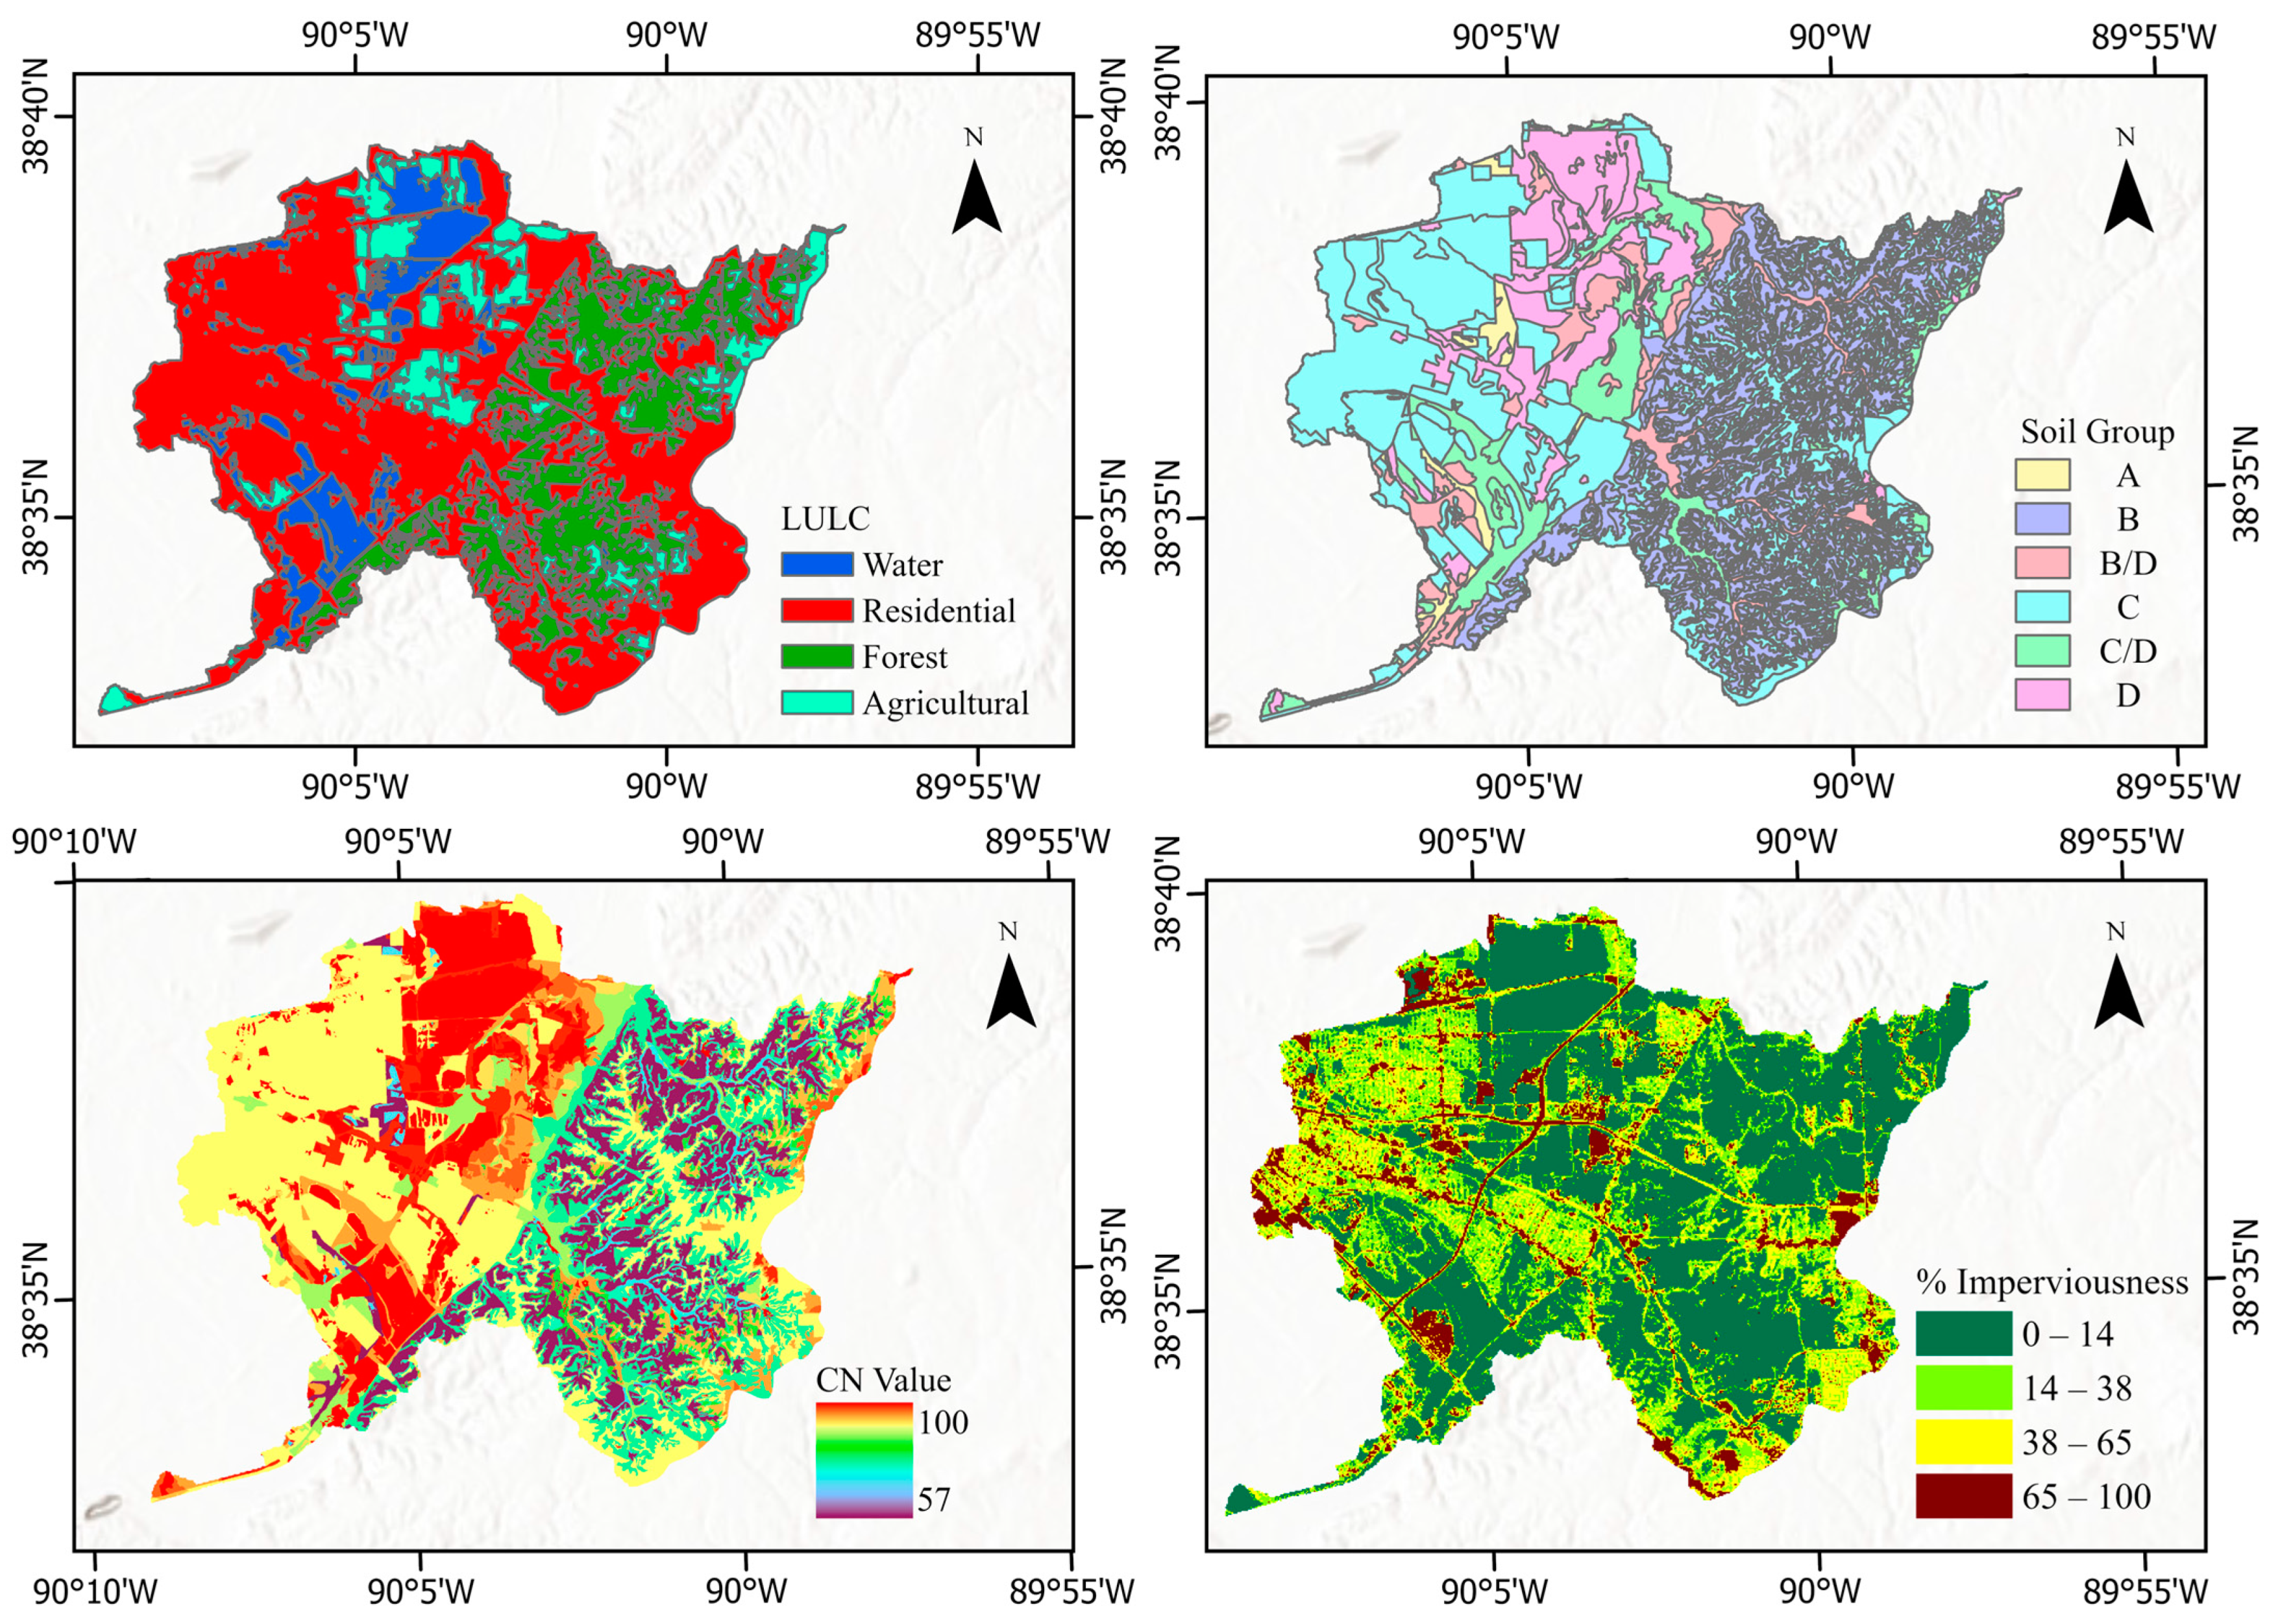
2.2. Watershed Characteristics

DEM, Land Use and Land cover data (LULC), Soil class data (i.e., A/B/C/D), Imperviousness data, and Curve Number grid are important datasets required for the hydrological analysis. A total of 1 m spatial resolution of the DEM data and soil grid map was downloaded from the United States Geological Survey (USGS) website and extracted using the Arc-GIS for the study watershed boundary. Similarly, LULC data were obtained from the Multi-Resolution Land Characteristics website and retrieved using Arc-GIS with study area boundary. The Curve Number (CN) grid file, a crucial loss method parameter in hydrologic modeling, was created using soil class and LULC datasets. Curve Number (CN) values play an essential role in hydrological modeling by serving as critical indicators for estimating various hydrological parameters and delineating the characteristics of sub-basins. Figure 2 shows CN values applied in the model to enhance the understanding of the hydrological processes within the study area.
These CN values are numerical representations that represent the land cover, soil type, and land use characteristics of a specific area. CN values range from 0 to 100, with lower CN values typically associated with surfaces that are less prone to runoff (such as forests or wetlands), while higher CN values are linked to surfaces that generate more runoff (like urban areas or compacted soils).

2.3. NARCCAP Climate Model

This study utilized NARCCAP data to design projected future storm depths for the study area. The NARCCAP datasets are generated by four GCMs and further regionalized by six RCMs to generate regional-scale climate reduction. These datasets are accessible at 50 km geographical and 3 h temporal resolutions. The uncertainty in the predictions by these climate models is highly dependent on the climate change scenarios and boundary conditions. To establish boundary conditions for RCMs over a historical period of 30 years (1971–2000) and a future period of 30 years (2041–2070), data from GCMs were used based on the A2 Emissions Scenario, which was created following the guidelines of the Intergovernmental Panel on Climate Change [31].
NARCCAP has consistently produced climate model data using different GCM and RCM combinations. The current study analyzed 14 sets of NARCCAP historical and future climate data that were produced by combining two timescales of the Community Atmosphere Model, Version 3 of the National Center for Atmospheric Research (NCAR GCM, CAM3), and the atmospheric model (AM2.1) of the Geophysical Fluid Dynamics Laboratory (GFDL). These sets of data were generated as of December 2021. Table 1 shows the list of NARCCAP data used in this investigation.

2.4. NCEP North American Regional Reanalysis (NARR)

The effectiveness of the NARCCAP data was validated using rainfall depth obtained from the NCEP North American Regional Reanalysis (NARR) historic rainfall data. Previous researchers also employed a comparable methodology and validated the effectiveness of the NARCCAP data by comparing them with historical rainfall data from the NARR [35]. The NARR rainfall data consist of high-resolution gridded long-term historic datasets that span a time range from 1979 to the present. NARR is a dynamically consistent and high-resolution dataset based on the assimilation of numerical land surface models and historic observations [36]. The observation data are based on various sources that include surface observations, radars, satellites, and radiosondes. As a result of this, NARR records outperform past global reanalysis. With enhanced atmospheric circulation throughout the troposphere, NARR has efficiently assimilated the land and the atmospheric records [36]. The NAAR precipitation data have a 32 km geographical resolution and a 3-hourly temporal resolution. The NARR statistics for the years 1979 to 2000 were utilized in the analysis because of the availability of NARCCAP historical data up to the year 2000.

3. Methodology

There are three phases in the proposed research methodology to evaluate the BMPs’ hydrologic efficacy in controlling runoff during climate-induced flooding events. In the first phase, future projected storm depth is obtained by performing a probability frequency on NARCCAP future data. In the second phase, the projected precipitation depth was applied to the PCSWMM model with the SWMM 5.1.013 hydrology and hydraulics engine to analyze the change in peak runoff and flood volume in the watershed due to future climate change. In the last phase, different BMP options are introduced in a PCSWMM model to evaluate their effectiveness during climate-induced flooding events (Figure 3).

3.1. Design Depth

The objective of this study was to evaluate the impacts of climate change on rainfall events that occur once every 100 years with a duration of 6 h. The design storm depths were established using one historical climate-model scenario from NARR and 14 historical and future climate-model from NARCCAP at the grid scale. The 6 h 100-year design storms were computed using the generalized extreme value (GEV) probability distribution method. To obtain the 6-hourly rainfall data, the climate model data were converted using a 6 h window as it was available in a 3-hourly temporal scale. Regional frequency analysis (RFA) was implemented to expand the size of the climate model data obtained in gridded forms from nearby homogeneous grids. The L-Moments were employed to compute the three GEV parameters from the annual maximum data series. A comparison was made between the NARCCAP model data and NARR 100-year design depths. Design depths from the NARCCAP model data that exceeded the NARR design depth were removed for further analysis. This helps prevent potential biases or inaccuracies in the climate model data from skewing the analysis results, ensuring that the conclusions drawn from the comparison are more robust and representative of real-world conditions.
In the current study, the grid-scale climate data were converted into point observations utilizing the delta change method (DCM), considered a simplified approach [32]. DCMs are considered to be a useful tool for assessing the hydrological impacts of climate change, as they provide critical details straightforwardly and intuitively [33]. The delta change factor for a particular NARCCAP model was established based on the ratio between the predicted future design depth and the historical design depth. Additionally, the areal reduction factors were held identical for a proposed study area, duration, and return period when investigating future projected extreme rainfall depth, as proposed by [32]. The consideration of these factors is critical for accurately analyzing future projected extreme rainfall depths and their potential hydrological impacts.

3.2. Hydrologic Modeling

The Storm Water Management Model (SWMM) model was chosen in this study for calculating rainfall–runoff, routing floods, and applying BMPs in the urban watershed. SWMM was created by USEPA and is a dynamic rainfall–runoff analysis tool applied for single and continuous events analysis of runoff quantity and quality [37,38]. This study used PCSWMM, a GIS-based version of EPA SWMM created by Computational Hydraulics International (CHI), for rainfall–runoff simulation. The hydrologic and hydraulic model in the PCSWMM was created with the integration of extracted data from Arc-GIS and HEC-RAS models. In the first steps, DEM data, CN grid, and percentage Imperviousness grid were prepared in the Arc-GIS and imported to the PCSWMM model. In the second step, the Ras mapper tool in HEC-RAS was used to create the centerline, bank lines, and cross-section. The HEC-RAS-generated river geometry was directly imported into PCSWMM as conduits, transects, and junctions. In the final steps, Arc-GIS developed DEM, and HEC-RAS-generated river characteristics were used to delineate the sub-catchments in the PCSWMM model. Similarly, sub-catchment parameters, including surface roughness, imperviousness, depression storage, and routing features, were evaluated using sub-catchment layers and land-use layers. Average watershed slopes for each sub-watershed were calculated using DEM, and Curve Number parameters for the SCS–Curve Number technique were calculated using the soil and land use map for each sub-watershed.

3.3. BMP Installation

The type of BMP installation in any region depends upon the watershed characteristics of the study location, such as topography, soil group, impervious percentage, and watershed area [12,39]. The study area is highly urbanized, with a greater concentration of residential houses, parking lots, and impermeable roads. Therefore, this study uses Permeable Pavement, infiltration trenches, and green roofs in the impervious regions of the watersheds that consist of parking lots, impervious roads, and buildings to mitigate the flood peak regionally in the watershed. In this study, 30% area of each sub-catchment was replaced with the respective BMP in each BMP scenario. This percentage aligns with the average imperviousness percentage observed within each sub-basin, ensuring a consistent and contextually relevant application of BMPs across the study area. The BMPs implemented in the study were global instead of designed for specific local conditions. By implementing these BMPs, the study aimed to increase the amount of water infiltrated into the groundwater system and reduce the amount of surface runoff. The surface, pavement, soil, storage, underdrain, and drainage material layers were used to derive the design parameters for each BMP (Table 2).
Permeable pavements, infiltration trenches, and green roofs are all commonly used BMPs in urban watersheds and stormwater infrastructures as flood management strategies [40,41,42,43,44]. Permeable pavements are designed to replace impermeable surfaces such as walkways, roadways, and parking lots, allowing for stormwater infiltration through the top permeable layer and underlying structures. These structures typically include a storage layer and a porous pavement layer, with an underdrain system at the bottom of the storage layer. The stored water can then be infiltrated into groundwater networks or used for stormwater harvesting. Infiltration trenches, on the other hand, are trenches filled with stone or gravel that allow stormwater infiltration into the ground. They are typically used to treat and store stormwater runoff from impervious surfaces such as roofs and parking lots. To maximize their effectiveness, infiltration trenches can also be combined with other stormwater management techniques, such as green infrastructure and Permeable Pavements.
Green roofs, consisting of a vegetation layer, a soil layer, and a storage layer with an underdrain, can also be used as a flood management strategy. Green roofs manage stormwater and provide various other benefits, such as reducing the urban heat island effect and improving air quality. The roof runoff can be collected on the green roof and stored in layers before entering the conventional drainage system via underdrains or overflow components.

4. Results and Discussions

4.1. Verification of NARCCAP-Generated Storm Depths

This study applied the NARCCAP climate model to calculate the historic and future projected 100-year 6 h storm depths. The effectiveness of the NARCCAP climate models was subsequently verified using the NARR datasets. The historical and future projected storm depths were determined based on 14 NARCCAP datasets, which included 12 models of RCMs and GCMs and two-time slices. In conjunction with the NARR 100-year, 6 h historical depths, these datasets were used to calculate the future projected 100-year, 6 h design depths, as presented in Table 1. Figure 4 displays a comparison between the design depths for both historical and future projected events. The x-axis shows the 100-year, 6 h historical depths, and the y-axis shows the 100-year, 6 h future projected storm depths. A vertical red dashed line in the figure marks the NARR 100-year, 6 h historical depth. The historical depths from eight NARCCAP models, including CRCM-CCSM, CRCM-CGCM3, GFDL-ECP2, HADCM3-ECP2, MM5I-CCSM, WRFG-CGCM3, HRM3-HADCM3, and Timeslice CCSM, are presented on the left side of the vertical axis in Figure 4 as they were deemed relevant for the subsequent analysis as they were lower than the historical depths obtained from the NARR dataset. On the right side of the vertical line in Figure 4, the historical depths of 100-year, 6 h duration from six NARCCAP datasets, including RCM3-CGCM3, RCM3-GFDL, MM5I-HADCM3, HRM3-GFDL, WRFG-CCSM, and Timeslice GFDL, were determined to be greater than the NARR historical depths and were excluded from further analysis. Similarly, the label in Figure 4 shows the results of the delta change factor (DCF). The delta change factor ranges from 0.87 to 1.75, suggesting possible changes in the 100-year, 6 h depth in the future. One of the NARCCAP models, GFD-ECP2, showed a negative change (i.e., DCF = 0.87) and was also rejected for further analysis.

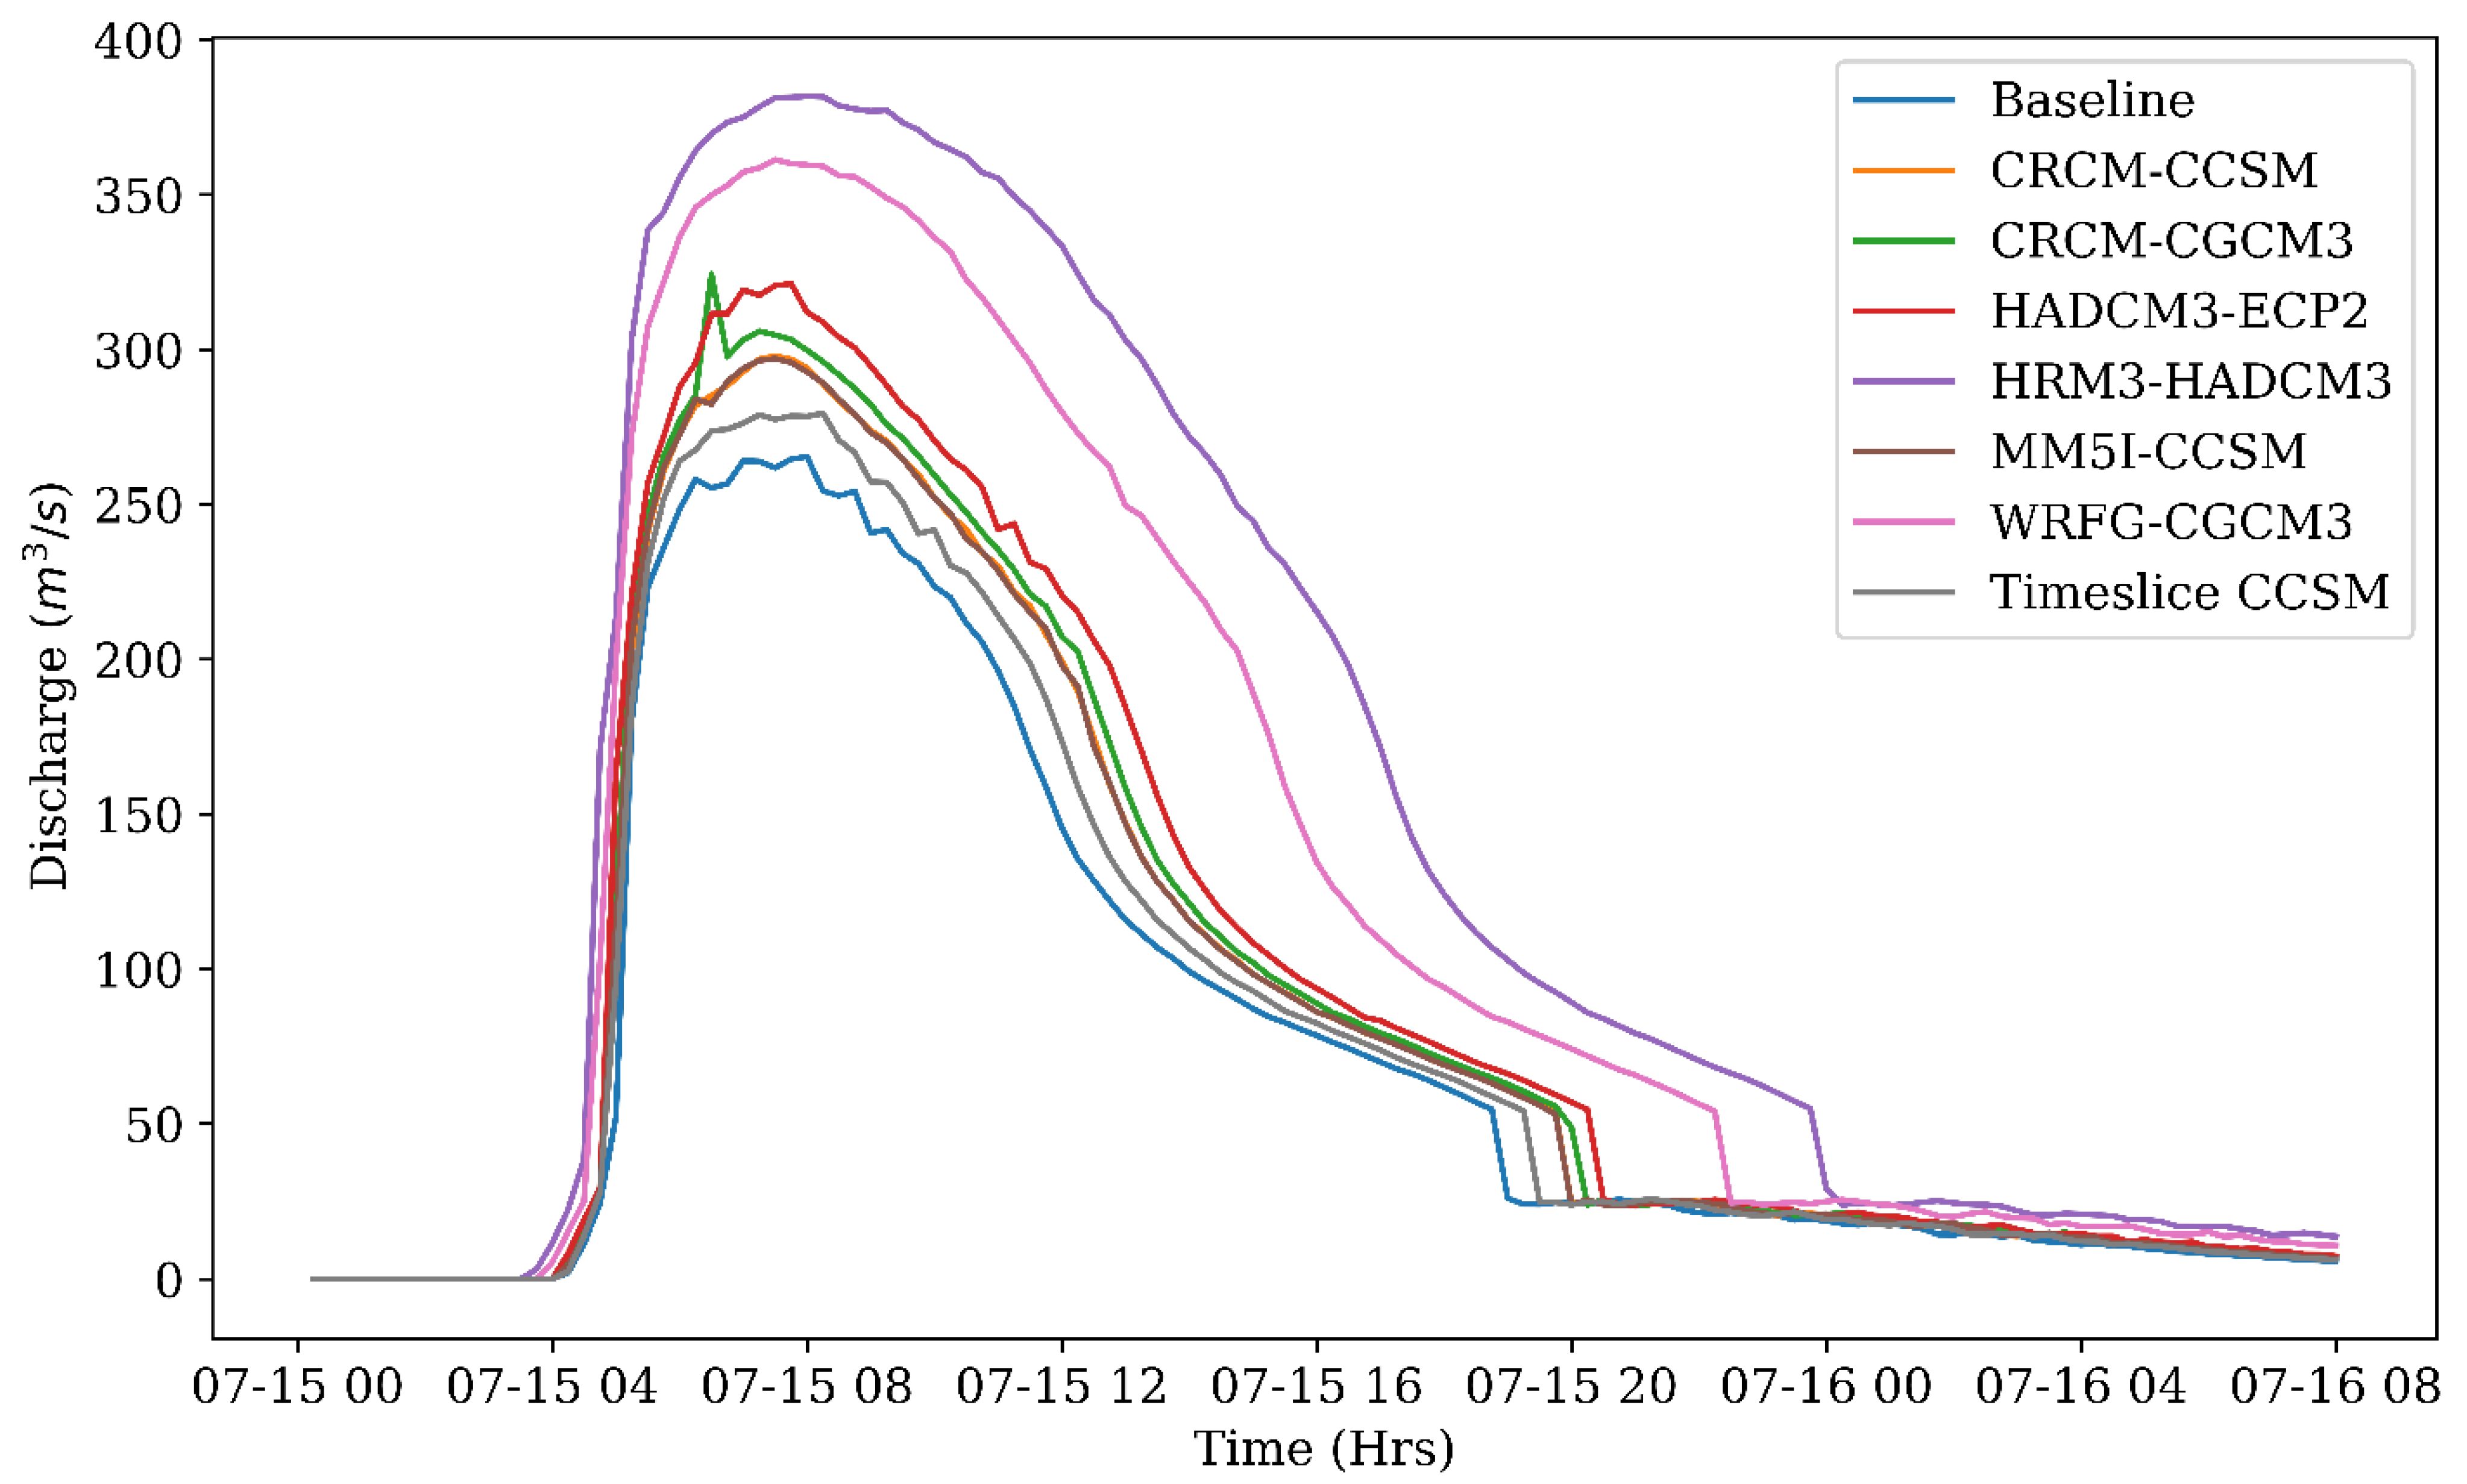
4.2. Streamflow Variability Due to Climate Change

This study generated a set of seven climate sensitivity models by multiplying 100-year 6 h storm depths with delta change factors, which were approved from NARR climate analysis. The resulting flow hydrographs for each model and the baseline flow (i.e., without climate change) were computed (Figure 5). The outcomes presented in Figure 5 indicate a noticeable level of uncertainty among the NARRCAP models. Four of the seven climate variability scenarios (CRCM-CCSM, CRCM-CGCM3, Timeslice CCSM, and HADCM3-ECP2) showed only minor differences from the baseline scenario, with peak discharge ranging from 279 m3/s to 321 m3/s. However, two scenarios (WRFG-CGCM3 and HRM3-HADCM3) demonstrated significantly higher peak discharges of 361 m3/s and 382 m3/s, respectively.
Similarly, the present study investigated the potential impacts of climate change on flooding by analyzing the percentage increase in peak discharge and flood volume under different climate change models. Figure 6 shows the percentage increase in flood volume and peak discharge during different climate change scenarios. The study found that peak discharge increases ranged from 5% to 43% under climate change scenarios, with the severity of climate change being more evident in the flood volume increase. The flood volume increased by 8% to 94% for the seven climate change scenarios compared to the baseline scenario. The Timeslice CCSM scenario showed less peak discharge and flood volume increase, with only 5% and 8% increases, respectively. The study found that under the CRCM-CGCM3 scenario, peak discharge is expected to increase by 22%, while flood volume is expected to increase by 20%. The HRM3-HADCM3 scenario demonstrated the highest severity of extreme events in the future, with peak discharge expected to increase by 43% and flood volume expected to increase by 94%. Similarly, the HADCM3-ECP2, MM5I-CCSM, and WRFG-CGCM3 scenarios demonstrated likely peak discharge increases of 21%, 11%, and 36%, respectively, with corresponding flood volume increases of 27%, 16%, and 64%. The observed increase in peak discharge and flood volume suggests that floods are becoming more intense and frequent, which could lead to severe impacts on infrastructure, ecosystems, and human populations.

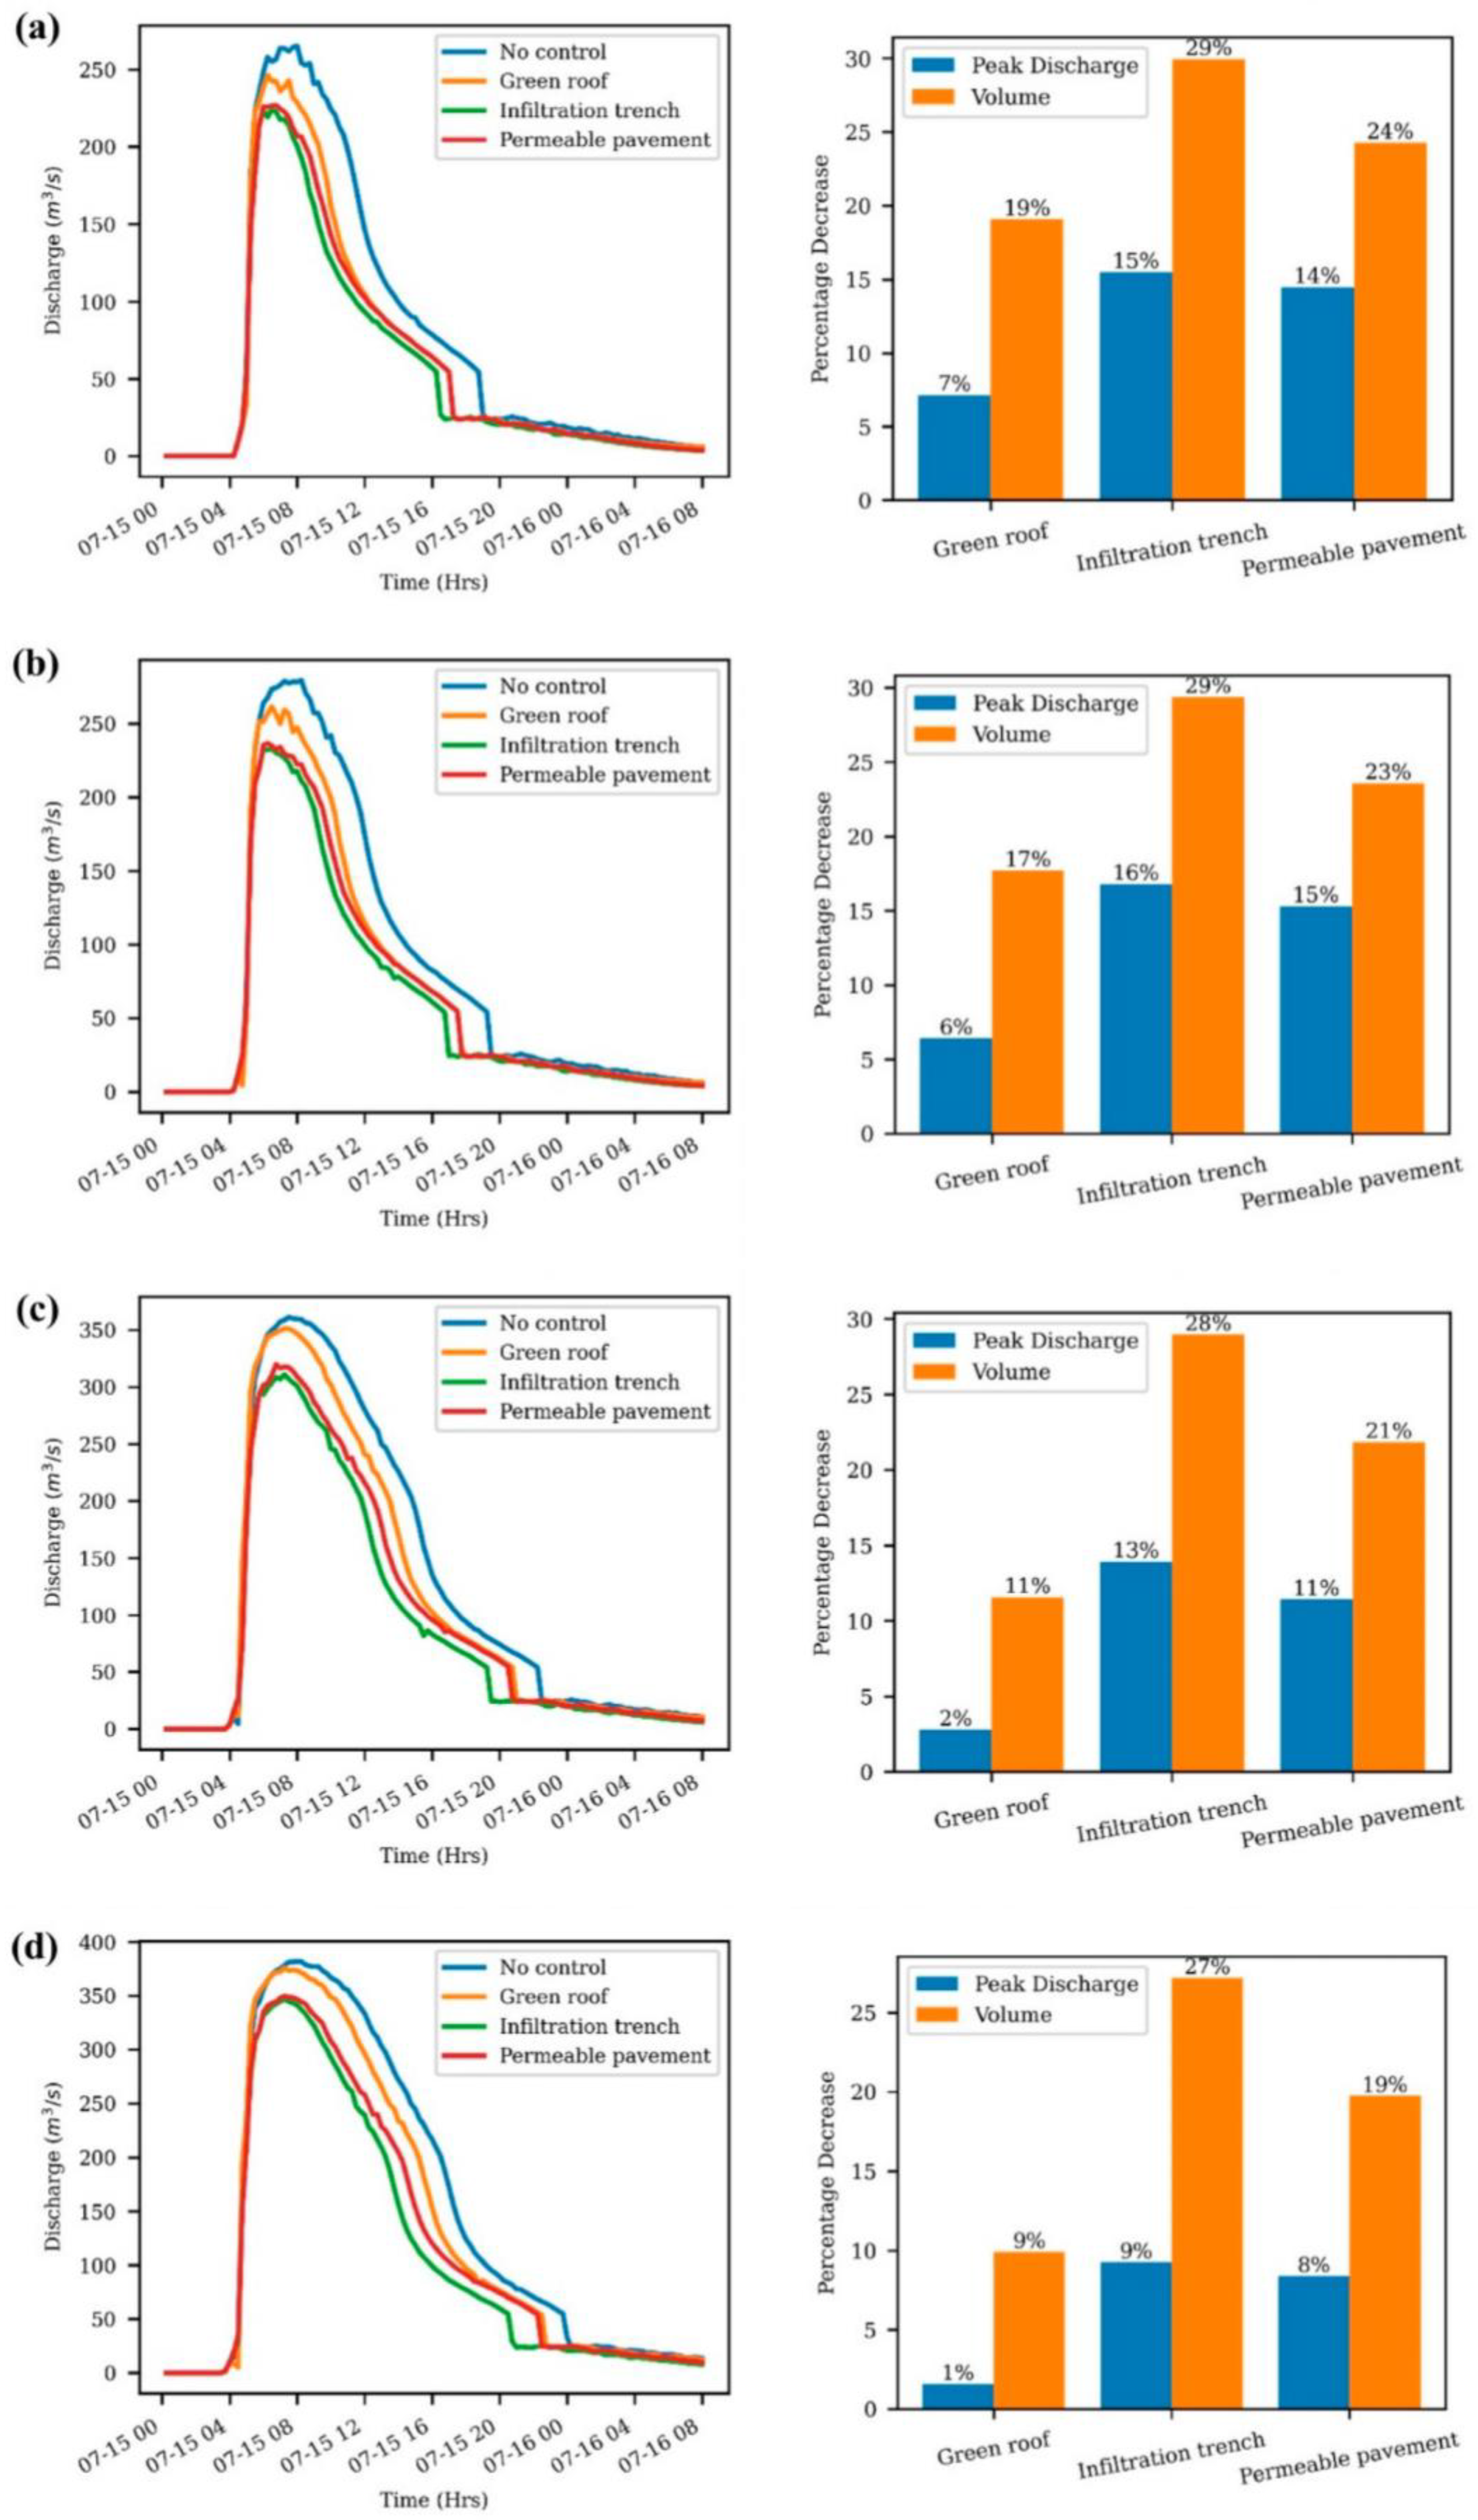
4.3. Performance of Best Management Practices on Climate Change Scenarios

The preceding section highlighted the potential impact of climate change scenarios on urban watersheds, specifically with regard to an increase in peak flow and flood volume. This section aims to analyze the potential benefits of Best Management Practices (BMPs) in mitigating the effects of climate change-induced extreme floods. To achieve this objective, this study evaluates the effectiveness of three types of BMPs, namely green roof, infiltration trench, and Permeable Pavement, across four scenarios. The four scenarios considered in this study include the present scenario and three climate change scenarios. The present scenario is characterized by 100-year 6 h storm events in the absence of climate change. In contrast, the three climate change scenarios are Timeslice CCSM, WRFG-CGCM3, and HRM3-HADCM3, representing varying degrees of climate change severity. Specifically, the Timeslice CCSM scenario is the least severe, with a DCF of only 1.06. In comparison, the WRFG-CGCM3 and HRM3-HADCM3 scenarios are considered the most extreme, with DCF values of 1.49 and 1.75, respectively. This study evaluates the effectiveness of the selected BMPs across all four scenarios to provide insights into their potential benefits in mitigating the effects of climate change-induced extreme floods in urban watersheds.
Overall, the results demonstrated that the BMPs were effective in reducing the peak flood and flood volume for all four climate change scenarios (Figure 7).
The effectiveness of BMPs was higher for the present condition (i.e., 100 years 6 h storm events) without considering the climate changes. The Green Roof BMP technique resulted in a 7% reduction in peak discharge and a 19% reduction in volume, while the infiltration trenches LID technique resulted in a 15% reduction in peak discharge and a 29% reduction in volume. The Permeable Pavement implementation resulted in a 14% reduction in peak discharge and a 24% reduction in volume. For the climate change scenario of Timeslice CCSM, the Green Roof implementation resulted in a 6% reduction in peak discharge and a 17% reduction in flood volume, while the infiltration trenches resulted in a 16% reduction in peak discharge and a 29% reduction in volume. The Permeable Pavement resulted in a 15% reduction in peak discharge and a 23% reduction in volume. Similarly for the climate change scenario of WRFG-CGCM3, the green roof implementation resulted in a 2% reduction in peak discharge and an 11% reduction in volume, while the infiltration trenches resulted in a 13% reduction in peak discharge and a 28% reduction in volume. The Permeable Pavement resulted in an 11% reduction in peak discharge and a 21% reduction in volume. The performance of BMPs reduced significantly for the most extreme climate change scenarios (i.e., HRM3-HADCM3). The performance of Green Roof dropped to only 1% reduction in peak discharge and a 9% reduction in volume, while the infiltration trenches resulted in a 9% reduction in peak discharge and a 27% reduction in volume. The Permeable Pavement resulted in an 8% reduction in peak discharge and a 19% reduction in volume.
These results suggest that implementing BMPs can effectively alleviate the impacts of climate change on flood control. The results revealed that the infiltration trenches performed significantly higher for all four climate change scenarios, and the green roof was the least effective for four climate change scenarios compared to the infiltration trenches and Permeable Pavement. The average peak discharge reduction performance of green roofs, infiltration trenches, and Permeable Pavements were 4%, 13%, and 12%, respectively. Similarly, The average flood volume reduction performance of green roofs, infiltration trenches, and Permeable Pavements were 14%, 28%, and 12%, respectively.
This research demonstrates the potential impacts of climate change on flooding in the urban watershed. The seven climate variability scenarios developed in this study showed significant uncertainty among the NARCCAP models and the results are similar to the previous studies [35,45,46,47]. Five climate change scenarios demonstrated only nominal differences from the baseline scenario (i.e., without climate change), while two scenarios demonstrated significantly higher peak discharge and flood volume values. The study found that the severity of climate change was more evident in the flood volume increase, with an increase of 8% to 94% for the seven climate models compared to the baseline scenario. The observed increase in peak discharge and flood volume suggests that floods are becoming more intense and frequent, which could lead to severe impacts on urban hydrology and infrastructure. Numerous prior investigations identified a noticeable upward trend in the intensity of extreme rainfall events within the United States due to climate change. A study conducted by Hettiarachchi et al., 2018 [48] found that climate change increases the flood peak by up to 35% and flood volume by up to 170% in their study area. This observation resonates with the findings of our study. In a separate examination, Zhu et al. (2012) [49] detected the potential modification of the intensity–duration–frequency curve across six distinct regions in the continental United States. In the majority of these regions, an escalation in the occurrence of extreme events in the future was ascertained. Similarly, recent investigations conducted by Ionno et al. [50] indicate that when projecting climate change effects for the 2070 timeframe, a prevailing trend of augmented flood volumes is anticipated across a substantial expanse of North America. The findings of this study are also consistent with previous research that showed that climate change is likely to increase the frequency and intensity of extreme flooding events [50,51,52,53,54]. The results of this study have important implications for flood risk management and adaptation planning in urban watersheds. The study suggests that current flood management strategies may be insufficient to cope with the potential impacts of climate change on flooding and that new strategies will be needed to reduce the risks posed by flooding.
This study evaluated the effectiveness of three Best Management Practices (BMPs) in mitigating the impacts of climate change-induced extreme floods. The results demonstrated that all the BMP techniques (i.e., green roof, infiltration trench, and Permeable Pavement) were effective in reducing the peak flood and flood volume for all four climate scenarios. This suggests that BMPs can play a crucial role in mitigating the impacts of climate change on flood control. This finding is consistent with previous research that supports the importance of implementing BMPs in urban watersheds to decrease the impact of urban flooding [14,55,56,57,58,59]. The results of a study conducted by Masseroni and Cislaghi 2016 [60] align with our findings, highlighting the substantial benefits of widespread green roof implementation. Their research demonstrates that green roof implementation can lead to remarkable reductions in both peak runoff rates and runoff volumes, with potential decreases of up to 30% and 35%, respectively, when achieving full-scale conversion. Similarly, the studies conducted by Meena et al. 2018 [61] found that the implementation of infiltration trenches and Permeable Pavement can reduce the flood volume by 7.34% and 17.06%, respectively. In addition, the results suggested that the effectiveness of BMPs varies significantly for different climate scenarios. For example, the BMPs were most effective for the present condition without considering climate change, with the infiltration trench technique resulting in the highest reduction in peak discharge and flood volume. However, the performance of BMPs reduced significantly for the most extreme climate change model (HRM3-HADCM3). This finding is consistent with some previous studies which suggest that the effectiveness of BMPs may be limited in extreme climate change scenarios, and this result also highlights the importance of considering the severity of climate change when evaluating the potential benefits of BMPs [62,63,64]. The performance of the green roof technique was the least effective among the BMPs evaluated for all four climate change scenarios. This suggests that the effectiveness of green roof BMPs may be limited in reducing peak flow and flood volume compared to other BMPs, such as infiltration trenches and Permeable Pavement. Similar research conducted by Ercaloni et al., 2018 [18] highlights the potential of green roofs to effectively reduce both peak flow rates and total volume within urban drainage networks, particularly for smaller, more frequent storms. Moreover, their findings reveal that the urban system’s response to green roof implementation is non-linear based on the extremity of flood frequency. This suggests that green roofs may not be the most effective BMP for mitigating the high impacts of climate change on urban watersheds.
While this study provides valuable insights into the potential impacts of climate change on flooding events and the effectiveness of adaptation strategies, it is important to acknowledge certain limitations within the current study. Firstly, the analysis relies on climate models to project future flood scenarios, which inherently come with uncertainties and limitations in accurately capturing regional-scale hydrological processes. Additionally, the latest IPCC report (IPCC AR6) highlights the challenge of attributing flooding events solely to climate change, citing low confidence in the direct link between climate change and the increase in flooding events [1]. This highlights the complexity of understanding the drivers of flooding and the need for further research to determine the various contributing factors. Furthermore, this study focuses on a specific geographical area, and the results may not be generalizable to other areas with different climatic and hydrological characteristics. Further, while this analysis considered the influence of climate change on flood severity, the complex interactions between land use changes, infrastructure development, and climate change effects require further investigation. Future research efforts should address these limitations and provide a more comprehensive understanding of the dynamics driving flooding events in the context of climate change.

5. Conclusions

The primary objective of this scientific study was to quantify the impact of climate change on urban watersheds and implement effective Best Management Practices (BMPs) to mitigate the effects of climate-induced extreme floods. To achieve this objective, the study employed the North American Regional Climate Change Assessment Program (NARCCAP) climate model to project future climate change severity. Additionally, the study utilized the PCSWMM model to develop a robust hydrological model for urban watersheds. The study also evaluated the efficacy of three BMPs: green roof, infiltration trench, and Permeable Pavement, against four climate change scenarios. The results of the study are outlined below:
  • The projected 6 h 100-year return period precipitation storm for the East St. Louis watershed is expected to increase by at least 1.06 (determined by Timeslice CCSM) up to a maximum of 1.75 (determined from HADCM3-HRM3). This result highlights the uncertainty in the NARCCAP model’s climate change predictions for the East St. Louis watershed.
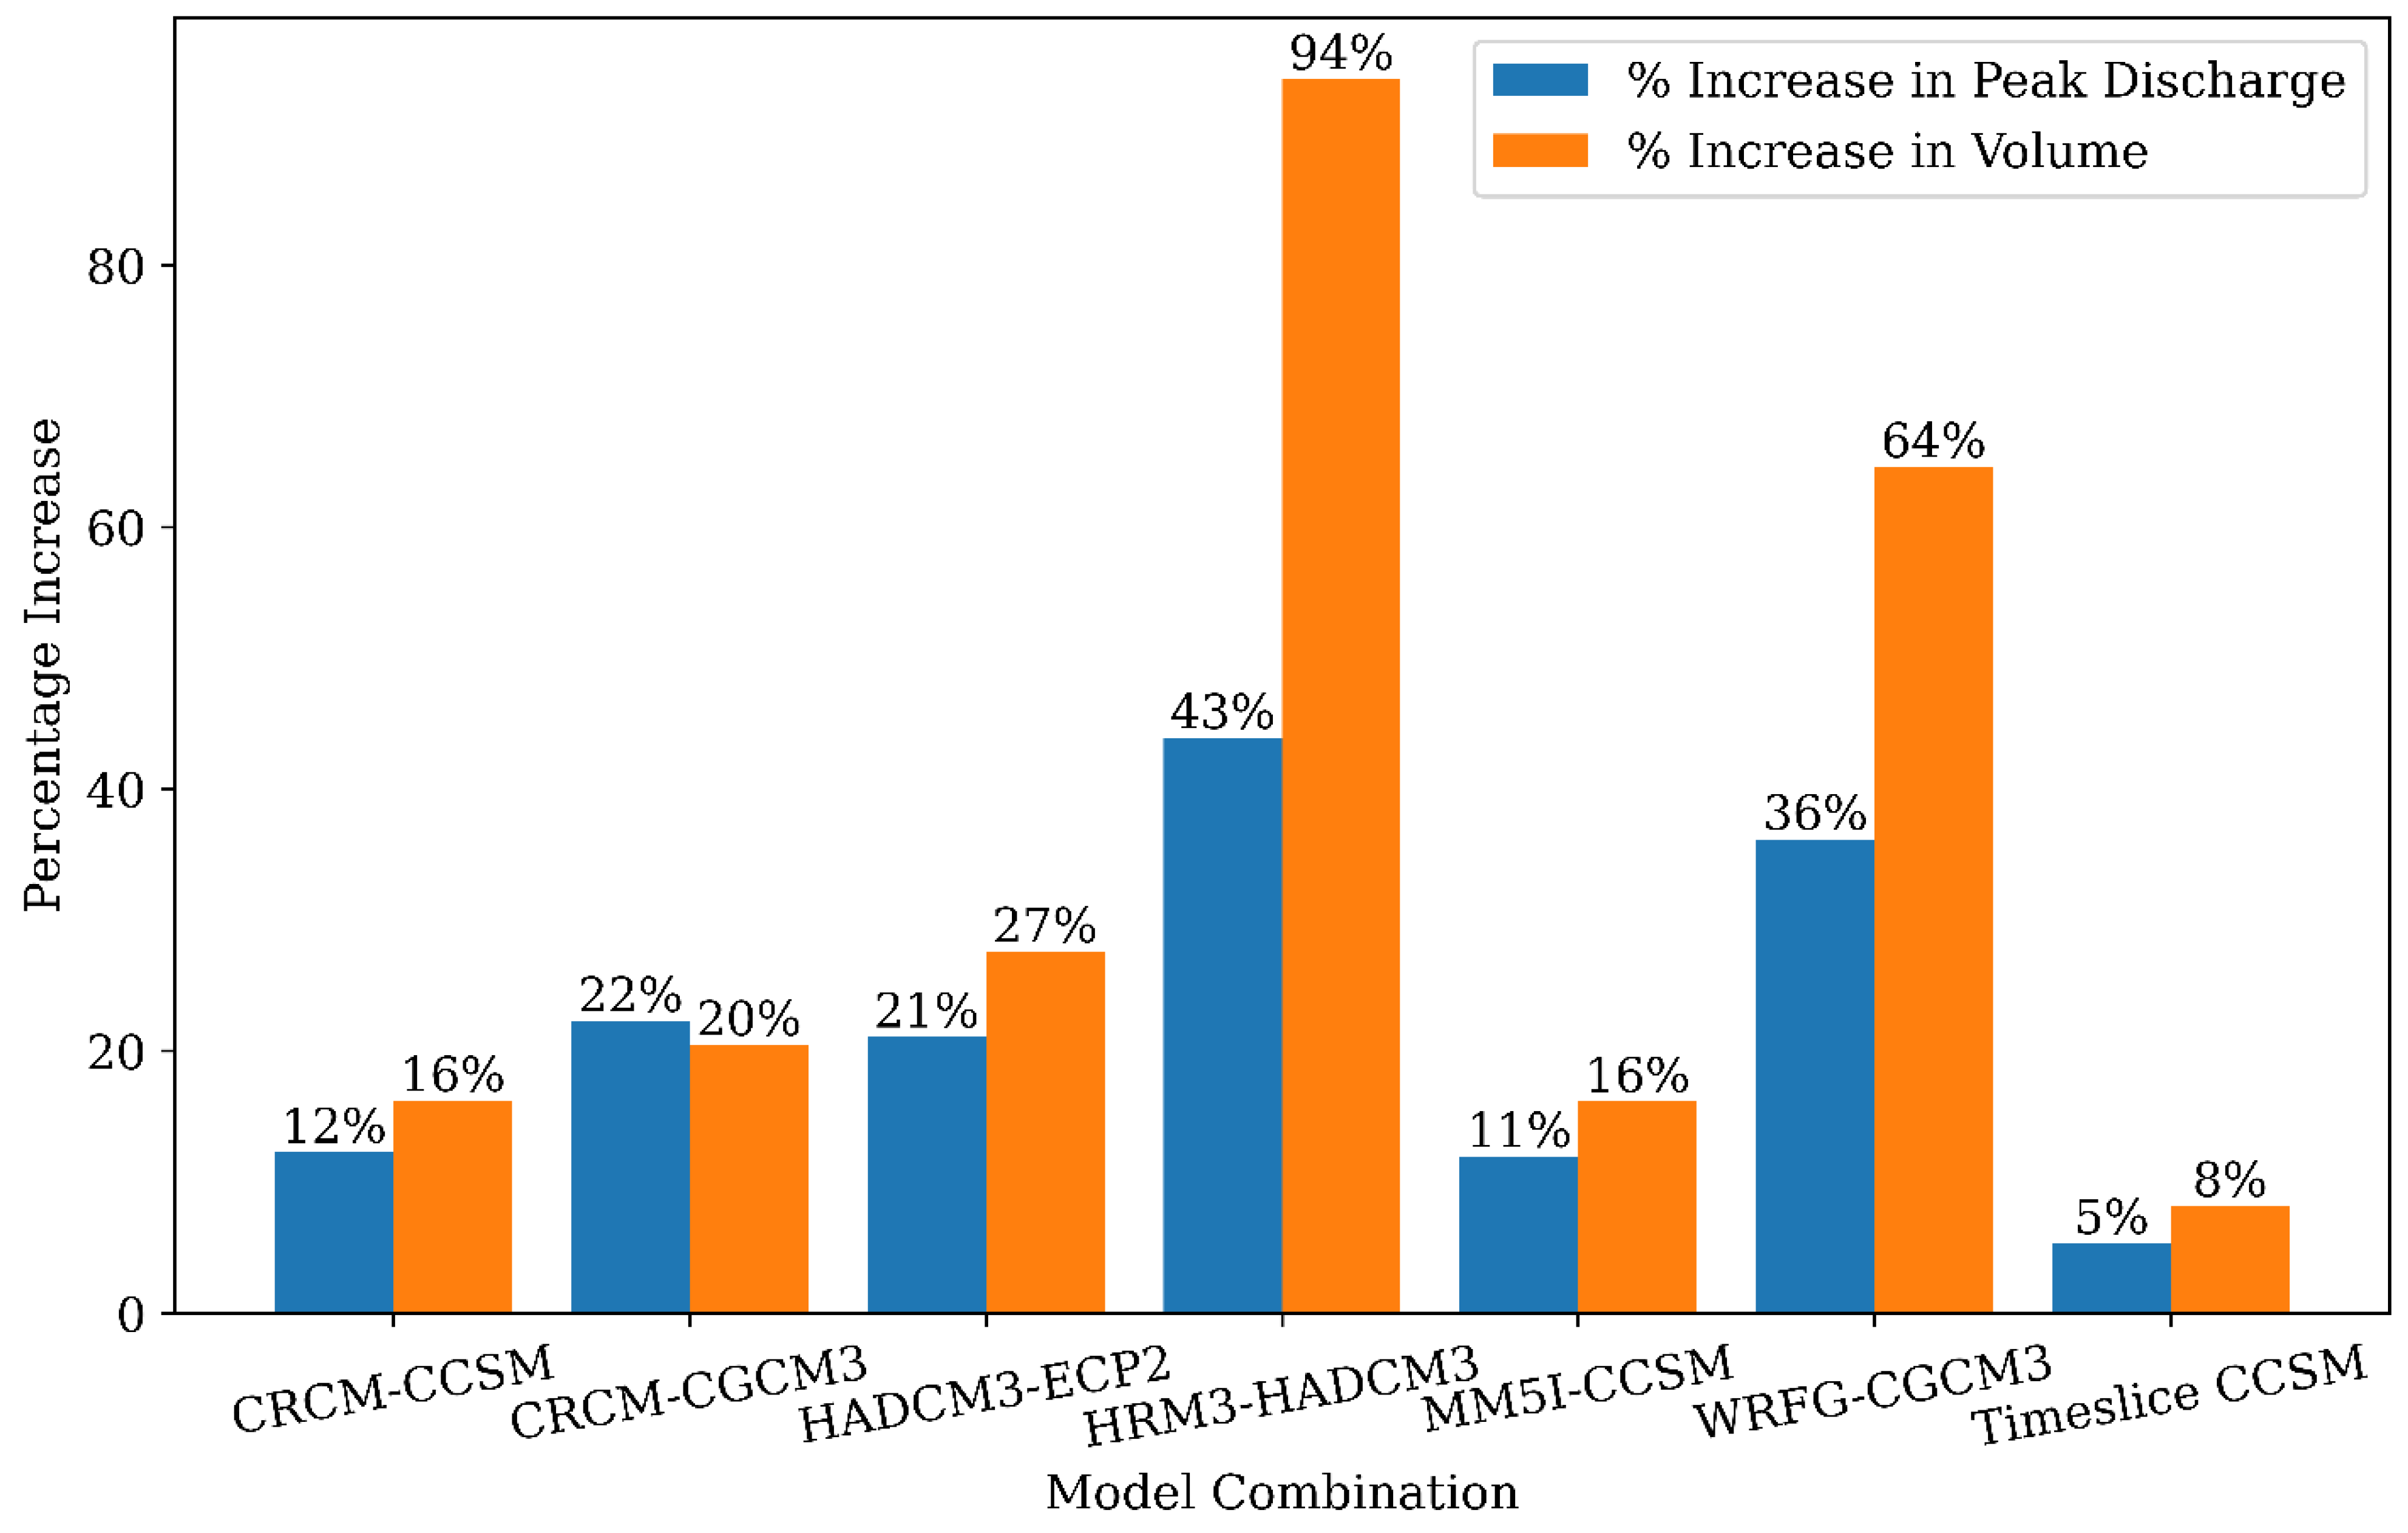
  • The hydrological simulation revealed that peak discharge ranges would increase by 5% to 43%, and flood volume ranges would increase by 8% to 94% for different NARCCAP-generated future climate change scenarios. Furthermore, the results demonstrate that an increase in flood volume indicates the severity of climate change compared to a peak discharge increase.
  • The Best Management Practices (BMPs) were effective in reducing peak discharge and flood volumes for all climate change scenarios. However, their performance varies with the severity of the climate change event. The results indicate that BMP effectiveness decreases as the severity of extreme flooding events increases. Infiltration trenches provide the most significant flood reduction benefit for all climate scenarios, while Permeable Pavement consistently demonstrates benefits for all four climate scenarios. However, green roof implementation provided the least benefit in flood mitigation, with negligible peak discharge reduction for the most severe climate change events. The average peak discharge reduction performance of the green roof, infiltration trenches, and Permeable Pavement was 4%, 13%, and 12%, respectively. Similarly, the average flood volume reduction performance of the green roof, infiltration trenches, and Permeable Pavement was 14%, 28%, and 12%, respectively.
In conclusion, this research emphasizes the significance of considering the potential impacts of climate change on urban watersheds when designing and implementing Best Management Practices. Moreover, it provides valuable insights into the performance of different BMP options and can be used to guide decision-making for urban planners and engineers. Overall, this study contributes to the ongoing research on climate change adaptation and urban watershed management and highlights the need for continuous steps to address the challenges of climate change and extreme flooding events.

Author Contributions

Conceptualization, A.K. and A.B.; methodology, A.K., A.B. and B.T.; software, A.B.; validation, R.B., A.B. and A.S.; formal analysis, A.B. and A.K. writing—original draft preparation, A.B., B.T., A.S., R.B. and A.K.; writing—review and editing. All authors have read and agreed to the published version of the manuscript.

Funding

This research was funded by the University of Illinois System (Award #107688).

Institutional Review Board Statement

Not applicable.

Informed Consent Statement

Not applicable.

Data Availability Statement

All data generated or analyzed during this study are included in this published article.

Acknowledgments

The authors thank the editor and three anonymous reviewers for their insights to enhance the clarity of the manuscript. The authors thank Computational Hydraulics International for providing free academic access to PCSWMM for conducting the current research. The authors would like to thank the University of Illinois System (Award #107688) for providing research support for the current study.

Conflicts of Interest

Amrit Bhusal was employed by Arcadis U.S., Inc., Balbhadra Thakur by FTN Associates, Ltd., and Aruna Shrestha by AECOM Technical Services Inc. The remaining authors declare that the research was conducted in the absence of any commercial or financial relationships that could be construed as a potential conflict of interest.

References

  1. Ranasinghe, R.; Ruane, A.C.; Vautard, R. Intergovernmental Panel on Climate Change Climate Change 2021—The Physical Science Basis: Working Group I Contribution to the Sixth Assessment Report of the Intergovernmental Panel on Climate Change, 1st ed.; Cambridge University Press: Cambridge, UK, 2023; ISBN 978-1-00-915789-6. [Google Scholar]
  2. Brazil—80 Killed in Floods and Landslides in North East—FloodList. Available online: https://floodlist.com/america/brazil-floods-update-pernambuco-alagoas-may-2022 (accessed on 2 December 2023).
  3. India—Heavy Rain and Floods in Gujarat Affect over 1 Million—FloodList. Available online: https://floodlist.com/asia/india-floods-gujarat-july-2022 (accessed on 2 December 2023).
  4. China Flooding: Death Toll Rises in Henan as Passengers Recount Horror of Zhengzhou Subway Floods|CNN. Available online: https://www.cnn.com/2021/07/22/china/zhengzhou-henan-china-flooding-update-intl-hnk/index.html (accessed on 2 December 2023).
  5. Mackenzie, A.A. James Deadly Floods in China, Europe Send Stark Reminder of Climate Change Vulnerabilities. Available online: https://www.insurancejournal.com/news/international/2021/07/22/623788.htm (accessed on 2 December 2023).
  6. Billion-Dollar Weather and Climate Disasters| National Centers for Environmental Information (NCEI). Available online: https://www.ncei.noaa.gov/access/billions/ (accessed on 19 February 2024).
  7. Alfieri, L.; Bisselink, B.; Dottori, F.; Naumann, G.; de Roo, A.; Salamon, P.; Wyser, K.; Feyen, L. Global projections of river flood risk in a warmer world. Earth’s Future 2017, 5, 171–182. [Google Scholar] [CrossRef]
  8. Arnell, N.W.; Gosling, S.N. The impacts of climate change on river flood risk at the global scale. Clim. Chang. 2016, 134, 387–401. [Google Scholar] [CrossRef]
  9. Wu, X.; Wang, Z.; Guo, S.; Liao, W.; Zeng, Z.; Chen, X. Scenario-based projections of future urban inundation within a coupled hydrodynamic model framework: A case study in Dongguan City, China. J. Hydrol. 2017, 547, 428–442. [Google Scholar] [CrossRef]
  10. Mahmood, M.I.; Elagib, N.A.; Horn, F.; Saad, S.A. Lessons learned from Khartoum flash flood impacts: An integrated assessment. Sci. Total Environ. 2017, 601–602, 1031–1045. [Google Scholar] [CrossRef]
  11. Acharya, B.; Joshi, B. Flood frequency analysis for an ungauged Himalayan river basin using different methods: A case study of Modi Khola, Parbat, Nepal. Meteorol. Hydrol. Water Manag. Res. Oper. Appl. 2020, 8, 46–51. [Google Scholar] [CrossRef]
  12. Banjara, M.; Bhusal, A.; Ghimire, A.B.; Kalra, A. Impact of Land Use and Land Cover Change on Hydrological Processes in Urban Watersheds: Analysis and Forecasting for Flood Risk Management. Geosciences 2024, 14, 40. [Google Scholar] [CrossRef]
  13. Mahmoud, S.H.; Gan, T.Y. Urbanization and climate change implications in flood risk management: Developing an efficient decision support system for flood susceptibility mapping. Sci. Total Environ. 2018, 636, 152–167. [Google Scholar] [CrossRef]
  14. Ahiablame, L.; Shakya, R. Modeling flood reduction effects of low impact development at a watershed scale. J. Environ. Manag. 2016, 171, 81–91. [Google Scholar] [CrossRef] [PubMed]
  15. Eckart, K.; McPhee, Z.; Bolisetti, T. Performance and implementation of low impact development––A review. Sci. Total Environ. 2017, 607–608, 413–432. [Google Scholar] [CrossRef]
  16. Ristianti, N.S.; Bashit, N.; Ulfiana, D.; Windarto, Y.E. Bioretention Basin, Rain Garden, and Swales Track Concepts through Vegetated-WSUD: Sustainable Rural Stormwater Management in Klaten Regency. IOP Conf. Ser. Earth Environ. Sci. 2022, 1082, 012029. [Google Scholar] [CrossRef]
  17. Liu, Y.; Engel, B.A.; Flanagan, D.C.; Gitau, M.W.; McMillan, S.K.; Chaubey, I. A review on effectiveness of best management practices in improving hydrology and water quality: Needs and opportunities. Sci. Total Environ. 2017, 601–602, 580–593. [Google Scholar] [CrossRef]
  18. Ercolani, G.; Chiaradia, E.A.; Gandolfi, C.; Castelli, F.; Masseroni, D. Evaluating performances of green roofs for stormwater runoff mitigation in a high flood risk urban catchment. J. Hydrol. 2018, 566, 830–845. [Google Scholar] [CrossRef]
  19. Azis, S.S.A.; Zulkifli, N.A.A. Green roof for sustainable urban flash flood control via cost benefit approach for local authority. Urban For. Urban Green. 2021, 57, 126876. [Google Scholar] [CrossRef]
  20. Zhang, L.; Oyake, Y.; Morimoto, Y.; Niwa, H.; Shibata, S. Rainwater storage/infiltration function of rain gardens for management of urban storm runoff in Japan. Landsc. Ecol. Eng. 2019, 15, 421–435. [Google Scholar] [CrossRef]
  21. de Macedo, M.B.; Lago, C.A.F.D.; Mendiondo, E.M.; Giacomoni, M.H. Bioretention performance under different rainfall regimes in subtropical conditions: A case study in São Carlos, Brazil. J. Environ. Manag. 2019, 248, 109266. [Google Scholar] [CrossRef]
  22. Hu, M.; Zhang, X.; Siu, Y.L.; Li, Y.; Tanaka, K.; Yang, H.; Xu, Y. Flood Mitigation by Permeable Pavements in Chinese Sponge City Construction. Water 2018, 10, 172. [Google Scholar] [CrossRef]
  23. Rodríguez-Rojas, M.; Huertas-Fernández, F.; Moreno, B.; Martínez, G.; Grindlay, A. A study of the application of permeable pavements as a sustainable technique for the mitigation of soil sealing in cities: A case study in the south of Spain. J. Environ. Manag. 2018, 205, 151–162. [Google Scholar] [CrossRef]
  24. Kumar, S.; Guntu, R.K.; Agarwal, A.; Villuri, V.G.K.; Pasupuleti, S.; Kaushal, D.R.; Gosian, A.K.; Bronstert, A. Multi-objective optimization for stormwater management by green-roofs and infiltration trenches to reduce urban flooding in central Delhi. J. Hydrol. 2022, 606, 127455. [Google Scholar] [CrossRef]
  25. Jamali, B.; Bach, P.M.; Deletic, A. Rainwater harvesting for urban flood management—An integrated modelling framework. Water Res. 2020, 171, 115372. [Google Scholar] [CrossRef]
  26. Tamagnone, P.; Comino, E.; Rosso, M. Rainwater harvesting techniques as an adaptation strategy for flood mitigation. J. Hydrol. 2020, 586, 124880. [Google Scholar] [CrossRef]
  27. Oberascher, M.; Kinzel, C.; Kastlunger, U.; Kleidorfer, M.; Zingerle, C.; Rauch, W.; Sitzenfrei, R. Integrated urban water management with micro storages developed as an IoT-based solution—The smart rain barrel. Environ. Model. Softw. 2021, 139, 105028. [Google Scholar] [CrossRef]
  28. Khazaei, M.R.; Zahabiyoun, B.; Saghafian, B. Assessment of climate change impact on floods using weather generator and continuous rainfall-runoff model. Int. J. Clim. 2012, 32, 1997–2006. [Google Scholar] [CrossRef]
  29. Koop, S.H.A.; Van Leeuwen, C.J. The challenges of water, waste and climate change in cities. Environ. Dev. Sustain. 2017, 19, 385–418. [Google Scholar] [CrossRef]
  30. Mearns, L.O.; Sain, S.; Leung, L.R.; Bukovsky, M.S.; McGinnis, S.; Biner, S.; Caya, D.; Arritt, R.W.; Gutowski, W.; Takle, E.; et al. Climate change projections of the North American Regional Climate Change Assessment Program (NARCCAP). Clim. Chang. 2013, 120, 965–975. [Google Scholar] [CrossRef]
  31. Mearns, L.O.; Lettenmaier, D.P.; McGinnis, S. Uses of Results of Regional Climate Model Experiments for Impacts and Adaptation Studies: The Example of NARCCAP. Curr. Clim. Chang. Rep. 2015, 1, 1–9. [Google Scholar] [CrossRef]
  32. Mailhot, A.; Duchesne, S.; Caya, D.; Talbot, G. Assessment of future change in intensity–duration–frequency (IDF) curves for Southern Quebec using the Canadian Regional Climate Model (CRCM). J. Hydrol. 2007, 347, 197–210. [Google Scholar] [CrossRef]
  33. Diaz-Nieto, J.; Wilby, R.L. A comparison of statistical downscaling and climate change factor methods: Impacts on low flows in the River Thames, United Kingdom. Clim. Chang. 2005, 69, 245–268. [Google Scholar] [CrossRef]
  34. Kousky, C.; Kunreuther, H. Improving Flood Insurance and Flood-Risk Management: Insights from St. Louis, Missouri. Nat. Hazards Rev. 2010, 11, 162–172. [Google Scholar] [CrossRef]
  35. Thakali, R.; Kalra, A.; Ahmad, S. Understanding the Effects of Climate Change on Urban Stormwater Infrastructures in the Las Vegas Valley. Hydrology 2016, 3, 34. [Google Scholar] [CrossRef]
  36. Mesinger, F.; DiMego, G.; Kalnay, E.; Mitchell, K.; Shafran, P.C.; Ebisuzaki, W.; Jović, D.; Woollen, J.; Rogers, E.; Berbery, E.H.; et al. North American Regional Reanalysis. Bull. Am. Meteorol. Soc. 2006, 87, 343–360. [Google Scholar] [CrossRef]
  37. Baek, S.-S.; Ligaray, M.; Pyo, J.; Park, J.-P.; Kang, J.-H.; Pachepsky, Y.; Chun, J.A.; Cho, K.H. A novel water quality module of the SWMM model for assessing low impact development (LID) in urban watersheds. J. Hydrol. 2020, 586, 124886. [Google Scholar] [CrossRef]
  38. Bhusal, A.; Ghimire, A.B.; Thakur, B.; Kalra, A. Evaluating the hydrological performance of integrating PCSWMM and NEXRAD precipitation product at different spatial scales of watersheds. Model. Earth Syst. Environ. 2023, 9, 4251–4264. [Google Scholar] [CrossRef]
  39. Ahiablame, L.; Engel, B.A.; Chaubey, I. Representation and Evaluation of Low Impact Development Practices with L-THIA-LID: An Example for Site Planning. Environ. Pollut. 2012, 1, p1. [Google Scholar] [CrossRef]
  40. Arora, M.; Chopra, I.; Nguyen, M.H.; Fernando, P.; Burns, M.J.; Fletcher, T.D. Flood Mitigation Performance of Permeable Pavements in an Urbanised Catchment in Melbourne, Australia (Elizabeth Street Catchment): Case Study. Water 2023, 15, 562. [Google Scholar] [CrossRef]
  41. Iqbal, A.; Rahman, M.; Beecham, S. Permeable Pavements for Flood Control in Australia: Spatial Analysis of Pavement Design Considering Rainfall and Soil Data. Sustainability 2022, 14, 4970. [Google Scholar] [CrossRef]
  42. Petit-Boix, A.; Sevigné-Itoiz, E.; Rojas-Gutierrez, L.A.; Barbassa, A.P.; Josa, A.; Rieradevall, J.; Gabarrell, X. Environmental and economic assessment of a pilot stormwater infiltration system for flood prevention in Brazil. Ecol. Eng. 2015, 84, 194–201. [Google Scholar] [CrossRef]
  43. Liu, L.; Sun, L.; Niu, J.; Riley, W.J. Modeling Green Roof Potential to Mitigate Urban Flooding in a Chinese City. Water 2020, 12, 2082. [Google Scholar] [CrossRef]
  44. Liu, W.; Chen, W.; Peng, C. Assessing the effectiveness of green infrastructures on urban flooding reduction: A community scale study. Ecol. Model. 2014, 291, 6–14. [Google Scholar] [CrossRef]
  45. Nyaupane, N.; Thakali, R.; Kalra, A.; Mastino, L.; Velotta, M.; Ahmad, S. Response of Climate Change on Urban Watersheds: A Case Study for Las Vegas, NV. In Proceedings of the World Environmental and Water Resources Congress 2017, Sacramento, CA, USA, 21–25 May 2017; pp. 485–496. [Google Scholar]
  46. Nyaupane, N.; Mote, S.R.; Bhandari, M.; Kalra, A.; Ahmad, S. Rainfall-runoff simulation using climate change based precipitation prediction in HEC-HMS model for Irwin Creek, Charlotte, North Carolina. In Proceedings of the World Environmental and Water Resources Congress 2018, Minneapolis, MN, USA, 3–7 June 2018; American Society of Civil Engineers: Reston, VA, USA, 2018; pp. 352–363. [Google Scholar]
  47. Thakali, R.; Kalra, A.; Ahmad, S.; Qaiser, K. Management of an Urban Stormwater System Using Projected Future Scenarios of Climate Models: A Watershed-Based Modeling Approach. Open Water 2018, 5, 1. [Google Scholar]
  48. Hettiarachchi, S.; Wasko, C.; Sharma, A. Increase in flood risk resulting from climate change in a developed urban watershed—The role of storm temporal patterns. Hydrol. Earth Syst. Sci. 2018, 22, 2041–2056. [Google Scholar] [CrossRef]
  49. Zhu, J.; Stone, M.C.; Forsee, W. Analysis of potential impacts of climate change on intensity–duration–frequency (IDF) relationships for six regions in the United States. J. Water Clim. Chang. 2012, 3, 185–196. [Google Scholar] [CrossRef]
  50. Ionno, A.; Arsenault, R.; Troin, M.; Martel, J.-L.; Brissette, F. Impacts of climate change on flood volumes over North American catchments. J. Hydrol. 2024, 630, 130688. [Google Scholar] [CrossRef]
  51. Swain, D.L.; Wing, O.E.J.; Bates, P.D.; Done, J.M.; Johnson, K.A.; Cameron, D.R. Increased Flood Exposure Due to Climate Change and Population Growth in the United States. Earth’s Future 2020, 8, e2020EF001778. [Google Scholar] [CrossRef]
  52. Klein, C.; Jackson, L.S.; Parker, D.J.; Marsham, J.H.; Taylor, C.M.; Rowell, D.P.; Guichard, F.; Vischel, T.; Famien, A.M.L.; Diedhiou, A. Combining CMIP data with a regional convection-permitting model and observations to project extreme rainfall under climate change. Environ. Res. Lett. 2021, 16, 104023. [Google Scholar] [CrossRef]
  53. Pal, S.C.; Chowdhuri, I.; Das, B.; Chakrabortty, R.; Roy, P.; Saha, A.; Shit, M. Threats of climate change and land use patterns enhance the susceptibility of future floods in India. J. Environ. Manag. 2022, 305, 114317. [Google Scholar] [CrossRef] [PubMed]
  54. Tabari, H. Climate change impact on flood and extreme precipitation increases with water availability. Sci. Rep. 2020, 10, 13768. [Google Scholar] [CrossRef] [PubMed]
  55. Hua, P.; Yang, W.; Qi, X.; Jiang, S.; Xie, J.; Gu, X.; Li, H.; Zhang, J.; Krebs, P. Evaluating the effect of urban flooding reduction strategies in response to design rainfall and low impact development. J. Clean. Prod. 2020, 242, 118515. [Google Scholar] [CrossRef]
  56. Kourtis, I.M.; Tsihrintzis, V.A.; Baltas, E. A robust approach for comparing conventional and sustainable flood mitigation measures in urban basins. J. Environ. Manag. 2020, 269, 110822. [Google Scholar] [CrossRef]
  57. Yang, W.; Zhang, J.; Krebs, P. Low impact development practices mitigate urban flooding and non-point pollution under climate change. J. Clean. Prod. 2022, 347, 131320. [Google Scholar] [CrossRef]
  58. He, L.; Li, S.; Cui, C.-H.; Yang, S.-S.; Ding, J.; Wang, G.-Y.; Bai, S.-W.; Zhao, L.; Cao, G.-L.; Ren, N.-Q. Runoff control simulation and comprehensive benefit evaluation of low-impact development strategies in a typical cold climate area. Environ. Res. 2022, 206, 112630. [Google Scholar] [CrossRef]
  59. Lewellyn, C.; Lyons, C.E.; Traver, R.G.; Wadzuk, B.M. Evaluation of Seasonal and Large Storm Runoff Volume Capture of an Infiltration Green Infrastructure System. J. Hydrol. Eng. 2016, 21, 04015047. [Google Scholar] [CrossRef]
  60. Masseroni, D.; Cislaghi, A. Green roof benefits for reducing flood risk at the catchment scale. Environ. Earth Sci. 2016, 75, 579. [Google Scholar] [CrossRef]
  61. Meena, Y.R.; Gupta, A.K. Spatial BMP approach for mitigating the urban flooding in Bengaluru city, Karnataka, India. Spat. Inf. Res. 2018, 26, 527–536. [Google Scholar] [CrossRef]
  62. Qiu, J.; Shen, Z.; Hou, X.; Xie, H.; Leng, G. Evaluating the Performance of Conservation Practices under Climate Change Scenarios in the Miyun Reservoir Watershed, China. Ecol. Eng. 2020, 143, 105700. [Google Scholar] [CrossRef]
  63. Dudula, J.; Randhir, T.O. Modeling the influence of climate change on watershed systems: Adaptation through targeted practices. J. Hydrol. 2016, 541, 703–713. [Google Scholar] [CrossRef]
  64. Giri, S.; Lathrop, R.G.; Obropta, C.C. Climate change vulnerability assessment and adaptation strategies through best management practices. J. Hydrol. 2020, 580, 124311. [Google Scholar] [CrossRef]
Figure 1. Map showing the location and characteristics of East St. Louis watershed.
Atmosphere 15 00281 g001
Figure 2. The watershed characteristics.
Atmosphere 15 00281 g002
Figure 3. Graphical illustration of the methodology of the study.
Atmosphere 15 00281 g003
Figure 4. Future variability in storm depth for different models compared to historical values. Red dotted line indicates the NARR value, marker shapes indicate the model used, and labels indicate the delta change factor.
Atmosphere 15 00281 g004
Figure 5. Discharge hydrograph for 6 h—100 years return period dtorm for different climate model.
Atmosphere 15 00281 g005
Figure 6. Percentage increase in peak discharge and volume for climate variability scenarios.
Atmosphere 15 00281 g006
Figure 7. Effectiveness of BMP options under climate change scenarios. (a) Baseline scenario; (b) Timeslice CCSM; (c) WRFG-CGCM3; (d) HRM3-HADCM3.
Atmosphere 15 00281 g007
Table 1. List of global climate models (GCMs) and derived regional climate models (RCMs) utilized in the current research.
Regional Climate ModelGlobal Climate Model
CCSMCGCM3GFDLHadCM3
CRCMCRCM-CCSMCRCM-CGCM3--
ECP2--ECP2-GFDLECP2-HADCM3
HRM3--HRM3-GFDLHRM3-HADCM3
MM5IMM5I-CCSM--MM5I-HADCM3
RCM3-RCM3-CGCM3RCM3-GFDL-
WRFGWRFG-CCSMWRFG-CGCM3--
TimesliceTimeslice CCSM-Timeslice GFDL-
Table 2. BMP design parameters (N/A, not available).
LayersParameterPermeable PavementGreen Roof Infiltration TrenchUnit
SurfaceBerm height100100100mm
Vegetation Volume0.10.10.1fraction
PavementThickness150N/AN/Amm
Void ratio0.21N/AN/A
Permeability2000N/AN/Amm/h
Clogging factor83N/AN/A
SoilThickness100100N/Amm
Porosity0.50.5N/A
Field Capacity0.20.2N/A
Wilting Point0.10.1N/A
Conductivity0.50.5N/Amm/h
Conductivity Slope3030N/A
Suction head3.53.5N/Amm
StorageThickness300N/A300mm
Void ratio0.75N/A0.75
Seepage rate0.5N/A0.5mm/h
UnderdrainDrain coefficient0.2N/A0.2mm/h
Drain exponent0.5N/A0.5
Drain offset height30N/A30mm
Drainage MaterialThicknessN/A25.4N/Amm
Void fractionN/A0.5N/A
Roughness N/A0.2N/A
Disclaimer/Publisher’s Note: The statements, opinions and data contained in all publications are solely those of the individual author(s) and contributor(s) and not of MDPI and/or the editor(s). MDPI and/or the editor(s) disclaim responsibility for any injury to people or property resulting from any ideas, methods, instructions or products referred to in the content.

