

Quantifying Landscape Pattern–Hydrological Process Linkage in Northwest Iran
by
 , and
, and
Ali Rasoulzadeh
1,*,
Raoof Mostafazadeh
2,
Javanshir Azizi Mobaser
1,
Nazila Alaei
3,
Zeinab Hazbavi
2 and
Ozgur Kisi
4,5,*
1
Department of Water Engineering, Faculty of Agriculture and Natural Resources, Water Management Research Center, University of Mohaghegh Ardabili, Ardabil 56199-11367, Iran
2
Department of Range & Watershed Management, Faculty of Agriculture and Natural Resources, Water Management Research Center, University of Mohaghegh Ardabili, Ardabil 56199-11367, Iran
3
Department of Range and Watershed Management, Faculty of Natural Resources, Urmia University, Urmia 57561-51818, Iran
4
Department of Civil Engineering, Lubeck University of Applied Sciences, 23562 Lübeck, Germany
5
Department of Civil Engineering, Ilia State University, 0162 Tbilisi, Georgia
*
Authors to whom correspondence should be addressed.
Atmosphere 2023, 14(12), 1814; https://doi.org/10.3390/atmos14121814
Submission received: 22 August 2023
/
Revised: 3 December 2023
/
Accepted: 9 December 2023
/
Published: 12 December 2023
(This article belongs to the Special Issue The Impact of Climate Change on Water Resources)
Abstract
:The enormous heterogeneity and complexity of landscape patterns and their linkage with the hydrological responses have rarely been quantified and cataloged, especially in ungauged regions. This research therefore linked the landscape characteristics to hydrological processes using a newly developed runoff landscape index (RLI) at the watershed scale in Ardabil Province, northwest Iran. First, 11 common landscape metrics were calculated using Fragstats 4.2.1 software. Then, a runoff landscape index (RLI) was developed based on land cover (λC), soil (λK), and topography (λS) factors in 28 watersheds. Correlation and regression analyses were also conducted to determine the relationship between RLI, commonly used landscape metrics, and mean base flow. The spatial variations of all meaningful landscape metrics and RLI were considerable throughout the study watersheds. The mean values of λC, λK, and λS were found to be 2.78 ± 1.08, 0.50 ± 0.10, and 1.22 ± 0.30, respectively. The mean RLI varied from 0.00009 in the Lay Watershed with an area of 19.09 km2 to 0.28 in the Boran Watershed with 10,268.95 km2. The correlation coefficient (r > 0.42; p-value < 0.05) was obtained significantly between RLI and only five landscape metrics, including the largest patch index (LPI), landscape shape index (LSI), landscape division index (DIVISION), splitting index (SPLIT), and Shannon’s diversity index (SHDI). In addition, a regression model with R2 of 0.97 and 0.67, respectively, in calibration and validation steps was established between river base flow as the dependent variable and main waterway length, LPI, LSI, SPLIT, modified Simpson’s diversity index (MSIDI), and λS as independent variables. The result confirms the significant interdependence of RLI and landscape characteristics, which can be used to interpret the landscape’s dynamic and its effects on hydrological processes.
1. Introduction
The degradation of human–environment systems is seriously triggered by anthropogenic-related drivers, resulting in changes in landscape patterns [1]. The landscape functions have also been negatively affected by inappropriate remediation, industrialization, and urbanization activities, which have changed the hydrological cycle components, including waterways [1,2]. The landscape and socio-hydrological patterns have altered from being utterly natural with an integral water cycle to a highly developed state that suffers from an altered water cycle [2,3]. Recent advancements in developing landscape metrics have helped management decisions by ascertaining the landscape-change impacts and risks [4,5].
Landscape metrics are increasingly used as a valuable tool in assessing land use change at spatial, temporal, and system scales [6,7]. They provide detailed dynamic and quantitative information to assess the landscape composition, spatial structure, and pattern, as well as the environmental processes of various ecosystems [8]. Several multidimensional indicators for vegetation, soil, algae, and water have been developed to assess wetland conditions [6], sustainable forest management [9,10], ecological quality assessment [11,12], and water quality monitoring [13,14]. All these indicators and quantitative frameworks of the landscape have been proposed to estimate the effect of land use change on environmental systems and the relationships between landscape patterns and ecological processes. However, limited research has been conducted to assess the relationships between landscape metrics and hydrological processes (e.g., [3,15,16]).
The spatial patterns of land uses, which have a notable impact on hydrological processes like evapotranspiration, runoff, soil moisture, and sediment production, are strongly influenced by landscape metrics encompassing factors such as shape, size, type, and quantity [17,18]. The hydrological regime of watersheds is significantly impacted by changes in land use components, which influence the various social dimensions of dependent stakeholders. It seems that these impacts are continuing due to the lack of appropriate managerial actions [1]. Although landscape metrics are used in ecology along with maps and spatial statistics, they do not take into account the topographic, soil, and climatic characteristics that are important factors influencing hydrological processes [3].
The literature review confirmed that the linkage between landscape metrics and watershed hydrology response has been less discussed in different ecological contexts [16,19,20,21]. Only Bin et al. [3] studied the effect of landscape patterns on surface runoff in the Haihe Watershed, China, by developing the runoff landscape index (RLI). According to their findings, a noteworthy and positive correlation exists between the RLI and the amount of surface runoff. They stated that the value of the correlation coefficient between the amount of surface runoff and the RLI was equal to 0.83 and was much higher than its relationship with the common landscape metrics. Therefore, our study is the second application of RLI to investigate the connectedness between landscape patterns and hydrological processes.
Due to the frequent occurrence of extreme hydrological events such as droughts and floods in northwest Iran, obtaining comprehensive information on hydrological processes is essential. On the other hand, studying these processes depends on determining their relationship with changes in environmental factors, including land use. Therefore, studying the effect of landscape structure and pattern on surface runoff due to the changing dynamic of human activities is one of the main steps in developing appropriate management strategies at local, national, and even global scales. For this reason, the present study was planned to (1) evaluate the linkage between common landscape metrics and surface runoff throughout 28 watersheds of Ardabil Province (northwest Iran) with a variety of physiographic, land use, and climatic features; (2) adopt a new hydrological landscape index by considering land cover, soil, and topography factors that were ignored in the common landscape metrics; (3) analyze the spatial distribution of developed landscape metrics; and (4) determine the statistical correlation between common and developed landscape metrics with runoff yield and base flow.
This intuitive display of landscape pattern–hydrological process characterization has never been seen in previous research conducted in Iran. It will provide new ideas for future land planning and sustainable watershed management. The applied framework is not limited to the specific area and can therefore be used in other watersheds around the globe.
2. Materials and Methods
2.1. Study Area
Ardabil Province is located northwest of the Iranian plateau (Figure 1). Situated in proximity to the Republic of Azerbaijan to the north, Guilan Province to the east, Zanjan Province to the south, and East Azerbaijan Province to the west, Ardabil Province occupies a distinct geographic position. Characterized as a cold mountainous region, Ardabil Province experiences a mean annual precipitation ranging between 220 and 457 mm per year. West of Ardabil Province has the highest annual precipitation (ca. 400 to 500 mm). The southern regions of Ardabil Province (Khalkhal City) have an annual precipitation of about 350 mm [22]. The maximum, minimum, and mean elevations are respectively observed in Sabalan Mountain Peak (4811 m amsl), Moghan City (40 m amsl), and Ardabil Plain (1850 m amsl) [23]. The present study was conducted at the watershed scale, which does not follow administrative and political divisions.
2.2. Data Used
For the present study, the daily flow discharge, measured at 28 river gauge stations of major rivers in Ardabil Province, was collected from the Regional Water Company of Ardabil (http://www.arrw.ir/?l=EN, accessed on 10 May 2021). The available recorded data period of 22 years, from 1993 to 2014, was used in the hydrological analysis. In addition, the base flow discharge was calculated using the local minima filtered smooth separation method [23,24]. Here, the surface runoff (overland flow) is defined as a part of the overland water that cannot infiltrate the soil and underground layers draining to river networks. In addition, the base flow is quantified as a part of the overall river flow that reacts to the precipitation event, and it is usually related to the water discharged from the underground waters. Actually, its boundary is under the water table, and it exists in a river in the absence of a precipitation event [23,24,25,26].
2.3. Landscape Metrics Calculation
Landscape metrics are tools for measuring and quantifying different dimensions of the landscape pattern at a given point in time [19,27]. The quantification of landscape structure has diverse and significant applications in determining the rate of human intervention, land use change, vegetation behavior, and many other processes related to the landscape. For this reason, in the last two decades, they have been considered an integral part of many environmental research projects. Fragstats Software was used due to its excellent capability and the calculation of a more significant number of landscape metrics [27]. This program has no limitations in scale (area and magnification) and is suitable for analyzing the spatial pattern and different measurements of the patches that make up the landscape in heterogeneous environments and different conditions.
Three output files (patch, class, and landscape) are created for each input in Fragstats Software. For the present study, after collecting the 2016 land use map in vector format (Figure 2), it was converted to raster format. Then, the Fragstats 4.2.1 software was used at the landscape level for each hydrological unit (i.e., watershed). One of the most critical issues here is choosing the most appropriate metrics from the many calculated landscape metrics. It should be noted that the landscape metrics have, in many cases, overlapped and provided similar information [19]. For this purpose, an initial refinement is required. Table 1 summarizes the characteristics of the landscape metrics used for the present study.
Patch density (PD) was used to measure the integrity and cohesion of land uses. With increasing PD, the cohesion of the landscape decreases [28]. Therefore, the presence of small patches in different vegetation types reduces the distances between two similar patches and thus increases the fragmentation rate. The landscape shape index (LSI) is a cumulative metric with a spatial scattering characteristic. The LSI measures the ratio (margin length) of the patch to the minimum possible environment for a patch with maximum aggregation (accumulation). If this metric is equal to unity, this means the appearance of the land consists of a patch with maximum compaction and an almost square shape, while the more scattered the patch, the more irregular the border, and the more complex the shape, its values increase without restriction. Furthermore, DIVISION and SPLIT refer to the description of human intervention and the cohesion degree of the landscape based on the performance of the residual dimension distribution [27,29].
The largest patch index (LPI) also indicates the predominance of patches (land uses) in the system. The mean distance of the Euclidean nearest neighbor (ENN_MN) is perhaps the most straightforward measure of the patch frame and has been widely used to measure patch isolation. The ENN_MN is defined as the shortest direct distance between the central patch and the nearest neighbor of that class using simple Euclidean geometry [27,29].
2.4. RLI Characterization
For the present research, the runoff landscape index (RLI), adapted by Bin et al. [3], was used to connect the commonly-used landscape metrics to surface runoff in Ardabil Province. To compensate for the shortcomings of common landscape metrics in the expression of surface runoff-related processes, this new landscape metric was developed based on land cover, soil, and topography characteristics. To this end, three factors: land cover (λC), soil (λK), and topography (λS), were estimated.
Disparities in canopy cover were observable across various vegetation types, contingent upon the specific species involved, the canopy density and diameter could have different effects on runoff production [30,31]. In addition, maintenance created by infrastructure such as residential areas, roads, bridges, and canals had various effects on runoff production. Accordingly, the λC was calculated based on Table 2 and varied from zero to one depending on the degree of land cover participation in the runoff generation.
Soil factor (λK) indicated the participation of soil type in runoff production, which was estimated by soil drainage classes. Permeability is one of the most critical factors affecting surface runoff due to its differences in various soil textures [50]. Low drainage classes showed low permeability (Table 3). The long-term relationship between runoff coefficient and impermeability was presented by Goldshleger et al. [51]. It was concluded that when the runoff coefficient linearly increased from 0.2 to 0.8, the degree of impermeability varied from 30 to 90% (Table 3).
The topographic factor (λS) was characterized using the slope coefficient (1/cosα) [3]. As emphasized in the existing literature [52,53], slope represents a pivotal element influencing the initiation of surface runoff. On a smaller scale, the generation of surface runoff was intricately tied to the degree of slope steepness. Investigations conducted on laboratory runoff plots conclusively demonstrated that steeper slopes yield a greater volume of runoff when compared to gentler slopes [54]. The interplay between flow velocity and slope steepness had also been subject to scrutiny, revealing a positive correlation between slope steepness and runoff velocity. Notably, the maximum velocity was found to occur at slopes of approximately 35 degrees [52].
Combining land cover (λC), soil (λK), and topography (λS) factors for all network cells (i) in one patch (i.e., land use) produces a landscape runoff factor (P) as given in Equation (1) [3].
Then, with considering the area of each study patch () in km2 and the whole area of the study region (A) in km2, the runoff landscape index (RLI) was calculated for each patch (Equation (2)) and the whole landscape of the study region (Equation (3)) [3].
where Pij (dimensionless) is the runoff landscape factor of patch ij; aij is the area of patch ij in km2; A is the total area of the landscape in km2. All land cover (λC), soil (λK), and topography (λS) factors and RLI are dimensionless.
2.5. Correlation and Regression Analysis
Pearson correlation analysis [55] was used to evaluate the relationship between common landscape metrics (their units given in Table 1), including PD, LSI, SPLIT, SHDI, MSIDI, DIVISION, CONTIG_MN, LPI, IJI, AI, ENN_MN, watershed perimeter (m), mean annual precipitation (mm), mainstream length (Km), impervious surfaces (%), λC, λK, and λS as independent variables with the mean values of base flow (mm) and surface runoff (mm) as dependent variables. The multivariate backward regression method was carried out using IBM SPSS Statistics 22.0 software. This method is used for distance scale data and as a function of the dependent variable that predicts the independent variables [56]. About 70% and 30% of the study watersheds were, respectively, randomly selected for the calibration and validation stages. The degree of autocorrelation and multicollinearity between the study independent variables in predicting the mean base flow was evaluated using Durbin-Watson (desired limits = 1.5–2.5) and the variance inflation factor (VIF less than 10), respectively [54]. Then, appropriate regression models were selected based on the cross-validation results and the performance of the statistical criteria (Equations (4)–(7)).
where, MAE, RMSE, R2, and ME were respectively mean absolute error, root mean square error, coefficient of determination, root mean square error, and mean error. In addition, the and , respectively, showed the observed and predicted values of mean base flow (mm) for the ith watershed, and were the mean values of observed and predicted base flow (mm), and was the total number of watersheds.
3. Results
3.1. Spatial Changes of Landscape Metrics
As shown in Figure 3 and Figure 4, the landscape metrics were categorized into three groups according to their magnitude among the studied watersheds. For the first group, the mean and standard deviation of 0.19 ± 0.10, 0.23 ± 0.07, 0.59 ± 0.25, 0.91 ± 0.34, and 0.56 ± 0.20 were respectively attributed to PD, CONTIG_MN, DIVISION, SHDI, and MSIDI. In the second group, five landscape metrics of LPI, LSI, IJI, SPLIT, and AI were found with mean values of 53.91 ± 24.23, 5.29 ± 4.27, 56.47 ± 15.84, 3.89 ± 3.06, and 83.04 ± 4.80, respectively. The ENN_MN metric, with a mean value of 1378.77 ± 463.18, was categorized in the last group and showed the most variation throughout the province.
The Box–Whisker plots for the study landscape metrics showed a positive skewness for PD, CONTIG_MN, LPI, LSI, IJI, and SPLIT and a negative skewness for ENN_MN, DIVISION, MSIDI, SHDI, and AI (Figure 3).
3.2. Spatial Changes in RLI and Its Factors
The values of λC in the study watersheds varied from 1.43 to 4.79, with a mean of 2.78 ± 1.08 (Figure 5). Noticeable zonal differences were found for this factor. According to the results, the λC changes had more influence on the RLI characterization because of its high variability (CV = 39%). In addition, the spatial pattern of λK (Figure 5) with a mean and standard deviation of 0.10 and 0.50 indicated a relatively medium drainage level in most watersheds (more than 18 watersheds). According to Figure 5, the λK had the highest value for the Aladizgeh Watershed (with a numerical value of 0.72) and the lowest value for Lay Watershed (with a numerical value of 0.31). According to Figure 5, the λS was evaluated as the highest value for the Aladizge Watershed (with a numerical value of 2.33) and the lowest value for the Akbrdavod Watershed (with a numerical value of 1.00).
3.3. Results of Correlation and Regression Analysis
The results of the correlation analysis (Table 4) showed that the landscape metrics, including LPI, LSI, DIVISION, SPLIT, and SHDI, were highly correlated with RLI. The LPI showed a negative correlation with RLI. By contrast, the DIVISION, SPLIT, and SHDI values of landscapes were positively correlated with the RLI. This positive correlation indicated accelerated runoff when watersheds included many different land cover types that were small and dispersed.
In this study, the backward elimination method was used to analyze the relationship between landscape metrics, RLI factors, surface runoff (Figure 8, left), and base flow amount (Figure 8, right). According to the adjusted R2 of 0.98, the correlation coefficient of 0.94, and a significant level (α < 0.001), the assumption of a significant linear relationship between independent and dependent variables with a 95% confidence level was confirmed. Furthermore, based on the equation provided for base flow estimation (Equation (8)), the inverse relationship between the stream length as well as the direct relationship with LPI, LSI, SPLIT, MSIDI, and topography factor (λS) was detected with the base flow.
To validate the model, this formula was applied to 30% of the remaining watersheds (Figure 9). The MAE, RMSE, R2, and ME were obtained at 0.02, 0.60, 0.60, and −0.39, indicating the relatively appropriate performance of backward regression.
4. Discussion
Common and meaningful landscape metrics were widely used to assess the pattern and structure of the land uses affected by human disturbances. Due to the different behavior of landscapes in terms of hydrology, it is essential to provide an appropriate linkage between traditional landscape metrics and hydrological characteristics. Hence, the attempt of this research was to link quantitative ecological features of the landscape with the corresponding hydrological parameters.
The presence of high PD in the watersheds (Figure 3 and Figure 4) indicated an increase in land degradation, which had led to an increase in fragmentation. The LSI was calculated as a measure of the mean patch shape index [8] which varied from 1.51 (Hir Watershed located in the southeast of the province) to 17.04 (Boran Watershed extended from the northwest to southeast of the province). SPLIT was based on the distribution of cumulative patches and interpreted as an effective network or number of patches with a time-constant size [27]. The mean value and standard deviation of this metric for the study province were equal to 3.06 and 3.89, respectively.
The mean of the CONTIG_MN (Figure 4) as a measure of the irregular arrangement of patches in the landscape [8] varied from 0.39 (Nanekaran Watershed located in the west of the province) to 0.14 (PoleSoltani Watershed located in the southeast of the province). The highest DIVISION and LPI were observed for the Mashiran Watershed with values of 0.92 and 96.64, respectively. Their lowest values were also found for the Hir Watershed (DIVISION = 0.07; LPI = 17.04). The mean and standard deviation of the AI were equal to 83.04 and 4.80, respectively. This metric varied from 73.76% in the Eril Watershed (east of the province) to 98.86% in the Hir Watershed (east of the province). The ENN_MN, as the most straightforward metric of the patch structure, has been widely used [55]. For the study province, the maximum and minimum ENN_MN were obtained for the Boran (2799.91) and Hir (0.00) watersheds (Figure 4).
A full agreement was established between current results and previous studies conducted for Ardabil Province. For instance, the spatio-temporal changes of some landscape metrics in Ardabil Province from 1987 to 2015 were also monitored by Kakehmami et al. [57]. Their results verified the high variations between the landscape metrics and increasing man-made patches due to the increase in population growth, rangeland conversion to agriculture, and urban development. Furthermore, the analysis of rangelands structure indicated the spatial heterogeneity of landscape metrics in the Eril Watershed, located in the eastern part of Ardabil Province [58]. In addition, in the riparian area of the Gharesou River, Central Ardabil, Esfandiyari Darabad et al. [59] found the critical parts of landscape degradation for adapting conservation practices throughout landscape metric analysis.
Our results (Figure 5, Figure 6, Figure 7, Figure 8 and Figure 9) provided practical implications for geomorphological and ecological practitioners and experts, with an emphasis on soil erosion assessment and control. The dynamics of spatial heterogeneity in λC play a critical role in generating runoff, soil infiltration, and the water balance of a watershed, particularly in regions with sparse vegetation cover [60,61]. In addition, λK was characterized by drainage, permeability, and runoff coefficient classes. Identification of the drainage hotspots that influence runoff generation is necessary for management strategies. Mostafazadeh and Mehri [22] identified the highest spatial variability in flood coefficient in the north-eastern and western parts of Ardabil Province over a 22-year period (1991–2011). The spatial pattern of the λS in the study watersheds was also obtained, with a mean and standard deviation of 0.30 and 1.29, respectively. The effect of slope gradient on runoff production is well documented in other studies [3,52]. Hotspots of RLI showed the behavior of the watershed systems from multiple perspectives. The larger RLI indicated more surface runoff generation. The results were consistent with Bin et al.’s [3] study, which found the RLI in the range of 0.096 and 0.976 for the Haihe River Basin, China.
The RLI had the highest correlation with the SPLIT and LSI metrics (Table 4). Division metric refers to the role of human intervention and the degree of landscape cohesion [19,29]. For the Calumpang Watershed, Philippines, a regression coefficient of −0.35 was obtained between the surface runoff and LPI_forest [16]. Their findings verified that the increasing PD_agriculture and LPI_forest led to a decrease in surface runoff and an increase in base flow amount. Zhou and Li [15], through investigating the correlation between the landscape metric and hydrological process, found different behavior in the Yanhe Watershed, China. They observed a low correlation coefficient (with the absolute value of 0.016–0.288) between landscape metrics and runoff.
The relatively appropriate performance of statistical criteria was supported by Mirzaei et al. [19], who found a significant relationship between base flow, slope, and some landscape metrics in the Amoughin Watershed, central province. This finding is critical in the water resource allocation and local strategic planning behind social and economic aspects. Bin et al. [3] also verified a high correlation between RLI and surface runoff for the Haihe River Basin, China. They reported the R2 of 0.88 and 0.91, as well as RMSE of 0.005 and 0.018, respectively, for calibration and validation steps. Partial least squares (PLS) regression results [16] showed a significant direct correlation between the base flow and LPI_forest and an inverse correlation between the base flow and AI_agriculture. The framework provided by the present results plays a base role in regional and provincial planning from landscape ecology and hydrology perspectives.
In this research, it was hypothesized that the base flow is like the landscape metrics, more or less permanent. Its amount is affected by the precipitation event, as the used landscape metrics could also be variable depending on ecological and climatic changes. Additionally, it was supposed that the land use and all other considered metrics and factors were responses to long-term hydrological–ecological–human interactions. Therefore, the mean values of the surface runoff and base flow for 22 years for calibration and validation steps were considered for calibration and validation steps. However, it could be better to investigate these relationship types and consistencies in future research.
5. Conclusions
An integrated index multiplied by three runoff-related landscape factors, including land cover (λC), soil (λK), and topography (λS), was developed throughout Ardabil Province, northwest Iran. The landscape metrics of the 28 studied watersheds widely varied, and greater variances were obtained for LSI and SPLIT. The results of 11 studied landscape metrics showed coefficients of variation (CV%) of 81 (LSI), 79 (SPLIT), 52 (PD), 45 (LPI), 42 (DIVISION), 37 (SHDI), 35 (MSIDI), 34 (ENN_MN), 30 (CONTIG_MN), 28 (IJI), and 6 (AI).
Mean λC, λK, and λS factors of 2.78 ± 1.08, 0.50 ± 0.10, and 1.22 ± 0.30 were found, respectively. The developed runoff landscape index (RLI) also resulted in a mean of 0.03 ± 0.07. The developed RLI showed a positive correlation with LSI, ENN_MN, DIVISION, SPLIT, SHDI, and AI and a negative correlation with PD, LPI, CONTIG_MN, IJI, and MSIDI. A significant correlation between RLI and LPI, LSI, DIVISION, SPLIT, and SHDI was found (r > 0.42; p-value < 0.05). Therefore, using these results (the 11 traditional landscape metrics and the newly developed RLI), it is possible to predict future hydrological processes in ungauged watersheds, as a global topic of interest.
The regression analysis also verified the relationship between base flow as the dependent variable and main waterway length (inverse), LPI (direct), LSI (direct), SPLIT (direct), MSIDI (direct), and λS (direct) as independent variables with R2 of 0.97 and 0.67, respectively, in the calibration and validation steps (α < 0.01). These findings can be applied to simply determine the relationships between landscape patterns and watershed hydrology, providing quantitative information to natural resource authorities in formulating practical and adaptive programs. Due to the simple and widely used characteristics used to develop RLI, implementing this research methodology in ungauged watersheds around the world is highly emphasized. As a concluding remark, the application of this approach in areas with different landscapes and various hydrological responses can reveal important aspects of the relationship between land use distribution patterns and processes related to erosion and sediment production. In addition, the relationship between different components of the landscape and other components of the water cycle could be a future research topic.
Author Contributions
Conceptualization, A.R. and R.M.; methodology, R.M., N.A., J.A.M. and Z.H.; software, N.A., R.M. and Z.H.; validation, N.A., R.M. and Z.H.; formal analysis, A.R., R.M., N.A. and Z.H.; investigation, R.M. and N.A.; resources, R.M. and N.A.; data curation, R.M. and N.A.; writing—original draft preparation, N.A. and Z.H.; writing—review and editing, N.A., Z.H. and O.K.; visualization, N.A. and Z.H.; supervision, A.R.; project administration, A.R.; funding acquisition, A.R. and O.K. All authors have read and agreed to the published version of the manuscript.
Funding
This research received no external funding.
Institutional Review Board Statement
Not applicable.
Informed Consent Statement
Not applicable.
Data Availability Statement
The datasets are available upon a reasonable request to the corresponding author. The data are not publicly available because there are limitations of the origin organizations’ laws in public publication.
Acknowledgments
The authors thank the University of Mohaghegh Ardabili for facilitating the research.
Conflicts of Interest
The authors declare no conflict of interest.
References
- Tola, S.Y.; Shetty, A. Land cover change and its implication to hydrological regimes and soil erosion in Awash River basin, Ethiopia: A systematic review. Environ. Monit. Assess. 2021, 193, 836. [Google Scholar] [CrossRef] [PubMed]
- Kohutiar, J.; Kravcik, M. Water for an integrative climate paradigm. Int. J. Water 2010, 5, 298–310. [Google Scholar] [CrossRef]
- Bin, L.; Xu, K.; Xu, X.; Lian, J.; Ma, J. Development of a landscape indicator to evaluate the effect of landscape pattern on surface runoff in the Haihe River Basin. J. Hydrol. 2018, 566, 546–557. [Google Scholar] [CrossRef]
- Schickhoff, U.; Bobrowski, M.; Mal, S.; Schwab, N.; Singh, R. The world’s mountains in the anthropocene. In Mountain Landscapes in Transition. Sustainable Development Goals Series; Schickhoff, U., Singh, R., Mal, S., Eds.; Springer: Cham, Switzerland, 2022. [Google Scholar] [CrossRef]
- Fu, G.; Wang, W.; Li, J.; Xiao, N.; Qi, Y. Prediction and selection of appropriate landscape metrics and optimal scale ranges based on multi-scale interaction analysis. Land 2021, 10, 1192. [Google Scholar] [CrossRef]
- Miller, K.M.; Mitchell, B.R.; McGill, B.J. Constructing multimetric indices and testing ability of landscape metrics to assess condition of freshwater wetlands in the Northeastern US. Ecol. Indic. 2016, 66, 143–152. [Google Scholar] [CrossRef]
- Xu, E.; Zhang, H. Aggregating land use quantity and intensity to link water quality in upper catchment of Miyun Reservoir. Ecol. Indic. 2016, 66, 329–339. [Google Scholar] [CrossRef]
- Uuemaa, E.; Mander, Ü.; Marja, R. Trends in the use of landscape spatial metrics as landscape indicators: A review. Ecol. Indic. 2013, 28, 100–106. [Google Scholar] [CrossRef]
- Maes, W.H.; Fontaine, M.; Rongé, K.; Hermy, M.; Muys, B. A quantitative indicator framework for stand level evaluation and monitoring of environmentally sustainable forest management. Ecol. Indic. 2011, 11, 468–479. [Google Scholar] [CrossRef]
- Dudley, N.; Bhagwat, S.A.; Harris, J.; Maginnis, S.; Moreno, J.G.; Mueller, G.M.; Oldfield, S.; Walters, G. Measuring progress in status of land under forest landscape restoration using abiotic and biotic indicators. Restor. Ecol. 2018, 26, 5–12. [Google Scholar] [CrossRef]
- Moreno, M.; Semprucci, F.; Vezzulli, L.; Balsamo, M.; Fabiano, M.; Albertelli, G. The use of nematodes in assessing ecological quality status in the Mediterranean coastal ecosystems. Ecol. Indic. 2011, 11, 328–336. [Google Scholar] [CrossRef]
- Sowińska-Świerkosz, B. Application of surrogate measures of ecological quality assessment: The introduction of the indicator of ecological landscape quality (IELQ). Ecol. Indic. 2017, 73, 224–234. [Google Scholar] [CrossRef]
- Lee, S.W.; Hwang, S.J.; Lee, S.B.; Hwang, H.S.; Sung, H.C. Landscape ecological approach to the relationships of land use patterns in watersheds to water quality characteristics. Landsc. Urban Plan. 2009, 92, 80–89. [Google Scholar] [CrossRef]
- Ai, L.; Shi, Z.H.; Yin, W.; Huang, X. Spatial and seasonal patterns in stream water contamination across mountainous watersheds: Linkage with landscape characteristics. J. Hydrol. 2015, 523, 398–408. [Google Scholar] [CrossRef]
- Zhou, Z.X.; Li, J. The correlation analysis on the landscape pattern index and hydrological processes in the Yanhe Watershed, China. J. Hydrol. 2015, 524, 417–426. [Google Scholar] [CrossRef]
- Boongaling, C.G.K.; Faustino-Eslava, D.V.; Lansigan, F.P. Modeling land use change impacts on hydrology and the use of landscape metrics as tools for watershed management: The case of an ungauged catchment in the Philippines. Land Use Policy 2018, 72, 116–128. [Google Scholar] [CrossRef]
- Van Nieuwenhuyse, B.H.J.; Antoine, M.; Wyseure, G.; Govers, G. Pattern-process relationships in surface hydrology: Hydrological connectivity expressed in landscape metrics. Hydrol. Process. 2011, 25, 3760–3773. [Google Scholar] [CrossRef]
- Roberts, A.D. The effects of current landscape configuration on streamflow within selected small watersheds of the Atlanta metropolitan region. J. Hydrol. Reg. Stud. 2016, 5, 276–292. [Google Scholar] [CrossRef]
- Mirzaei, S.; Esmali Ouri, A.; Mostafazadeh, R.; Ghorbani, A.; Mirzaei, S. Flood hydrograph simulation and analysis of its components with landscape metrics in Amoughin Watershed, Ardabil Province. Iran. J. Ecohydrol. 2018, 5, 357–372. [Google Scholar] [CrossRef]
- Kim, H.W.; Park, Y. Urban green infrastructure and local flooding: The impact of landscape patterns on peak runoff in four Texas MSAs. Appl. Geogr. 2016, 77, 72–81. [Google Scholar] [CrossRef]
- Yuan, Y.; Fang, G.; Yan, M.; Sui, C.; Ding, Z.; Lu, C. Flood-landscape ecological risk assessment under the background of urbanization. Water 2019, 11, 1418. [Google Scholar] [CrossRef]
- Mostafazadeh, R.; Mehri, S. Trends in variability of flood coefficient in river gauge stations of Ardabil Province, Iran. J. Watershed Manag. Res. 2018, 9, 82–95. [Google Scholar] [CrossRef]
- Mehri, S.; Mostafazadeh, R.; Esmali-Ouri, A.; Ghorbani, A. Spatial and Temporal Variations of Base flow Index (BFI) for the Ardabil Province rivers, Iran. J. Earth Space Phys. 2017, 43, 623–634. [Google Scholar] [CrossRef]
- Stewart, M.T.; Cimino, J.; Ross, M. Calibration of base flow separation methods with streamflow conductivity. Groundwater 2007, 45, 17–27. [Google Scholar] [CrossRef] [PubMed]
- Guo, Y.; Zhang, Y.; Zhang, T.; Wang, K.; Ding, J.; Gao, H. Surface runoff. In Observation and Measurement of Ecohydrological Processes; Li, X., Vereecken, H., Eds.; Springer: Berlin/Heidelberg, Germany, 2019; Volume 2. [Google Scholar] [CrossRef]
- Shentsis, I.; Rosenthal, E.; Flexer, A.; Inbar, N. Assessing water withdrawals in scarce-data transboundary areas by use of dynamic precipitation–flow relationships: The case of the Hasbani River Basin. Water 2021, 13, 1440. [Google Scholar] [CrossRef]
- McGarigal, K.; Cushman, S.A.; Neel, E.N. FRAGSTATS: Spatial pattern analysis program for categorical maps. Computer software program produced by the authors at the University of Massachusetts; Landscape Ecology Lab: Amherst, MA, USA, 2002; pp. 691–703. Available online: https://cir.nii.ac.jp/crid/1570009750070414208 (accessed on 25 January 2021).
- Kang, N.; Sakamoto, T.; Imanishi, J.; Fukamachi, K.; Shibata, S.; Morimoto, Y. Characterizing the historical changes in land use and landscape spatial pattern on the Oguraike floodplain after the Meiji period. Intercult Underst 2013, 1, 11–16. [Google Scholar]
- Alaei, N.; Mostafazadeh, R.; Esmaliouri, A.; Sharari, M.; Hazbavi, Z. Assessment and comparison of landscape connectivity in KoozehTopraghi Watershed, Ardabil Province. Iran. J. Appl. Ecol. 2020, 8, 19–34. [Google Scholar] [CrossRef]
- Sriwongsitanon, N.; Taesombat, W. Effects of land cover on runoff coefficient. J. Hydrol. 2011, 410, 226–238. [Google Scholar] [CrossRef]
- Kim, J.K.; Onda, Y.; Kim, M.S.; Yang, D.Y. Plot-scale study of surface runoff on well-covered forest floors under different canopy species. Quat. Int. 2014, 344, 75–85. [Google Scholar] [CrossRef]
- Asaadi, A.M. Comparison of canopy interception loss in evergreen and deciduous trees used in afforestation projects. J. Wood Forest Sci. Technol. 2009, 16, 85–96. [Google Scholar]
- Nezamdost, H.; Sefidi, K.; Rasoulzadeh, A.; Sadeghi, M. Quantifying throughfall, stemflow, and rainfall interception in a Fagus orientalis forest and a Picea abies plantation in Siahkal, Gilan. Iran. J. Forest. 2017, 9, 385–397. [Google Scholar]
- Ahmadi, M.T.; Attarod, P.; Marvi Mohadjer, M.R.; Rahmani, R.; Fathi, J. Canopy interception loss in a pure oriental beech (Fagus orientalis Lipsky) stand during the summer season. Iran. J. Forest. 2009, 1, 175–185. [Google Scholar]
- Fathizadeh, O.; Attarod, P.; Pypker, T.G.; Darvishsefat, A.A.; Zahedi Amiri, G. Seasonal variability of rainfall interception and canopy storage capacity measured under individual Oak (Quercus brantii) Trees in Western Iran. J. Agric. Sci. Technol. 2013, 15, 175–188. [Google Scholar]
- Sadeghi, S.M.M.; Attarod, P. Afforestations impact of Pinus eldarica and Cupressus arizonica on rainfall interception in a semiarid climate zone. J. For. Wood Prod. 2015, 68, 641–653. [Google Scholar] [CrossRef]
- Ghorbani, S.; Rahmani, R. Seasonal and periodic variability of stemflow, throughfall, and interception loss of Oriental beech stands in Shast-Kalate forest. Iran. J. Forest. 2018, 9, 527–540. [Google Scholar]
- Hemmati, V.; Payam, H.; Mattaji, A.; Akef, M.; Babaei, K.S.; Fallahchai, M. Interception, throughfall and stemflow of the oriental beech (Fagus orientalis lipsky) trees in the Caspian region (siyahkal shenrood forests). J. Sci. Tec. Nat. Resourc. 2012, 6, 39–52. [Google Scholar]
- Hosseini Ghaleh Bahmani, S.M.; Attarod, P.; Ahmadi, M.T.; Marvi Mohadjer, M.R.; Etemad, V. Stemflow generations in natural and pure stands of Chestnut leaved oak (Quercus castaneifolia C.A.M) and Oriental beech (Fagus orientalis Lipsky) within the summer season. Iran. J. Forest. Poplar Res. 2010, 18, 666. Available online: https://ijfpr.areeo.ac.ir/article_107658.html?lang=en (accessed on 25 June 2021).
- Esmailpour Zarimehr, A.; Dastorani, M.; Farzam, M. Evaluation of the rainfall interception condition in some shrub species (Case study: Campus of the Ferdowsi University of Mashhad). Iran. J. Ecohydrol. 2019, 6, 809–819. [Google Scholar] [CrossRef]
- Abbasian, P.; Attarod, P.; Hojjati, S.M. Rainfall interception in a natural stand of a Fagus orientalis and a Picea abies plantation within the growing season in Kelardasht Region, North of Iran. J. For. Wood Prod. 2015, 67, 585–594. [Google Scholar] [CrossRef]
- Cui, Y.; Jia, L.; Hu, G.; Zhou, J. Mapping of interception loss of vegetation in the Heihe River basin of China using remote sensing observations. IEEE Geosci. Remote Sens. Lett. 2014, 12, 23–27. [Google Scholar]
- Zou, C.B.; Caterina, G.L.; Will, R.E.; Stebler, E.; Turton, D. Canopy interception for a tallgrass prairie under juniper encroachment. PLoS ONE 2015, 10, e0141422. [Google Scholar] [CrossRef]
- Ciężkowski, W.; Berezowski, T.; Kleniewska, M.; Szporak-Wasilewska, S.; Chormański, J. Modelling wetland growing season rainfall interception losses based on maximum canopy storage measurements. Water 2018, 10, 41. [Google Scholar] [CrossRef]
- Nazari, M.; Sadeghi, S.M.M.; Van Stan II, J.T.; Chaichi, M.R. Rainfall interception and redistribution by maize farmland in central Iran. J. Hydrol. Reg. Stud. 2020, 27, 100656. [Google Scholar] [CrossRef]
- Zhang, J.; Lu, C.; Qin, D.; Guo, Y.; Ge, H. Regional runoff study based on MODCYCLE distributed hydrology model. Trans. Chin. Soc. Agric. Eng. 2011, 27, 65–71. [Google Scholar]
- Becciu, G.; Paoletti, A. Random characteristics of runoff coefficient in urban catchments. Water Sci. Technol. 1997, 36, 39–44. [Google Scholar] [CrossRef]
- Guevara-Escobar, A.; González-Sosa, E.; Véliz-Chávez, C.; Ventura-Ramos, E.; Ramos-Salinas, M. Rainfall interception and distribution patterns of gross precipitation around an isolated Ficus benjamina tree in an urban area. J. Hydrol. 2007, 333, 532–541. [Google Scholar] [CrossRef]
- Liu, Y.; Yang, J.; Hu, J.; Tang, C.; Zheng, H. Characteristics of the surface-subsurface flow generation and sediment yield to the rainfall regime and land-cover by long-term in-situ observation in the red soil region, Southern China. J. Hydrol. 2016, 539, 457–467. [Google Scholar] [CrossRef]
- Lazzarotto, P.; Stamm, C.; Prasuhn, V.; Fluhler, H. A parsimonious soil-type based rainfall-runoff model simultaneously tested in four small agricultural catchments. J. Hydrol. 2006, 321, 21–38. [Google Scholar] [CrossRef]
- Goldshleger, N.; Shoshany, M.; Karnibad, L.; Arbel, S.; Getkerm, M. Generalising relationships between runoff-rainfall coefficients and impervious areas: An integration of data from case studies in Israel with data sets from Australia and the USA. Urban Water J. 2009, 6, 201–208. [Google Scholar] [CrossRef]
- Ekwue, E.I.; Harrilal, A. Effect of soil type, peat, slope, compaction effort and their interactions on infiltration, runoff and raindrop erosion of some Trinidadian soils. Biosyst. Eng. 2010, 105, 112–118. [Google Scholar] [CrossRef]
- Huang, J.; Wu, P.; Zhao, X. Effects of rainfall intensity, underlying surface and slope gradient on soil infiltration under simulated rainfall experiments. Catena 2013, 104, 93–102. [Google Scholar] [CrossRef]
- Sharma, K.D. Runoff behaviour of water harvesting microcatchments. Agric. Water Manag. 1986, 11, 137–144. [Google Scholar] [CrossRef]
- Pearson, K. VII. Mathematical contributions to the theory of evolution.-III. Regression, heredity, and panmixia. Philos. Trans. R. Soc. London. Ser. A Contain. Pap. Math. Phys. Character 1896, 187, 253–318. [Google Scholar] [CrossRef]
- Bihamta, M.R.; Zare Chahouki, M.A. Principles of Statistics for the Natural Resources Science; University of Tehran Press: Tehran, Iran, 2010; 300p. [Google Scholar]
- Kakehmami, A.; Moameri, M.; Ghorbani, A.; Ghafari, S. Analysis of land use/cover changes in Ardabil province using landscape metrics. J. RS GIS Nat. Resourc. 2020, 11, 68–86. [Google Scholar]
- Mostafazadeh, R.; Jafari, A.; Keivan-behjou, F. Comparing the rangelands structure and degradation of landscape connectivity in Iril Sub-Watersheds, Ardabil Province. Iran. J. Appl. Ecol. 2018, 7, 41–53. [Google Scholar] [CrossRef]
- Esfandiyari Darabad, F.; Hamzeei, M.; Alaei, N.; Mostafazadeh, R. Spatial variations of landscape metrics in riparian area vegetation of Gharesou River Reaches under the effect of different land uses, Ardabil Province. Geogr. Plann. Space Quart. J. 2021, 10, 219–234. [Google Scholar]
- Puigdefábregas, J. The role of vegetation patterns in structuring runoff and sediment fluxes in drylands. Earth Surf. Process. Landf. 2005, 30, 133–147. [Google Scholar] [CrossRef]
- Herbst, M.; Roberts, J.M.; Rosier, P.T.W.; Gowing, D.J. Measuring and modelling the rainfall interception loss by hedgerows in southern England. Agric. For. Meteorol. 2006, 141, 244–256. [Google Scholar] [CrossRef]
Figure 1.
Location map of Ardabil Province, Iran.
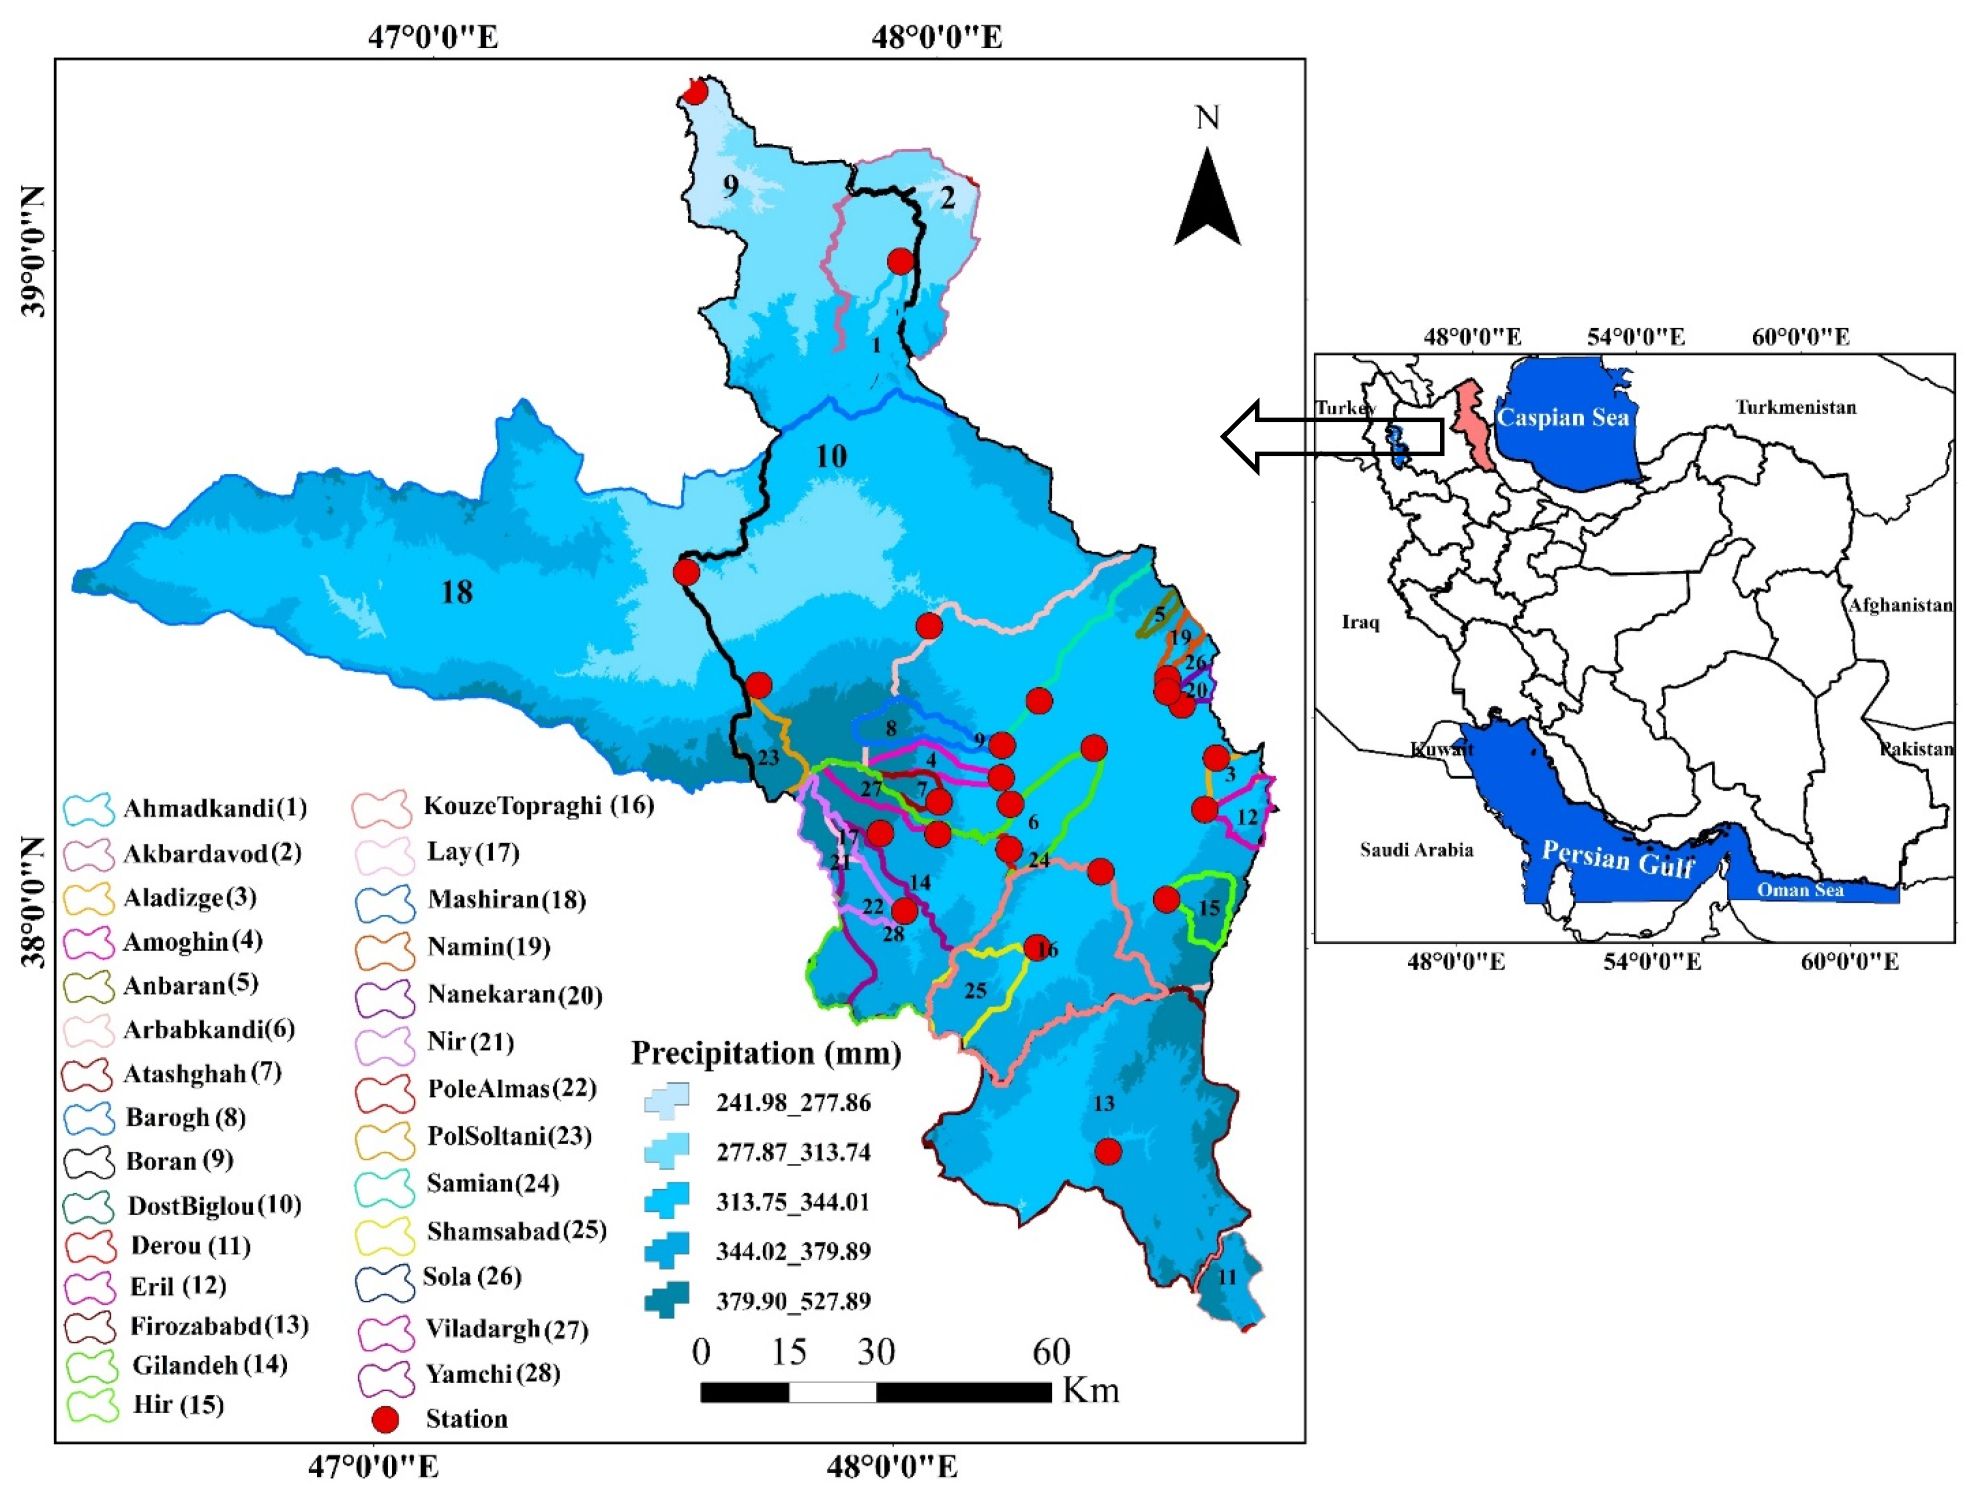
Figure 2.
Land use map of Ardabil Province in 2016.

Figure 3.
Box–Whisker plots to study landscape metrics change.
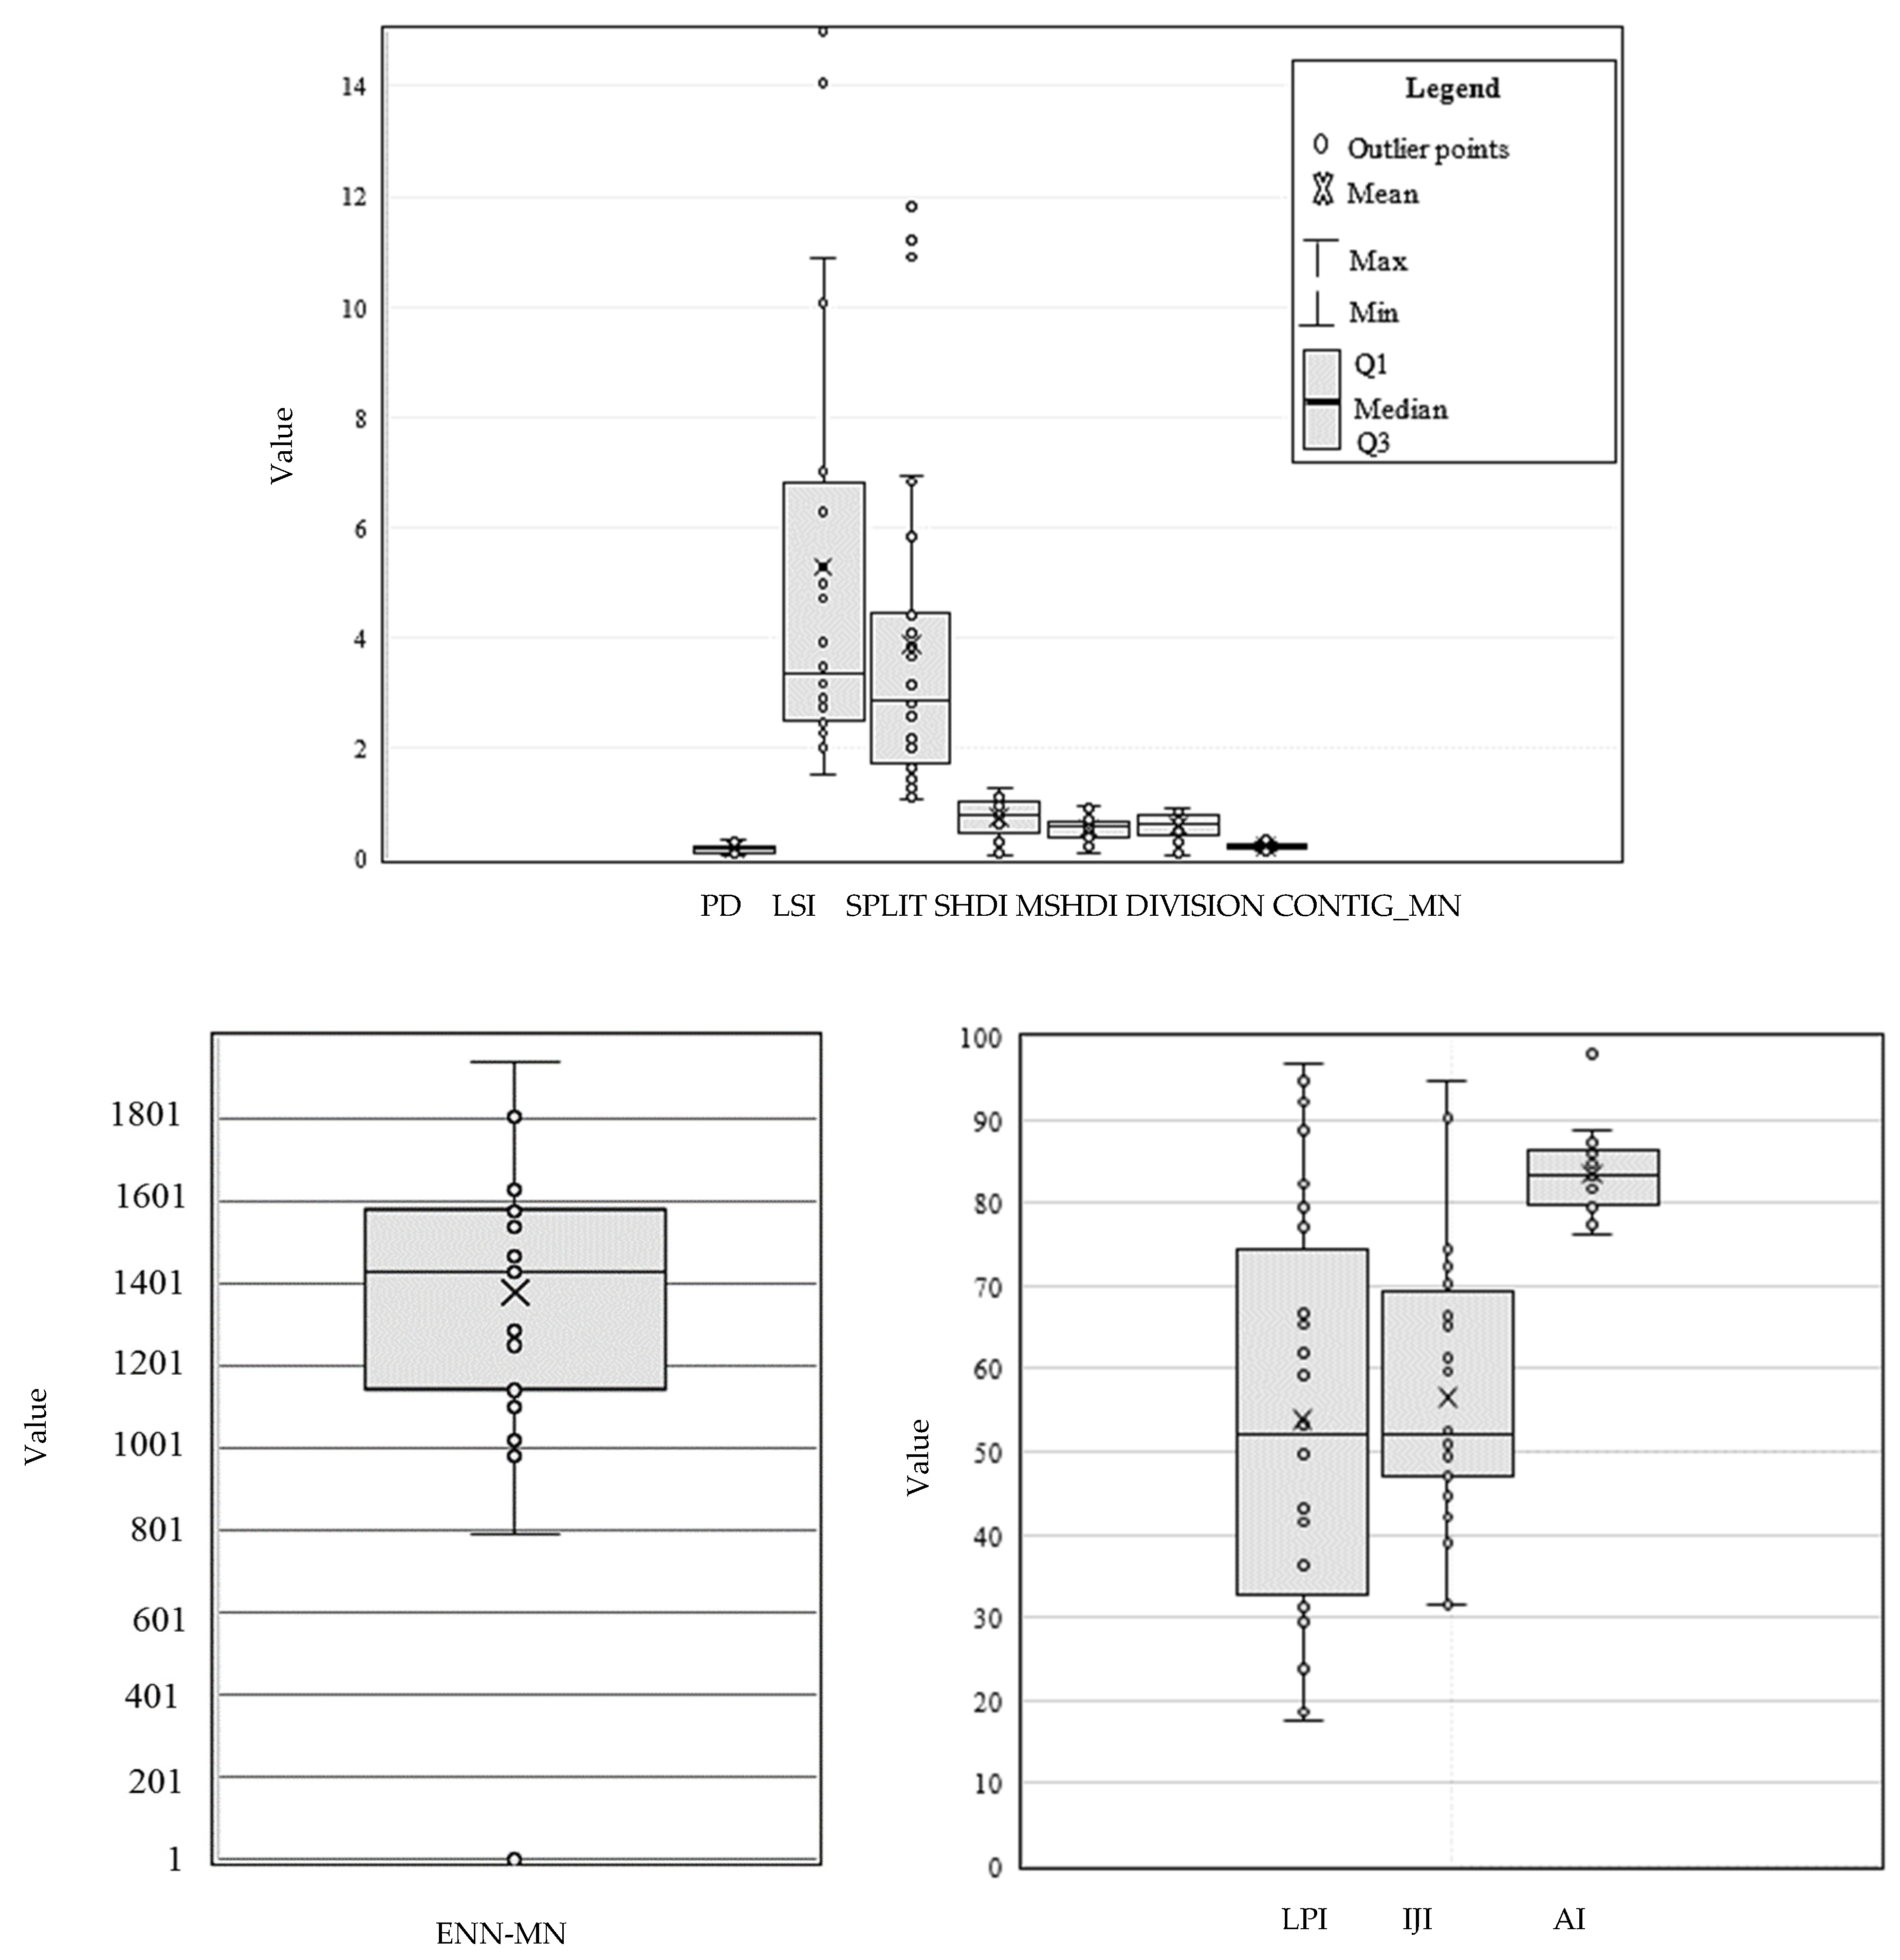
Figure 4.
Landscape metrics change throughout Ardabil Province.
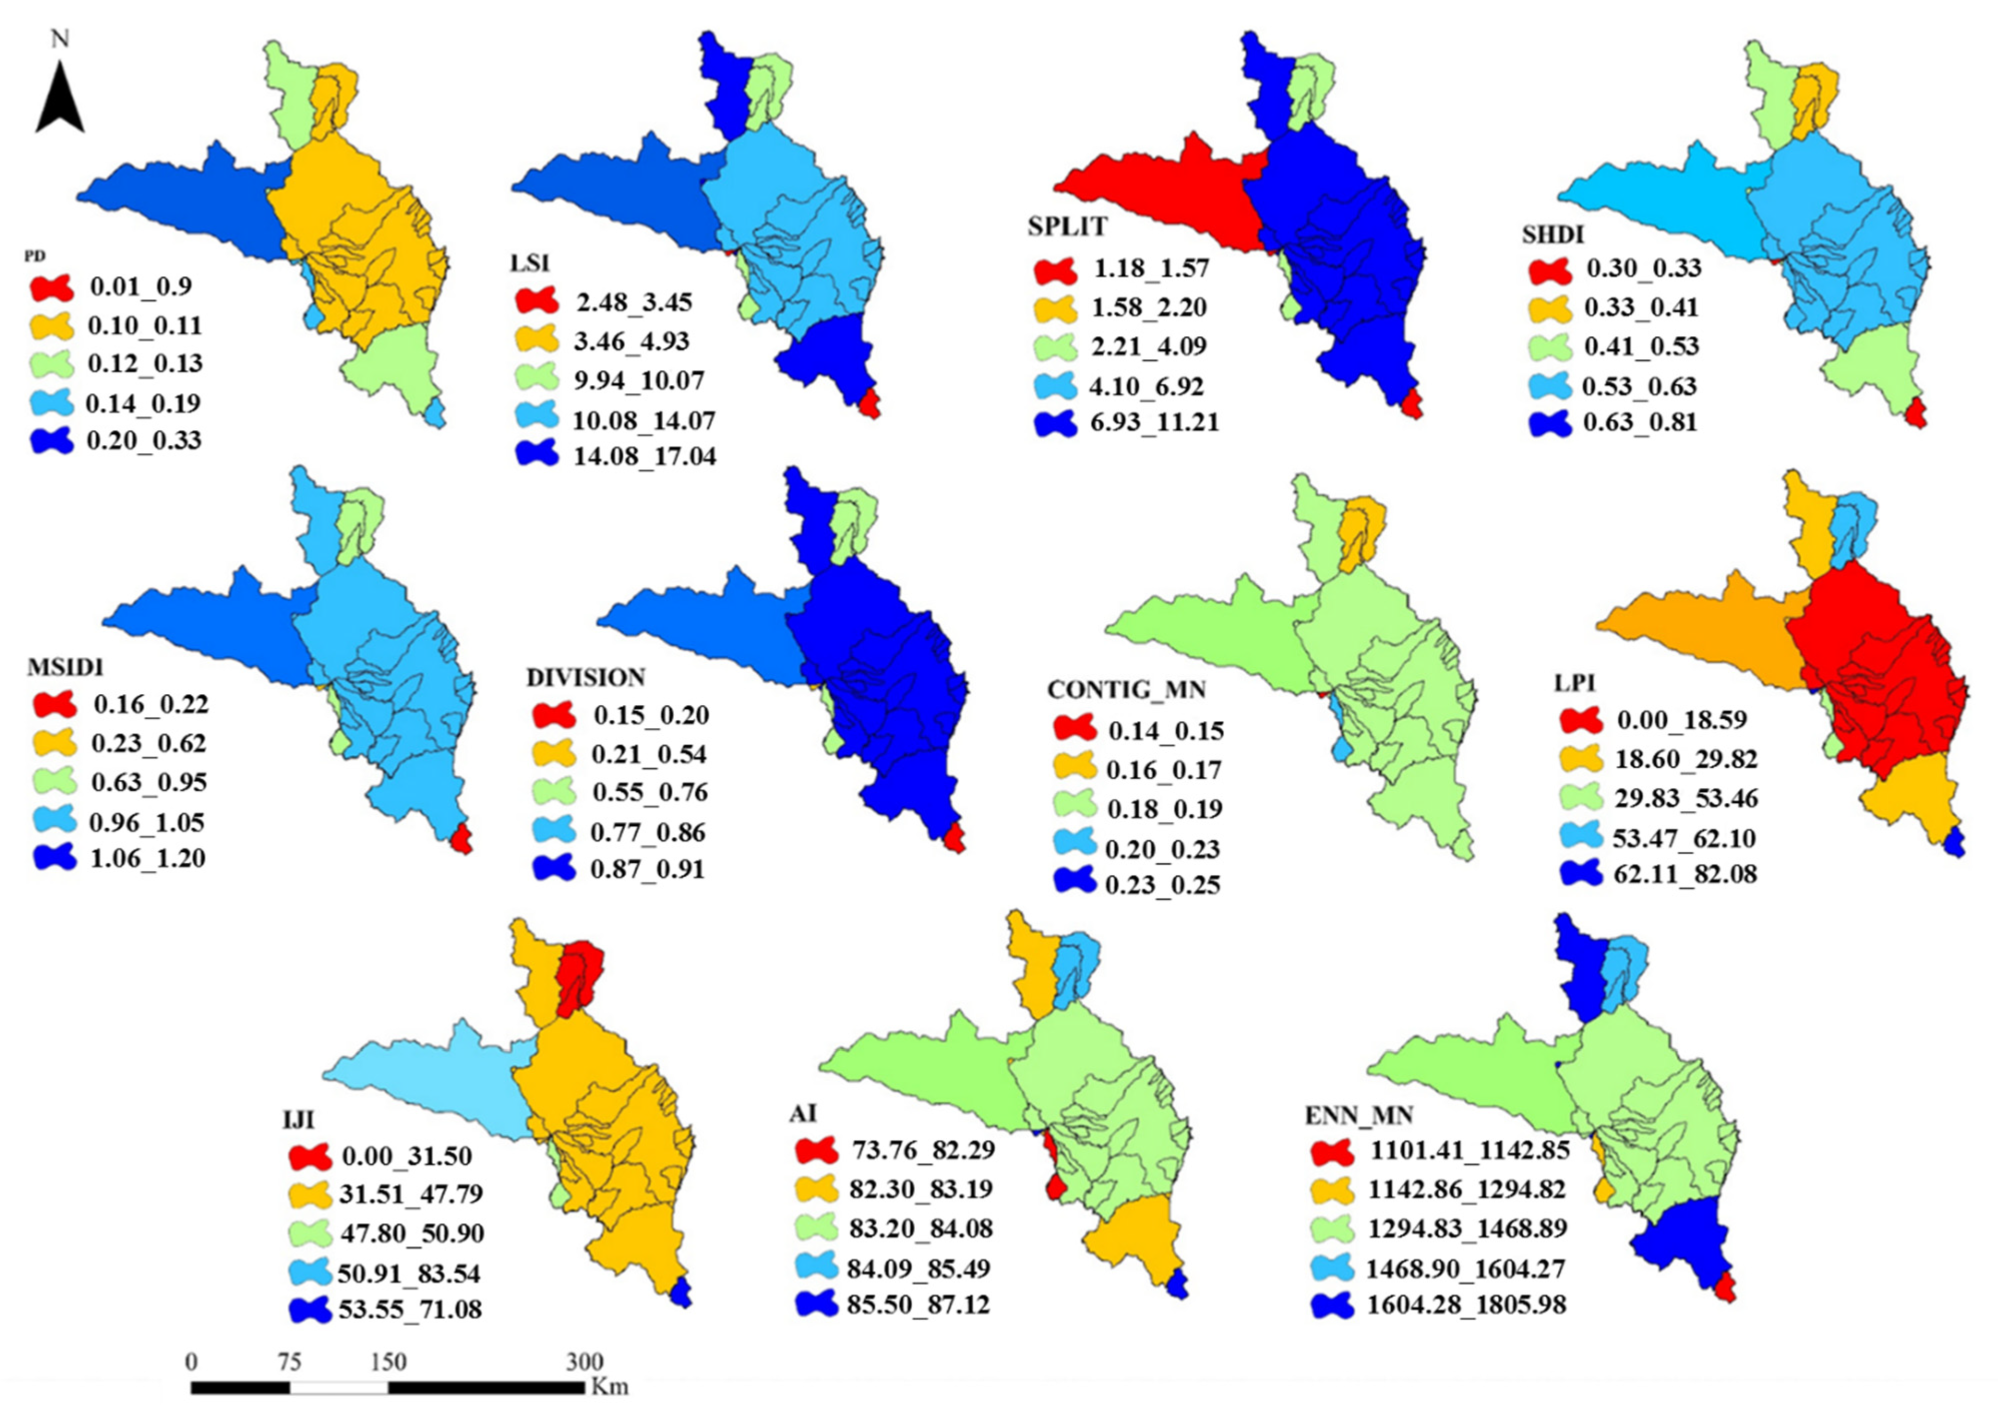
Figure 5.
Spatial variation of land cover, soil, and topography factors.
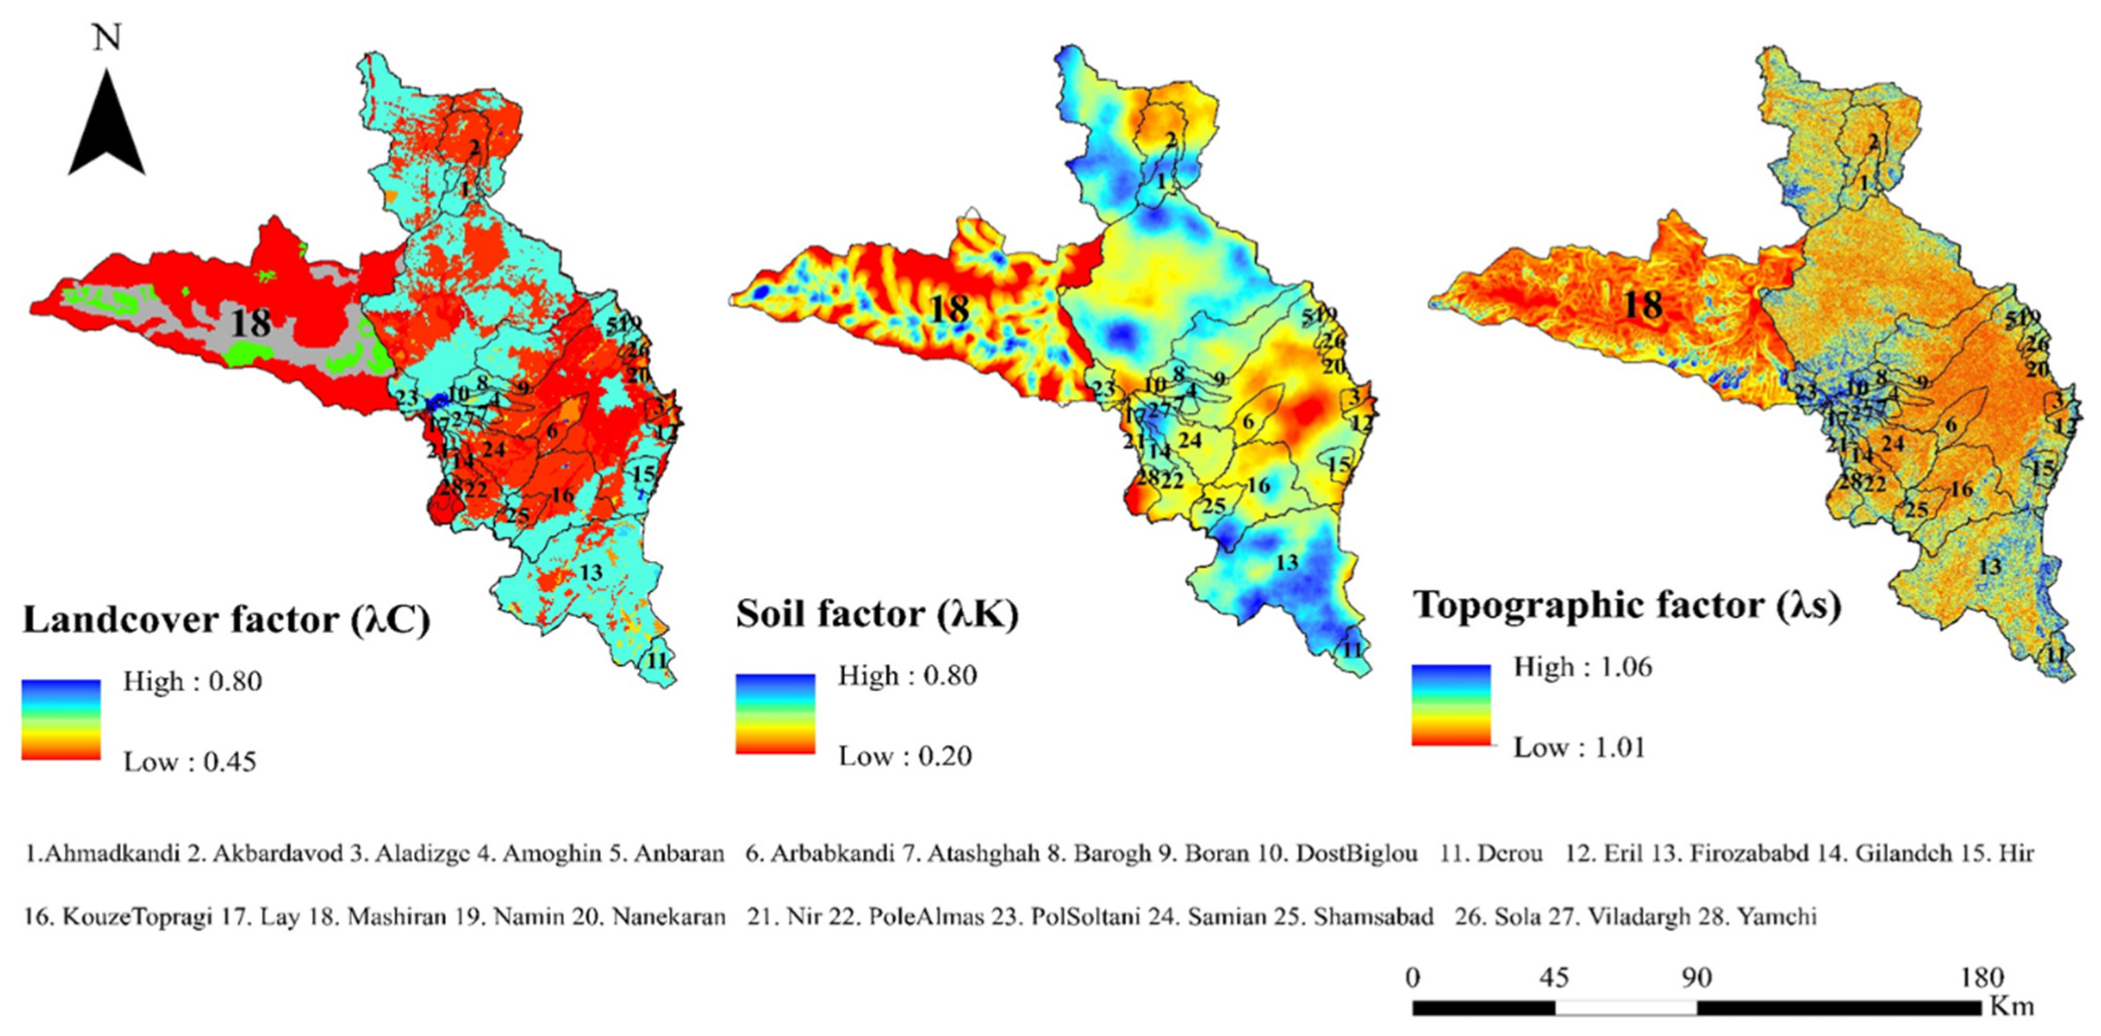
Figure 6.
Spatial variations of runoff landscape index (RLI).
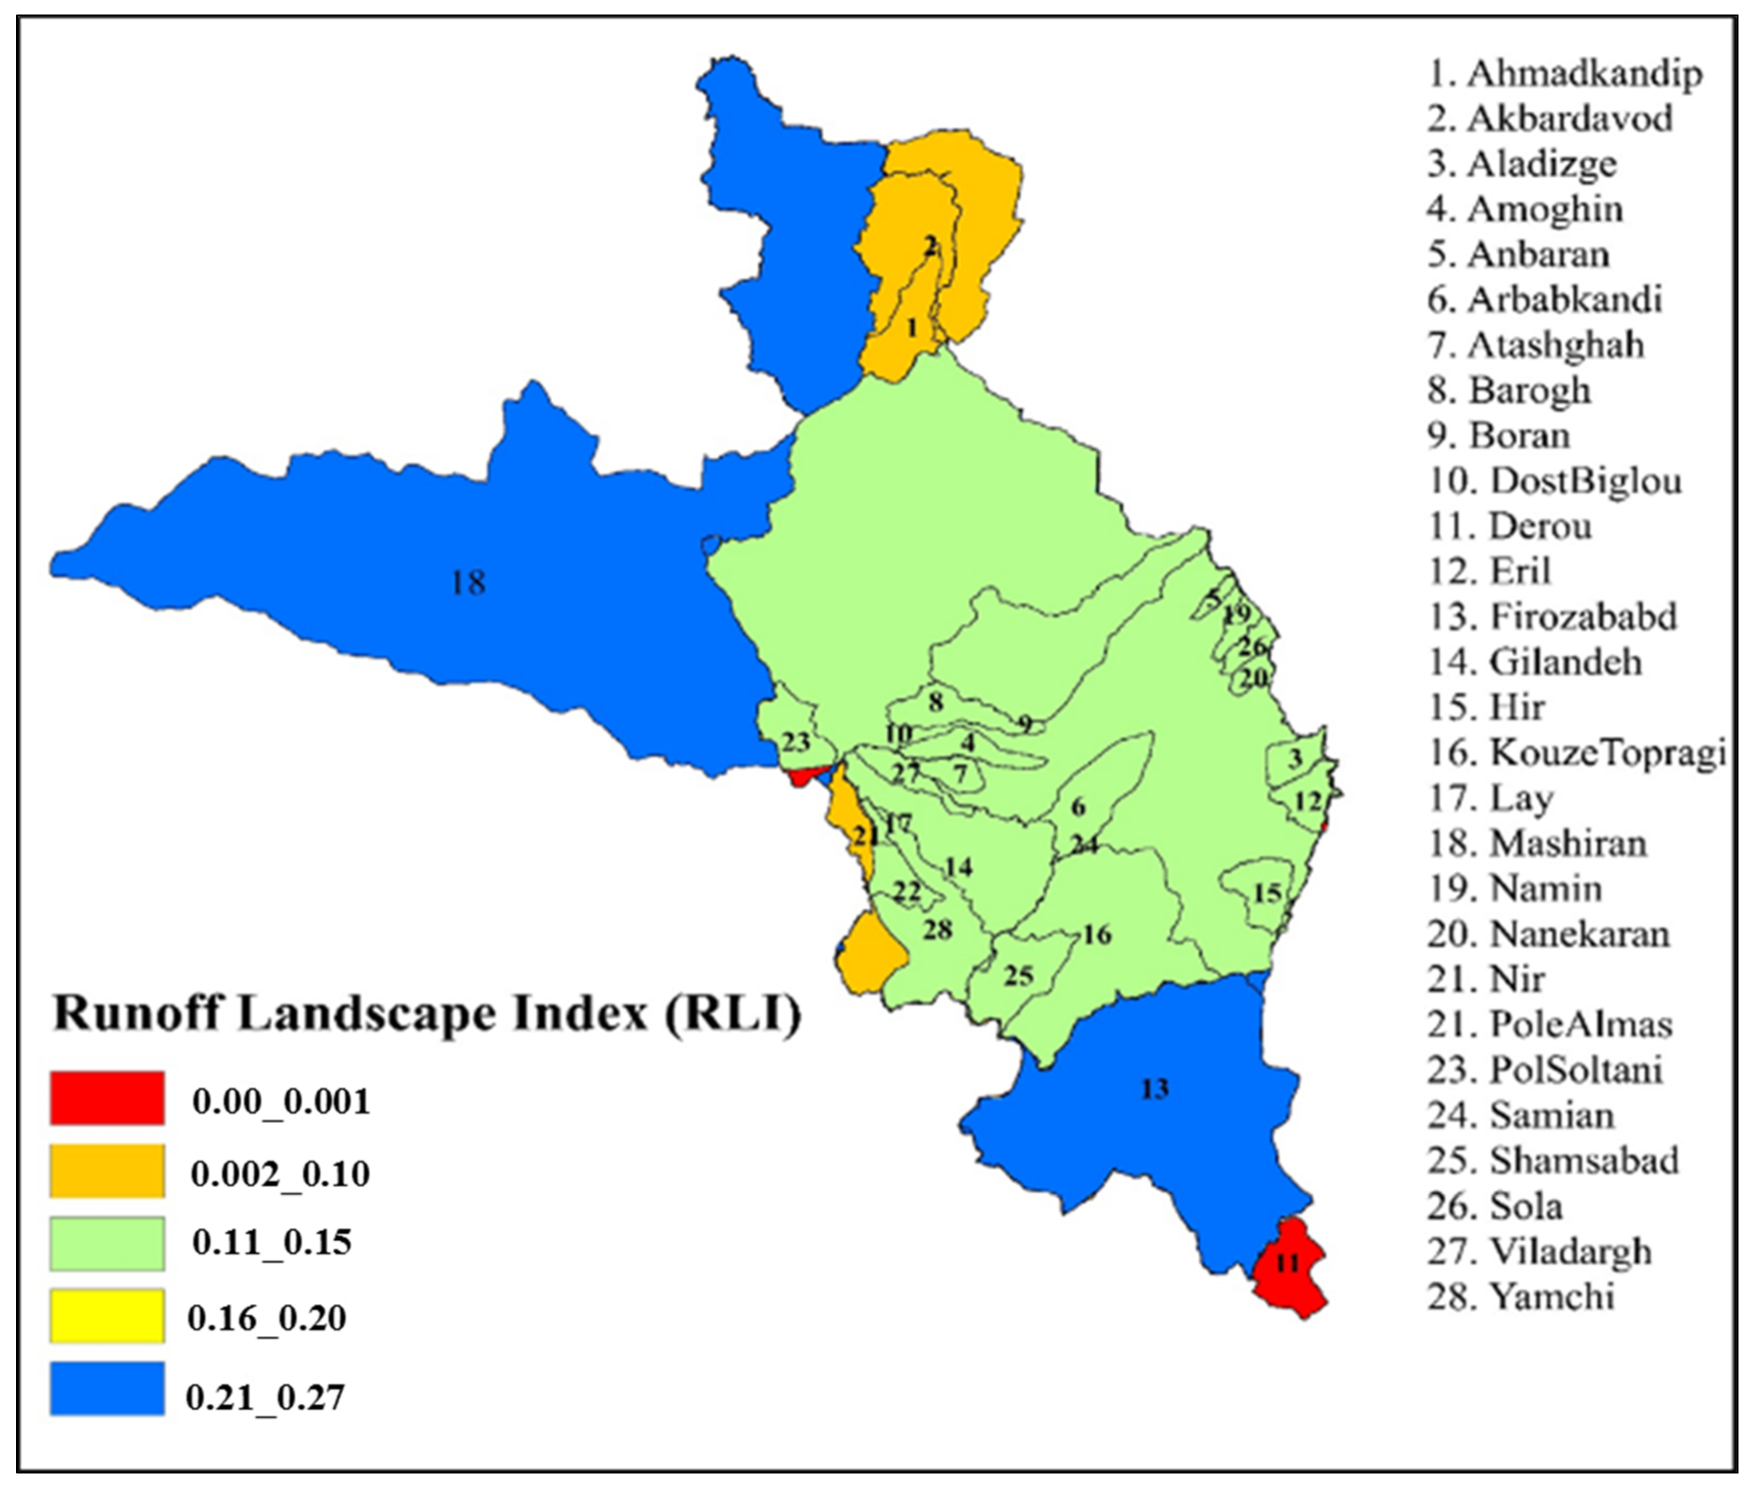
Figure 7.
Box-plot of land cover (λC), soil (λK), and topography (λS) factors and runoff landscape index (RLI).
Figure 7.
Box-plot of land cover (λC), soil (λK), and topography (λS) factors and runoff landscape index (RLI).
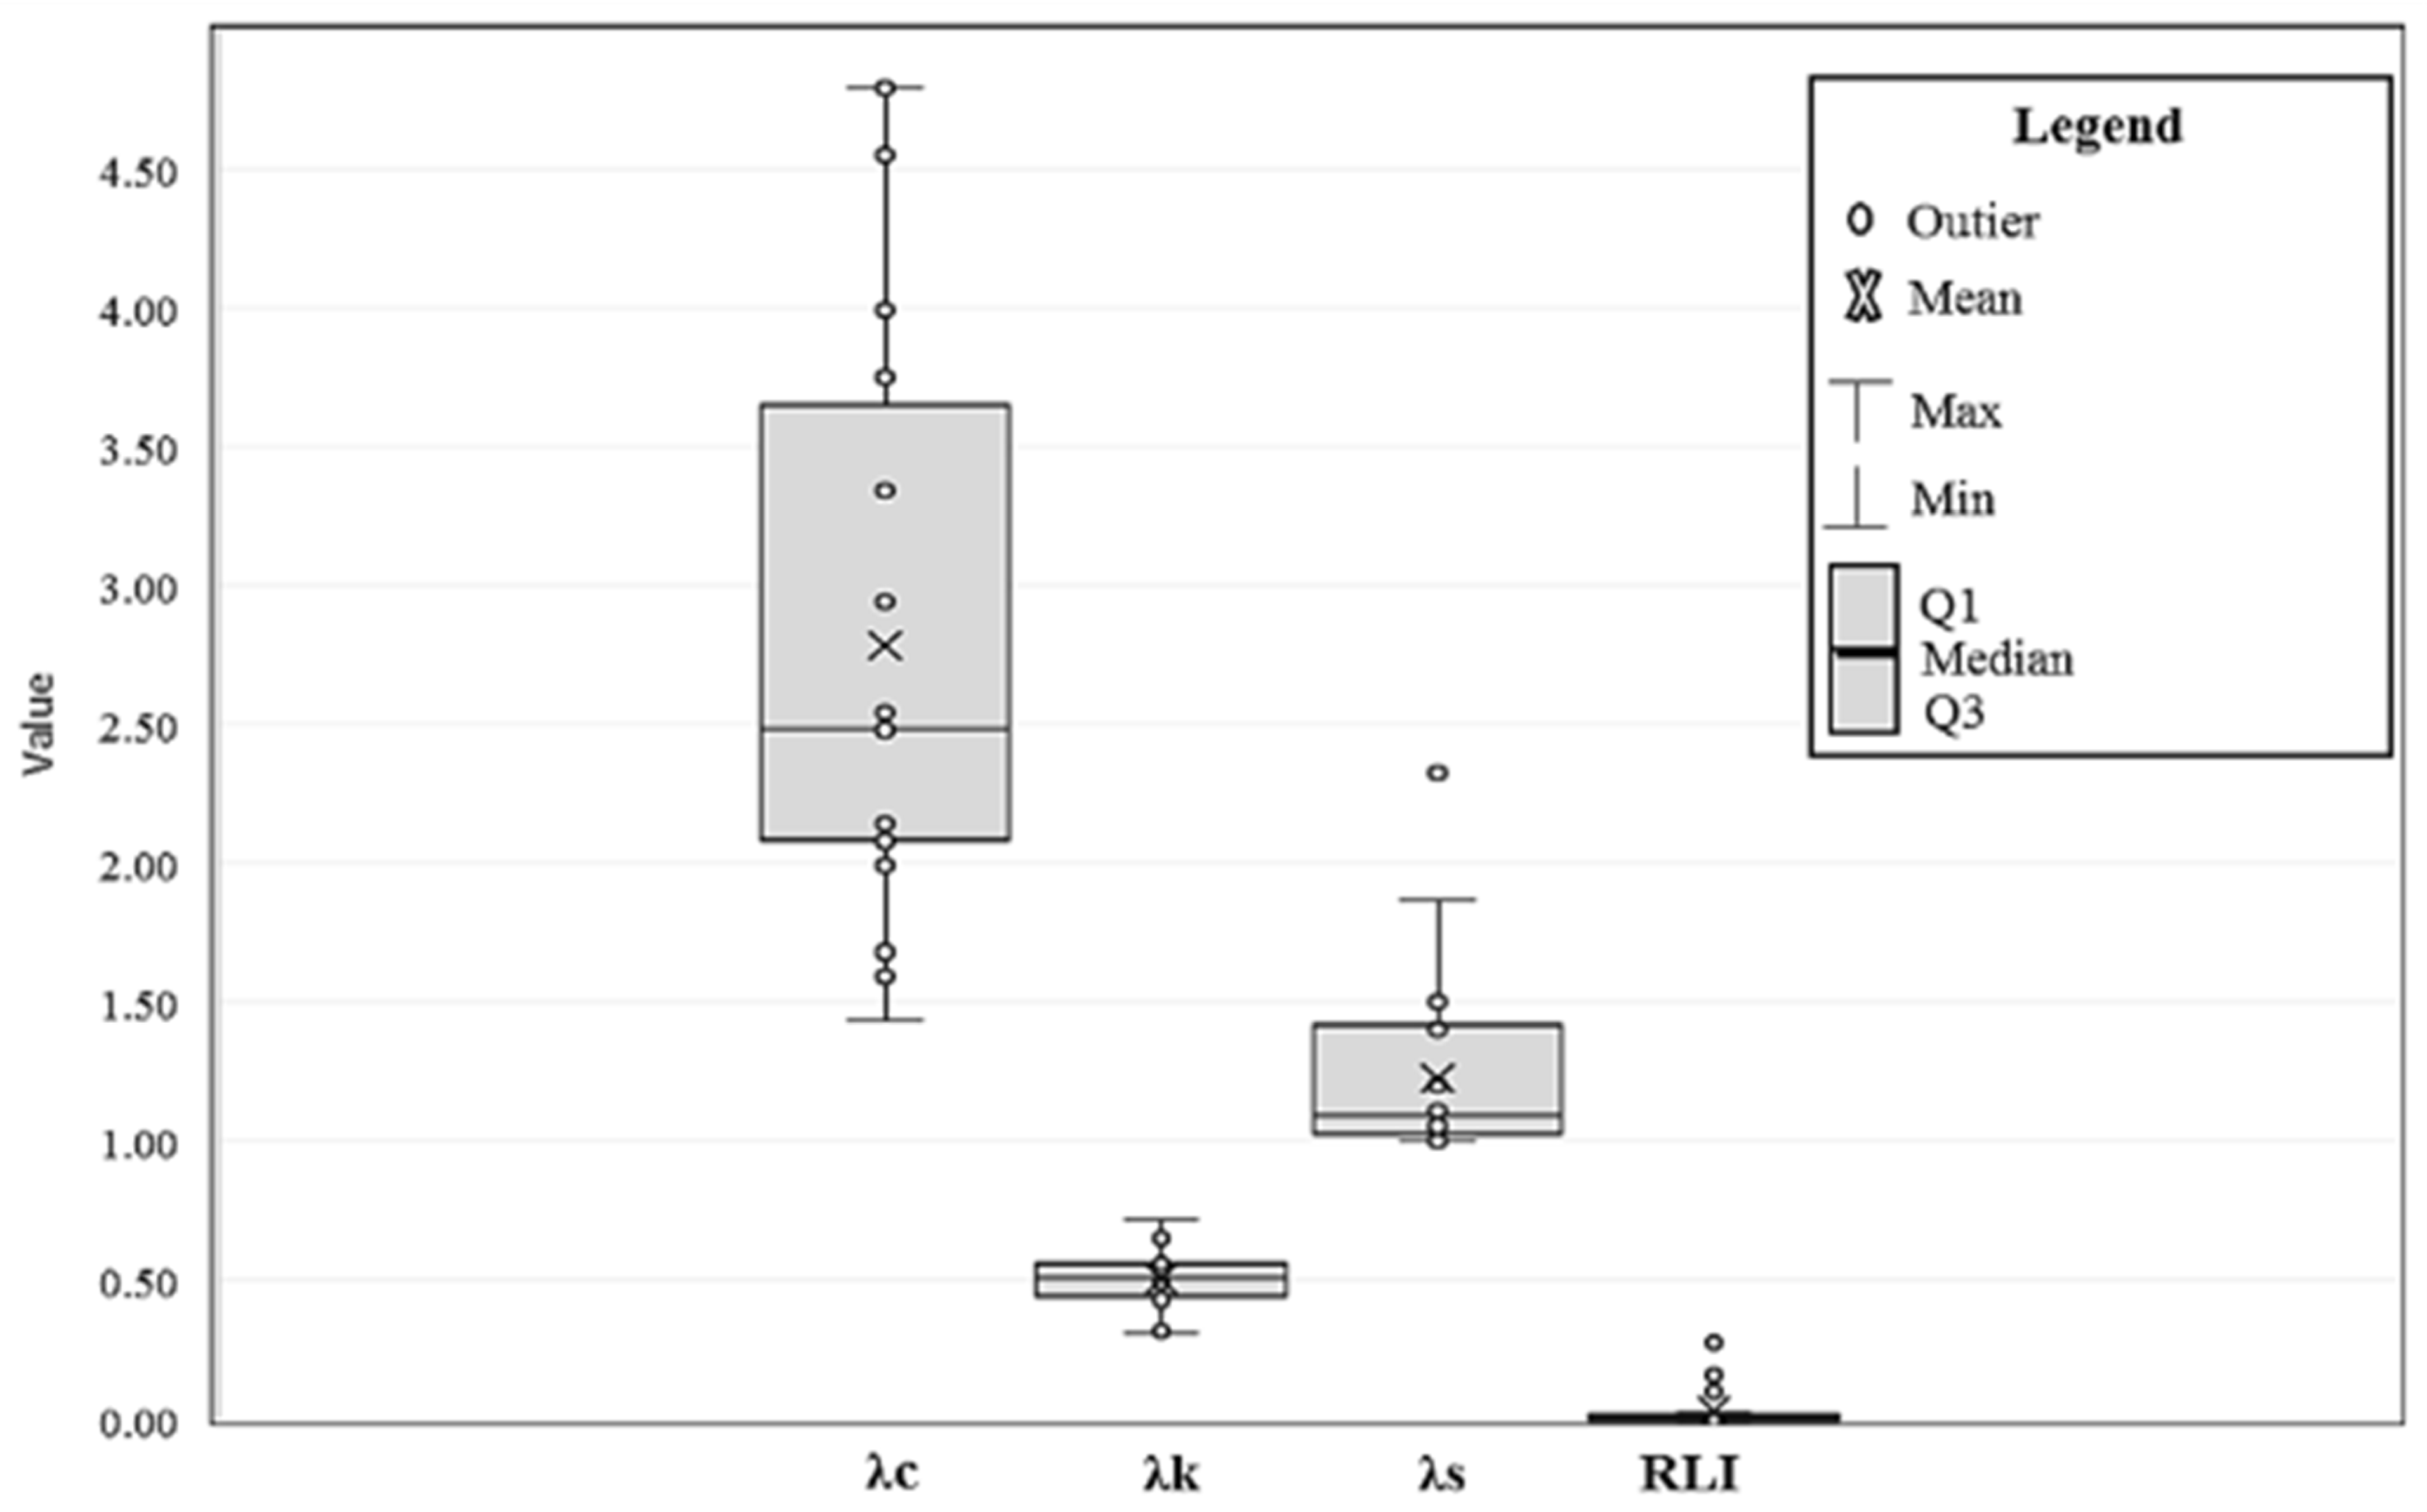
Figure 8.
Surface runoff (mm) and base flow (mm) per watersheds of Ardabil Province.
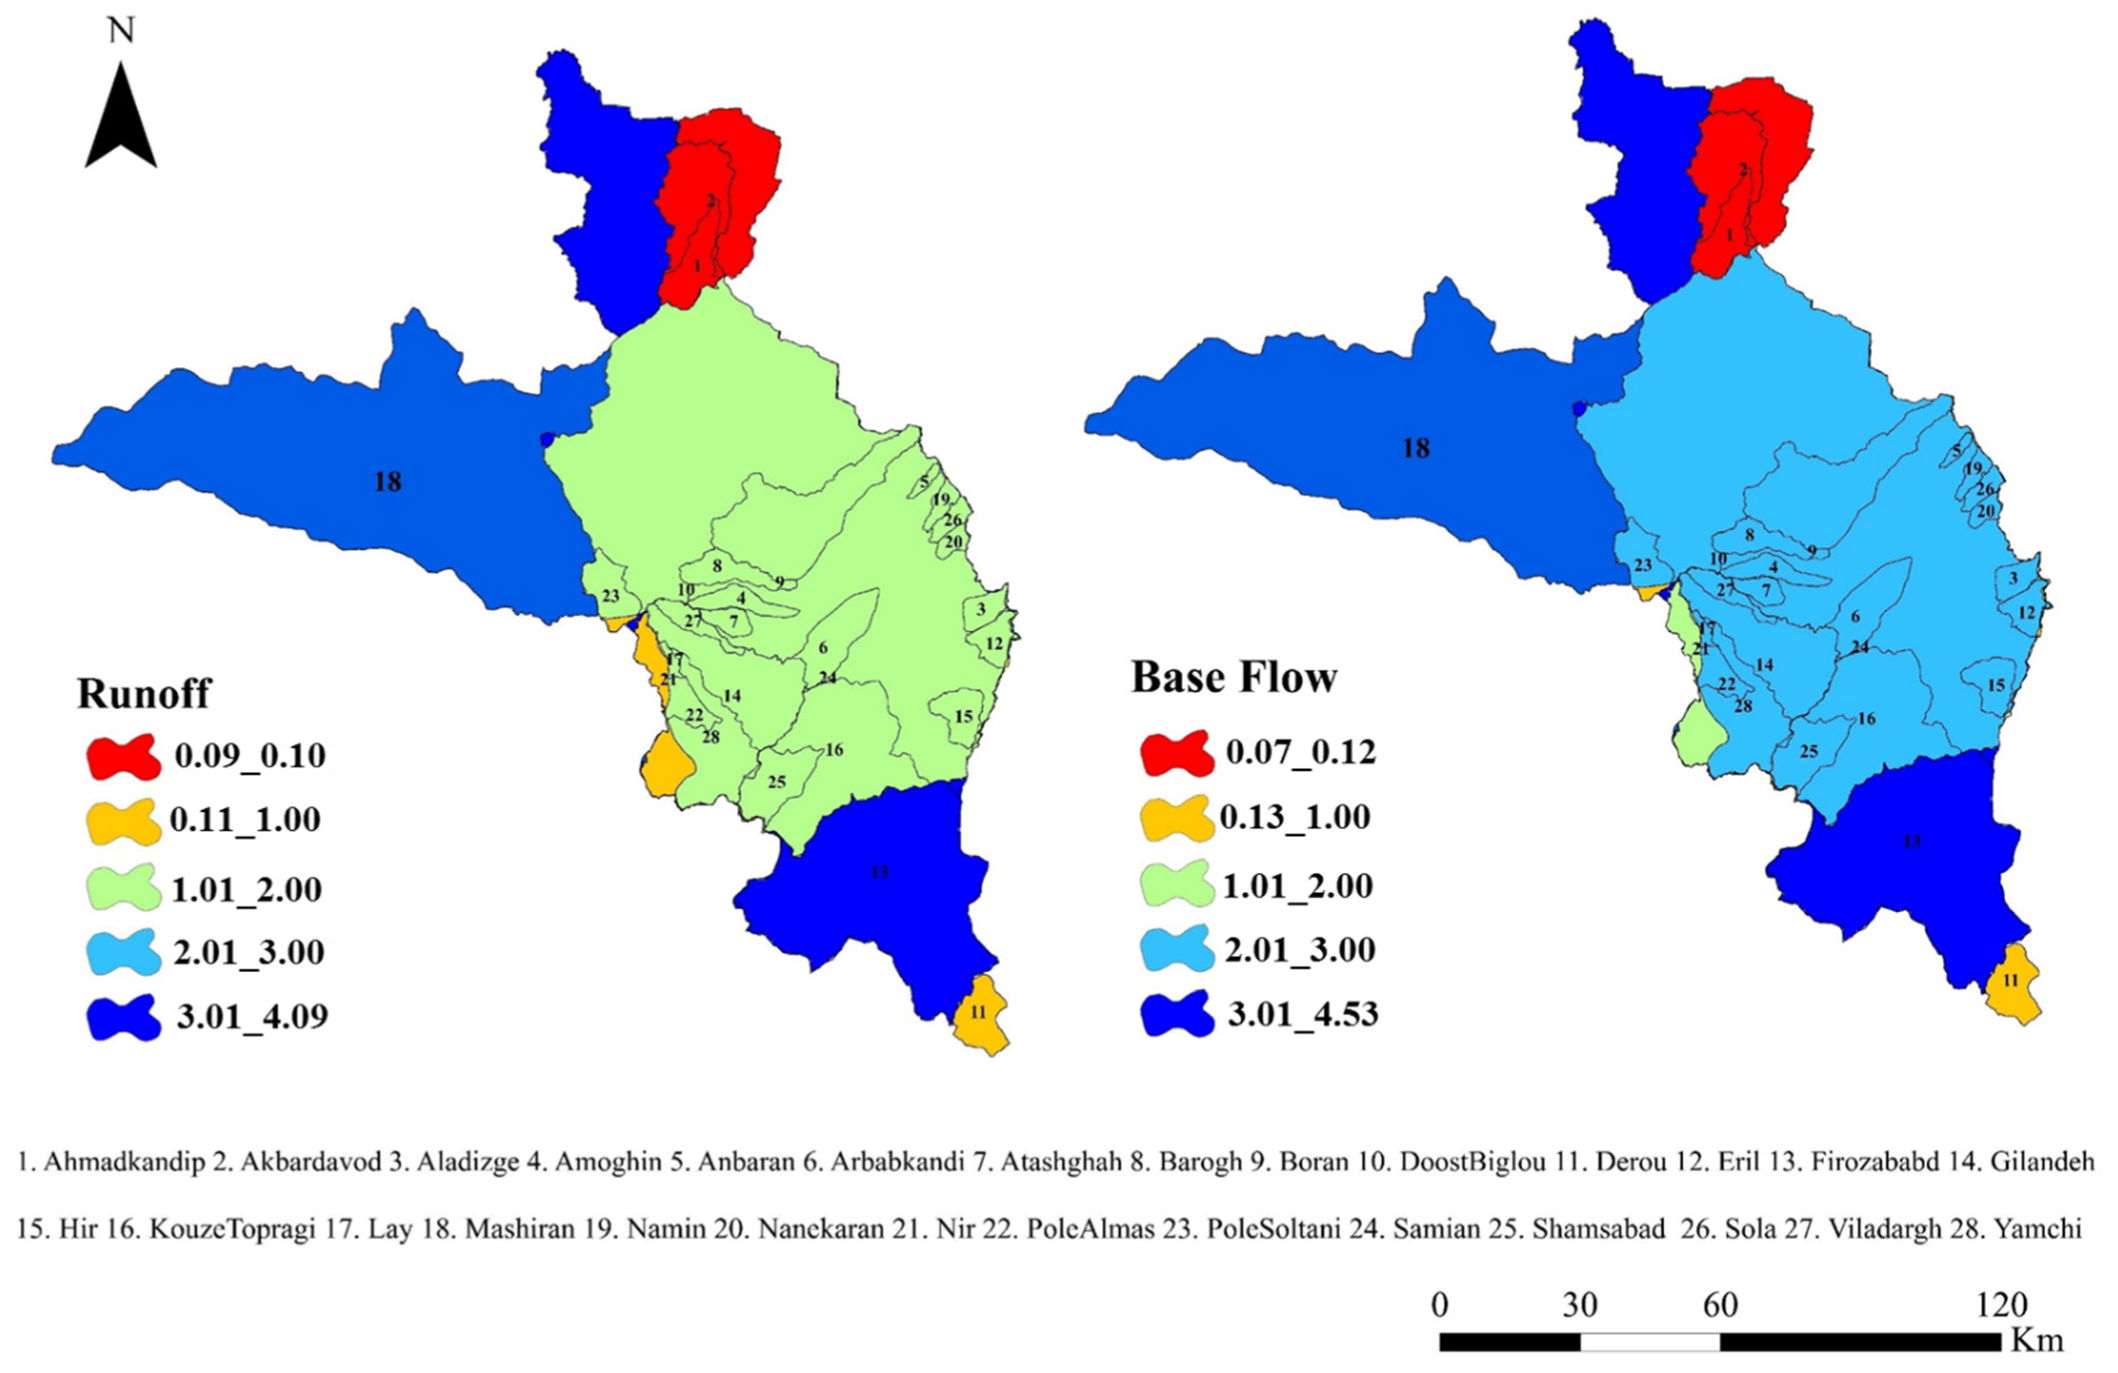
Figure 9.
Validation results for regression analysis of base flow and study variables for 25% of the study watersheds.
Figure 9.
Validation results for regression analysis of base flow and study variables for 25% of the study watersheds.


Table 1.
Landscape metrics characteristics.
| Landscape Metric | Symbol | Unit | Formula | Value |
|---|---|---|---|---|
| Patch density | PD | No. per 100 ha | PD > 0 | |
| Landscape shape index | LSI | Dimensionless | LSI ≥ 1 | |
| Splitting index | SPLIT | Dimensionless | 1 ≦ SPLIT ≦ number of cells in the landscape squared | |
| Shannon’s diversity index | SHDI | Dimensionless | 0 ≦ SHDI ≦ 1 | |
| Modified Simpson’s diversity index | MSIDI | Dimensionless | MSIDI ≥ 0, without limit | |
| Landscape division index | DIVISION | Dimensionless | 0 ≦ DIVISION ≦ 1 | |
| Contiguity index distribution | CONTIG_MN | Dimensionless | 0 ≦ CONTIG_MN ≦ 1 | |
| Largest patch index | LPI | % | 0 < LPI ≦ 100 | |
| Interspersion and juxtaposition index | IJI | % | 0 < IJI ≦ 100 | |
| Aggregation index | AI | % | 0 ≦ AI ≦ 100 | |
| Mean Euclidean nearest neighbor distance | ENN_MN | m | ENN_MN > 0, without limit. |
Table 2.
Land cover factor (λC) value used for different vegetation types.
| Land Cover Classification | Reference | Study Area | Rainfall Interception Loss (%) | Land Cover Factor (λC) | |
|---|---|---|---|---|---|
| Forest | Pinus nigra | [32] | Reforest Campus of University Agriculture Shirvan | 34.77 | 0.46 |
| Cupressus sempervirens | 44.97 | 0.45 | |||
| Robinia pseudoacacia | 9.78 | 0.8 | |||
| Platanus orientalis | 5.5 | 0.83 | |||
| Natural stand (Fagus orientalis) and exotic plantation (Picea abies) | [33] | Siahkal Forests, Gilan | 11.7 | 0.77 | |
| Fagus orientalis Lipsky | [34] | Kheyrud forest research station of University of Tehran | 33.7 | 0.47 | |
| Quercus brantii | [35] | Zagros forests, Ilam | 58.26 | 0.41 | |
| Pinus eldarica | [36] | Tehran Chitgar Forest Park | 59.25 | 0.41 | |
| Cupressus | 62.28 | ||||
| Fagus orientalis Lipsky | [37] | Educational-research Forest of Shast-Kalateh of Gorgan | 60.7 | 0.40 | |
| Fagus Orientalis Lipsky | [38] | Siyahkal Shenrood Forests (Caspian Region) | 51.3 | 0.40 | |
| Quercus castaneifolia | [39] | Kheyrud Forest Research Station of Tehran | 0.26 | 0.79 | |
| Shrub lands | Rosa persica | [40] | Campus of the Ferdowsi University of Mashhad, Khorasan Razavi | 22 | 0.78 |
| Peganum harmala | 39 | 0.45 | |||
| Fagus orientalis and a Picea abies | [41] | Kelardasht Region, North of Iran | 48.6 26.5 | 0.43 0.75 | |
| Bush | [42] | Haihe River Basin, China | 11.26 | 0.79 | |
| Grassland | Belongs to grasslands with long grass | [43] | South Central Great Plains, USA | 44 | 0.55 |
| Grass | [42] | Haihe River Basin, China | 3.78 | 0.85 | |
| Wetlands | Appartient à un lagon natural | [44] | Upstream of the Biebrza watershed, Poland | 13 | 0.80 |
| Agricultural land | Fermes corn | [45] | Agricultural land in Varmin, located southwest of Tehran (Iran) | 11.2–19.9 | 0.40 |
| Urban land | Urban areas | [46] | Tianjin, Haihe Watershed, China | 48.2–64 | 0.50 |
| Urban catchments | [47] | 20 urban watersheds from around the world | 32.82 | ||
| Evergreen benjamin tree F. | [48] | Querétaro City in central Mexico | 2.4 | 0.78 | |
| Rural land | Rural areas | [46] | Tianjin, Haihe Watershed, China | 85–66 | 0.40 |
| Bare land | Bare land | [49] | Yangou Watershed, southern China | 21.28 | 0.80 |
| Drainage Class | Very Poor | Poor | Imperfectly | Moderately Good | good | Somewhat Excessive | Excessive |
|---|---|---|---|---|---|---|---|
| Runoff coefficient | 0.8 | 0.7 | 0.6 | 0.5 | 0.4 | 0.3 | 0.2 |
Table 4.
Results of the correlation coefficient between landscape metrics, base flow, runoff, and RLI.
Table 4.
Results of the correlation coefficient between landscape metrics, base flow, runoff, and RLI.
| PD | LPI | LSI | CONTIGMN | ENNMN | IJI | DIVISION | SPLIT | SHDI | MSIDI | AI | Base flow | Runoff | |
|---|---|---|---|---|---|---|---|---|---|---|---|---|---|
| PD | 1.00 | ||||||||||||
| LPI | 0.99 | 1.00 | |||||||||||
| LSI | 0.98 | 0.97 | 1.00 | ||||||||||
| CONTIGMN | 0.99 | 0.99 | 0.98 | 1.00 | |||||||||
| ENNMN | 0.99 | 0.99 | 0.99 | 0.99 | 1.00 | ||||||||
| IJI | 0.99 | 1.00 | 0.98 | 1.00 | 1.00 | 1.00 | |||||||
| DIVISION | 0.99 | 0.99 | 0.99 | 0.99 | 0.99 | 0.99 | 1.00 | ||||||
| SPLIT | 0.98 | 0.97 | 1.00 | 0.98 | 0.99 | 0.98 | 0.99 | 1.00 | |||||
| MSIDI | 0.99 | 0.98 | 0.99 | 0.99 | 0.99 | 0.99 | 1.00 | 0.99 | 1.00 | ||||
| SHEI | 1.00 | 0.99 | 0.98 | 1.00 | 1.00 | 1.00 | 1.00 | 0.99 | 1.00 | 1.00 | |||
| AI | 0.99 | 1.00 | 0.98 | 1.00 | 1.00 | 1.00 | 1.00 | 0.99 | 0.99 | 1.00 | 1.00 | ||
| Base flow | 0.93 | 0.93 | 0.98 | 0.94 | 0.95 | 0.94 | 0.95 | 0.98 | 0.95 | 0.94 | 0.94 | 1.00 | |
| Runoff | 0.93 | 0.92 | 0.98 | 0.93 | 0.94 | 0.93 | 0.95 | 0.97 | 0.94 | 0.94 | 0.93 | 1.00 | 1.00 |
| RLI | −0.36 | −0.58 | 0.94 | −0.26 | 0.16 | −0.21 | 0.53 | 0.88 | 0.42 | −0.01 | 0.06 | 0.89 | 0.94 |
Note: The bold and non-bold-faced numerical values respectively indicate non-significant and significant correlations at the 0.05 level.
Disclaimer/Publisher’s Note: The statements, opinions and data contained in all publications are solely those of the individual author(s) and contributor(s) and not of MDPI and/or the editor(s). MDPI and/or the editor(s) disclaim responsibility for any injury to people or property resulting from any ideas, methods, instructions or products referred to in the content. |
© 2023 by the authors. Licensee MDPI, Basel, Switzerland. This article is an open access article distributed under the terms and conditions of the Creative Commons Attribution (CC BY) license (https://creativecommons.org/licenses/by/4.0/).
Share and Cite
MDPI and ACS Style
Rasoulzadeh, A.; Mostafazadeh, R.; Mobaser, J.A.; Alaei, N.; Hazbavi, Z.; Kisi, O. Quantifying Landscape Pattern–Hydrological Process Linkage in Northwest Iran. Atmosphere 2023, 14, 1814. https://doi.org/10.3390/atmos14121814
AMA Style
Rasoulzadeh A, Mostafazadeh R, Mobaser JA, Alaei N, Hazbavi Z, Kisi O. Quantifying Landscape Pattern–Hydrological Process Linkage in Northwest Iran. Atmosphere. 2023; 14(12):1814. https://doi.org/10.3390/atmos14121814
Chicago/Turabian StyleRasoulzadeh, Ali, Raoof Mostafazadeh, Javanshir Azizi Mobaser, Nazila Alaei, Zeinab Hazbavi, and Ozgur Kisi. 2023. "Quantifying Landscape Pattern–Hydrological Process Linkage in Northwest Iran" Atmosphere 14, no. 12: 1814. https://doi.org/10.3390/atmos14121814
Note that from the first issue of 2016, this journal uses article numbers instead of page numbers. See further details here.