Article

Temporal Variation and Chemical Components of Rural Ambient PM2.5 during Main Agricultural Activity Periods in the Black Soil Region of Northeast China

1
Key Laboratory of Wetland Ecology and Environment, Northeast Institute of Geography and Agroecology, Changchun 130102, China
2
Shandong Academy of Environmental Sciences Co., Ltd., Jinan 250013, China
3
University of Chinese Academy of Sciences, Beijing 100049, China
*
Author to whom correspondence should be addressed.
Atmosphere 2019, 10(9), 510; https://doi.org/10.3390/atmos10090510
Submission received: 25 July 2019 / Revised: 24 August 2019 / Accepted: 27 August 2019 / Published: 30 August 2019
(This article belongs to the Special Issue Rural and Remote Aerosol)

Abstract

:
Agricultural emissions are crucial to regional air quality in the autumn and spring due to the intense agricultural activities in Northeast China. However, information on rural ambient particulate matter (PM) in Northeast China is rare, limiting the accurate estimation of agricultural atmospheric particulate matter emissions. In this study, we monitored hourly ambient PM2.5 (PM with a diameter of less than 2.5 μm) concentrations and analyzed daily chemical components (i.e., water-soluble ions, trace elements, organic carbon, and element carbon) at a rural site in Northeast China during the autumn and spring and assessed the impact of agricultural activities on atmospheric PM2.5 concentrations. The results showed that the daily average concentrations of PM2.5 were 143 ± 109 (range: 39–539) μg m−3 from 19 October to 23 November 2017 (i.e., typical harvesting month) and 241 ± 189 (range: 97–976) μg m−3 from 1 April to 13 May 2018 (i.e., typical tilling month). In autumn, the ambient PM2.5 concentrations were high with a Southwest wind, while a Southeast wind caused high PM2.5 concentrations during spring in the rural site. The concentrations of selected water-soluble ions, trace elements, and carbonaceous fractions accounted for 33%, 4%, and 26% of PM2.5 mass concentrations, respectively, in autumn and for 10%, 5%, and 3% of PM2.5 mass concentrations, respectively, in spring. On the basis of the component analysis, straw burning, agricultural machinery, and soil dust driven by wind and tilling were the main contributors to high rural PM2.5 concentrations. In addition, the increasing coal combustion around the rural site was another important source of PM2.5.

Graphical Abstract

1. Introduction

The effect of atmospheric particulate matter (especially fine particles with aerodynamic diameters of less than 2.5 μm, PM2.5) on human health, regional haze, and climate change is a subject of current scientific research [1,2]. Determining the current atmospheric particulate concentration levels and spatial and temporal distribution in different regions, quantitatively identifying the source of the atmospheric particulate matter, and developing an atmospheric particulate emission inventory are prerequisites for early warning and comprehensive control measures to improve regional air quality [3,4]. However, significant differences in spatial and temporal changes due to the complex composition of PM2.5 exist, especially in the presence of heterogeneous chemical reactions, which increase the uncertainty of PM2.5. Therefore, a systematic study is needed on the spatial and temporal distribution, chemical composition, and emission source characteristics of PM2.5.
Previous studies have shown that Northeastern China has become another area of high haze pollution, in addition to Beijing-Tianjin-Hebei, the Yangtze River Delta, and the Pearl River Delta. In the past 50 years (1961–2013), the average number of haze days in the Northeast region has increased significantly [5]. On an annual scale, three typical haze periods occur in Northeast China: late autumn, mid-winter, and spring. The late autumn (from mid-October to mid-November) is characterized by the highest pollution intensity, longest pollution duration, and widest impact range throughout the year [6,7]. Yan et al. found that the visibility in most cities during two heavy haze periods was less than 3 km [8]. In addition, the average visibility in Changchun city in October significantly dropped from 12 km to 7.5 km during the period 2004–2014 [9]. Fang et al. studied the pollution characteristics of PM2.5 during heavy haze pollution in Changchun City from 13 October to 1 November 2014 and found that the daily mean of PM2.5 during heavy haze was as high as 451 μg m−3 [10]. In the state-approved “Harbin-Changchun City Group Development Plan” [11], the issue of atmospheric pollution in late autumn and early winter for the city cluster was also clearly raised. In addition, poor air quality in spring is mainly related to sandstorm events, wind erosion in farmland, and agricultural tilling activities. Based on observation data, the average PM2.5 concentration at Tongyu Rural Background Station reached 261 μg m−3 in spring [12].
Agricultural activity is one of the important sources of atmospheric particulate matter [13,14,15]. The various aerosols released in agricultural production activities will first change the atmospheric environment of the local agricultural area and adjacent urban area and then cause regional haze events, especially in areas where agricultural activity is intense and dust storms are frequent [16,17]. European studies have shown that farm machinery during field soil tilling and crop harvesting is responsible for more than 80% of the total agricultural emissions [18,19]. However, spring plowing and straw burning are the main sources of serious air pollution in many agricultural areas in China [20,21]. Studies have reported that spring agricultural activities in the Northeast significantly affect the concentration of atmospheric particles in northern cities. The sum of soil dust and road dust accounts for 30–50% of the total PM10 emissions, and both soil dust and wind erosion dust are mainly due to agricultural sources [22]. In recent years, with the significant increase in planting area and crop yield and the rapid increase in the total amount of straw, the direct use of straw as domestic fuel and feed has been greatly reduced. To catch up with the farm season, farmers rush to sow and reduce the cost of straw harvesting. Northeast China is an important agricultural production base, and farmland accounts for approximately 20% of China’s total arable land [23]. Due to the short growing cycle of crops, the soil is exposed for a long time, and desertification increases [24]. With the high degree of agricultural mechanization and large amount of straw burning, soil particles, plant organisms, and fuel combustion particles from agricultural production enter the atmosphere in large quantities (e.g., PM2.5 and PM10), and the potential for emission is increased. At present, haze studies in Northeastern China mainly focus on PM2.5 concentration monitoring, preliminary physical and chemical characteristics analysis in major cities, the lack of monitoring of particulate matter, and the assessment of emissions from agricultural sources. Therefore, the systematic study of atmospheric particles and physical and chemical characteristics in the agricultural area in the region needs to be strengthened.
This study describes the emission characteristics of PM2.5 during autumn agricultural harvesting and spring agricultural tilling periods at a rural site in the black soil region of Northeast China. Using a medium-flow-rate intelligent particulate matter sampler and real-time monitor, we measured the daily and hourly PM2.5 concentrations from 19 October to 15 November 2017 and from 1 April to 7 May 2018. The main chemical components of the sampled PM2.5 were analyzed in the laboratory. Our primary objectives were to gain insight into the atmospheric pollutants generated during tilling and planting as well as during the harvest seasons to (1) reveal the characteristics of atmospheric environmental pollution in rural areas, (2) provide validation data for agricultural early warning and forecast, and (3) provide some parameters for the preparation of an emission inventory of agricultural sources.

2. Experiments and Methods
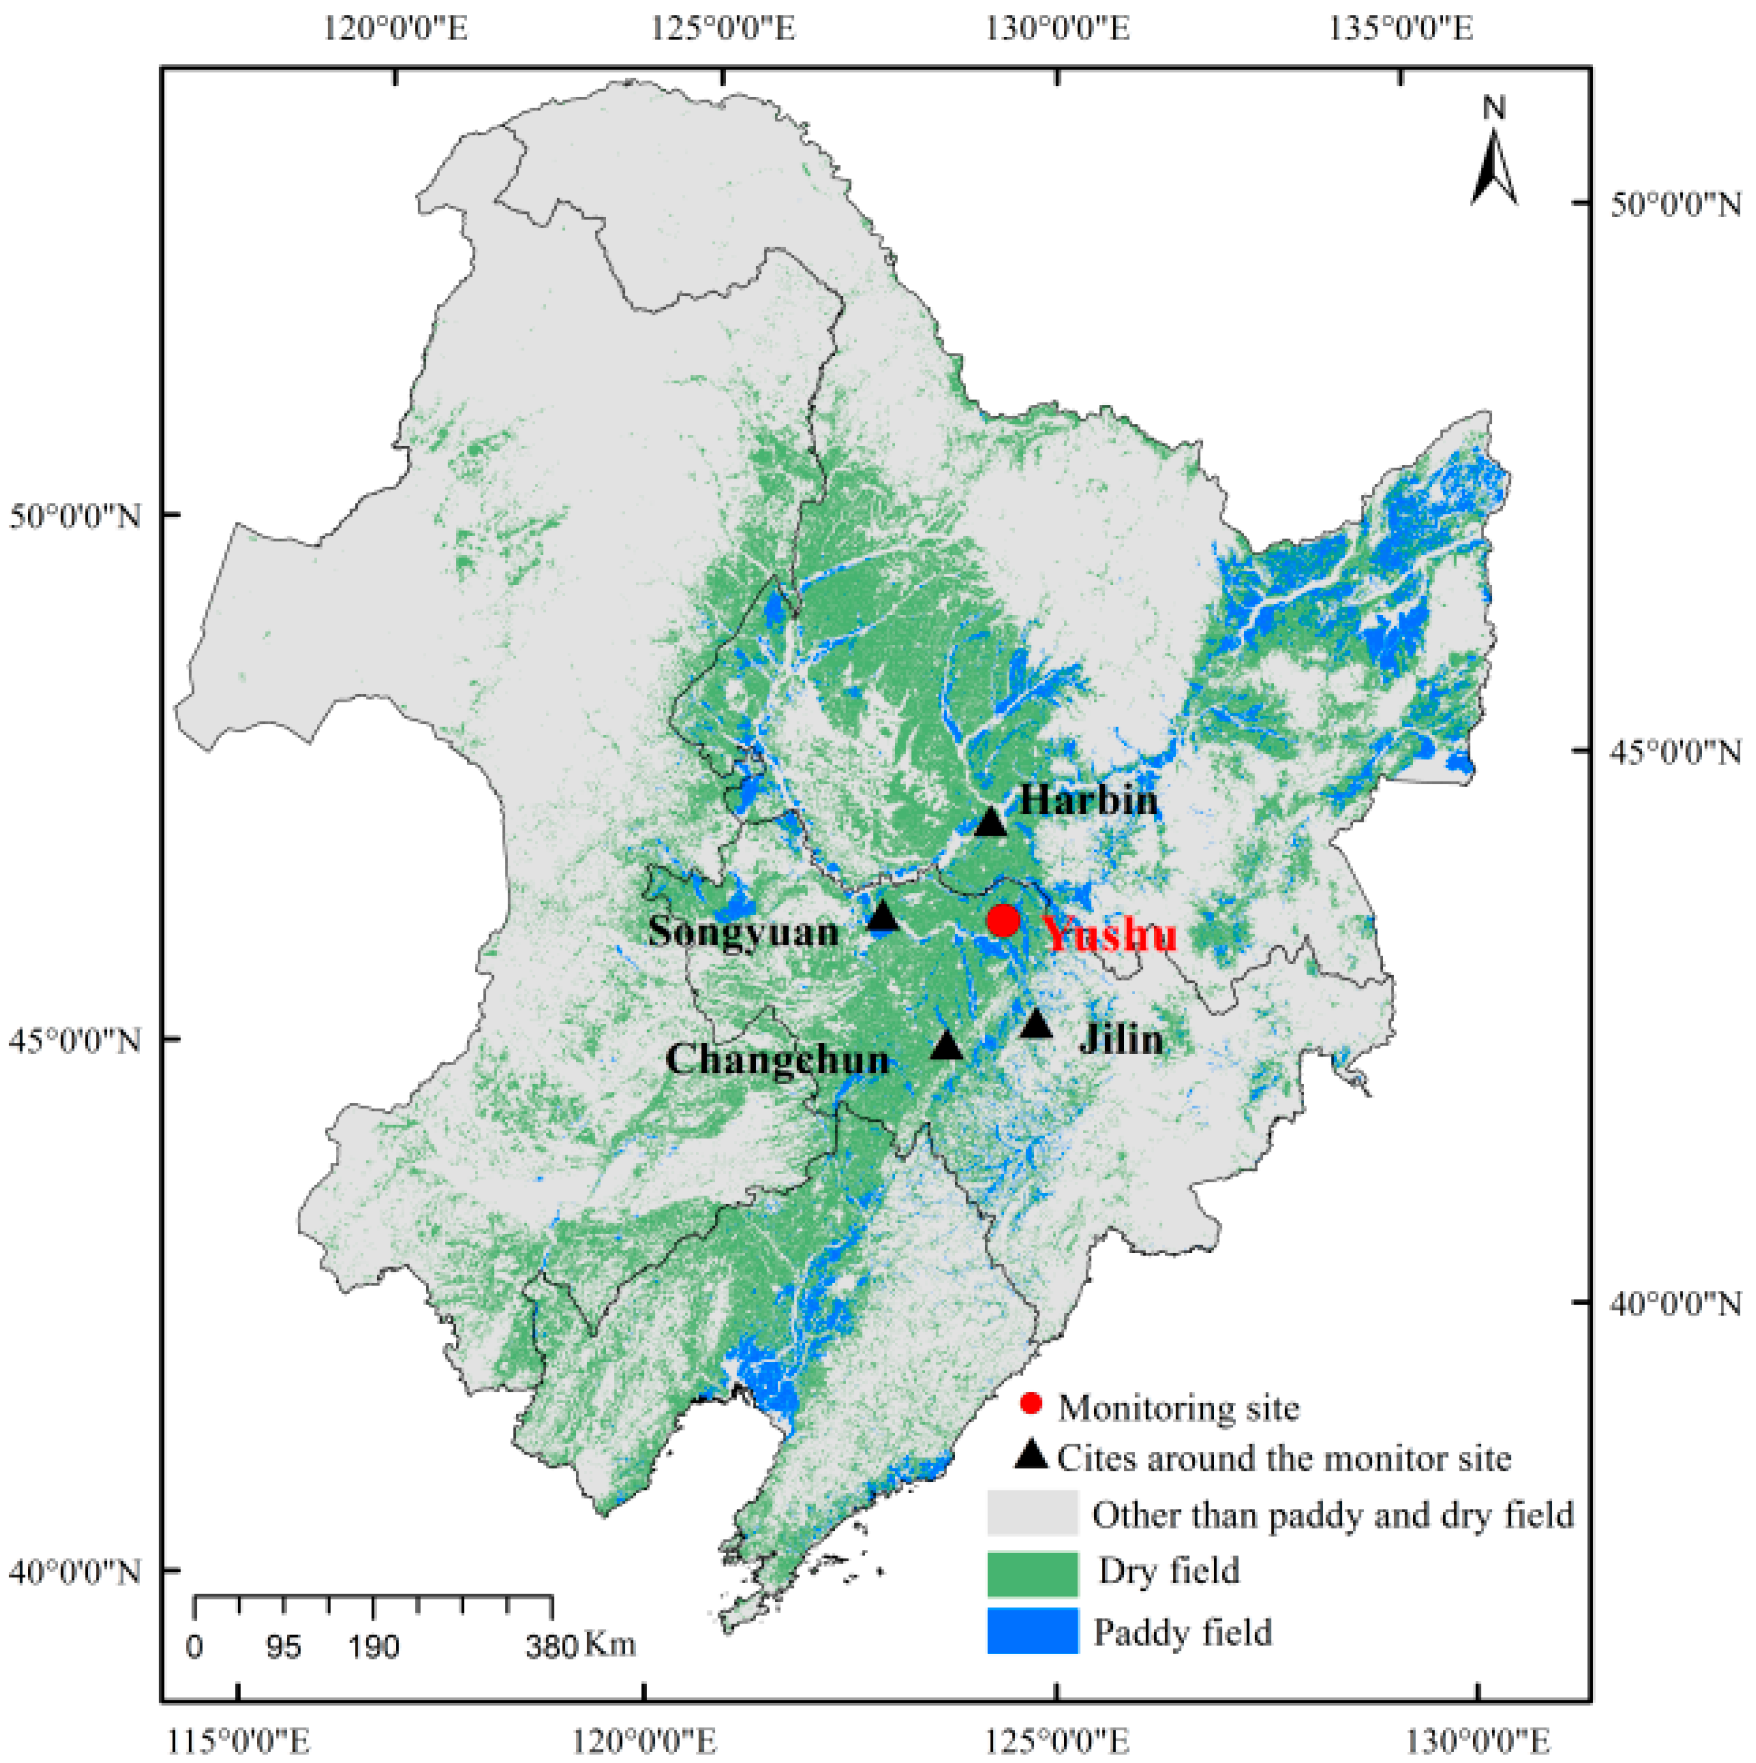
2.1. Sampling Site

The study was carried out in Yushu city, Jilin Province, and the sampling site was located at the junction between the village and the farmland in the black-soil station (44°47′24″ N, 126°25′48″ E) (Figure 1). Yushu City is located in the north-central part of Jilin Province, in the center of the triangle formed by Changchun City, Jilin City, and Harbin City. Yushu City, which is located in the world-famous gold corn belt with fertile soil and suitable climate, is an important base for the grain commodity in China. The area of cultivated land is 3896 km2, with the major crops being corn and soybean. Yushu City is in a plain located at the edge of the Changbai Mountain, with a temperate continental monsoon climate. Spring is windy, summer is wet and rainy, autumn is mild and cool, and winter is long and cold. The annual average temperature is approximately 5.3 °C, the extreme maximum temperature is 35.7 °C, and the extreme minimum temperature is −36.6 °C. In this region, spring tillage begins in April and stops at the end of May, and crop harvest and straw burning occur from October to November.

2.2. PM2.5 Sampling

Atmospheric PM2.5 was sampled daily using a filter-based gravimetric sampling method, except on rainy days, during the typical months of agricultural harvesting in the autumn of 2017, from 19 October to 15 November and during agricultural tilling in the spring of 2018, from 1 April to 7 May. The sampling height at the rural site was approximately 1.8 m above ground. A medium-flow-rate intelligent particulate matter sampler (Wuhan Tianhong Intelligence Instrumentation Facility, TH-150C, Wuhan, China) was used with a flow rate of 100 L min−1 on a 23 h basis. Quartz filters (Whatman QM-A, 90 mm, Whatman, Maidstone, UK) were applied to collect PM2.5. The mass concentrations of PM2.5 were calculated by dividing the increased weight in the filter by the standard sampling air volume. The weights of these filters were measured using an electronic microscale with an accuracy of 0.05 mg (Model XS105DU, Mettler Toledo Inc., Greifensee, Switzerland). Before filter sampling was performed, these quartz filters were preheated at 550 °C in a muffle furnace for 5.5 h to remove organic artifacts, and then the filters were placed in a desiccator at a temperature of 25 ± 1 °C and relative humidity (RH) of 45 ± 1% for >24 h. After sampling, all samples were placed in a refrigerator at 4 °C until they were analyzed in the laboratory.

2.3. Real-Time Measuremnets of PM2.5 and Meteorological Data

Real-time PM2.5 concentrations in the atmosphere were measured with the 8520 DUSTTRAK™ Aerosol Monitor (TSI Incorporated, Shoreview, MN, USA) using light scattering technology. This monitoring method has the characteristics of portability and low power supply, which can ensure that PM2.5 sample collection can be carried out smoothly in rural stations with poor infrastructure. The hourly data of PM2.5 were used in this study.
The meteorological data used in this paper were wind speed and wind direction, which were obtained from the National Meteorological Information Center (http://data.cma.cn/).

2.4. Chemical Analysis

Two filters with a radius of 8 mm were removed from the PM2.5 sampler and were extracted by an oscillator and ultrasound using 12 mL of ultrapure water (18.5 MΩ cm−1) for 30 min (the intention was to fully dissolve water-soluble ions). The extract was filtered through a 0.45 μm syringe filter of polyether sulfone. The concentrations of anions (F, Cl, NO3, and SO42−) and cations (Na+, NH4+, K+, Mg2+, and Ca2+) were determined by ion chromatography (Dionex ICS-1100, Thermo Fisher, Waltham, MA, USA). The eluent used for the anions was a 3.5 mmol Na2CO3/1.0 mmol NaHCO3 solution, whereas the cation eluent was a 20 mmol methane sulfonic acid solution; the flow rates of the anions and cations were 1.2 mL/min and 1 mL/min, respectively. The separation column used for the anions was the IonPac AS14, and the protective column was the IonPac AG14; the separation column used for the cations was the IonPac CS12A, and the protective column was the IonPac CG12A. During the analysis process, a standard solution sample was checked after every 10 samples to verify the accuracy of the instrument measurement and strictly control for quality.
Two filters with a radius of 8 mm were removed from the PM2.5 sampler for the analysis of 19 trace elements (Al, Ba, Ca, Cd, Co, Cr, Cu, Fe, K, Mg, Mn, Mo, Nd, Ni, Pb, Sr, Ti, V, and Zn) by inductively coupled plasma atomic emission spectrometry (ICP-AES) (ICPE-9000, Shimadzu Corporation, Kyoto, Japan). First, the filter samples were extracted in Teflon tubes by adding 10 mL of mixed acid solution (8 mL HNO3, 1 mL H2SO4, and 1 mL HF) at approximately 170 °C on an electric heating plate for approximately 2.5 h. Then, after the digestion liquid was cooled, 10% nitric acid was added to bring the sample to 10 mL, and the trace elements were identified.
Organic carbon and elemental carbon (OC and EC) were determined with a carbon analyzer (RT-4, Sunset Lab, St. George, UT, USA). The sample was heated in a pure helium atmosphere, and, as the temperature was increased to 870 °C, carbonate volatilized from the sample. The carbon evolving during heating was catalytically oxidized to CO2 by a MnO2 catalyst, then reduced to CH4 in an Ni/firebrick methanator to be quantified by a flame ionization detector (FID) [25,26]. The temperature of the stove decreased and then increased again to 870 °C in an oxidizing atmosphere of 2% oxygen (O2) with 98% He. The EC was converted into carbon dioxide (CO2) in the oxidation oven and detected by FID.

2.5. Data Analysis

The hourly PM2.5 mass concentrations, wind speed, and wind direction were determined to analyze the relationship among them. Linear correlations between anions and cations within the water-soluble ions were determined.
Ion balance calculations are often used to study the acid–base balance of ions in aerosol particles [27]. The equations used to calculate the charge balance between cations and anions were as follows:
Anion   equivalents   =   NO 3 62 + SO 4 2 48 + Cl 35.5 + F 19 ,
Cation   equivalents   =   K + 39 + Na + 23 + Ca 2 + 20 + NH 4 + 18 + Mg 2 + 12 ,
The Enrichment Factors (EF) of each trace element were calculated using the equation given below:
EF i = ( C i / C R ) sample ( C i / C R ) crust
where EFi is the enrichment factor of element i, Ci is the concentration of element i, CR is the concentration of the reference element R, (Ci/CR) sample is the ratio of element i to reference element R in the PM2.5 sample, and (Ci/CR) crust is the ratio of element i to reference element R in the crust. Crustal elements from Wei et al. [28] were used to calculate the EFs in the denominator. Statistical analysis and plotting were performed using the software SigmaPlot 10.0 (SPSS Inc., Chicago, IL, USA) and R-packages.

3. Results and Discussion

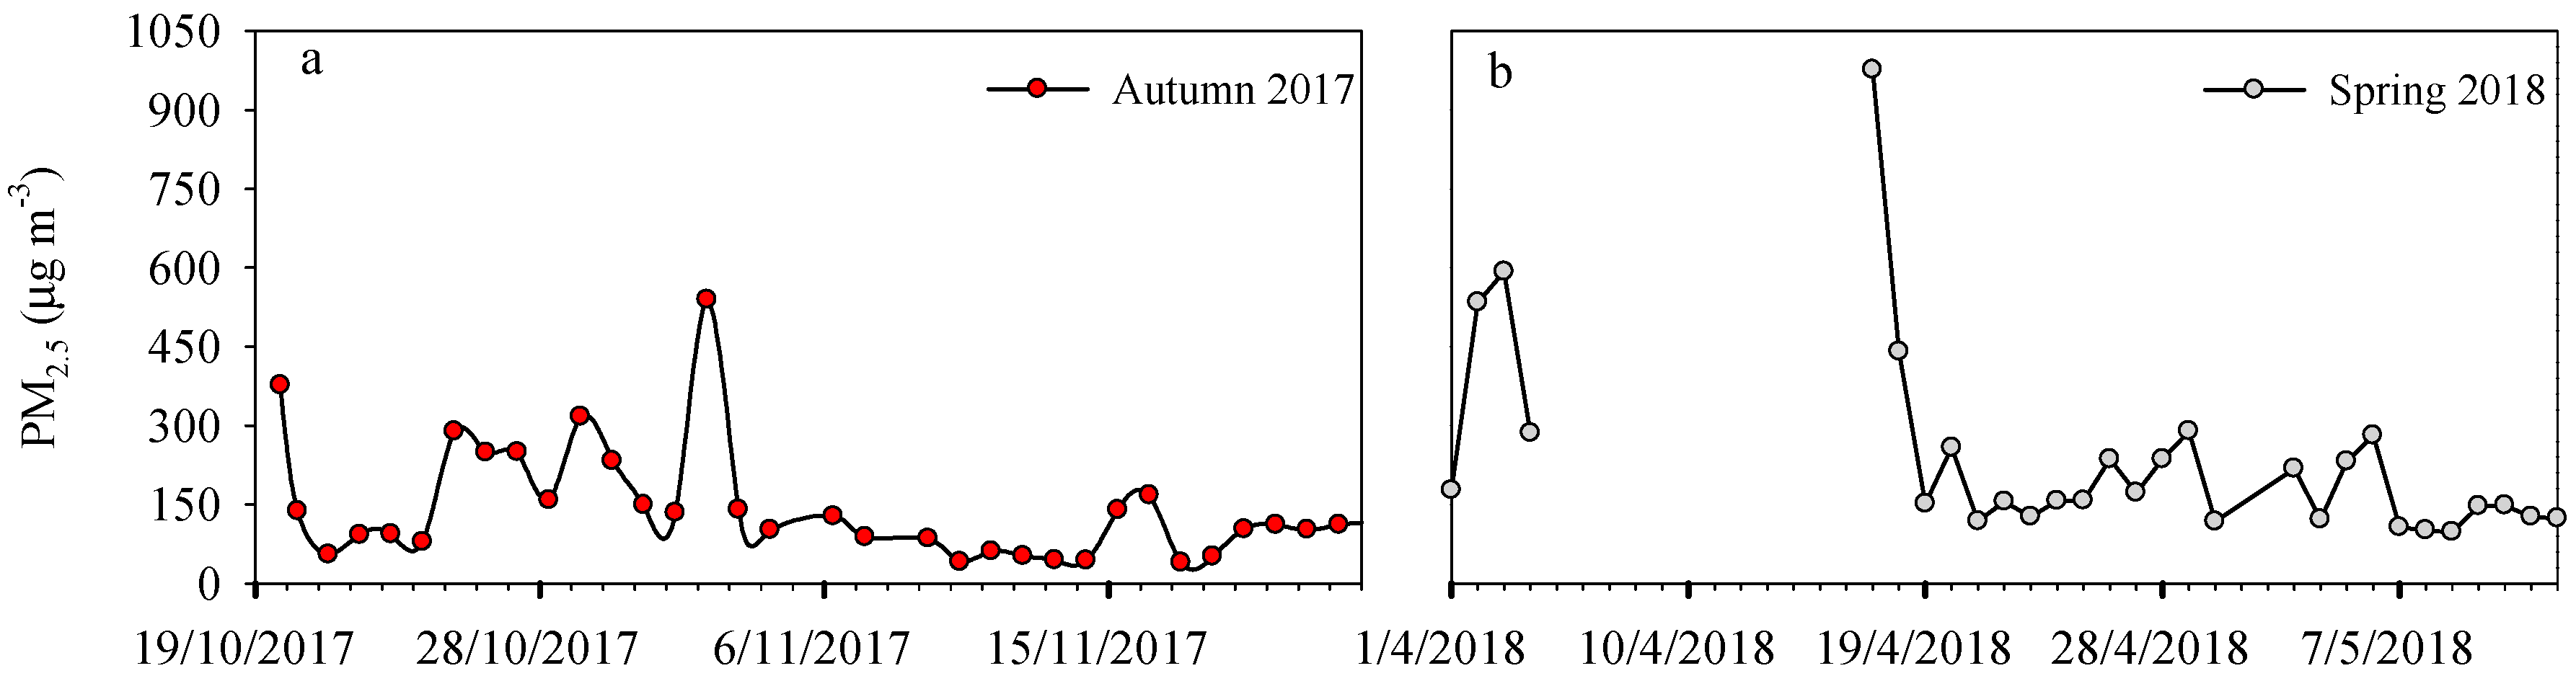
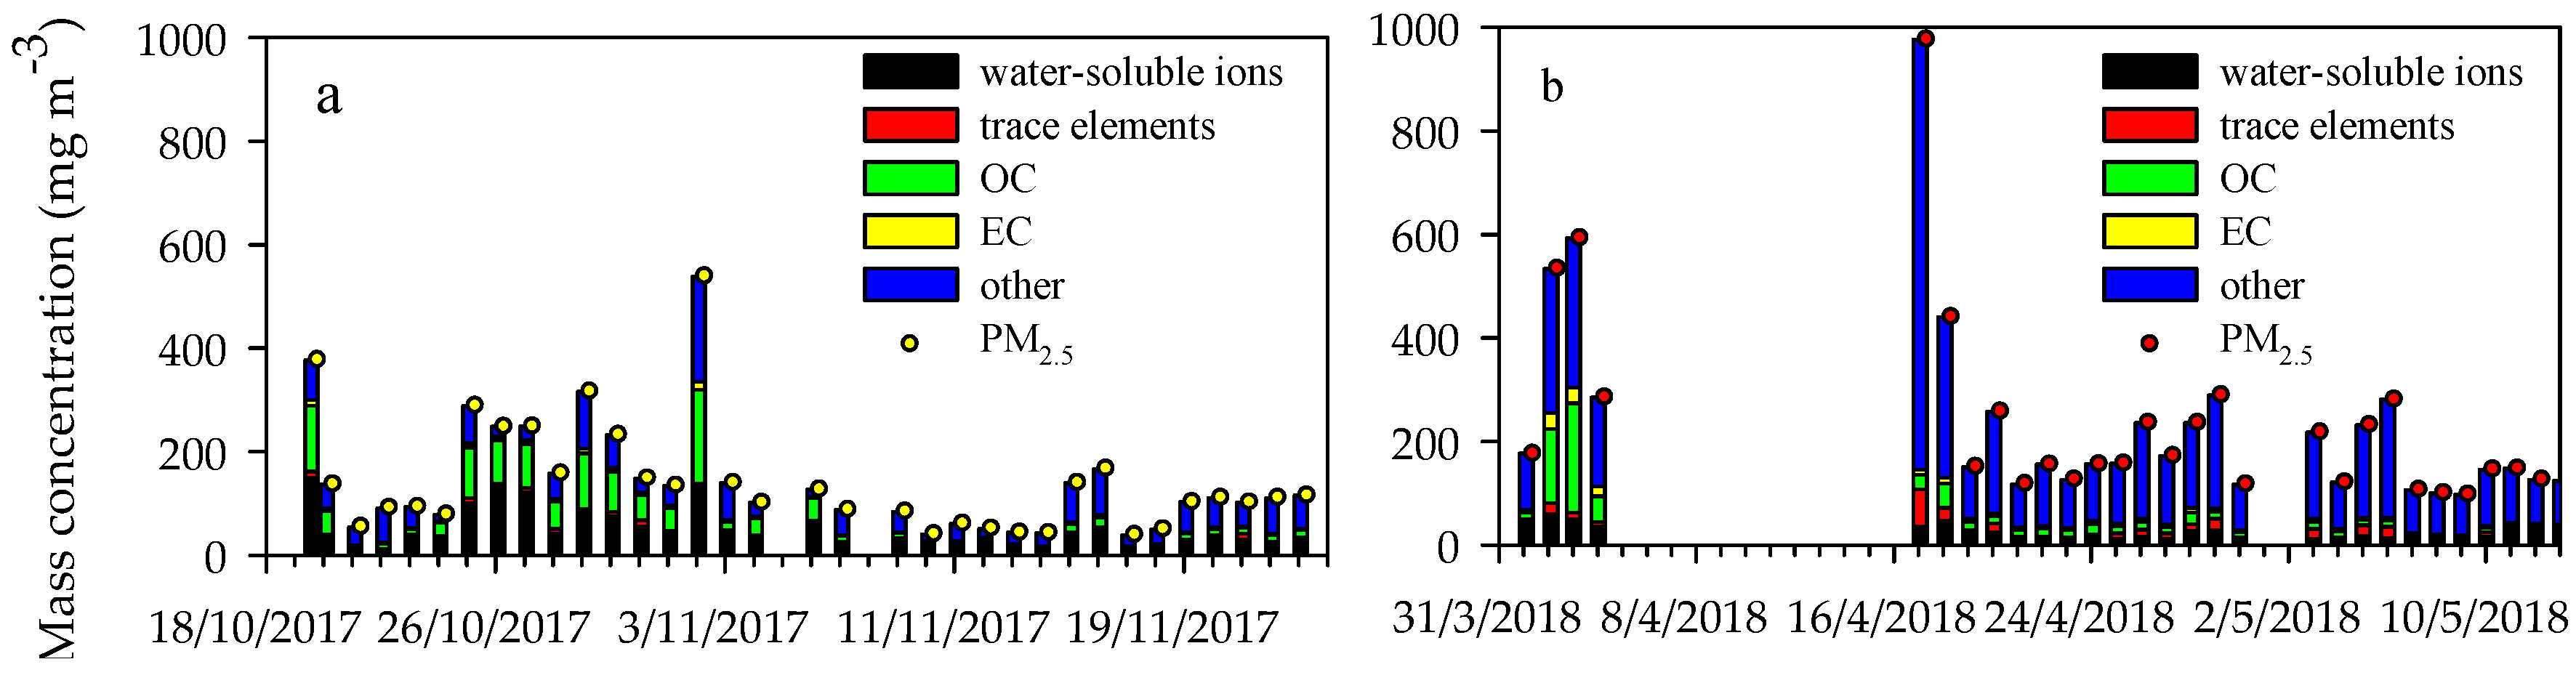
3.1. PM2.5 Concentrations

The daily average concentrations of PM2.5 (Figure 2) were (range: 39–539) in autumn (Figure 2a) and 241 ± 189 μg m−3 (range: 97–976) in spring (Figure 2b). The concentration of PM2.5 reached the maximum of 976 μg m−3 on 17 April 2018. The average concentrations of PM2.5 exceeded the secondary standard of 24 h PM2.5 (75 μg m−3) of the National Ambient Air Quality Standard (NAAQS) in China. The average daily PM2.5 mass concentrations in the autumn and spring were 1.9 times and 3.2 times the 75 μg m−3 limit, respectively. In autumn, on 15 days (total samples 33), the PM2.5 exceeded the daily 75 μg m−3 standard, and on 9 heavy pollution days, the PM2.5 was greater than 150 μg m−3. In spring, in all sampling days, the daily 75 μg m−3 standard was surpassed, and 18 days (total samples 29) of heavy pollution were recorded with PM2.5 concentrations that exceeded 150 μg m−3.
The PM2.5 concentrations of the cities around the rural site, including Harbin (138 and 41 μg m−3), Changchun (90 and 39 μg m−3), Songyuan (49 and 28 μg m−3) and Jilin (97 and 45 μg m−3) were obtained for autumn and spring during the sampling period from the Chinese air quality online monitoring and analysis platform. By comparing the PM2.5 concentrations of the surrounding cities with those of the rural site, we found that the PM2.5 concentrations of the surrounding cities were lower than those at the rural site.
Our results showed the PM2.5 concentrations were significantly higher in spring than in autumn, which indicates that more intensive agricultural activity (i.e., tilling and burning) combined with windblown dust events in spring during the observed periods. The contribution to increased PM mass concentration of burning activities in rural sites is well known and has been extensively studied [29]. In particular, biomass burning contribution could be estimated by analyzing levoglucosan which is the specific marker for such emission [30]. Our results prove that this rural area in northeastern China suffers serious PM2.5 pollution during spring and autumn.

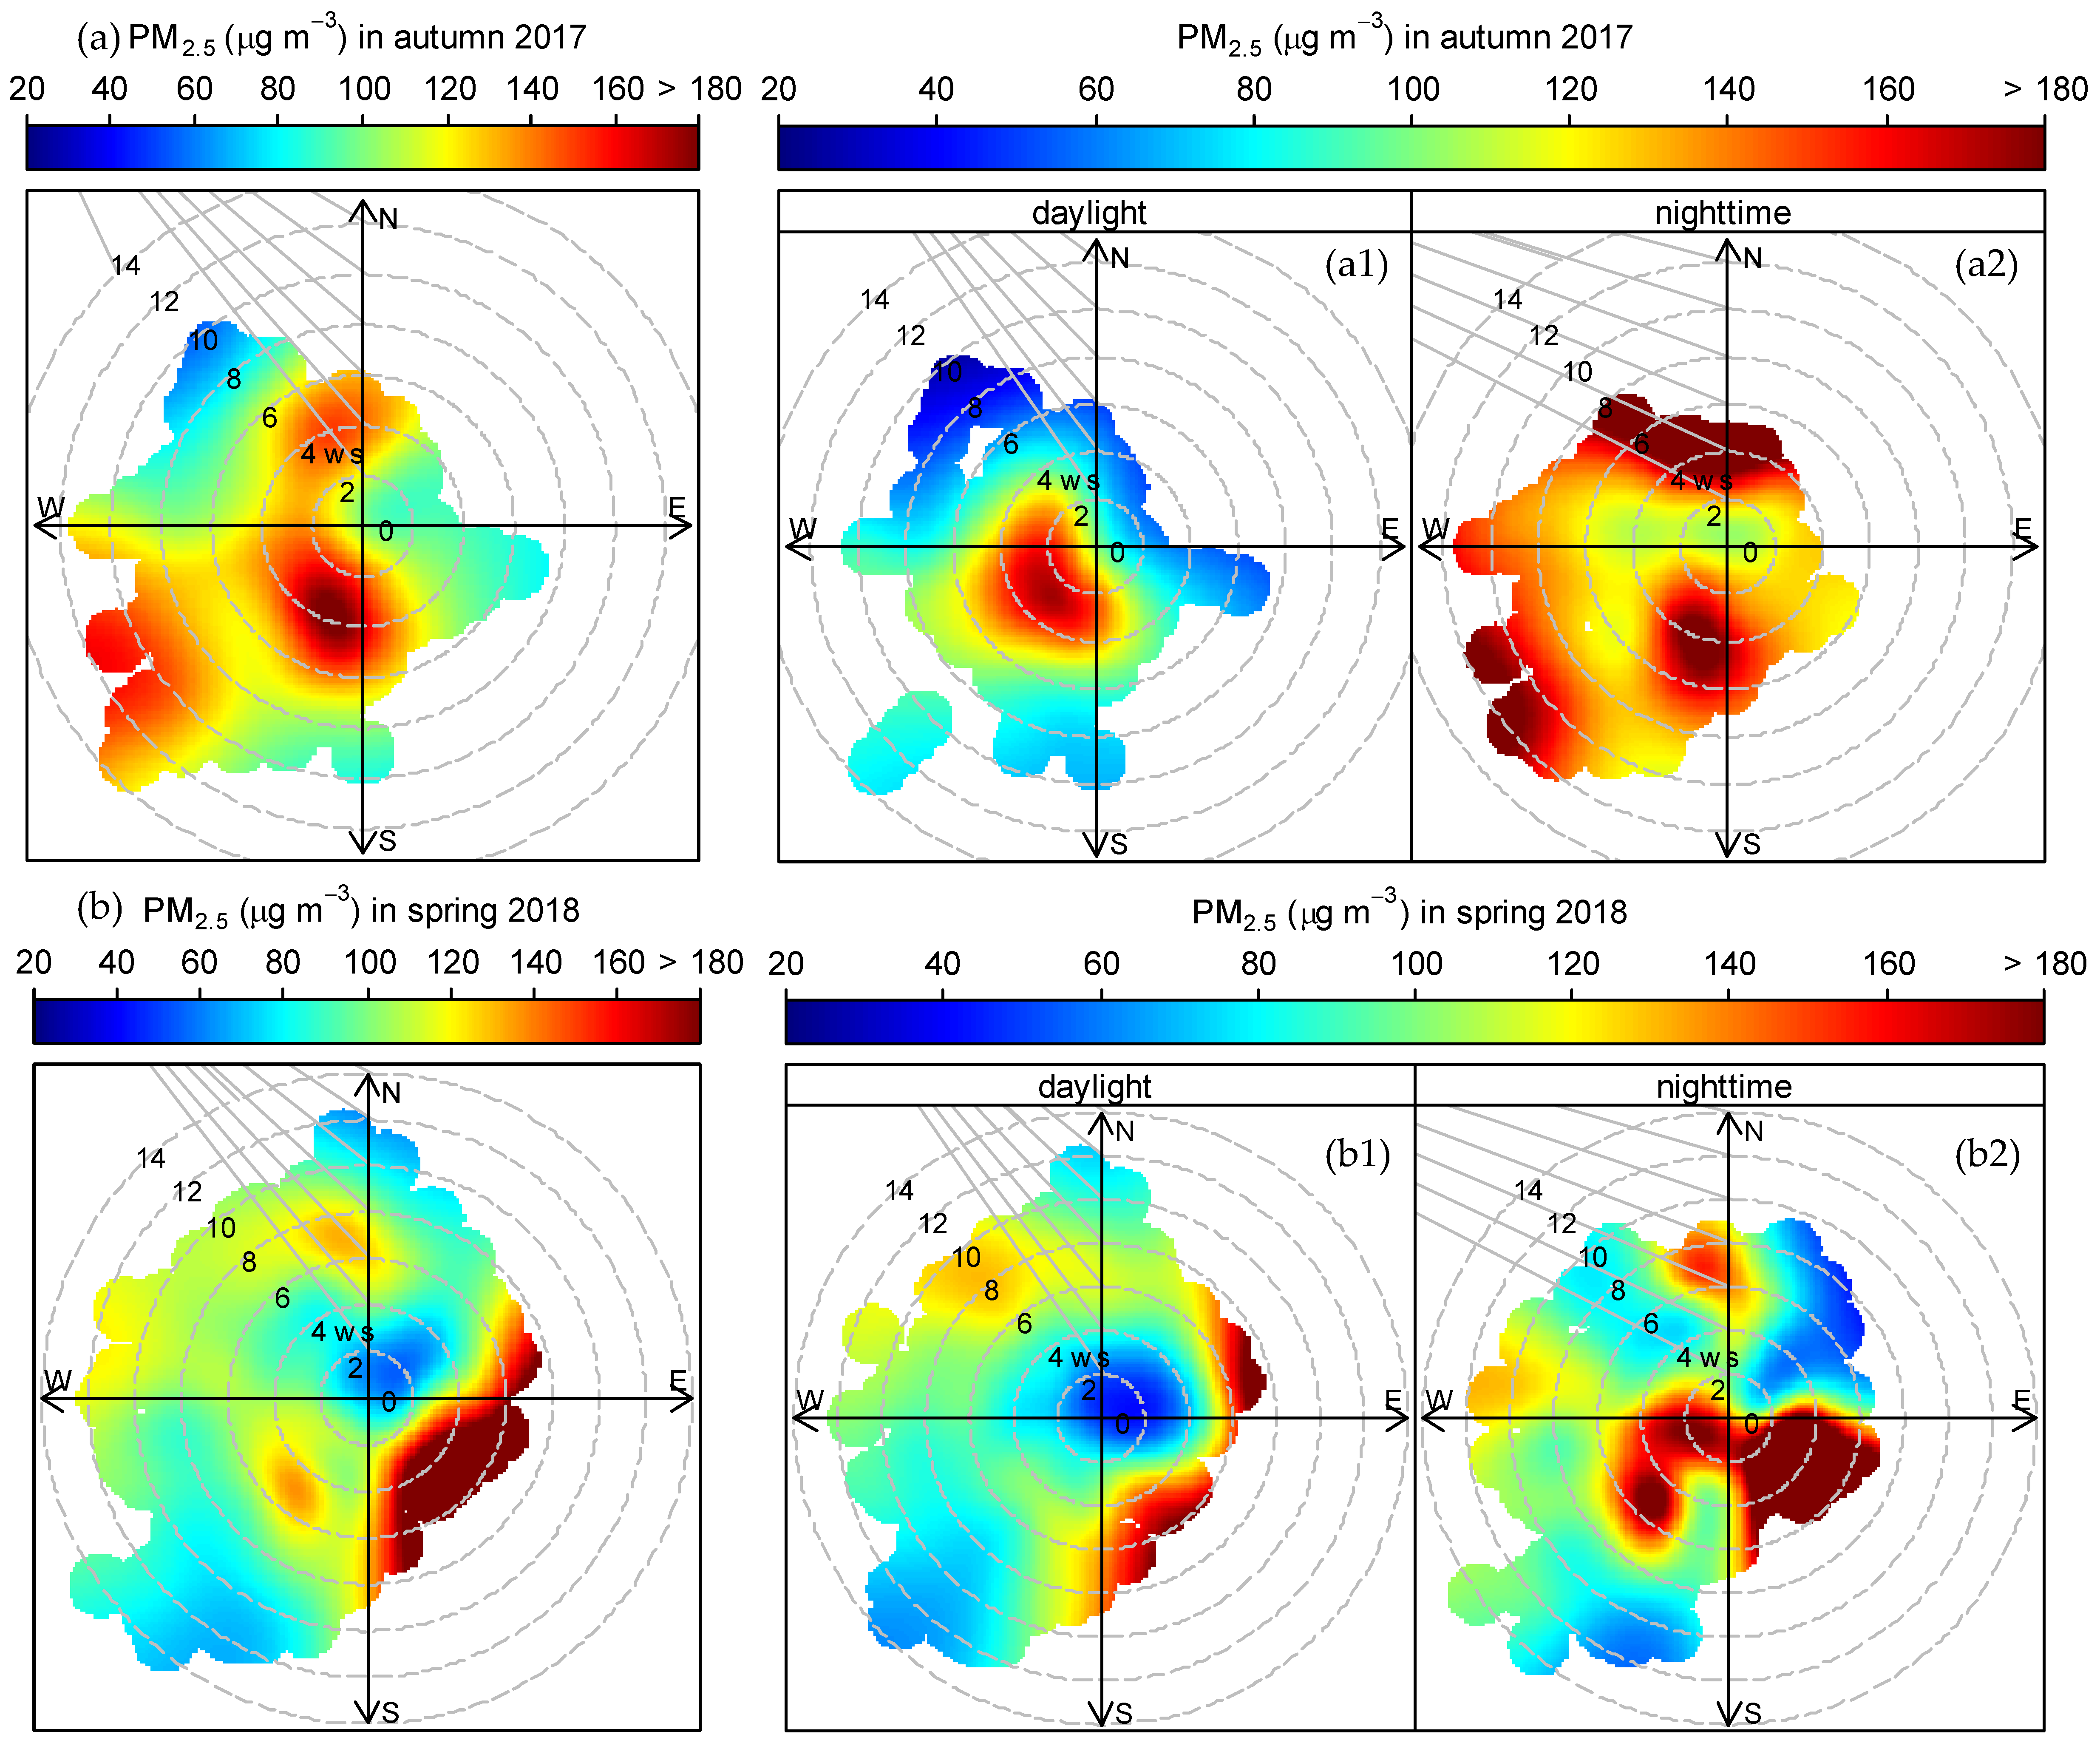
3.2. Relationship of PM2.5 with Wind Speed and Wind Direction

The mass concentration of PM2.5 was also influenced by regional transportation by different wind speeds and wind directions [31]. In autumn, the area with PM2.5 concentration above 140 μg m−3 was mainly to the southwest and north of the Yushu station, with wind speeds of 2–6 m/s and 10–12 m/s, respectively (Figure 3a). Generally, light pollution of PM2.5 occurred during daytime, and heavy pollution during nighttime (Figure 3(a1,a2)). During daytime (Figure 3(a1)), only one case of high concentration of PM2.5 as recorded in the southwest direction with wind speeds of 2–5 m/s. During nighttime, high PM2.5 pollution levels increased from the North, South, and Southwest directions, with concentrations exceeding 180 μg m−3 with wind speeds of 3–8 m/s, 3–5 m/s, and 10–12 m/s. In spring, high PM2.5 concentrations greater than 180 μg m−3 appeared in the Southeast direction with wind speeds of 2–6 m/s and under the northwesterly and southwesterly wind, with speeds of 4–8 m/s (Figure 3b). A similar phenomenon of diurnal PM2.5 concentration variations was also observed in the spring, with local light local pollution, and high pollution values were observed with northeast and southeast winds with speeds of 4–8 m/s. As a result of wind transport, pollutants in the northeast and southeast gradually spread to the central area (Figure 3(b1)). However, local pollution during the nighttime was very serious, and a significantly higher level was observed, with PM2.5 concentrations exceeding 180 μg m−3 under a southeasterly wind speed of 1–7 m/s and two additional high values obtained in the south and southwest direction with wind speeds of 0–8 m/s (Figure 3(b2)).
The relationships among PM2.5 concentrations, wind direction, and wind speed suggested that more intensive PM2.5 emissions occurred during nighttime, in both autumn and spring. On the one hand, a lower atmospheric boundary layer height caused atmospheric pollutants to accumulate during the nighttime. On the other hand, high PM2.5 concentrations were closely linked to local conventional farming practices and regulatory policy, especially for straw residue burning prohibition. Thus, illegal burning of crop straw at night in many rural areas combined with the meteorological conditions to produce high PM concentrations at night.

3.3. Chemical Composition of PM2.5

A total of 34 and 29 valid ambient PM2.5 samples were collected in the autumn of 2017 and spring of 2018, respectively. The temporal variations of PM2.5, OC, EC, water-soluble ions, and trace elements are shown in Figure 4.

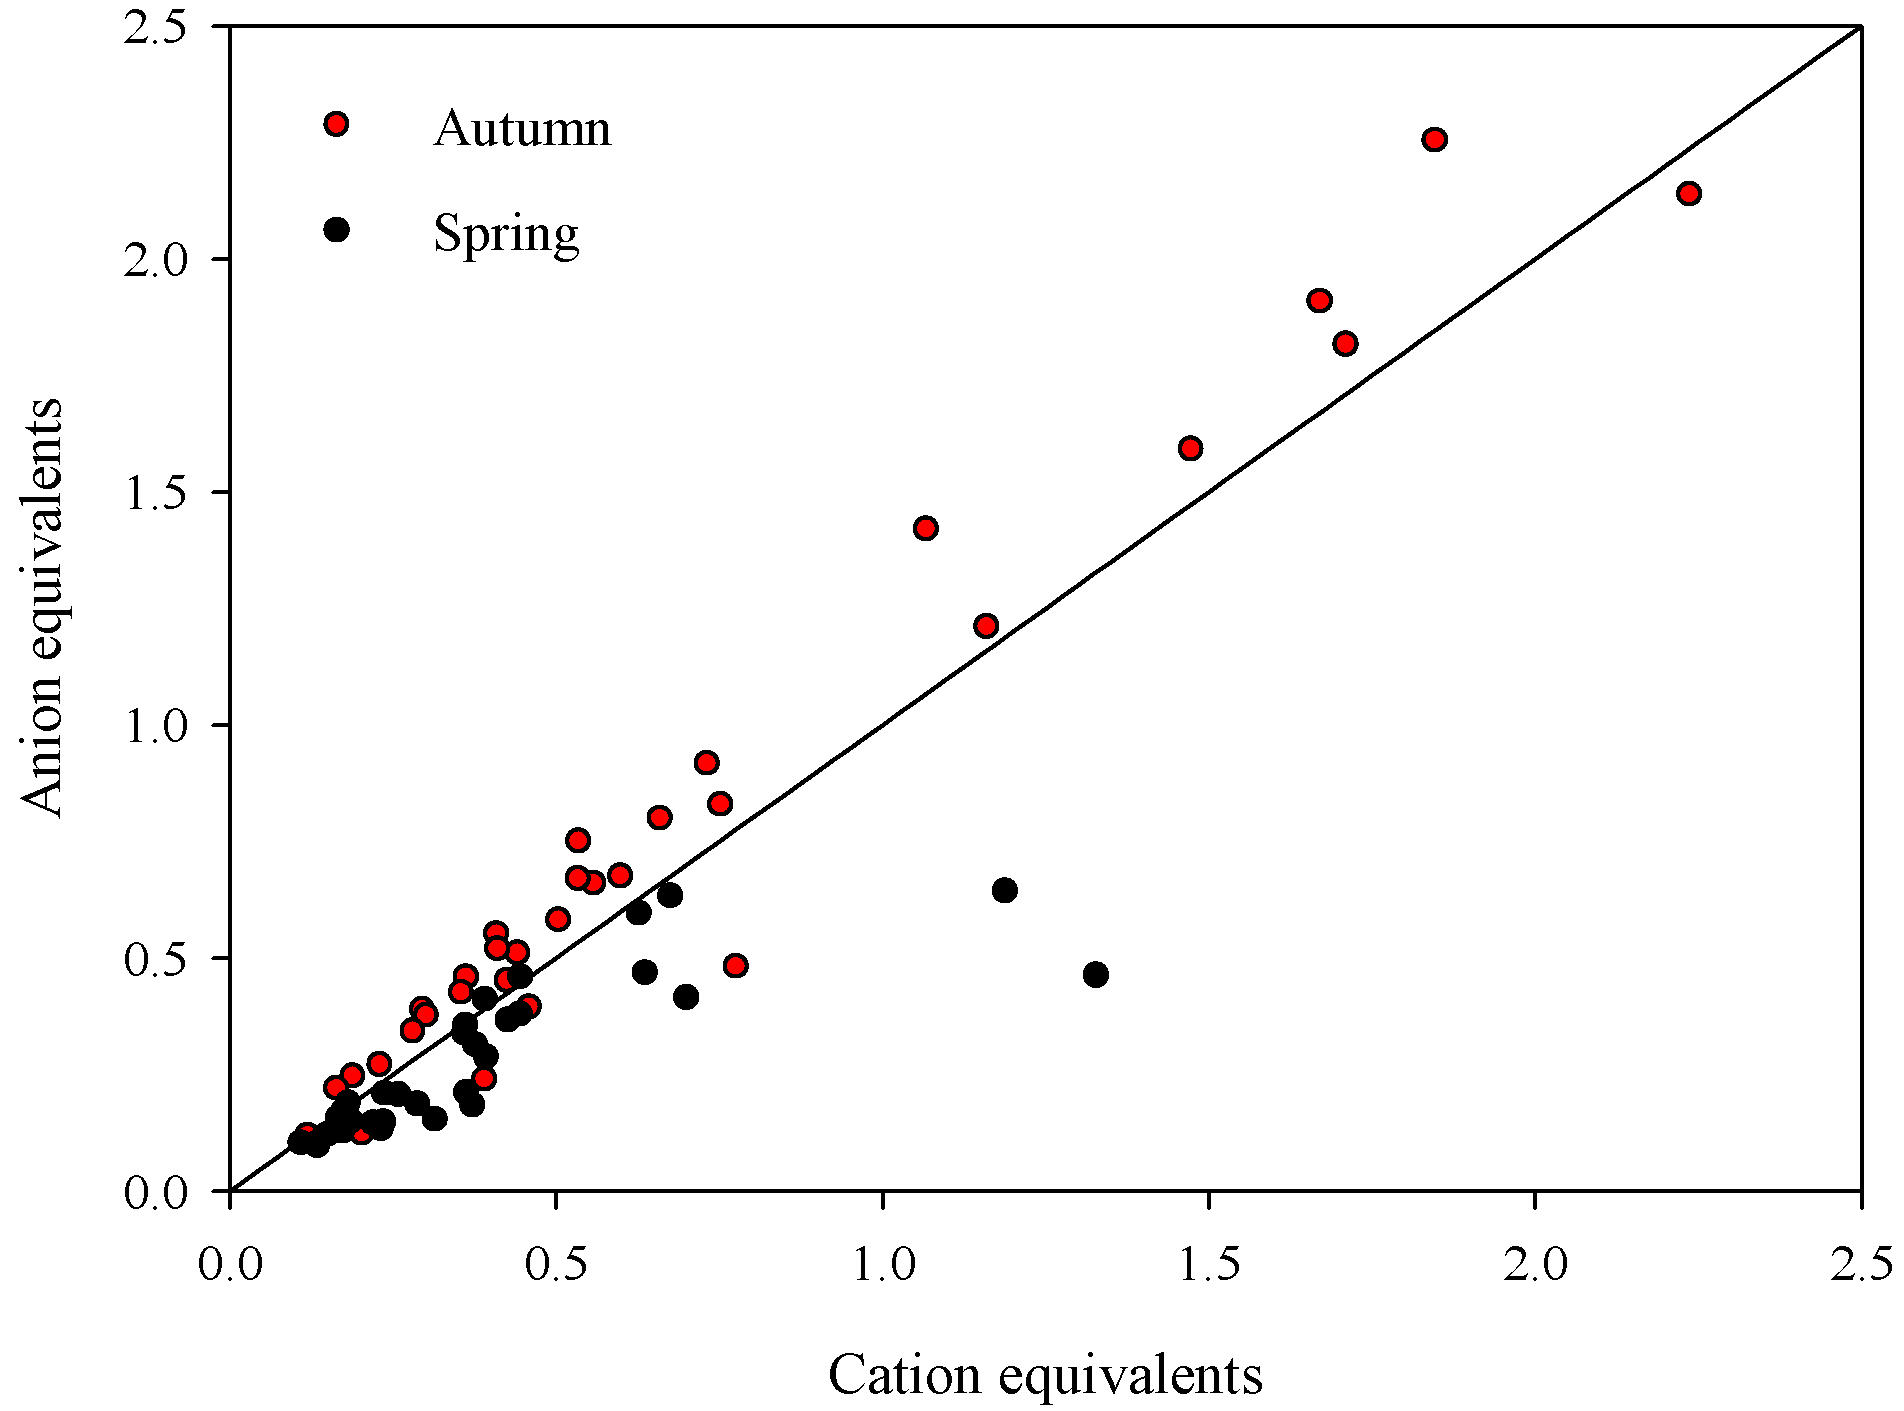
3.3.1. Water-Soluble Ions Analysis

The ratios of water-soluble ions in the sampled PM2.5 during the observed periods of autumn and spring were 32.5% and 9.6%, respectively. These results show a significantly higher contribution of water-soluble ions in autumn than in spring. During autumn, the mass concentrations of water-soluble ions followed the order: Cl (9.3% ± 11.9%) > NO3 (8.0% ± 12.3%) > NH4+ (6.2% ± 7.0%) > SO42− (5.4% ± 5.5%) > K+ (2.9% ± 3.1%) > Ca2+ (0.5% ± 0.7%) > Mg2+ (0.2% ± 0.2%) > Na+ (0.1% ± 0.4%) > F (0% ± 0%), whereas in spring, the order was NO3 (2.9% ± 2.5%), SO42− (2.6% ± 2.4%), NH4+ (1.7% ± 2.0%), K+ (0.7% ± 0.9%), Ca2+ (0.7% ± 0.7%), Cl (0.5% ± 0.7%), Na+ (0.2% ± 0.2%), Mg2+ (0.1% ± 0.2%) and F (0% ± 0%). The proportion of Cl in PM2.5 during autumn was the highest, which is different from what observed in the cold period and warm period in Xingtai City, the preurban area of Xiamen, from June 2009 to May 2010, with the highest ratios of SO42− [32,33]. Previous studies have shown that coal combustion is the main source of Cl in PM2.5 [34,35,36], and Cl is the second most frequently emitted ion from biomass burning, surpassed only by K+ [37]. In northeastern China, straw burning practices mainly occur after harvesting in autumn or before tilling in spring, and coal burning begins during our sampling period in autumn. Thus, the overlay of straw burning and coal burning should result in increased chloride content. Furthermore, NO3, SO42−, and NH4+ also represented a high proportion of PM2.5 in spring and autumn, which is similar to what reported by other studies in rural areas such as Diabla Góra, Poland [29,38].
Many studies have suggested that K+ is the indicator substance of biomass burning [39,40], Ca2+ and Mg2+ represent the earth’s crust elements originating from windblown dust, road dust, farmland soil dust, and construction dust [41,42], and SO42−and NO3 are mainly released from coal combustion and motor vehicle exhaust. In rural sites, burning-related ions (i.e., Cl, NO3, SO42−, NH4+, and K+) were higher in autumn, whereas dust-related ions (Ca2+, Mg2+, Na+, and F) were higher in spring. Local conventional agricultural practices and living habits indicate that straw burning and coal combustion mainly occur in autumn, whereas soil tilling practices (e.g., land planning, plowing, and sowing) combined with frequent windblown dust events occur in spring, which could promote the generation of large amounts of dust from the strongly disturbed soil.
Anthropogenic emissions of SO42− and NO3 are mainly derived from the SO2 produced by coal combustion (stationary source) and the NOX produced by motor vehicles (mobile source). Therefore, the ratios of NO3 and SO42− are commonly used to evaluate the influence of sulfur and nitrogen from mobile sources or stationary sources [43]. The ratio of NOX to SO2 emitted by Chinese motor vehicles was 8:1~13:1, and the ratio of NOX to SO2 emitted by coal combustion was 1:2. In general, a high ratio of NO3 and SO42− (>1) indicates that the impact of mobile sources exceeds that of stationary sources [43]. In our rural site, the ratios of the NO3 and SO42− in PM2.5 in autumn and spring were 1.4 ± 0.9 and 1.1 ± 1.0, respectively. These values suggest that mobile sources such as on-road cars or off-road machinery were another important contributor to PM2.5 at the rural site during the observed agricultural periods.

Anion–Cation Balance

The acidity and alkalinity of aerosols is an important indicator for studying the pH of the environment. The equivalent molar ratio (in μeq m−3) of anions and cations in PM2.5 was 1.1 ± 0.2 (range: 0.6–1.4) in autumn, with 79% of the values above 1, whereas the equivalent molar ratio was 0.8 ± 0.2 (range: 0.3–1.0) in spring, with 93% of the values below 1 (Figure 5). These results imply that PM2.5 at the investigated rural site was mainly acidic in autumn and alkaline in spring. In autumn, fossil fuel combustion such as coal burning and agricultural machinery could produce excessive anions such as SO42− and NO3. In contrast, the spring soil releases more crustal elements (Mg2+ and Ca2+), whereas more NH4+ is converted from the agricultural NH3 emissions (e.g., fertilizer or livestock).

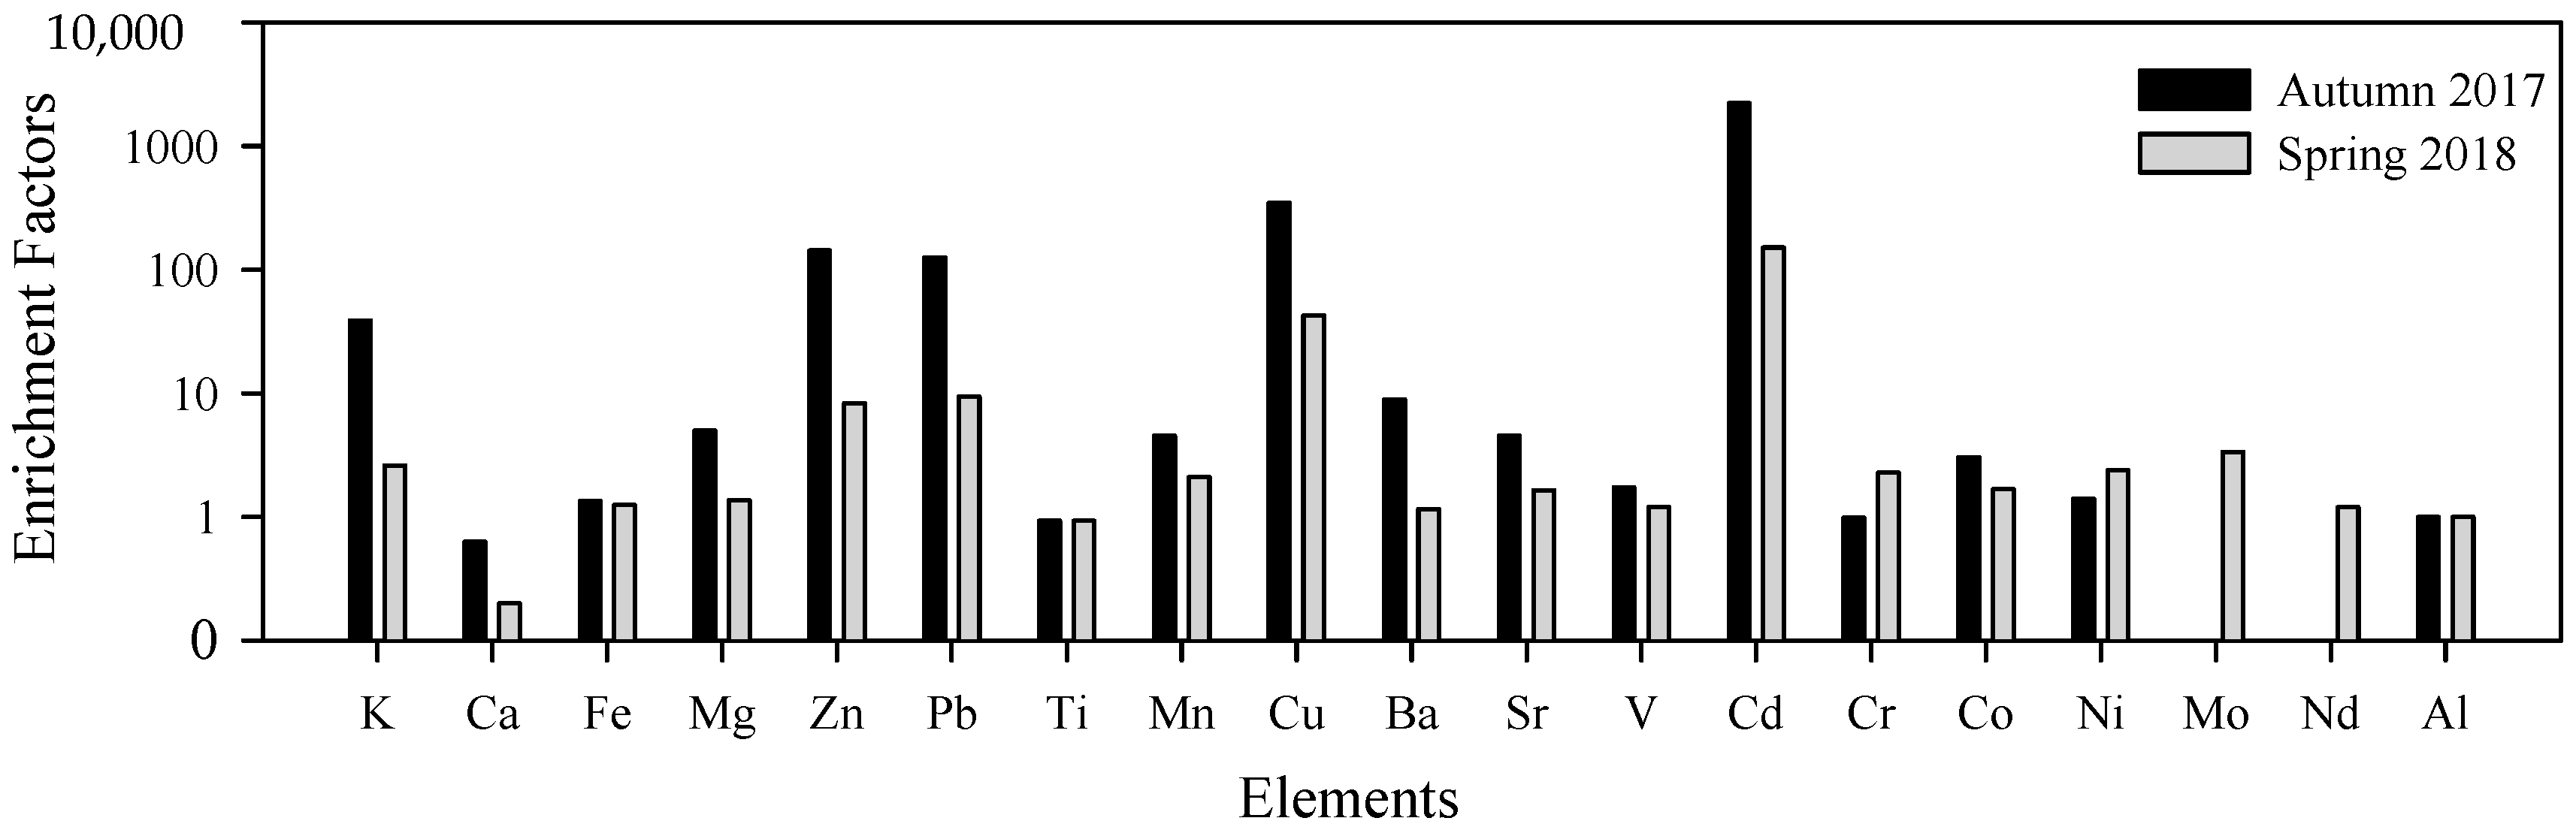
3.3.2. Trace Elements Analysis

The total concentrations of the trace elements were 5.3 ± 4.1 μg m−3 and 12.2 ± 14.2 μg m−3, accounting for 3.7% and 5.1% of the PM2.5 in autumn and spring, respectively. Potassium (K) was the most abundant trace element during both observation periods of autumn and spring (Table 1). In autumn, the mass concentrations of K averaged 3.8 ± 2.4 μg m−3 (range: 0.96–10.09), representing 70.1% of the total trace elements, whereas they were 2.9 ± 2.4 μg m−3 (range: 0.66–10.97 μg m−3), with a ratio of 23.7%, in the total trace elements in spring. Excluding potassium, the crustal elements (i.e., Ca, Fe, Al, and Mg) were the second largest component in autumn (24.8%) and in spring (72.5%).
The EF is commonly used for studying the level of enrichment of elements in atmospheric aerosol particles and estimating the contributions of crustal and non-crustal sources [44]. In this study, Al was used as the reference element because of its relative stable chemical properties and low contamination. Previous studies have suggested 10 is a threshold value to identify sources from rock weathering and crust (<10) or anthropogenic emissions and enrichments (>10) [45,46].
Our results (Figure 6) show that the EFs of 14 elements (Al, Ba, Ca, Co, Cr, Fe, Mg, Mn, Mo, Nd, Ni, Sr, Ti, and V) in autumn and of 17 elements (Al, Ba, Ca, Co, Cr, Fe, K, Mg, Mn, Mo, Nd, Ni, Pb, Sr, Ti, V, and Zn) in spring were lower than 10, indicating natural sources for these elements. In autumn, Cd was the most enriched element, with EF of 2227.1, followed by Cu (347.8), Zn (142.4), Pb (125.2), and K (38.8). In spring, EF values above 10 were only found for Cd (151.6) and Cu (42.8), indicating non-crustal and anthropogenic sources for these two elements. In addition, higher EFs of most trace elements in autumn than in spring imply a more serious contamination from anthropogenic sources.
As one of the marker elements of biomass burning [30,47], a high K concentration was determined to be present in both periods of autumn (4.14 μg m−3) and spring (1.63 μg m−3), and obvious large K emissions were observed in autumn. One of the important sources of Cd is coal combustion [47,48]; therefore, we also found a higher Cd concentration in autumn than in spring because 80% of sampling occurred during the heating periods. Both Pb and Zn mainly originated from traffic sources, with Zn from tire wear, and Pb from motor vehicle exhaust [49,50]. Thus, Pb and Zn observed at the rural site were mainly emitted by agricultural machinery. Compared with the autumn, other elements (i.e., Ca, Fe, Mg, Mn, and Ti) had higher concentrations but with lower EFs in spring, indicating the large contribution of natural sources to these elements.

3.3.3. OC/EC Analysis

Mass concentrations of OC and EC averaged 37.0 ± 42.1 μg m−3 (range: 4.7–181.1) and 3.8 ± 3.5 μg m−3 (range: 0.8–16.1), with a contribution of 25.9% and 2.6% to PM2.5 in autumn, respectively, whereas they averaged 26.7 ± 43.8 μg m−3 (range: 5.4–210.8) and 3.8 ± 3.5 μg m−3 (range: 1.3–30.7), with a contribution of 11.1% and 2.9% to PM2.5 in spring.
The ratio of OC and EC is widely used to estimate whether secondary organic carbon is formed and was used initially to determine pollutant sources [51]. In general, when the ratio of OC and EC is higher than 2, secondary organic carbon generation is occurring [52]. If the ratio ranges from 1.0 to 4.2, vehicle exhaust is the emission source of the carbonaceous fraction [53]; if the ratio falls in the range of 3.8–13.2, biomass burning or biogenic emissions play a role; if it falls between 2.5 and 10.5, coal combustion is the source [54]. At the rural site, the average ratio of the OC and EC in autumn PM2.5 samples was 8.2 and in spring, it was 3.8. These values indicate that the main sources of the carbonaceous fractions were biomass burning and coal combustion in autumn and vehicle exhaust, biomass burning, and coal combustion in spring.
This study performed frequent observations at the site during the most active agricultural period and obtained daily and hourly PM2.5 mass concentrations as well as the chemical compositions of the PM2.5 samples. However, the sampling time was not continuous, mainly due to poor rural infrastructure, such as frequent power outages. Different types of crops (e.g., rice, corn, and soybeans), farming methods (e.g., large machinery tilling and small machinery tilling in households), and soil types (e.g., black soil and soda Solonetz) can affect the emission characteristics of the agricultural PM2.5. Therefore, a multi-site network observation is needed to fully understand the emission characteristics and chemical components of atmospheric particles in the Northeast agricultural area.

4. Conclusions

Major agricultural activities (i.e., soil tilling, seed sowing, crop harvesting, and straw burning) are mainly conducted during spring and autumn in northeastern China, which makes rural areas and vast farmlands important emission sources of atmospheric pollutants (e.g., PM2.5). Water-soluble ions and OC were the main chemical components of PM2.5 in spring and autumn, whereas the amounts of OC in PM2.5 were higher in autumn than in spring.
Although the concentrations of most trace elements (i.e., Ca, Fe, Al, Mg, Zn, Ti, Mn, Cu, Ba, Sr, V, Cd, and Co) in PM2.5 were higher in spring than in autumn, the enrichment factor was higher in autumn. The main reason is that agricultural tilling activities in spring released more soil elements by disturbing the farmland surface than anthropogenic pollution sources. The ions in autumn contributed to acidic conditions, which might be reduced by the combustion of fossil fuels in autumn and the release of agricultural machinery activities.
Significantly higher PM2.5 concentrations in the rural site than in the surrounding cities during the same periods indicate the presence of strong rural emission sources, which could affect urban air quality by transmitting particulate matter to nearby cities during agricultural activities. Therefore, simultaneous observations of multiple sites with different agricultural conventional practices or crop types are suggested to obtain detailed parameters and accurate estimations for high-resolution emission inventories of atmospheric pollutants from various agricultural activities.

Author Contributions

Formal analysis, X.W.; Writing—original draft preparation, X.W.; Supervision, W.C.; funding acquisition, W.C; project administration, S.Z., R.L., M.Z., J.L., Y.J., and Y.L.

Funding

This research was funded under the auspices of the National Key R & D Program of China (No. 2017YFC0212303, 2016YFA0602304), the Key Research Program of Frontier Sciences, Chinese Academy of Sciences (No. QYZDB-SSW-DQC045), the National Natural Science Foundation of China (No. 41775116), and the Youth Innovation Promotion Association of Chinese Academy of Sciences (No. 2017275), Northeast Institute of Geography and Agroecology, CAS (No. IGA-135-05), Science and Technology Development Project in Jilin Province (No. 20180520095JH), National Natural Science Foundation of China (No. 41575129).

Acknowledgments

We would also like to thank the students involved in the experiments and the staff of the sampling sites for their assistance in the chemical analysis and field sampling.

Conflicts of Interest

The authors declare no conflict of interest.

References

  1. Turnock, S.T.; Butt, E.W.; Richardson, T.B.; Mann, G.W.; Reddington, C.L.; Forster, P.M.; Haywood, J.; Crippa, M.; Janssens-Maenhout, G.; Johnson, C.E. The impact of European legislative and technology measures to reduce air pollutants on air quality, human health and climate. J. Environ. Res. Lett. 2016, 11, 024010. [Google Scholar] [CrossRef] [Green Version]
  2. Zheng, S.; Pozzer, A.; Cao, C.X.; Lelieveld, J. Long-term (2001–2012) fine particulate matter (PM2.5) and the impact on human health in Beijing, China. J. Atmos. Chem. Phys. 2015, 15, 5715–5725. [Google Scholar] [CrossRef]
  3. Zhao, C.X.; Wang, Y.Q.; Wang, Y.J.; Zhang, H.L.; Zhao, B.Q. Temporal and spatial distribution of PM2.5 and PM10 pollution status and the correlation of particulate matters and meteorological factors during Winter and Spring in Beijing. J. Environ. Sci. 2014, 35, 418–427. [Google Scholar]
  4. Tian, Y.Z.; Shi, G.L.; Han, B.; Wu, J.H.; Zhou, X.Y.; Zhou, L.D.; Zhang, P.; Feng, Y.C. Using an improved source directional apportionment method to quantify the PM2.5 source contributions from various directions in a megacity in China. J. Chemosph. 2015, 119, 750–756. [Google Scholar] [CrossRef] [PubMed]
  5. Cui, Y.; Zhao, C.Y.; Zhou, X.Y.; Ao, X.; Wang, T.; Li, Q.; Liu, M.Y.; Ma, F.S. Climatic characteristics of haze days in Northeast of China over the past 50 years. J. Chin. Environ. Sci. 2016, 36, 1630–1637. [Google Scholar]
  6. Chen, W.W.; Zhang, S.C.; Tong, Q.S.; Zhang, X.L.; Zhao, H.M.; Ma, S.Q.; Xiu, A.J.; He, Y.X. Regional characteristics and causes of haze events in Northeast China. J. Chin. Geogr. Sci. 2018, 28, 112–126. [Google Scholar] [CrossRef]
  7. Ma, S.Q.; Chen, W.W.; Zhang, S.C.; Tong, Q.S.; Bao, Q.Y.; Gao, Z.T. Characteristics and cause analysis of heavy haze in Changchun City in Northeast China. J. Chin. Geogr. Sci. 2017, 6, 145–158. [Google Scholar] [CrossRef]
  8. Yan, J.L. Analysis of Temporal-Spatial Characteristics of Haze in China Based on Satellite Remote Sending Data. Ph.D. Thesis, Lanzhou University, Lanzhou, China, 2014. [Google Scholar]
  9. Chen, W.W.; Tong, D.Q.; Dan, M.; Zhang, S.C.; Zhang, X.L.; Pan, Y.P. Typical atmospheric haze during crop harvest season in northeastern China: A case in the Changchun region. J. Environ. Sci. 2017, 54, 101–113. [Google Scholar] [CrossRef] [PubMed]
  10. Fang, C.S.; Zhang, Z.D.; Jin, M.Y.; Zou, P.C.; Wang, J. Pollution Characteristics of PM2.5 aerosol during haze periods in Changchun, China. J. Aerosol Air Qual. Res. 2017, 17, 888–895. [Google Scholar] [CrossRef]
  11. National Development and Reform Commission. Available online: http://www.ndrc.gov.cn/zcfb/zcfbtz/201603/W020160311487622568348.pdf (accessed on 30 August 2019).
  12. Zhang, R.J.; Fu, C.B.; Han, Z.W.; Zhu, C.S. Characteristics of elemental composition of PM2.5 in the spring period at Tongyu in the semi-arid region of Northeast China. J. Adv. Atmos. Sci. 2008, 25, 922–931. [Google Scholar] [CrossRef]
  13. Baker, J.B.; Southard, R.J.; Mitchell, J.P. Agricultural dust production in standard and conservation tillage systems in the San Joaquin Valley. J. Environ. Qual. 2005, 34, 1260–1269. [Google Scholar] [CrossRef] [PubMed]
  14. Pattey, E.; Qiu, G. Trends in primary particulate matter emissions from Canadian agriculture. J. Air Waste Manag. Assoc. 2012, 62, 737–747. [Google Scholar] [CrossRef] [PubMed] [Green Version]
  15. Holmén, B.; Miller, D.; Hiscox, A.; Yang, W.; Wang, J.; Sammis, T.; Bottoms, R. Near-source particulate emissions and plume dynamics from agricultural field operations. J. Atmos. Chem. 2008, 59, 117–134. [Google Scholar] [CrossRef]
  16. Cao, J.J.; Chow, J.C.; Watson, J.G.; Wu, F.; Han, Y.M.; Jin, Z.D.; Shen, Z.X.; An, Z.S. Size-differentiated source profiles for fugitive dust in the Chinese Loess Plateau. Atmos. Environ. 2008, 42, 2261–2275. [Google Scholar] [CrossRef]
  17. Xin, J.Y.; Du, W.P.; Wang, Y.S.; Gao, Q.X.; Li, Z.Q.; Wang, M.X. Aerosol optical properties affected by a strong dust storm in Central and Northern China. Adv. Atmos. Sci. 2010, 27, 562–574. [Google Scholar] [CrossRef]
  18. Bogman, P.; Cornelis, W.; Rollé, H.; Gabriels, D. Prediction of TSP and PM10 Emissions from Agricultural Operations in Flanders, Belgium. In Proceedings of the 14th International Symposium, Transport and Air Pollution, Graz, Austria, 1–3 June 2005. [Google Scholar]
  19. Pattey, E.; Qiu, G.; Fiset, S.; Ho, E.; MacDonald, D.; Liang, C. Primary particulate matter emissions and trends from Canadian agriculture. J. Wit Trans. Ecol. Environ. 2015, 198, 143–154. [Google Scholar]
  20. Zang, Y.; Gao, H.W.; Zhou, J.Z. Experimental study on soil erosion by wind under conservation tillage. J. Trans. Chin. Soc. Agric. Eng. 2003, 19, 56–60. [Google Scholar]
  21. Mehmood, K.; Chang, S.C.; Yu, S.C.; Wang, L.Q.; Li, P.F.; Li, Z.; Liu, W.P.; Rosenfeld, D.; Seinfeld, J.H. Spatial and temporal distributions of air pollutant emissions from open crop straw and biomass burnings in China from 2002 to 2016. J. Environ. Chem. Lett. 2018, 16, 301–309. [Google Scholar] [CrossRef]
  22. Hu, M.; Tang, Q.; Peng, J.F.; Wang, E.Y.; Wang, S.L.; Chai, F.H. Study on characterization and source apportionment of atmospheric particulate matter in China. J. Environ. Sustain. Dev. 2011, 36, 15–19. [Google Scholar]
  23. National Bureau of Statistics of China. China Statistical Yearbook 2012; China Statistics Press: Beijing, China, 2012. (In Chinese)
  24. Lian, Y.; Gao, Z.T.; Ren, H.L.; Sun, L.; An, G.; Shen, B.Z.; Ding, L.; Zhang, W.Z. Desertification development and regional climatic change in northeast china in the 1990s. J. Acta Meteorol. Sinica 2001, 59, 730–736. [Google Scholar]
  25. Birch, M.E.; Cary, R.A. Elemental carbon-based method for monitoring occupational exposures to particulate diesel exhaust. J. Aerosol Sci. Technol. 1996, 25, 221–241. [Google Scholar] [CrossRef]
  26. Piazzalunga, A.; Bernardoni, V.; Fermo, P.; Vecchi, R. Optimisation of analytical procedures for the quantification of ionic and carbonaceous fractions in the atmospheric aerosol and applications to ambient samples. J. Anal. Bioanal. Chem. 2013, 405, 1123–1132. [Google Scholar] [CrossRef] [PubMed]
  27. Zhang, T.; Cao, J.J.; Tie, X.X.; Shen, Z.X.; Liu, S.X.; Ding, H.; Han, Y.M.; Wang, G.H.; Ho, K.F.; Qiang, J.; et al. Water-soluble ions in atmospheric aerosols measured in Xi’an, China: Seasonal variations and sources. J. Atmos. Res. 2011, 102, 110–119. [Google Scholar] [CrossRef]
  28. Wei, F.S.; Zheng, C.J.; Chen, J.S.; Zheng, C.J. Study on the background contents on 61 elements of soils in China. Environ. Sci. 1991, 12, 12–19. [Google Scholar]
  29. Vassura, I.; Venturini, E.; Marchetti, S.; Piazzalunga, A.; Bernardi, E.; Fermo, P.; Passarini, F. Markers and influence of open biomass burning on atmospheric particulate size and composition during a major bonfire event. J. Atmosph. Environ. 2014, 82, 218–225. [Google Scholar] [CrossRef]
  30. Piazzalunga, A.; Anzano, M.; Collina, E.; Lasagni, M.; Lollobrigida, F.; Pannocchia, A.; Fermo, P.; Pitea, D. Contribution of wood combustion to PAH and PCDD/F concentrations in two urban sites in Northern Italy. J. Aerosol Sci. 2013, 56, 30–40. [Google Scholar] [CrossRef] [Green Version]
  31. Wang, L.; Liu, Z.; Sun, Y.; Ji, D.S.; Wang, Y.S. Long-range transport and regional sources of PM2.5 in Beijing based on long-term observations from 2005 to 2010. J. Atmos. Res. 2015, 157, 37–48. [Google Scholar] [CrossRef]
  32. Hu, J.; Wang, H.; Zhang, J.Q.; Zhang, M.; Zhang, H.F.; Wang, S.L.; Chai, F.H. PM2.5 Pollution in Xingtai, China: Chemical characteristics, source apportionment, and emission control measures. J. Atmos. 2019, 10, 121. [Google Scholar] [CrossRef]
  33. Zhang, F.W.; Xu, L.L.; Chen, J.S.; Yu, Y.K.; Niu, Z.C.; Yin, L.Q. Chemical compositions and extinction coefficients of PM2.5 in peri-urban of Xiamen, China, during June 2009–May 2010. J. Atmos. Res. 2012, 106, 158. [Google Scholar] [CrossRef]
  34. Wang, Y.; Zhuang, G.S.; Zhang, X.Y.; Huang, K.; Xu, C.; Tang, A.H.; Chen, J.M.; An, Z.S. The ion chemistry, seasonal cycle, and sources of PM2.5 and TSP aerosol in Shanghai. J. Atmos. Environ. 2006, 40, 2935–2952. [Google Scholar] [CrossRef]
  35. Feng, J.L.; Guo, Z.G.; Zhang, T.R.; Yao, X.H.; Chan, C.K.; Fang, M. Source and formation of secondary particulate matter in PM2.5 in Asian continental outflow. J. Geophys. Res. Atmos. 2012, 117, D03302. [Google Scholar] [CrossRef]
  36. Wang, Y.; Zhuang, G.S.; Tang, A.H.; Yuan, H.; Sun, Y.; Chen, S.; Zheng, A.H. The ion chemistry and the source of PM2.5 aerosol in Beijing. J. Atmos. Environ. 2005, 39, 3771–3784. [Google Scholar] [CrossRef]
  37. Sillapapiromsuk, S.; Chantara, S.; Tengjaroenkul, U.; Prasitwattanaseree, S.; Prapamontol, T. Determination of PM10 and its ion composition emitted from biomass burning in the chamber for estimation of open burning emissions. J. Chemosph. 2013, 93, 1912–1919. [Google Scholar] [CrossRef] [PubMed]
  38. Rogula-Kozlowska, W.; Klejnowski, K.; Rogula-Kopiec, P.; Ośródka, L.; Krajny, E.; Błaszczak, B.; Mathews, B. Spatial and seasonal variability of the mass concentration and chemical composition of PM2.5 in Poland. J. Air Qual. Atmos. Health 2014, 7, 41–58. [Google Scholar] [CrossRef] [PubMed]
  39. Duan, F.K.; Liu, X.D.; Yu, T.; Cachie, H. Identification and estimate of biomass burning contribution to the urban aerosol organic carbon concentrations in Beijing. J. Atmos. Environ. 2004, 38, 1275–1282. [Google Scholar] [CrossRef]
  40. Chow, J. Measurement methods to determine compliance with ambient air quality standards for suspended particles. J. Air Repair 1995, 45, 666–684. [Google Scholar] [CrossRef]
  41. Feng, J.L.; Zhao, W.; Guan, J.J.; Wu, M.H.; Fu, J.M. Composition and sources of water-soluble ions in PM2.5 from the e-waste dismantling area of Taizhou. J. Environ. Chem. 2011, 30, 693–697. [Google Scholar]
  42. Duce, R.A.; Arimoto, R.; Ray, B.J.; Unni, C.K.; Harder, P.J. Atmospheric trace elements at Enewetak Atoll: 1. Concentrations, sources, and temporal variability. J. Geophys. Res. Oceans 1983, 88, 5321–5342. [Google Scholar] [CrossRef]
  43. Shen, Z.X.; Arimoto, R.; Cao, J.J.; Zhang, R.J.; Li, X.X.; Du, N.; Okuda, T.; Nakao, S.; Tanaka, S. Seasonal variations and evidence for the effectiveness of pollution controls on water-soluble inorganic species in total suspended particulates and fine particulate matter from Xi’an, China. J. Air Waste Manag. Assoc. 2008, 58, 1560–1570. [Google Scholar] [CrossRef]
  44. Gao, Y.; Arimoto, R.A.; Lee, D.S.; Zhou, M.Y. Input of atmospheric trace elements and mineral matter to the Yellow Sea during the spring of a low-dust year. J. Geophys. Res. 1992, 97, 3767–3777. [Google Scholar] [CrossRef]
  45. Huang, L.K.; Wang, K.; Yuan, C.S.; Wang, G.Z. Study on the seasonal variation and source apportionment of PM10 in Harbin, China. J. Aerosol Air Qual. Res. 2010, 98, 148–162. [Google Scholar] [CrossRef]
  46. Tayor, S.R.; Mclennan, S.M. The Continental Crust: Its Composition and Evolution; Blackwell Scientific Publications: Hoboken, NJ, USA, 1985. [Google Scholar]
  47. Duan, J.C.; Tan, J.H.; Wang, S.L.; Hao, J.M.; Chai, F.H. Size distributions and sources of elements in particulate matter at curbside, urban and rural sites in Beijing. J. Environ. Sci. 2012, 24, 87–94. [Google Scholar] [CrossRef]
  48. Chen, Y.; Xie, S.D.; Luo, B. Composition and pollution characteristics of fine particles in Chengdu from 2012 to 2013. J. Acta Scientiae Circumstantiae 2016, 36, 1021–1031. [Google Scholar]
  49. Sternbeck, J.; Sjödin, Å.; Andréasson, K. Metal emissions from road traffic and the influence of resuspension-results from two tunnel studies. J. Atmos. Environ. 2002, 36, 4735–4744. [Google Scholar] [CrossRef]
  50. Birmili, W.; Allen, A.G.; Bary, F.; Harrison, M. Trace metal concentrations and water solubility in size-fractionated atmospheric particles and influence of road traffic. J. Environ. Sci. Technol. 2006, 40, 1144–1153. [Google Scholar] [CrossRef] [PubMed]
  51. Turpin, B.J.; Huntzicker, J.J. Identification of secondary organic aerosol episodes and quantitation of primary and secondary organic aerosol concentrations during SCAQS. Atmos. Environ. 1995, 29, 3527–3544. [Google Scholar] [CrossRef]
  52. Seinfeld, J.H.; Pandis, S.N.; Noone, K. Atmospheric Chemistry and Physics: From Air Pollution to Climate Change; Wiley: Hoboken, NJ, USA, 1998. [Google Scholar]
  53. Schauer, J.J.; Kleeman, M.J.; Cass, G.R.; Simoneit, B.R.T. Measurement of emissions from air pollution sources. 2. C1 through C30 organic compounds from medium duty diesel trucks. Environ. Sci. Technol. 1999, 33, 1578–1587. [Google Scholar] [CrossRef]
  54. Chen, Y.J.; Zhi, G.R.; Feng, Y.L.; Fu, J.M.; Feng, J.L.; Sheng, G.Y.; Simoneit, B.R.T. Measurements of emission factors for primary carbonaceous particles from residential raw-coal combustion in China. J. Geophys. Res. Lett. 2006, 33, L20815. [Google Scholar] [CrossRef]
Figure 1. Geographical location of the monitoring site and major cities around the monitoring site in Northeast China.
Atmosphere 10 00510 g001
Figure 2. Temporal variation of the mass concentrations of particulate matter with a diameter of less than 2.5 μm (PM2.5) in autumn 2017 (a) and spring 2018 (b).
Atmosphere 10 00510 g002
Figure 3. Relationship of PM2.5 concentrations with wind direction and wind speed during the periods from 19 October to 23 November 2017 and 1 April to 13 May 2018. (a) Relationship of PM2.5 concentrations with wind direction and wind speed during the periods from 19 October to 23 November 2017. (a1) The daylight relationship of PM2.5 concentrations with wind direction and wind speed during the periods from 19 October to 23 November 2017. (a2) The nighttime relationship of PM2.5 concentrations with wind direction and wind speed during the periods from 19 October to 23 November 2017. (b) Relationship of PM2.5 concentrations with wind direction and wind speed during the periods from 1 April to 13 May 2018. (b1) The daylight relationship of PM2.5 concentrations with wind direction and wind speed during the periods from 1 April to 13 May 2018. (b2) The nighttime relationship of PM2.5 concentrations with wind direction and wind speed during the periods from 1 April to 13 May 2018.
Atmosphere 10 00510 g003
Figure 4. Daily variations of PM2.5 mass concentration, organic carbon (OC), elemental carbon (EC), water-soluble ions, and trace elements. (a) Daily variations of PM2.5 mass concentration, organic carbon (OC), elemental carbon (EC), water-soluble ions, and trace elements in Autumn 2017. (b) Daily variations of PM2.5 mass concentration, organic carbon (OC), elemental carbon (EC), water-soluble ions, and trace elements in Spring 2018.
Atmosphere 10 00510 g004
Figure 5. Scatter plots of total anions vs total cations in the fall of 2017 and spring of 2018.
Atmosphere 10 00510 g005
Figure 6. Enrichment factors in PM2.5.
Atmosphere 10 00510 g006
Table 1. Monthly average concentrations of PM2.5, OC, EC, water-soluble ions, and trace elements at the investigated rural site, Northeast China.
Factor/UnitAutumn 2017 (N = 34)Spring 2018 (N = 29)
RangeAverage ± SDRangeAverage ± SD
PM2.5/μg m−339.16–539.03142.82 ± 108.8397.25–976.16241.0 ± 188.6
OC/μg m−34.70–181.1237.03 ± 42.105.34–210.7726.73 ± 43.75
EC/μg m−30.78–16.063.76 ± 3.471.33–30.696.99 ± 7.49
F/μg m−3<LOD<LOD<LOD–0.210.05 ± 0.06
Cl/μg m−3<LOD–56.7813.22 ± 12.790.32–5.471.30 ± 1.25
NO3/μg m−3<LOD–56.2311.36 ± 13.342.17–20.047.02 ± 4.65
SO42−/μg m−3<LOD–27.757.74 ± 5.971.81–17.906.26 ± 4.49
Na+/μg m−3<LOD–2.350.15 ± 0.410.12–1.930.58 ± 0.39
NH4+/μg m−30.75–31.808.86 ± 7.660.77–17.504.01 ± 3.81
K+/μg m−30.70–14.344.14 ± 3.370.46 - 7.441.63 ± 1.74
Mg2+/μg m−3<LOD–1.160.22 ± 0.250.06–1.230.32 ± 0.29
Ca2+/μg m−30.01–2.800.74 ± 0.770.11–5.371.59 ± 1.36
K/ng m−3960.67–10091.793710.83 ± 2430.20660.40–10971.452891.02 ± 2407.57
Ca/ng m−3<LOD–3132.38568.35 ± 639.99232.55–8991.142094.26 ± 1876.18
Fe/ng m−3<LOD–960.18202.23 ± 210.32330.62–13936.932175.25 ± 2630.90
Al/ng m−3<LOD–1542.91340.45 ± 377.65112.44–30947.423930.28 ± 5884.46
Mg/ng m-3<LOD–1505.99201.47 ± 304.03<LOD–4157.46626.21 ± 835.26
Zn/ng m−310.03–147.5054.33 ± 32.565.50–101.7536.52 ± 27.94
Pb/ng m−3<LOD–61.6616.74 ± 13.59<LOD–35.8214.56 ± 9.22
Ti/ng m−3<LOD–79.9818.26 ± 19.5320.30–1476.56210.5 ± 278.85
Mn/ng m−32.44–78.8213.6 ± 14.6915.97–392.1172.57 ± 72.58
Cu/ng m−37.32–302.7440.42 ± 51.456.15–213.6757.41 ± 46.66
Ba/ng m−3<LOD–259.6721.62 ± 50.29<LOD–252.0231.94 ± 49.33
Sr/ng m−3<LOD–25.943.88 ± 4.892.25–95.0816.31 ± 18.32
V/ng m−30.10–2.600.74 ± 0.660.42–2.335.87 ± 7.08
Cd/ng m−30.34–2.821.11 ± 0.71<LOD–2.470.87 ± 0.66
Cr/ng m−3<LOD–2.650.31 ± 0.723.95–30.828.24 ± 5.34
Co/ng m−3<LOD–0.910.20 ± 0.30<LOD–7.991.26 ± 1.55
Ni/ng m−3<LOD–4.140.19 ± 0.76<LOD–20.603.80 ± 4.09
Mo/ng m−3<LOD<LOD<LOD–6.710.4 ± 1.39
Nd/ng m−3<LOD<LOD<LOD–13.721.88 ± 2.67
Annotation: Limits of detection (LOD) are as follows: the LOD (μg mL−1) of F, Cl, NO3, SO42−, Na+, NH4+, K+, Mg2+, Ca2+ were 0.04, 0.09, 0.28, 0.03, 0.0006, 0.001, 0.003, 0.004 and 0.003, respectively. The LOD (μg mL−1) of Al, Ba, Ca, Cd, Co, Cr, Cu, Fe, K, Mg, Mn, Mo, Nd, Ni, Pb, Sr, Ti, V, Zn were 0.009, 0.022, 0.047, 0.001, 0.001, 0.002, 0.007, 0.041, 0.003, 0.014, 0.001, 0.004, 0.001, 0.003, 0.009, 0.002, 0.034, 0.0002 and 0.004, respectively.

