Article

Characteristics of Fine Particulate Matter (PM2.5) over Urban, Suburban, and Rural Areas of Hong Kong

1
School of Marine Sciences, Nanjing University of Information Science and Technology, Nanjing 210044, China
2
Department of Geography, School of Global Studies, University of Sussex, Brighton BN19RH, UK
3
Key Laboratory of Digital Land and Resources, East China University of Technology, Nanchang 330013, China
4
School of Architecture, The Chinese University of Hong Kong, Hong Kong SAR 999077, China
5
Laboratory of Critical Zone Evolution, School of Earth Sciences, China University of Geosciences, Wuhan 430074, China
6
School of Atmospheric Physics, Nanjing University of Information Science and Technology, Nanjing 210044, China
7
Department of Urban Planning and Design, The University of Hong Kong, Hong Kong SAR 999077, China
8
School of Remote Sensing & Geomatics Engineering, Nanjing University of Information Science and Technology, Nanjing 210044, China
9
Department of Entomology, Plant Pathology and Weed Science, New Mexico State University (NMSU), Las Cruces, NM 88003, USA
10
Department of Civil Engineering, College of Engineering, King Khalid University, Abha 61421, Saudi Arabia
11
Department of Civil Engineering, Institut Superieur des Etudes Technologiques, Campus Universitaire Mrezgua Nabeul 8000, Tunisia
12
Institute of Methodologies for Environmental Analysis, National Research Council (CNR), 85050 Tito Scalo (PZ), Italy
13
SSAI-NASA, Science Systems and Applications Inc., Lanham, MD 20706, USA
*
Author to whom correspondence should be addressed.
Atmosphere 2019, 10(9), 496; https://doi.org/10.3390/atmos10090496
Submission received: 15 June 2019 / Revised: 18 August 2019 / Accepted: 22 August 2019 / Published: 27 August 2019
(This article belongs to the Special Issue Rural and Remote Aerosol)

Abstract

:
In urban areas, fine particulate matter (PM2.5) associated with local vehicle emissions can cause respiratory and cardiorespiratory disease and increased mortality rates, but less so in rural areas. However, Hong Kong may be a special case, since the whole territory often suffers from regional haze from nearby mainland China, as well as local sources. Therefore, to understand which areas of Hong Kong may be affected by damaging levels of fine particulates, PM2.5 data were obtained from March 2005 to February 2009 for urban, suburban, and rural air quality monitoring stations; namely Central (city area, commercial area, and urban populated area), Tsuen Wan (city area, commercial area, urban populated, and residential area), Tung Chung (suburban and residential area), Yuen Long (urban and residential area), and Tap Mun (remote rural area). To evaluate the relative contributions of regional and local pollution sources, the study aimed to test the influence of weather conditions on PM2.5 concentrations. Thus, meteorological parameters including temperature, relative humidity, wind speed, and wind directions were obtained from the Hong Kong Observatory. The results showed that Hong Kong’s air quality is mainly affected by regional aerosol emissions, either transported from the land or ocean, as similar patterns of variations in PM2.5 concentrations were observed over urban, suburban, and rural areas of Hong Kong. Only slightly higher PM2.5 concentrations were observed over urban sites, such as Central, compared to suburban and rural sites, which could be attributed to local automobile emissions. Results showed that meteorological parameters have the potential to explain 80% of the variability in daily mean PM2.5 concentrations—at Yuen Long, 77% at Tung Chung, 72% at Central, 71% at Tsuen Wan, and 67% at Tap Mun, during the spring to summer part of the year. The results provide not only a better understanding of the impact of regional long-distance transport of air pollutants on Hong Kong’s air quality but also a reference for future regional-scale collaboration on air quality management.

1. Introduction

Aerosols are particles suspended in the atmosphere with complex chemical composition and size that vary in both time and space and mainly exist within the atmospheric boundary layer. Fine particulate matter (PM2.5) and coarse particulate matter (PM10) are atmospheric aerosol particles with aerodynamic diameters less than 2.5 μm and less than 10 μm, respectively, expressed in μg·m−3. These two aerosol groups have different sources and characteristics, but both interact with solar radiation and affect air quality, visibility, and the climate system [1]. They directly influence the Earth’s energy budget, surface temperature, and precipitation, and degrade atmospheric visibility through light extinction. By changing the optical properties of clouds, they affect climate indirectly. Thus, they create uncertainty in the prediction of regional climate-effects, especially in the context of climate change [2,3,4].
PM2.5 is emitted from natural and anthropogenic sources [5,6,7]. In urban areas, PM2.5 is normally associated with local emissions from automobile exhausts [8]. This is not only the most important source of urban PM2.5 [9,10] but also the main source of secondary particles in the atmosphere through chemical transformation (gas-to-particles) [11]. Studies indicate that tropical Asia contributes most to world air pollution due to the significant increase in aerosol pollutants from both anthropogenic and natural sources [12,13,14,15,16].
Ambient particulate matter (PM) causes severe health problems [17,18,19], but the health consequences depend on the size and composition of the particles, with PM2.5 being the greater health hazard [20]. Studies have reported the association of PM with lung [21], respiratory [22], mutagenic [23], and cardiorespiratory diseases [24], and chronic effects such as asthma, and mortality, have been documented [25,26,27]. An increase of 10 μg·m−3 in PM2.5 can increase, by 4%, 6%, and 8%, the rate of cardiopulmonary diseases, lung cancer, and mortality, respectively [28]. In Hong Kong, for every 10 μg·m−3 increase in the daily average concentration levels of PM2.5, there is approximately 2% more hospitalization and a 2% increase in the mortality due to respiratory diseases [29,30]. Children and elderly people are more vulnerable (Chau, et al. [31]).
In recent years, fine particulate pollution has become a global issue due to its impact on human health, air quality, and the climate system. Therefore, air quality monitoring stations have been established in many countries for regular measurement of PM2.5, for epidemiological studies as well as for the management of air quality [32,33]. To understand the formation and dispersion of PM2.5 in the atmosphere, studies have used ground-based surface meteorological variables, such as air temperature (TEMP), relative humidity (RH), precipitation (P), wind speed (WS), wind direction (WD), and mixing height (MH) [34,35,36,37,38,39,40,41,42]. Higher values of 24 h average PM2.5 appear to be associated with lower temperatures [35,37,40] and its characteristics are shown to be affected by RH above 70% [43]. The concentrations of PM2.5 appear to depend on TEMP, RH, MH, P, cloud cover, WS, and WD [35,37,42], but the association between PM2.5 concentrations and meteorological variables varies with respect to region. Gupta et al. [44] reported correlation coefficients of −0.27 to −0.06, and −0.85 to −0.60 for PM2.5 with TEMP and WS respectively, over Kolkata, India. Correlation coefficients of −0.58 and −0.33 were observed for PM2.5 with TEMP and WS, respectively, over Fairbanks, Alaska [40].
In Hong Kong, only a few previous studies [45,46,47,48] are available on PM2.5 and on the relationship between PM2.5 and surface meteorological variables [49]. Shi et al. [49] found correlation coefficients of 0.50, −0.48, −0.37, −0.101, and 0.095 for daily average PM2.5 against mean sea level pressure (MSLP), RH, TEMP, WD, and WS respectively, at the Central air quality monitoring station for the two years 2007 and 2008. Since their study covered only one urban air monitoring quality station, a detailed study of concentrations along with meteorological variables is still needed to understand the spatio-temporal behavior and characteristics of PM2.5 over urban and rural areas of Hong Kong. In particular, since Hong Kong is often under the influence of regional haze, covering large parts of neighboring mainland China, the extent to which those living in suburban and rural areas of the territory are affected by PM2.5 is unknown. Indeed, the source of poor air quality in Hong Kong has long been a controversial issue. The present study aims to investigate the characteristics of fine particulate matter (PM2.5) with relevance to meteorological parameters over urban, suburban, and rural areas of Hong Kong, which could be a useful reference for the future regional-scale collaboration on air quality management. Therefore, the objective of this study is to analyze the spatio-temporal variations and characteristics of PM2.5 using data from five air quality monitoring stations in urban, suburban, and rural areas of Hong Kong. For a better understanding of PM2.5 variability with relevance to meteorological parameters, the influence of surface meteorological variables (TEMP, RH, WS, and WD) on PM2.5 is examined.

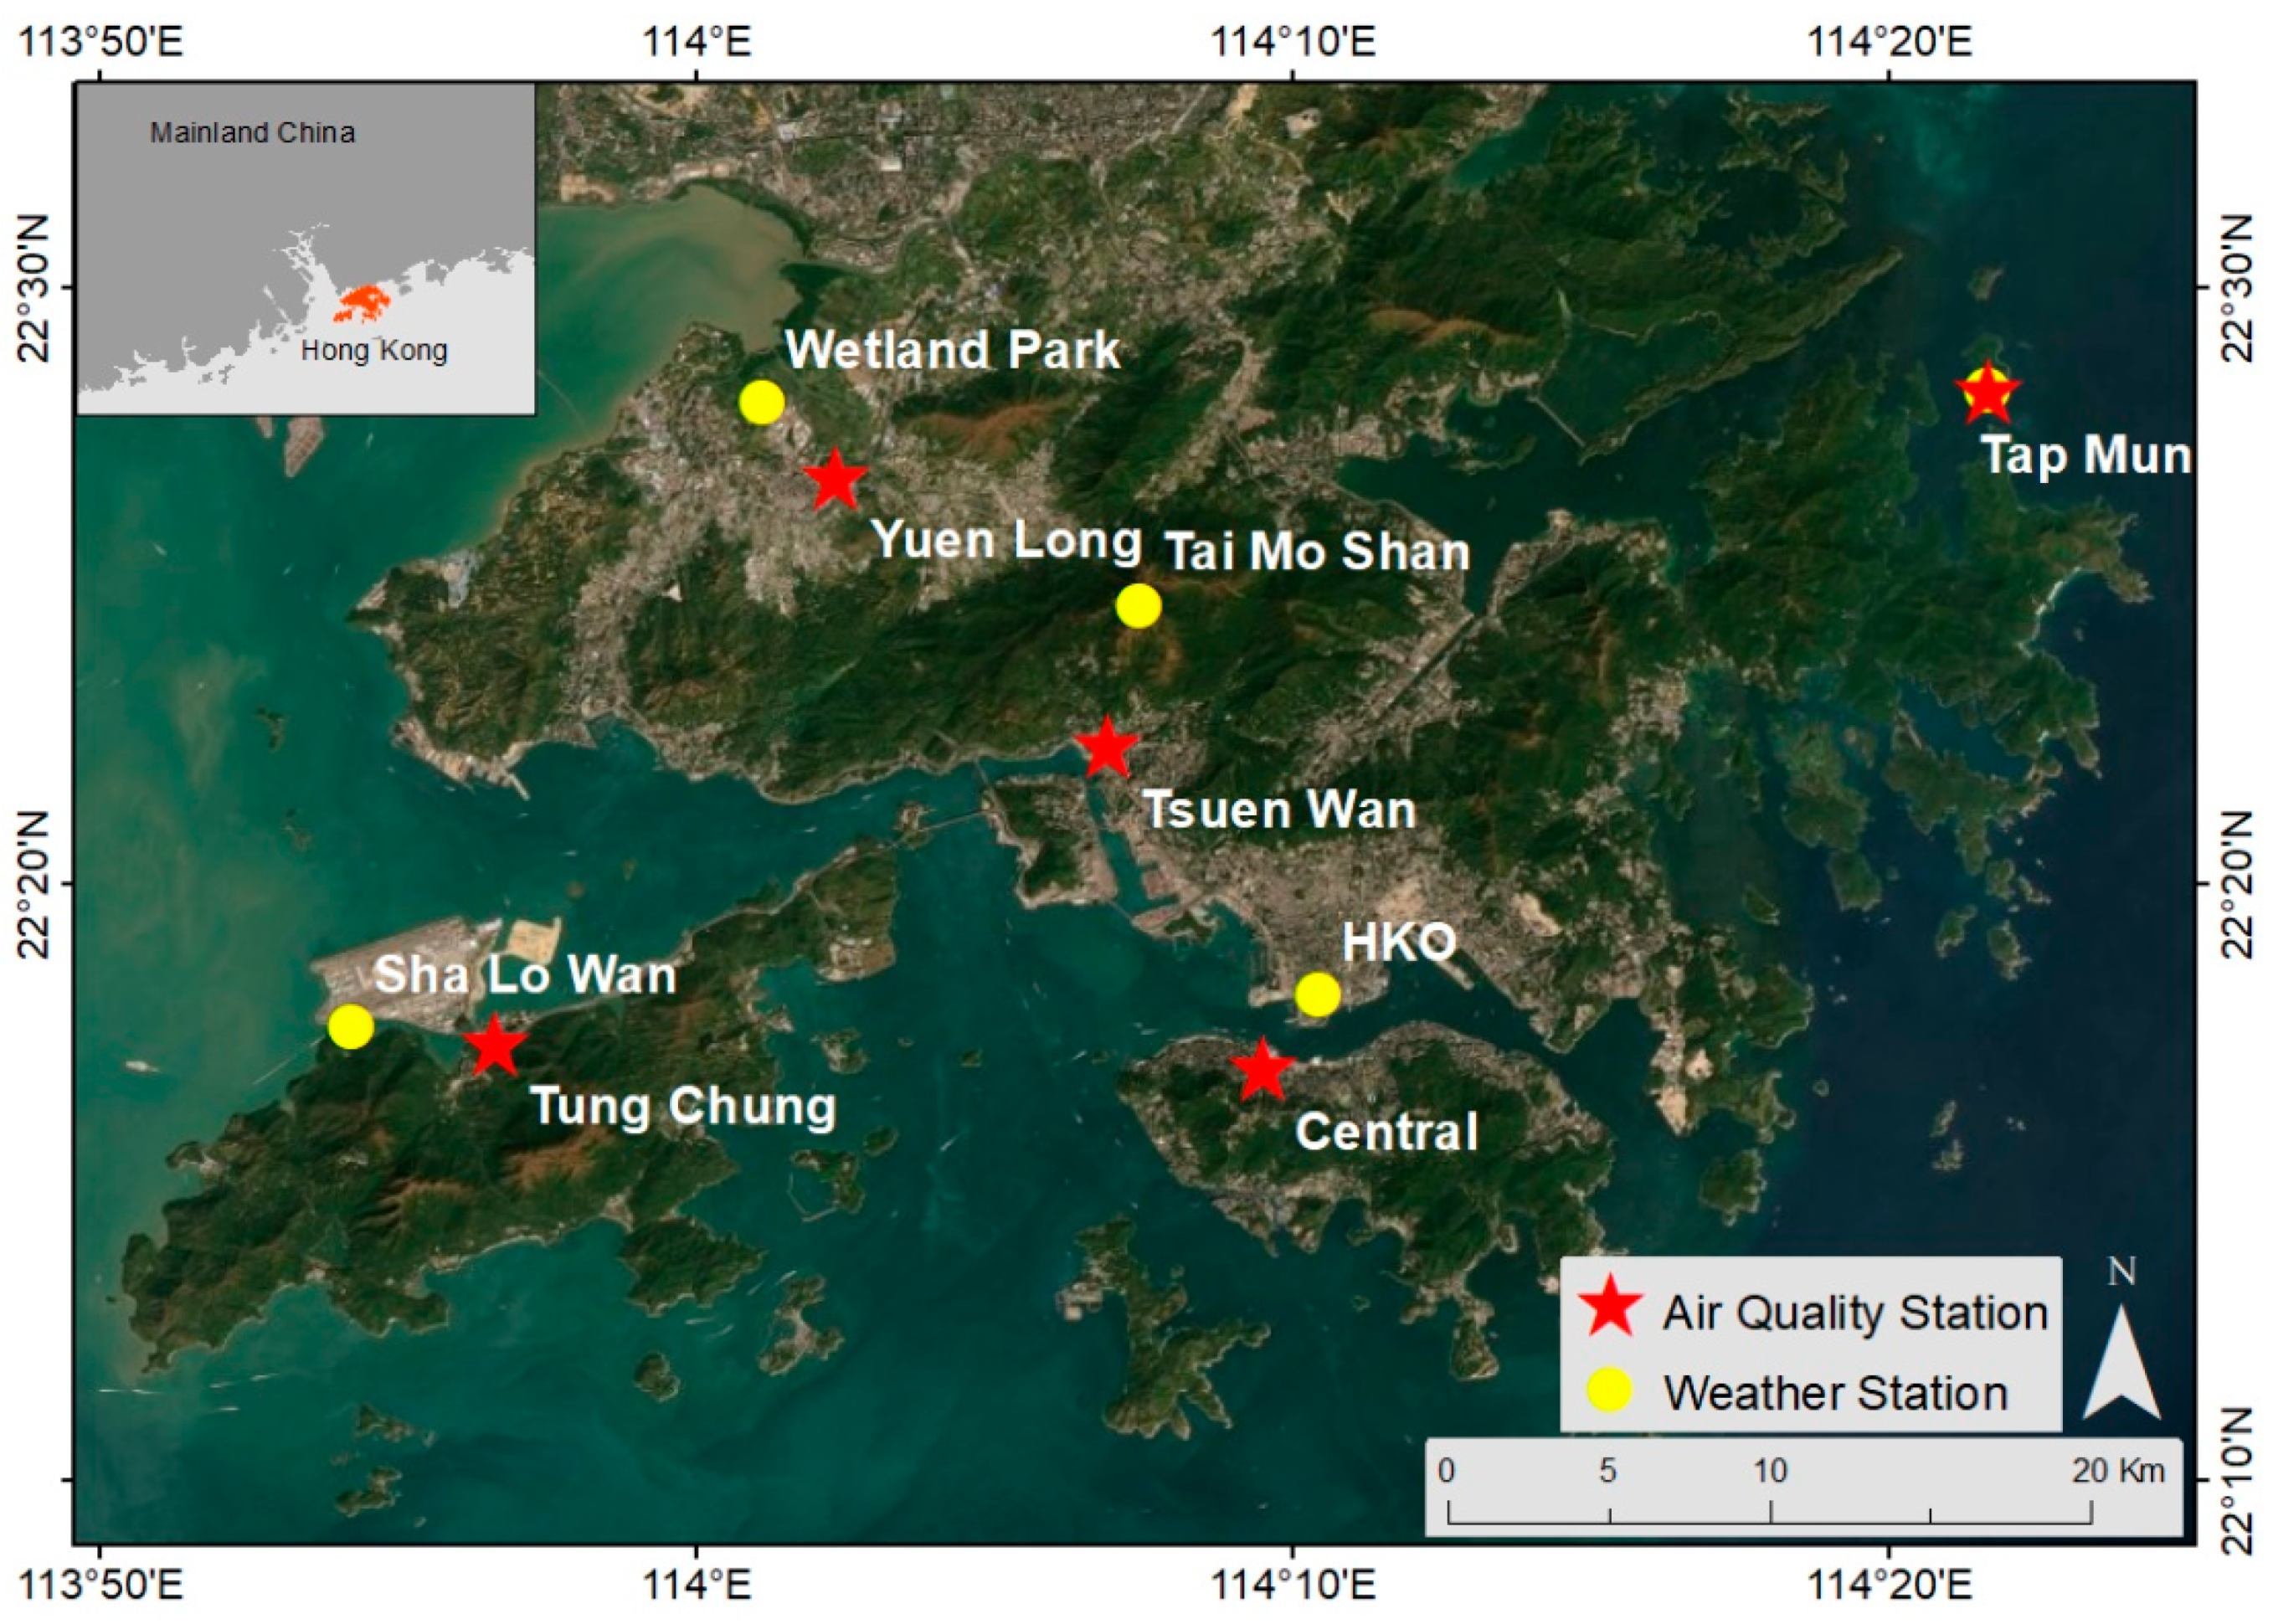
2. Study Area and Data Sets

The Hong Kong Special Administrative Region (SAR) of China, with complex and hilly terrain, is situated on the southeast coast of China with an area of 1104 km2. It is the world’s densest city with a population density averaging 6540 people km−2 [50]. Hong Kong is facing severe air quality problems due to the presence of PM2.5 in the atmosphere [51,52]. The air quality objectives (AQO) of Hong Kong are 35 μg·m−3 and 75 μg·m−3 for annual and 24 h PM2.5, respectively [53] which are three times less stringent than the AQS (Air Quality Standard) of World Health Organization (WHO), which are 10 μg·m−3 and 25 μg·m−3 for annual and 24 h PM2.5, respectively. Over the four years from 2005 to 2008 the annual mean PM2.5 mass concentration of 40.35 μg·m−3 observed in the present study is slightly higher than Hong Kong’s annual AQO (35 μg·m−3), but, four times higher than the WHO annual AQS (10 μg·m−3).
In this study, PM2.5 data from March 2005 to February 2009 (hereafter 2005 to 2008) were obtained from the Environmental Protection Department (EPD) for five air quality monitoring stations located in Central (urban), Tsuen Wan (urban), Tung Chung (suburban), Yuen Long (urban) and Tap Mun (remote rural) (Figure 1, Table 1). The urban-suburban-rural areas are defined based on the building volume density (BVD) within the 1 km radius of the surrounding area (Table 1). PM2.5 mass concentrations are measured under RH conditions between 40–50% using the Tapered–Element Oscillating Microbalance (TEOM) instrument with an accuracy of ±1.5 μg·m−3 for hourly averages. To check the influence of meteorological parameters on PM2.5, ground-based hourly meteorological parameters such as TEMP, RH, WS, and WD are obtained from March 2007 to February 2009 (hereafter from 2007 to 2008) from the automatic weather stations (AWS; Table 1) installed by the Hong Kong Observatory (HKO). These AWS are installed at the HKO, located at distances of 2.8 km from Central, Tai Mo Shan (TMS), 5.2 km from Tsuen Wan, Sha Lo Wan (SLW), 4.1 km from Tung Chung, Wetland Park (WLP), 3.3 km from Yuen Long, and Tap Mun (TM), and 0.0 km from Tap Mun—air quality monitoring stations (Figure 1).
For the calculation, assume that A P i and h i are the footprint area and height of building i of urban lot j (which has a total number of n buildings). Then, the total building volume of lot j is:
V = i = 1 n A P i h i
Vmax is the highest V among all lots of the whole city. The building volume density of lot j is:
B V D j = V j / V m a x
As a result, the calculated BVD is in a standardized numerical form that ranges from 0 to 1.

3. Methodology

The methodology is based on the following steps:
  • The total number of exceedances were calculated; i.e., how many times PM2.5 concentrations are greater than the AQO, using daily mean PM2.5 concentrations from 2005 to 2008 for each air quality monitoring station.
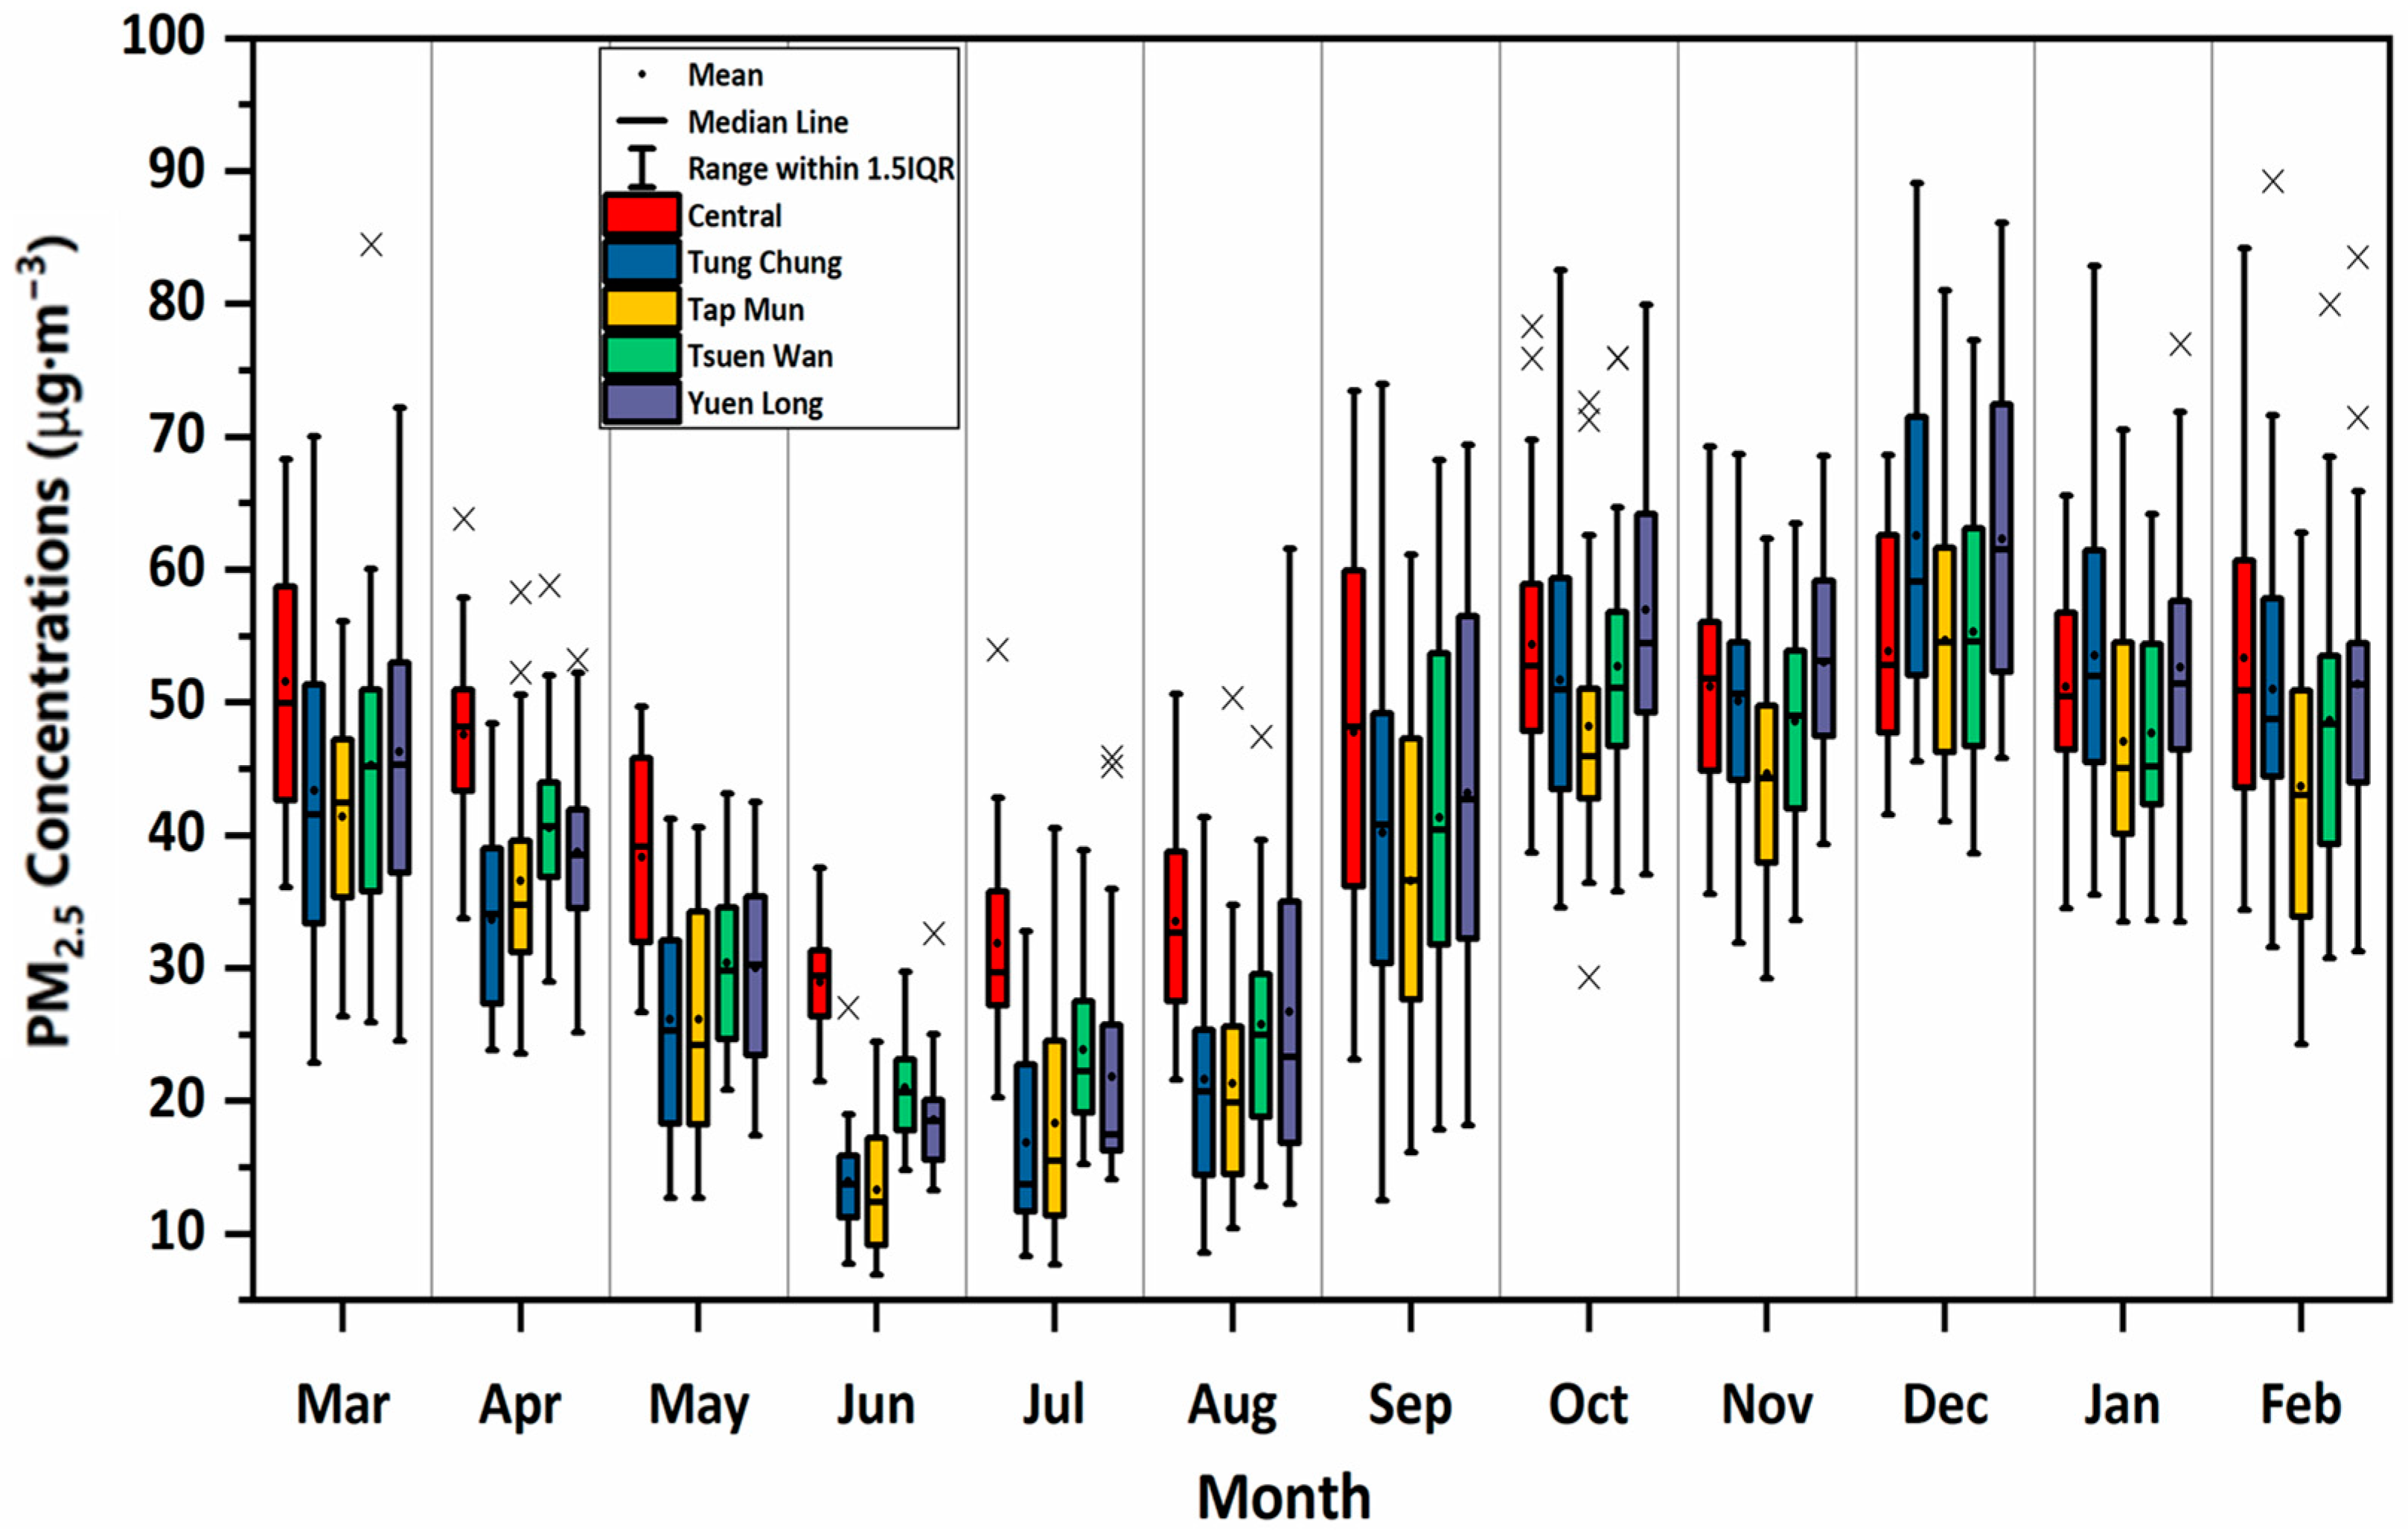
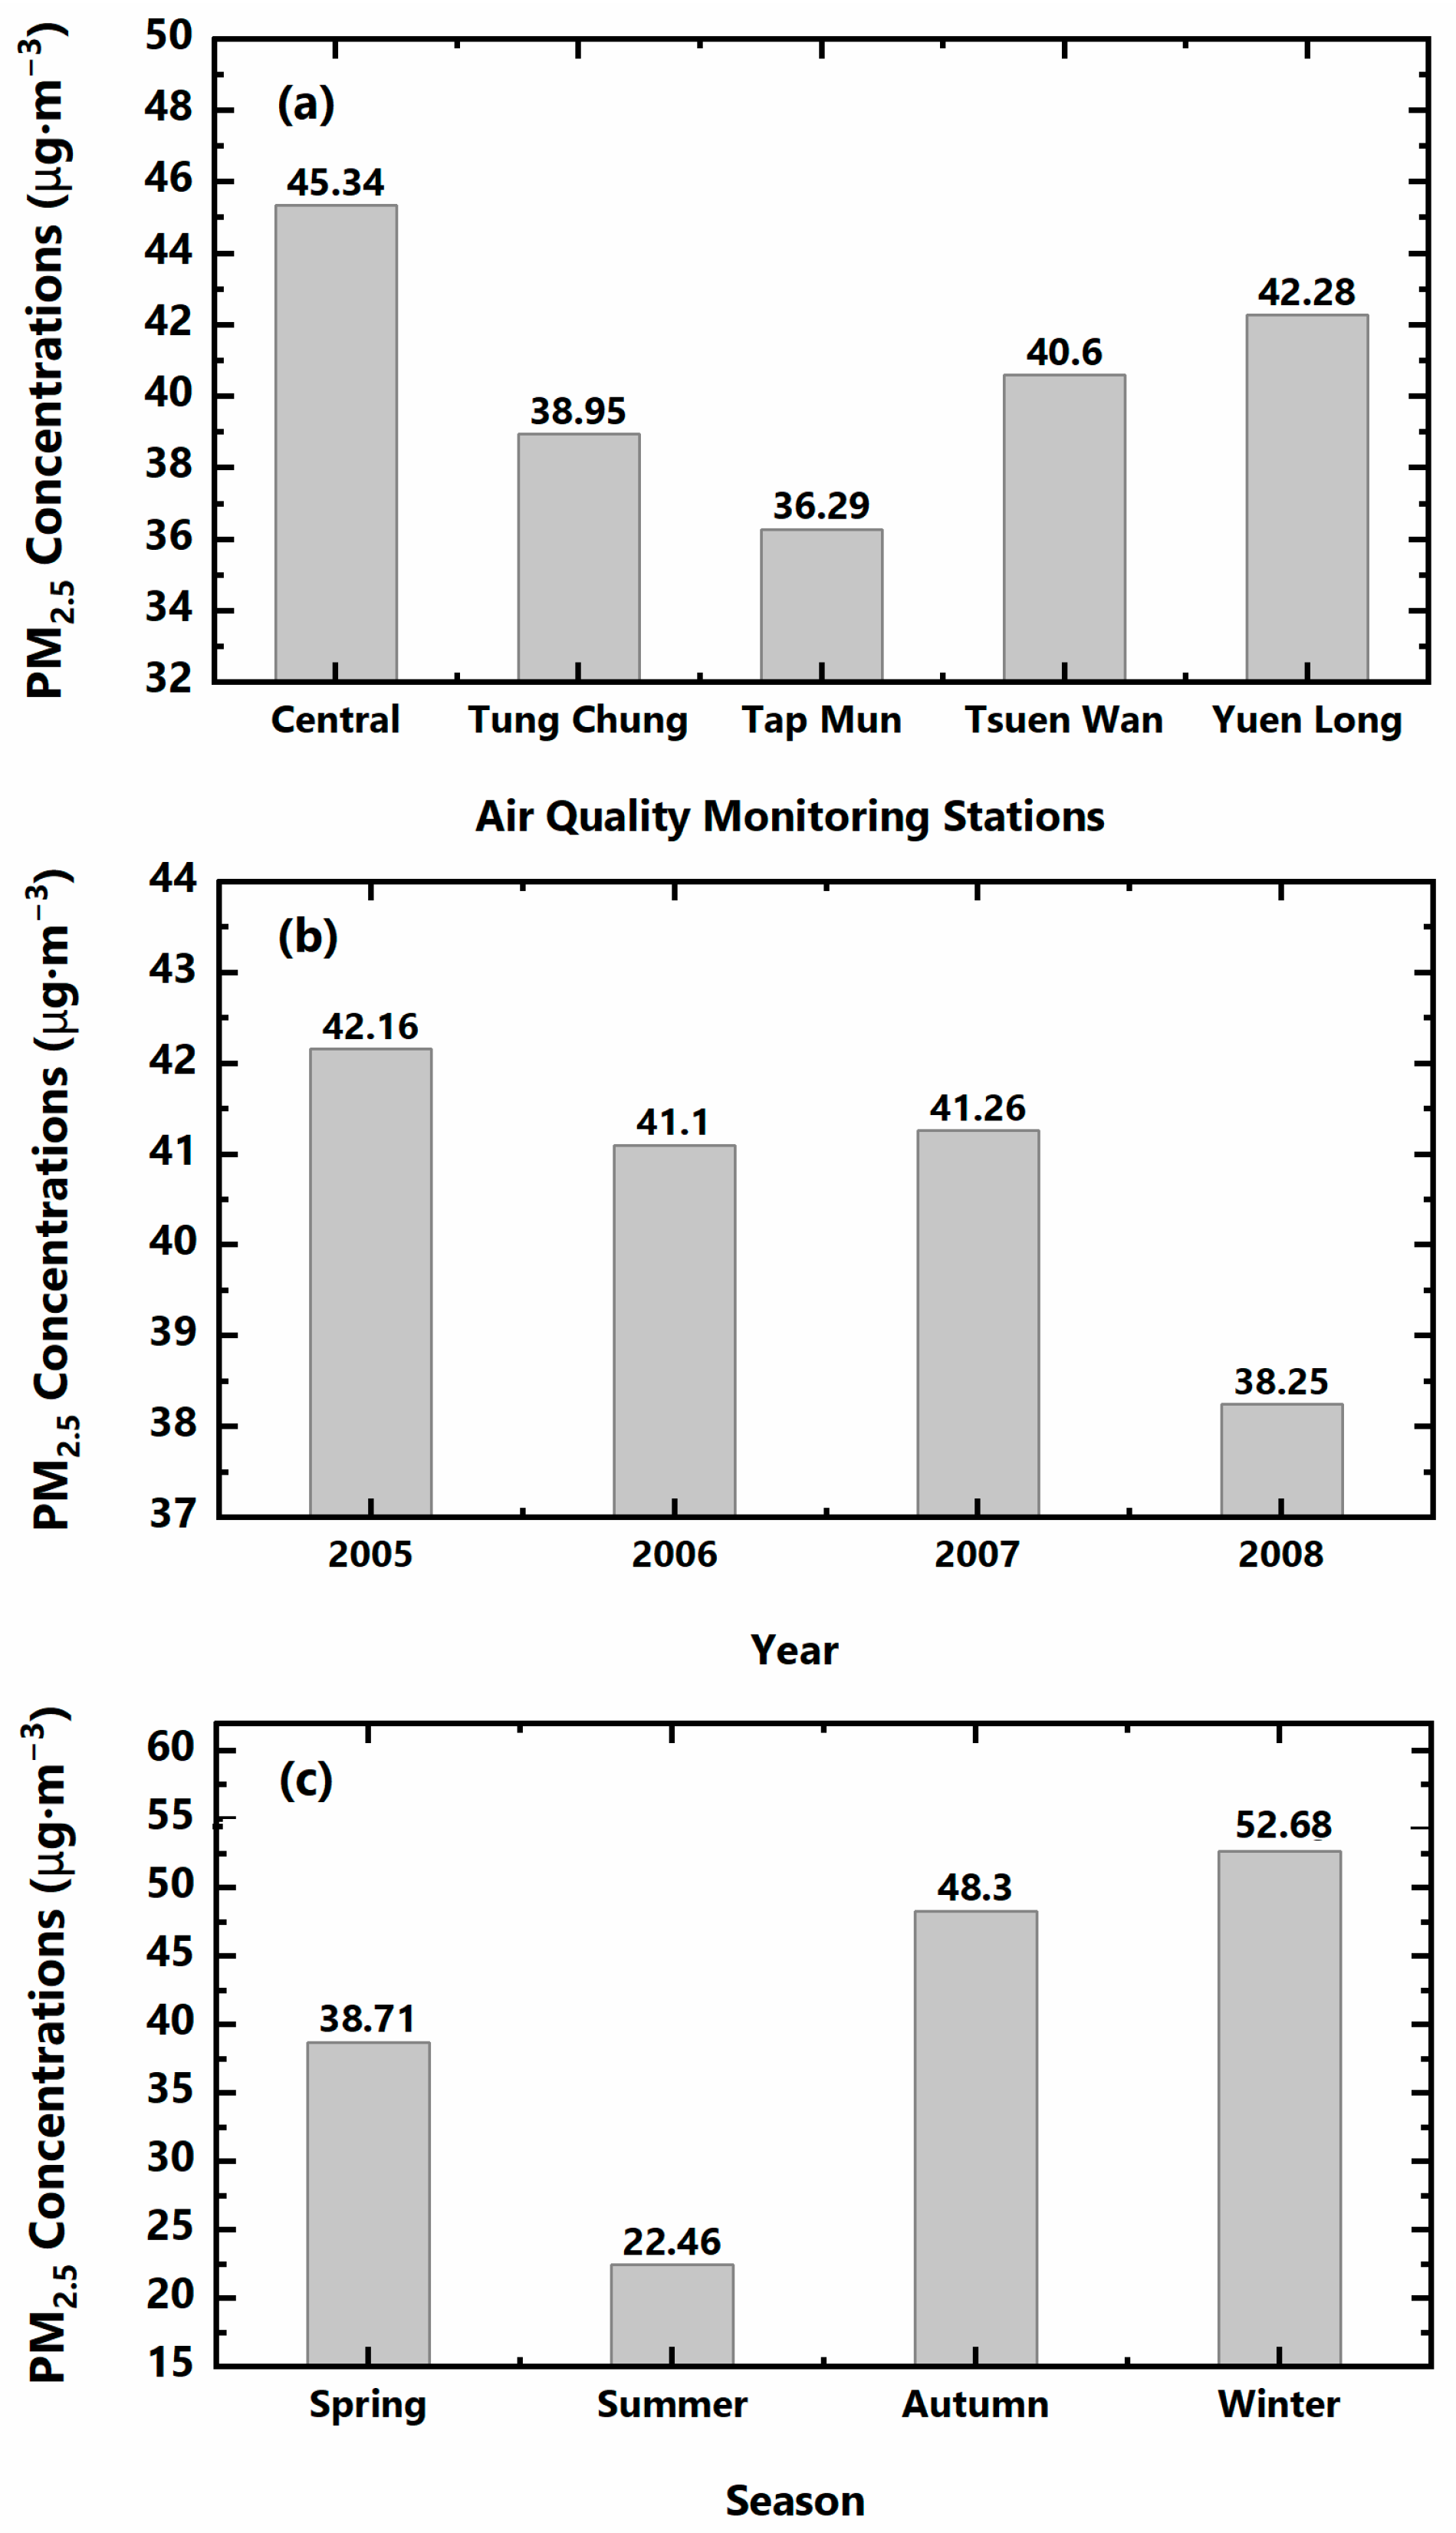
  • Seasonal descriptive statistics for each station were calculated using the one-way ANOVA test based on the hourly PM2.5 concentrations. To study the seasonal evolutions of PM2.5, a year was classified into four distinct seasons: Winter (December–January–February: DJF), spring (March–April–May: MAM), summer (June–July–August: JJA), and autumn (September–October–November: SON) based on the prevailing significant meteorological changes observed in Hong Kong.
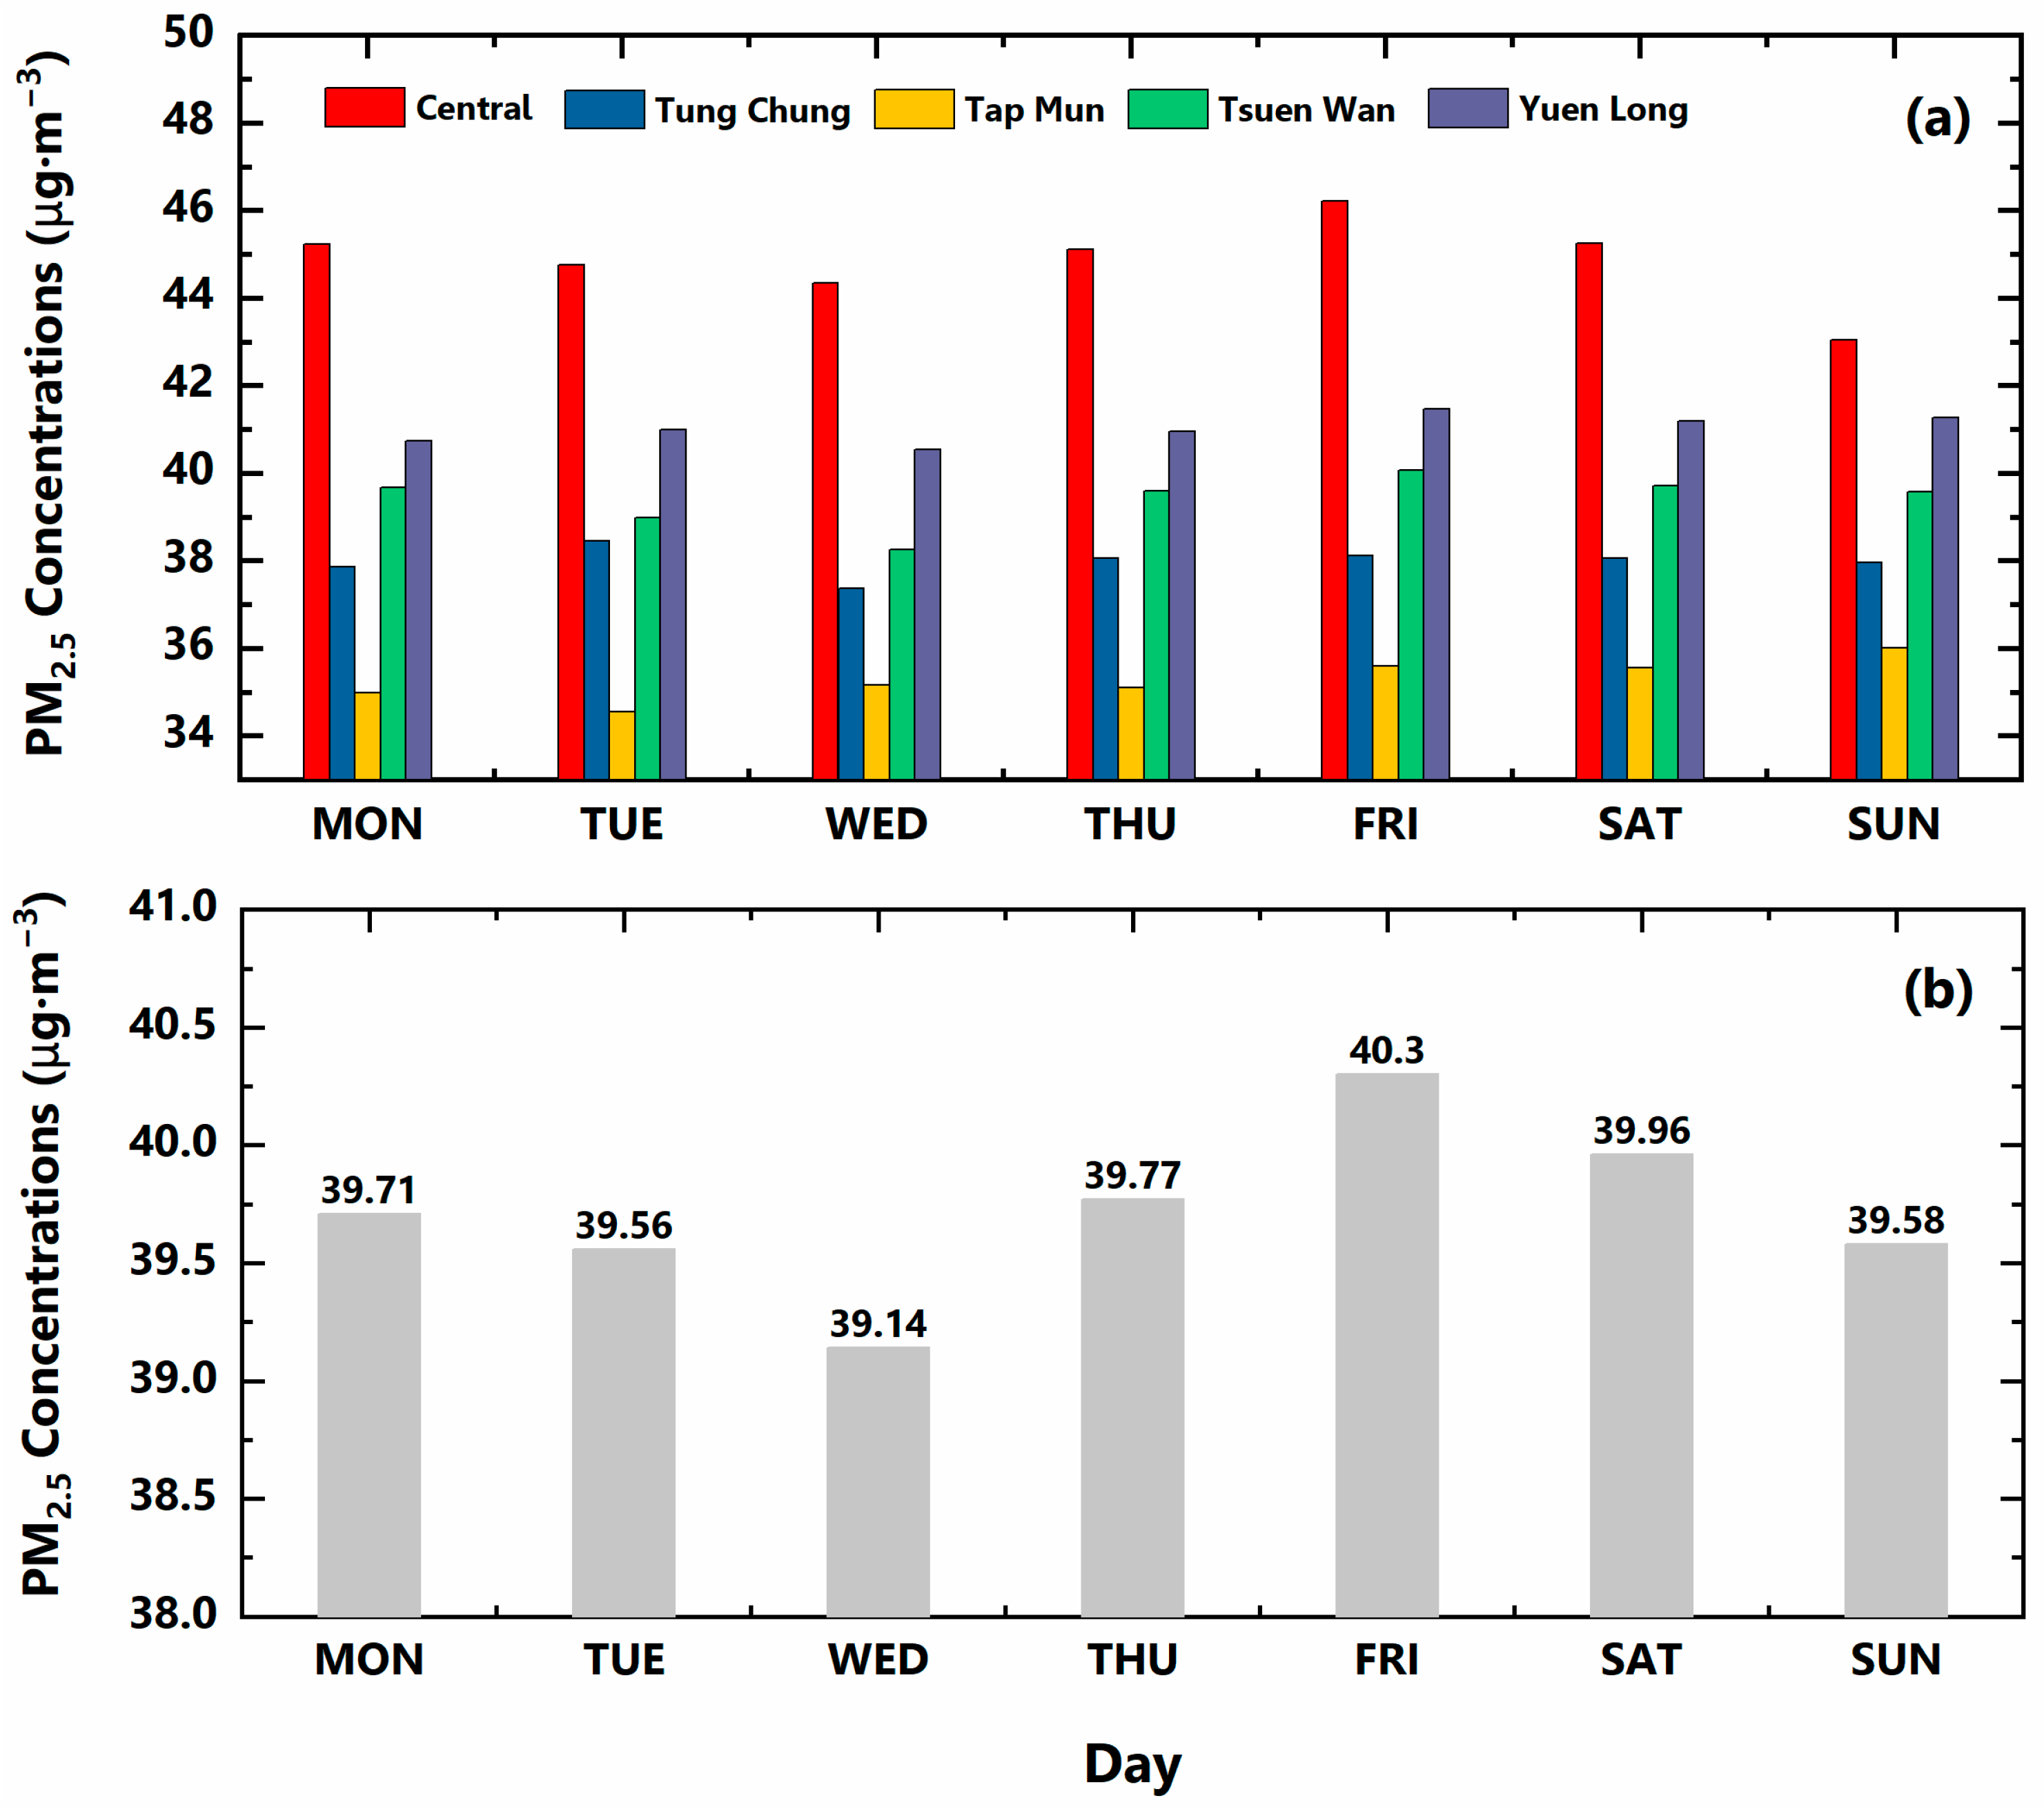
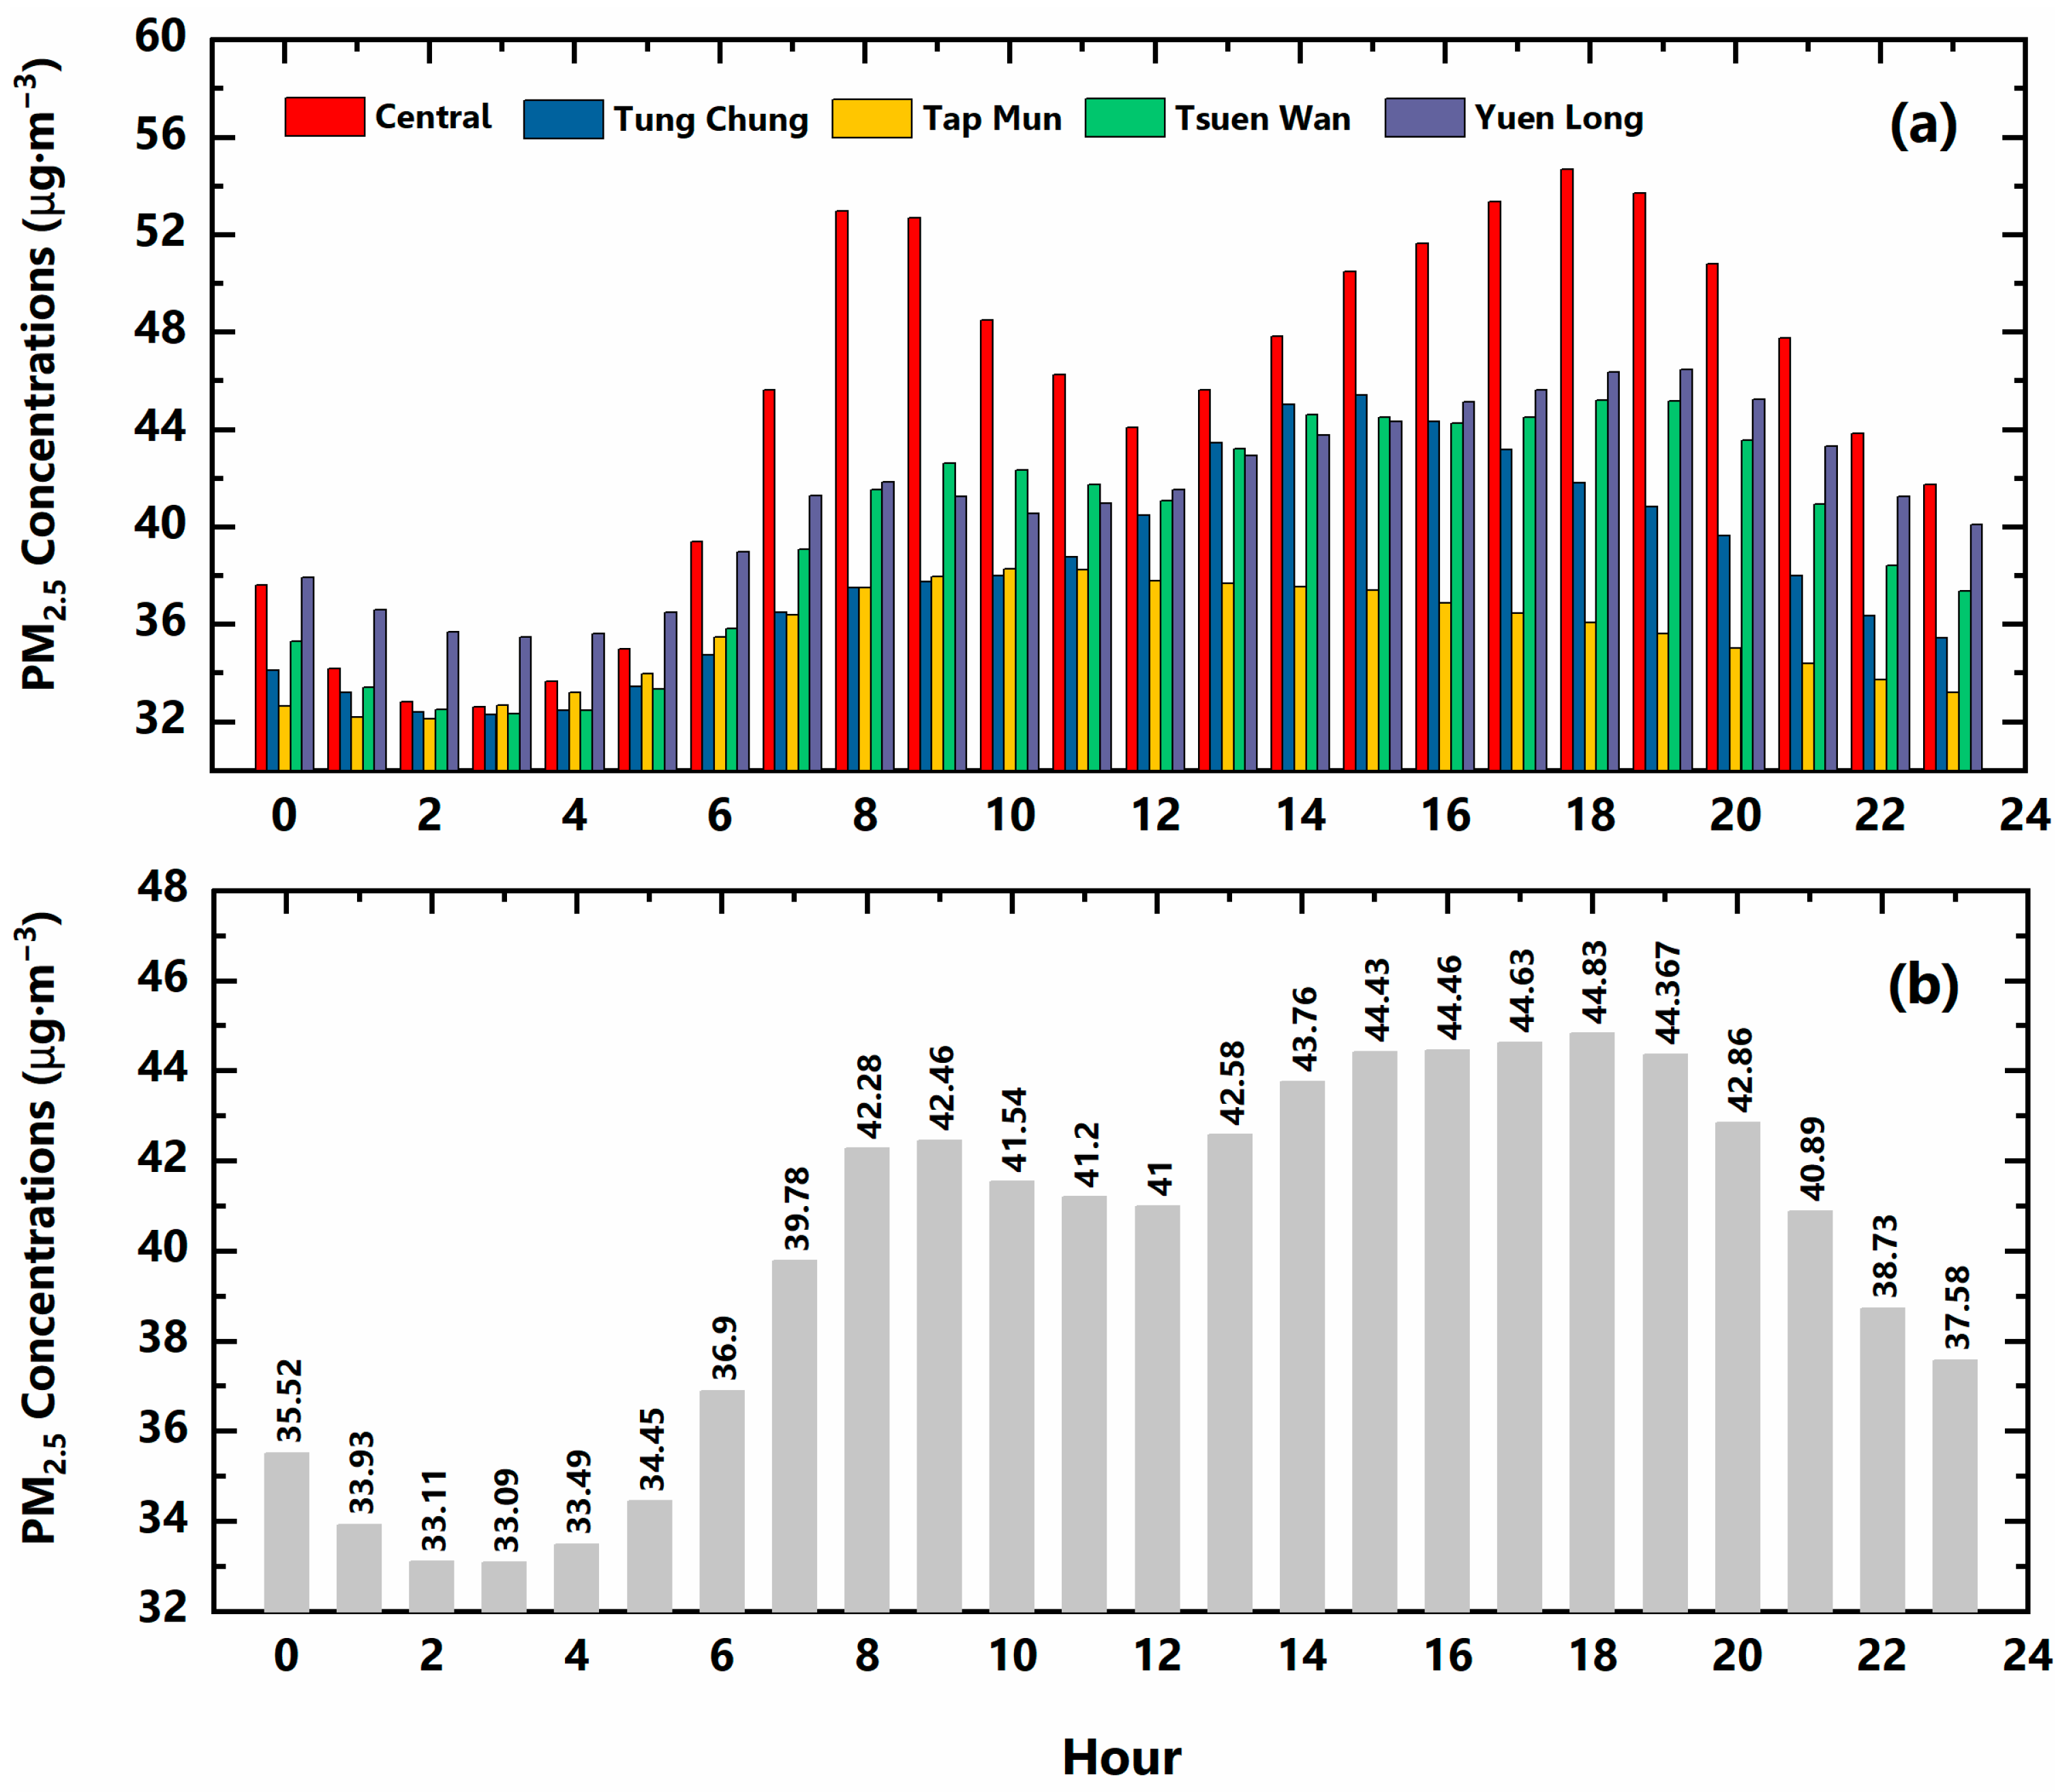
  • Temporal analyses based on daily and monthly mean data were performed to understand the temporal variations in PM2.5 and exceedances with respect to the AQO of Hong Kong and AQS of WHO. Furthermore, the four-year mean PM2.5 concentrations were used to identify the most polluted (i) region, (ii) year, (iii) season, (iv) day, and (v) hour in Hong Kong.
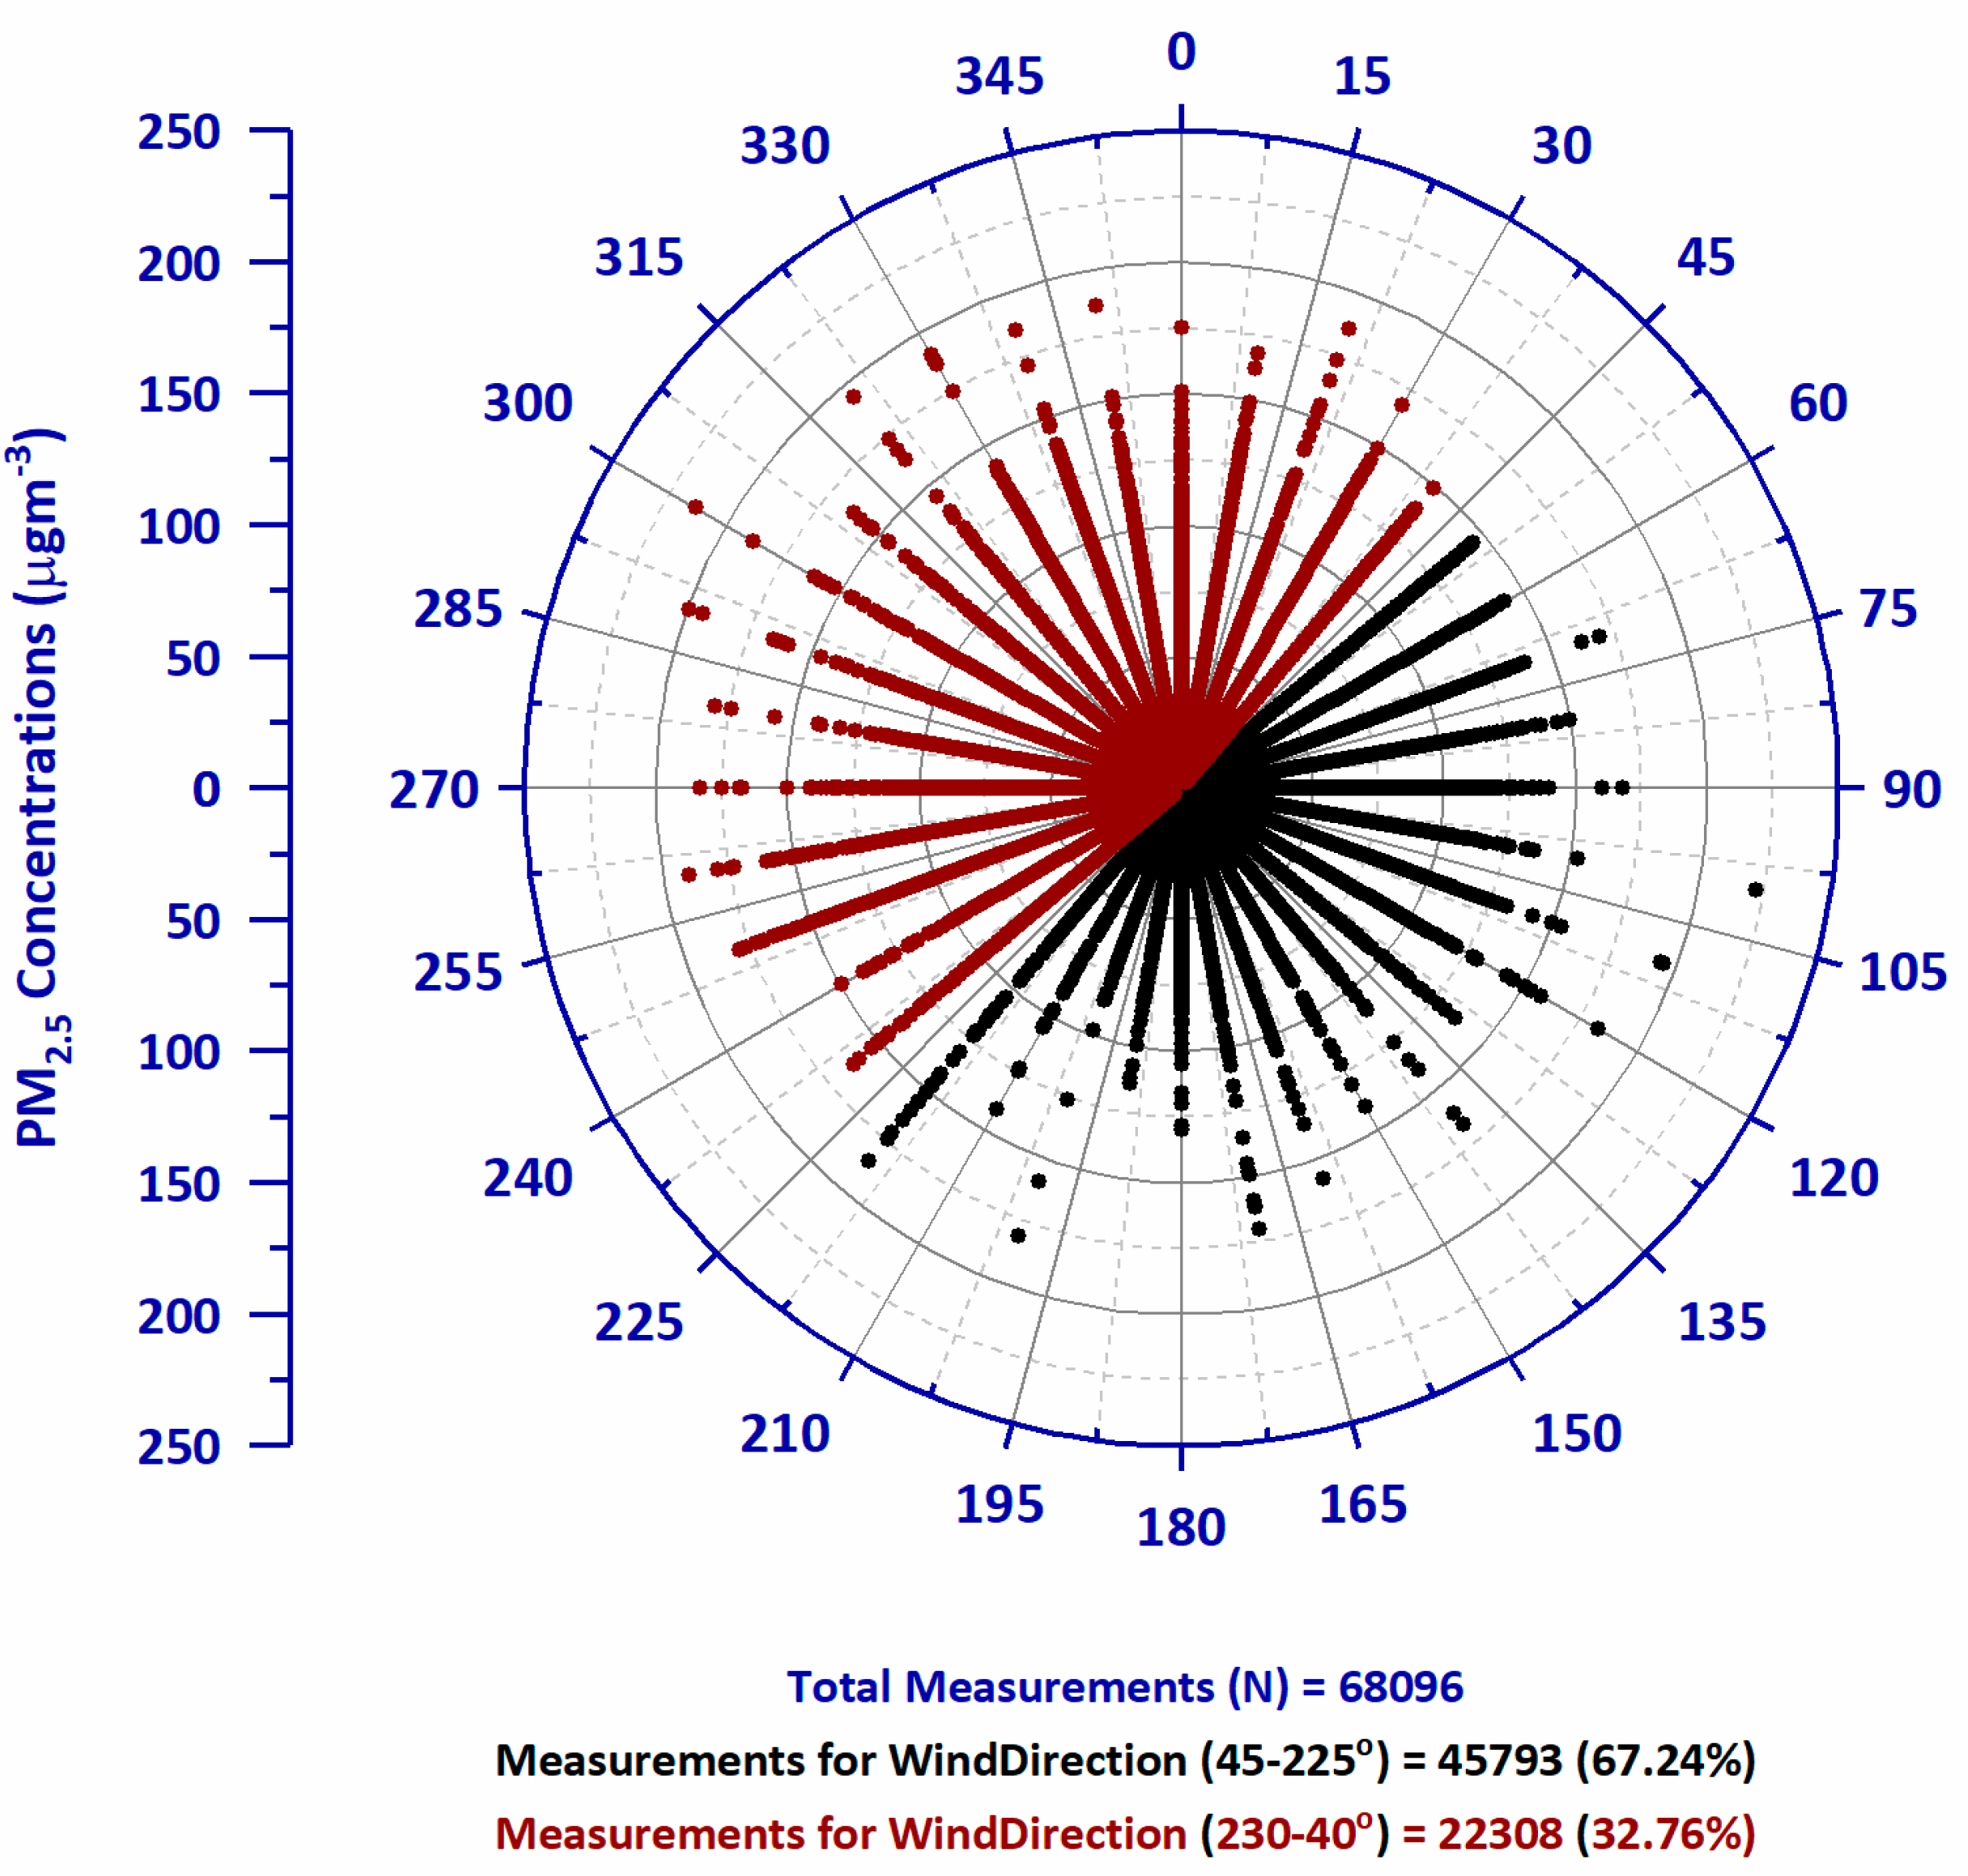
  • Relationships between daily mean PM2.5 concentrations and daily mean meteorological parameters (TEMP, RH, WS, and WD) were established using multiple linear regression, to understand the influence of meteorological parameters on PM2.5 concentrations.

4. Results and Discussion

The daily mean PM2.5 concentrations at the five air quality monitoring stations were analyzed for diurnal to seasonal variations, to depict the detailed spatio-temporal variability of air quality over the complex and rugged terrain of Hong Kong. Results show that the daily mean PM2.5 concentration at all air quality monitoring stations is lower than HK’s 24 h AQO (75 μg·m−3) in each season except for a very few values in winter at Tung Chung and Yuen Long (Table 2). From the viewpoint of local air quality guidelines, these results suggest good air quality conditions over urban, suburban, and rural areas of Hong Kong. However, the air quality condition at each station exceeds the WHO 24 h AQS (25 μg·m−3) on most days in spring, autumn, and winter, which is almost two to three times worse than the summer conditions.
Results for the one-way ANOVA test show that the four-year mean PM2.5 concentrations during autumn and winter were significantly higher than those for spring and summer, which indicates consistently worse air quality conditions (Table 3). Air quality conditions were good during summer, as the four-year mean PM2.5 concentrations were lower than Hong Kong’s annual AQO (35 μg·m−3). Similar findings were reported by a previous study conducted over Hong Kong [49], which attributed the low concentrations of PM2.5 in summer to fewer anthropogenic emissions than in winter, and also an increase in the atmospheric boundary layer height, allowing upward dispersal of pollutants. The findings are also consistent with another study in Hong Kong [45], which used microscale geographic predictors to estimate the fine-scale spatial variation of PM2.5 concentration over Hong Kong. Studies for Beijing [1,34,54] have also found that air quality conditions over remote rural areas are much better than at urban and suburban sites, as well as having different temporal variations in PM2.5 concentration between urban and rural areas. However, the findings of the present study differ from Zhao et al.’s findings in Beijing [34] in that the four-year mean PM2.5 concentrations over a remote rural site in Hong Kong (Tap Mun) are comparable with the four-year mean PM2.5 concentrations observed over the urban/suburban sites. One-way ANOVA testing shows statistically significant differences in mean values between the air quality monitoring stations (Table 3). For example, in spring, the mean PM2.5 concentration for Central air quality monitoring station is statistically different from the other stations, whereas, no significant difference was observed between the mean values for Tsuen Wan and Yuen Long, and between Tung Chung and Tap Mun. Similarly, for winter, no statistical differences were observed in mean values for Yuen Long and Tung Chung, which are close to the Pearl River Delta (PRD) region and affected by pollutants transported from there. However, a significant difference in mean values was observed for other stations. The summary of the one-way ANOVA test for other seasons is given in Table 3.
Figure 2 shows a decreasing trend in monthly mean PM2.5 concentrations from winter to summer and increasing trend from summer to winter at all stations, irrespective of land cover type and local anthropogenic activities. It has been observed that there are clear seasonal changes due to the overwhelming impacts of regional sources (from the PRD region of Mainland China) in winter and the dominance of local anthropogenic emissions in summer. The similar seasonal pattern in PM2.5 concentrations that we observe in this study between urban/suburban and rural areas suggests the dominance of seasonal changes.
Results show that the magnitude of variations in monthly mean PM2.5 concentrations over the remote rural area (Tap Mun: Yellow box) is the same as over the suburban and residential area (Tung Chung) from March to August. Overall, a decreasing trend in PM2.5 concentrations is observed from January to June at all air quality monitoring stations, while an increasing trend is observed from June to December, and these results indicate improved air quality conditions during the month of June. Monthly mean PM2.5 concentrations show a unimodal distribution during the study years 2007 and 2008, as was also observed by Gupta et al. [38] for the year 2002 in Hong Kong. The PM2.5 concentrations at Central (urban) air quality monitoring station are high during spring and summer compared to the other stations, which may be attributed to high vehicle emissions, as well as other substantial anthropogenic activities. However, during autumn and winter high PM2.5 levels are observed at all stations, and significantly higher levels are observed at Tung Chung and Yuen Long in December, probably explained by regional pollutant sources, since they are close to the Chinese Mainland.
In addition to daily and monthly mean temporal variations, the four-year mean PM2.5 concentrations were plotted with respect to the station, year, and season (Figure 3). Figure 3a shows that Central is the most polluted area (45.34 μg·m−3), which may be due to both regional as well as local vehicle emissions, followed by Yuen Long (42.28 μg·m−3), which is subject to pollution transport from the neighboring PRD region. Tap Mun (36.29 μg·m−3) is the least polluted site, although it may be affected by regional pollutants, as well as by emissions from ocean-going vessels (OGV). However, overall, the differences were not between the stations, which again suggests regional air pollution impacts Hong Kong’s air quality. Figure 3b shows that the highest and lowest PM2.5 concentrations were observed in 2005 and 2008, respectively. However, these differences are not significant, suggesting that Hong Kong’s air quality conditions did not change during the study period. Figure 3c shows significant differences in the four-year mean PM2.5 concentrations; the highest concentrations were observed in winter (52.68 μg·m−3) and the lowest concentrations were observed in summer (22.46 μg·m−3). Overall, mean PM2.5 concentrations over the four-years, with respect to (i) stations, (ii) year (2005 to 2008), and (iii) seasons (except for summer), were greater than the Hong Kong AQO (35 μg·m−3) which indicates poor air quality conditions in Hong Kong.
Figure 4 shows the four-year mean PM2.5 concentrations plotted against days (weekdays and weekends) with respect to each air quality monitoring station (Figure 4a) and the combined mean value for all stations (Figure 4b). Similar to the previous analyses, significantly higher PM2.5 levels were observed at Central air quality monitoring station, probably mainly due to local vehicle emissions in this congested and high-rise urban site. It is notable that concentrations at Tap Mun rural station are lower, from 3 to 9 μg·m−3, than at other stations but show a similar trend, which must be attributed to regional emission sources, as Tap Mun is a remote rural island in the northeast of Hong Kong, having no local emissions. For all stations combined by week (Figure 4b), minor variations are evident between different days of the week, as PM2.5 concentrations varied from 39.14 μg·m−3 on Wednesdays to 40.3 μg·m−3 on Fridays, and all days were greater than the Hong Kong AQO (35 μg·m−3). These results suggest that Hong Kong faces the same high levels of air pollution during both weekdays and weekends.
To investigate hourly pollution patterns in Hong Kong, the four-year mean PM2.5 concentrations were filtered by hours between 00:00 and 23:00. Figure 5a shows the bimodal distribution for PM2.5 concentrations for all stations except Tap Mun, where a unimodal distribution was observed. Two peaks were observed during office hour times; i.e., the first peak was at 08:00 and the second peak at 18:00, and those peaks are most prominent at Central air quality monitoring station. These peaks also indicate the contribution of local pollutants to Hong Kong’s air quality conditions. Only a single peak was observed (at 10:00) at Tap Mun air quality station, as Tap Mun does not have local automobile pollution. Figure 5b shows an overall pattern of PM2.5 concentrations in Hong Kong for each hour. The highest and lowest PM2.5 concentrations were observed at 18:00 (44.83 μg·m−3) and 08:00 (33.09 μg·m−3), respectively. Figure 5 shows that only for the hours 02:00, 03:00, and 04:00, were PM2.5 concentrations less than the Hong Kong AQO (35 μg·m−3), whereas the concentrations for other hours were greater than the Hong Kong AQO.

Relationship with Meteorological Parameters

For a better understanding of PM2.5 variability, the relationships between PM2.5 and meteorological parameters, such as TEMP, RH, WS, and WD were analyzed at Central, Tsuen Wan, Tung Chung, Yuen Long, and Tap Mun air quality monitoring stations from March 2007 to February 2009 (hereafter from 2007 to 2008). The meteorological parameters were obtained from the Hong Kong Observatory, and RH data were not available at the remote rural Tap Mun station during the study period. Therefore, the relationship between PM2.5 and meteorological parameters were established at Tap Mun area without using RH data.
The daily mean TEMP, RH, WS, and WD were found to be negatively correlated with daily mean PM2.5 concentrations for all air quality monitoring stations when the four seasons are combined together (Table 4). Positive values of the Pearson’s correlations are observed for individual seasons particularly during the summer, autumn and winter seasons for some variables, such as TEMP and WD. The relationship between PM2.5 concentrations and all the meteorological parameters are established using the multiple linear regression (MLR) statistical methods by combining all the seasonal data, and results show good agreement between them, with correlation coefficients (r) of 0.67 (Yuen Long), 0.65 (Tung Chung), 0.56 (Tsuen Wan), 0.54 (Central), and 0.54 (Tap Mun) observed at respective air quality monitoring stations. These results suggest that some parameters, which could be expected to explain more variations in PM2.5, such as aerosol optical properties, are required, in order to improve the PM2.5 estimation. Interestingly, the values of r significantly increased when regression analysis was applied only to the spring and summer data. For example, the meteorological parameters can explain 80% of the variability in daily mean PM2.5 concentrations at Yuen Long (Equation (1)), 77% at Tung Chung (Equation (2)), 72% at Central (Equation (3)), 71% at Tsuen Wan (Equation (4)), and 67% at Tap Mun (Equation (5)), and achieve an overall variability of 70% when data from all the stations are combined (Equation (6)). However, in autumn and winter, the meteorological parameters can explain only 50% of the variability in PM2.5 concentrations at Yuen Long, 40% at Tung Chung, 39% at Central, 35% at Tsuen Wan, and 21% at Tap Mun air quality monitoring stations (equations for autumns and winters are not given here due to weak correlations compared to spring and summer). The results show a weak correlation between PM2.5 concentrations and meteorological parameters during the winter season in Hong Kong, which is caused by the overwhelming regional impact of long-distance transport from the PRD, on a large spatial scale. This is different for studies reported for Kolkata, India [44], and for Hanoi, Vietnam [39] during the winter season. These findings suggest that the relationship between PM2.5 and meteorological parameters can vary from region to region due to local prevailing meteorological conditions. The above findings are reasonable, as the meteorological parameters used for regression analysis actually reflect the weather conditions and atmospheric stability when the PM2.5 monitoring was done, both of which are critical influential factors of the spatial distribution of aerosols. Moreover, the seasonal variations of the local weather system of Hong Kong and its impact on PM2.5 are well reflected by the regression models because the temporal patterns in the meteorological parameters were introduced. This also provides useful knowledge on how to properly adopt meteorological data as an information source for local air quality investigations. In summary, it can be concluded from the analyses that TEMP, RH, WS, and WD are practically useful indicators of variations in PM2.5 concentrations over urban, suburban, and rural areas of Hong Kong for spring and summer but are inappropriate for autumn and winter.
[ P M 2.5 ] = 198 2.30   [ T E M P ] 1.08   [ R H ] 10.9   [ W S ]                   [ Station :   Yuen   Long   ( urban ) ,   r   =   0.80 ,   Time   period   =   2007 2008   ( spring   and   summer ) ]
[ P M 2.5 ] = 183 2.92   [ T E M P ] 0.89   [ R H ] 3.27   [ W S ]         [ Station :   Tung   Chung   ( suburban ) ,   r   =   0.77 ,   Time   period   =   2007 2008   ( spring   and   summer ) ]
[ P M 2.5 ] = 163 2.37   [ T E M P ] 0.76   [ R H ]   2.46   [ W S ]                   [ Station :   Central   ( urban ) ,   r   =   0.72 ,   Time   period   =   2007 2008   ( spring   and   summer ) ]
[ P M 2.5 ] = 123 1.73   [ T E M P ] 0.60   [ R H ] 0.80   [ W S ]             [ Station :   Tsuen   Wan   ( urban ) ,   r   =   0.71 ,   Time   period   =   2007 2008   ( spring   and   summer ) ]
[ P M 2.5 ] = 95.2 2.63   [ T E M P ] 1.22   [ W S ]               [ Station :   Tap   Mun   ( rural ) ,   r   =   0.67 ,   Time   period   =   2007 2008   ( spring   and   summer ) ]
[ P M 2.5 ] = 151 2.36 [ T E M P ] 0.68   [ R H ] 2.06   [ W S ]                 [ Station :   all   ( five ) ,   r   =   0.70 ,   Time   period   =   2007 2008   ( spring   and   summer ) ]
A previous study conducted during 1983–1992 [55] showed that higher values of air pollution in Hong Kong were associated with surface WD between 225° and 30°, which were attributed to power stations, industry, and motor vehicles. In the current study, hourly PM2.5 concentrations plotted as against hourly WD (Figure 6) showed similar results in terms of the influence of wind direction. Figure 5 shows that only 32.76% (WD between 230–40°) of air masses were arriving from the PRD region, while 67.24% were arriving from the open ocean (WD between 45–225°). However, due to the Coriolis effect on the long-distance trajectory, many of the winds of the ocean originated on the mainland. These results suggest that the air quality of Hong Kong was influenced by air masses arriving from PRD and the Chinese mainland, although approaching Hong Kong from the ocean side. In recent years, ocean-going vessels (OGV) have become the biggest source of air pollution in Hong Kong; therefore, air masses arriving from the ocean may also be affected by OGV emissions. To further investigate the PM2.5 contribution to Hong Kong’s air quality, PM2.5 was divided into three different groups; i.e., PM2.5 ≤ 35, 35 < PM2.5 ≤ 75, and PM2.5 > 75, for the both WDs (45–225°and 230–40°) (Table 5). For PM2.5 ≤ 35 and 35 < PM2.5 ≤ 75, more measurements were available for air masses arriving from the ocean side, and for PM2.5 > 75 more measurements were available for air masses arriving from the land. These results suggest that air masses arriving from both the land and ocean influence the poor air quality conditions in Hong Kong.

5. Conclusions

The prime objective of this study was to investigate the characteristics of fine particulate matter (PM2.5) with respect to meteorological parameters over urban, suburban, and rural areas of Hong Kong. For this purpose, PM2.5 data and meteorological parameters were obtained from the air quality monitoring stations and Hong Kong Observatory, respectively. The results showed a similar pattern of temporal variations in PM2.5 concentrations over urban, suburban, and rural areas of Hong Kong, which suggest a significant contribution of regional aerosol emissions in Hong Kong’s air quality, and which are dominant in the winter season [56]. The temporal analyses showed poor air quality conditions during winter and good air quality conditions during summer. In spring and summer, PM2.5 concentrations were significantly higher over the Central (city area, commercial area, and urban populated area) air quality station compared to the other stations, which are probably caused by local vehicle emissions. However, in autumn and winter, higher levels of PM2.5 concentrations were observed over both the Tung Chung suburban and residential area, and the Yuen Long urban and residential area, which is likely due to the contribution of regional pollutants, since these stations are close to the Chinese Mainland. It was also found that air masses arriving from the ocean, also affect Hong Kong’s air quality. These results suggest that the long-distance transport of air pollutants from the PRD region, as well as emissions from the OGV, have a great influence on Hong Kong’s air quality. This must be addressed by regional-scale collaboration on air quality management. Results also showed that meteorological parameters are good indicators of variations in PM2.5 concentrations, and can be used for the prediction of PM2.5 concentrations, especially during spring and summer.

Author Contributions

Conceptualization, M.B., and J.E.N.; methodology, M.B., J.E.N., Y.S., K.R.K, H.C.H, and M.P.B.; software, M.B., L.W., Z.Q., and M.N.; validation, M.B., M.N., Z.Q., and U.M.; formal analysis, M.B., Y.S., K.R.K., and S.L.; investigation, M.B., J.E.N., and M.P.B.; resources, M.B., Y.S., L.W., K.R.K, H.C.H, M.N., U.M., Z.Q., K.M.K., and S.L.; data curation, L.W., M.B. and M.N.; writing—original draft preparation, M.B.; writing—review and editing, M.B., Y.S., L.W., K.R.K, H.C.H, and J.E.N.; visualization, M.B., L.W., and Z.Q.; supervision, J.E.N.; project administration, M.B.; funding acquisition, M.B., Z.Q., K.M.K., and Y.S.

Funding

This research is supported by the Special Project of Jiangsu Distinguished Professor (1421061801003), the Startup Foundation for Introduction Talent of NUIST (2017r107), the National Key Research and Development Program of China (2016YFC1400901), the Jiangsu Provincial Program for Marine Science and Technology Innovation (HY2017-5), the General Research Fund (GRF) number 14610717 from the Research Grants Council (RGC) of Hong Kong, and the Deanship of Scientific Research, King Khalid University, Kingdom of Saudi Arabia (RGP2/54/40). Additional support came from the New Mexico State University College of Agriculture Consumer and Environmental Sciences’ Agricultural Experiment Station.

Acknowledgments

The authors would like to acknowledge the Hong Kong Environmental Protection Department (EPD) for air quality data and Hong Kong Observatory for meteorological data.

Conflicts of Interest

The authors declare no conflict of interest. The funders had no role in the design of the study; in the collection, analyses, or interpretation of data; in the writing of the manuscript, or in the decision to publish the results.

References

  1. Zhang, Y.L.; Cao, F. Fine particulate matter (PM2.5) in China at a city level. Sci. Rep. 2015, 5, 14884. [Google Scholar] [CrossRef] [PubMed]
  2. Cruz, C.N.; Pandis, S.N. A study of the ability of pure secondary organic aerosol to act as cloud condensation nuclei. Atmos. Environ. 1997, 31, 2205–2214. [Google Scholar] [CrossRef]
  3. Kaufman, Y.J.; Tanré, D.; Boucher, O. A satellite view of aerosols in the climate system. Nature 2002, 419, 215–223. [Google Scholar] [CrossRef] [PubMed]
  4. Sun, J.; Ariya, P. Atmospheric organic and bio-aerosols as cloud condensation nuclei (CCN): A review. Atmos. Environ. 2006, 40, 795–820. [Google Scholar] [CrossRef]
  5. Dubovik, O.; Holben, B.; Eck, T.F.; Smirnov, A.; Kaufman, Y.J.; King, M.D.; Tanré, D.; Slutsker, I. Variability of Absorption and Optical Properties of Key Aerosol Types Observed in Worldwide Locations. J. Atmos. Sci. 2002, 59, 590–608. [Google Scholar] [CrossRef]
  6. Wallace, J.; Hobbs, P. Atmospheric Science: An Introductory Survey; Academic Press: Cambridge, MA, USA, 2006; p. 504. [Google Scholar]
  7. El-Fadel, M.; Hashisho, Z. Vehicular Emissions in Roadway Tunnels: A Critical Review. Crit. Rev. Environ. Sci. Technol. 2001, 31, 125–174. [Google Scholar] [CrossRef]
  8. Ho, K.F.; Cao, J.J.; Lee, S.C.; Chan, C.K. Source apportionment of PM2.5 in urban area of Hong Kong. J. Hazard. Mater. 2006, 138, 73–85. [Google Scholar] [CrossRef]
  9. Fraser, M.P.; Yue, Z.W.; Buzcu, B. Source apportionment of fine particulate matter in Houston, TX, using organic molecular markers. Atmos. Environ. 2003, 37, 2117–2123. [Google Scholar] [CrossRef]
  10. Nolte, C.G.; Schauer, J.J.; Cass, G.R.; Simoneit, B.R.T. Trimethylsilyl Derivatives of Organic Compounds in Source Samples and in Atmospheric Fine Particulate Matter. Environ. Sci. Technol. 2002, 36, 4273–4281. [Google Scholar] [CrossRef]
  11. Mysliwiec, M.J.; Kleeman, M.J. Source Apportionment of Secondary Airborne Particulate Matter in a Polluted Atmosphere. Environ. Sci. Technol. 2002, 36, 5376–5384. [Google Scholar] [CrossRef]
  12. Chung, C.E.; Ramanathan, V.; Kim, D.; Podgorny, I.A. Global anthropogenic aerosol direct forcing derived from satellite and ground-based observations. J. Geophys. Res. 2005, 110. [Google Scholar] [CrossRef]
  13. Wang, J.; Zhao, B.; Wang, S.; Yang, F.; Xing, J.; Morawska, L.; Ding, A.; Kulmala, M.; Kerminen, V.M.; Kujansuu, J.; et al. Particulate matter pollution over China and the effects of control policies. Sci. Total Environ. 2017, 584–585, 426–447. [Google Scholar] [CrossRef] [PubMed]
  14. Wang, X.; Dickinson, R.E.; Su, L.; Zhou, C.; Wang, K. PM2.5 Pollution in China and How It Has Been Exacerbated by Terrain and Meteorological Conditions. Bull. Am. Meteorol. Soc. 2018, 99, 105–119. [Google Scholar] [CrossRef]
  15. Mahajan, S.; Chen, L.J.; Tsai, T.C. Short-Term PM2.5 Forecasting Using Exponential Smoothing Method: A Comparative Analysis. Sensors 2018, 18, 3223. [Google Scholar] [CrossRef] [PubMed]
  16. Hsu, C.-H.; Cheng, F.-Y. Classification of weather patterns to study the influence of meteorological characteristics on PM2.5 concentrations in Yunlin County, Taiwan. Atmos. Environ. 2016, 144, 397–408. [Google Scholar] [CrossRef]
  17. Pope, C.A.; Ezzati, M.; Dockery, D.W. Fine-particulate air pollution and life expectancy in the United States. N. Engl. J. Med. 2009, 360, 376–386. [Google Scholar] [CrossRef] [PubMed]
  18. Pope, C.A.; Dockery, D.W. Health effects of fine particulate air pollution: lines that connect. J. Air Waste Manag. Assoc. 2006, 56, 709–742. [Google Scholar] [CrossRef]
  19. Ward, D.J.; Ayres, J.G. Particulate air pollution and panel studies in children: A systematic review. Occup. Environ. Med. 2004, 61, e13. [Google Scholar] [CrossRef]
  20. Kulshrestha, A.; Bisht, D.S.; Masih, J.; Massey, D.; Tiwari, S.; Taneja, A. Chemical characterization of water-soluble aerosols in different residential environments of semi aridregion of India. J. Atmos. Chem. 2010, 62, 121–138. [Google Scholar] [CrossRef]
  21. Kappos, A.D.; Bruckmann, P.; Eikmann, T.; Englert, N.; Heinrich, U.; Höppe, P.; Koch, E.; Krause, G.H.M.; Kreyling, W.G.; Rauchfuss, K.; et al. Health effects of particles in ambient air. Int. J. Hyg. Environ. Health 2004, 207, 399–407. [Google Scholar] [CrossRef]
  22. Götschi, T.; Heinrich, J.; Sunyer, J.; Künzli, N. Long-term effects of ambient air pollution on lung function: A review. Epidemiology 2008, 19, 690–701. [Google Scholar] [CrossRef]
  23. Fang, G.-C.; Chang, C.-N.; Wu, Y.-S.; Fu, P.P.-C.; Yang, C.-J.; Chen, C.-D.; Chang, S.-C. Ambient suspended particulate matters and related chemical species study in central Taiwan, Taichung during 1998–2001. Atmos. Environ. 2002, 36, 1921–1928. [Google Scholar] [CrossRef]
  24. Englert, N. Fine particles and human health—A review of epidemiological studies. Toxicol. Lett. 2004, 149, 235–242. [Google Scholar] [CrossRef] [PubMed]
  25. Gent, J.F.; Koutrakis, P.; Belanger, K.; Triche, E.; Holford, T.R.; Bracken, M.B.; Leaderer, B.P. Symptoms and medication use in children with asthma and traffic-related sources of fine particle pollution. Environ. Health Perspect. 2009, 117, 1168–1174. [Google Scholar] [CrossRef] [PubMed]
  26. Bell, M.L.; Ebisu, K.; Belanger, K. Ambient air pollution and low birth weight in Connecticut and Massachusetts. Environ. Health Perspect. 2007, 115, 1118–1124. [Google Scholar] [CrossRef] [PubMed]
  27. Dominici, F.; Peng, R.D.; Bell, M.L.; Pham, L.; McDermott, A.; Zeger, S.L.; Samet, J.M. Fine particulate air pollution and hospital admission for cardiovascular and respiratory diseases. JAMA 2006, 295, 1127–1134. [Google Scholar] [CrossRef]
  28. Pope, C.A.; Burnett, R.T.; Thun, M.J.; Calle, E.E.; Krewski, D.; Ito, K.; Thurston, G.D. Lung cancer, cardiopulmonary mortality, and long-term exposure to fine particulate air pollution. JAMA 2002, 287, 1132–1141. [Google Scholar] [CrossRef]
  29. Ko, F.W.; Tam, W.; Wong, T.W.; Lai, C.K.; Wong, G.W.; Leung, T.F.; Ng, S.S.; Hui, D.S. Effects of air pollution on asthma hospitalization rates in different age groups in Hong Kong. Clin. Exp. Allergy 2007, 37, 1312–1319. [Google Scholar] [CrossRef]
  30. Wong, T.W.; Tam, W.S.; Yu, T.S.; Wong, A.H.S. Associations between daily mortalities from respiratory and cardiovascular diseases and air pollution in Hong Kong, China. Occup. Environ. Med. 2002, 59, 30–35. [Google Scholar] [CrossRef] [Green Version]
  31. Chau, C.K.; Tu, E.Y.; Chan, D.W.T.; Burnett, J. Estimating the total exposure to air pollutants for different population age groups in Hong Kong. Environ. Int. 2002, 27, 617–630. [Google Scholar] [CrossRef]
  32. Al-Saadi, J.; Szykman, J.; Pierce, R.B.; Kittaka, C.; Neil, D.; Chu, D.A.; Remer, L.; Gumley, L.; Prins, E.; Weinstock, L.; et al. Improving National Air Quality Forecasts with Satellite Aerosol Observations. Bull. Am. Meteorol. Soc. 2005, 86, 1249–1261. [Google Scholar] [CrossRef]
  33. Gomišček, B.; Hauck, H.; Stopper, S.; Preining, O. Spatial and temporal variations of PM1, PM2.5, PM10 and particle number concentration during the AUPHEP—Project. Atmos. Environ. 2004, 38, 3917–3934. [Google Scholar] [CrossRef]
  34. Zhao, X.; Zhang, X.; Xu, X.; Xu, J.; Meng, W.; Pu, W. Seasonal and diurnal variations of ambient PM2.5 concentration in urban and rural environments in Beijing. Atmos. Environ. 2009, 43, 2893–2900. [Google Scholar] [CrossRef]
  35. Dawson, J.P.; Adams, P.J.; Pandis, S.N. Sensitivity of PM2.5 to climate in the Eastern US: A modeling case study. Atmos. Chem. Phys. 2007, 7, 4295–4309. [Google Scholar] [CrossRef]
  36. DeGaetano, A. Temporal, spatial and meteorological variations in hourly PM2.5 concentration extremes in New York City. Atmos. Environ. 2004, 38, 1547–1558. [Google Scholar] [CrossRef]
  37. Elminir, H.K. Dependence of urban air pollutants on meteorology. Sci. Total Environ. 2005, 350, 225–237. [Google Scholar] [CrossRef]
  38. Gupta, P.; Christopher, S.A.; Wang, J.; Gehrig, R.; Lee, Y.; Kumar, N. Satellite remote sensing of particulate matter and air quality assessment over global cities. Atmos. Environ. 2006, 40, 5880–5892. [Google Scholar] [CrossRef]
  39. Hien, P.D.; Bac, V.T.; Tham, H.C.; Nhan, D.D.; Vinh, L.D. Influence of meteorological conditions on PM2.5 and PM2.5–10 concentrations during the monsoon season in Hanoi, Vietnam: Asia. Atmos. Environ. 2002, 36, 3473–3484. [Google Scholar] [CrossRef]
  40. Tran, H.N.Q.; Mölders, N. Investigations on meteorological conditions for elevated PM2.5 in Fairbanks, Alaska. Atmos. Res. 2011, 99, 39–49. [Google Scholar] [CrossRef]
  41. Wang, W.; Primbs, T.; Tao, S.; Simonich, S.L.M. Atmospheric Particulate Matter Pollution during the 2008 Beijing Olympics. Environ. Sci. Technol. 2009, 43, 5314–5320. [Google Scholar] [CrossRef] [Green Version]
  42. Wise, E.; Comrie, A. Meteorologically adjusted urban air quality trends in the Southwestern United States. Atmos. Environ. 2005, 39, 2969–2980. [Google Scholar] [CrossRef]
  43. Donateo, A.; Contini, D.; Belosi, F. Real time measurements of PM2.5 concentrations and vertical turbulent fluxes using an optical detector. Atmos. Environ. 2006, 40, 1346–1360. [Google Scholar] [CrossRef]
  44. Gupta, A.K.; Nag, S.; Mukhopadhyay, U.K. Characterisation of PM10, PM2.5 and benzene soluble organic fraction of particulate matter in an urban area of Kolkata, India. Environ. Monit. Assess. 2006, 115, 205–222. [Google Scholar] [CrossRef] [PubMed]
  45. Cao, J.J.; Lee, S.C.; Ho, K.F.; Zou, S.C.; Fung, K.; Li, Y.; Watson, J.G.; Chow, J.C. Spatial and seasonal variations of atmospheric organic carbon and elemental carbon in Pearl River Delta Region, China. Atmos. Environ. 2004, 38, 4447–4456. [Google Scholar] [CrossRef]
  46. Louie, P.; Watson, J.; Chow, J.; Chen, A.; Sin, D.; Lau, A. Seasonal characteristics and regional transport of PM in Hong Kong. Atmos. Environ. 2005. [Google Scholar] [CrossRef]
  47. Lee, S.C.; Cheng, Y.; Ho, K.F.; Cao, J.J.; Louie, P.K.K.; Chow, J.C.; Watson, J.G. PM1.0 and PM2.5 Characteristics in the Roadside Environment of Hong Kong. Aerosol Sci. Technol. 2006, 40, 157–165. [Google Scholar] [CrossRef]
  48. Shi, Y.; Ho, H.C.; Xu, Y.; Ng, E. Improving satellite aerosol optical Depth-PM2.5 correlations using land use regression with microscale geographic predictors in a high-density urban context. Atmos. Environ. 2018, 190, 23–34. [Google Scholar] [CrossRef]
  49. Shi, W.; Wong, M.S.; Wang, J.; Zhao, Y. Analysis of airborne particulate matter (PM2.5) over Hong Kong using remote sensing and GIS. Sensors 2012, 12, 6825–6836. [Google Scholar] [CrossRef]
  50. CSDHK. Available online: http://www.censtatd.gov.hk/FileManager/EN/Content_803/population.pdf (accessed on 6 June 2019).
  51. Bilal, M.; Nichol, J.; Spak, S. A New Approach for Estimation of Fine Particulate Concentrations Using Satellite Aerosol Optical Depth and Binning of Meteorological Variables. Aerosol Air Qual. Res. 2017, 11, 356–367. [Google Scholar] [CrossRef]
  52. Chan, C.K.; Yao, X. Air pollution in mega cities in China. Atmos. Environ. 2008, 42, 1–42. [Google Scholar] [CrossRef]
  53. EPD. Agreement No CE 57/2006(EP) Review of Air Quality Objectives and Development of a Long Term Air Quality Strategy for Hong Kong-Feasibility Study; Hong Kong Protection Department: Hong Kong, China, 2006.
  54. Wei, Y.; Li, J.; Wang, Z.-F.; Chen, H.-S.; Wu, Q.-Z.; Li, J.-J.; Wang, Y.-L.; Wang, W. Trends of surface PM2.5 over Beijing–Tianjin–Hebei in 2013–2015 and their causes: emission controls vs. meteorological conditions. Atmos. Ocean. Sci. Lett. 2017, 10, 276–283. [Google Scholar] [CrossRef]
  55. Cheng, S.; Lam, K.-C. An analysis of winds affecting air pollution concentrations in Hong Kong. Atmos. Environ. 1998, 32, 2559–2567. [Google Scholar] [CrossRef]
  56. Lau, A.K.H.; Lo, A.; Gray, J. Relative Significance of Local vs. Regional Sources: Hong Kong’s Air Pollution; Insitute for the Environment, The Hong Kong University of Science and Technology: Hong Kong, China, 2007. [Google Scholar]
Figure 1. Study area and locations of ground-based air quality monitoring stations (stars) and the Hong Kong Observatory’s climate stations (circles) in the hilly and complex terrain of Hong Kong.
Atmosphere 10 00496 g001
Figure 2. Box plots of the monthly mean of PM2.5 concentrations from 2005 to 2008 at five air quality monitoring stations (Central, Tsuen Wan, Tung Chung, Yuen Long, and Tap Mun). Where, ‘×’ represents the outliers.
Atmosphere 10 00496 g002
Figure 3. Four-year (2005–2008) mean PM2.5 concentrations with respect to (a) air quality monitoring stations, (b) year, and (c) season.
Atmosphere 10 00496 g003
Figure 4. Four-year (2005–2008) mean PM2.5 concentrations for weekdays and weekends with respect to air quality monitoring stations (a) and when all the stations combined together (b).
Atmosphere 10 00496 g004
Figure 5. Four-years (2005–2008) of mean PM2.5 concentrations for daily hours with respect to air quality monitoring stations (a) and when all the stations are combined (b).
Atmosphere 10 00496 g005
Figure 6. Hourly PM2.5 concentrations from all air quality monitoring stations including Central, Tap Mun, Tsuen Wan, Yuen Long, and Tung Chung as a function of corresponding hourly surface wind direction in Hong Kong (2007–2008).
Atmosphere 10 00496 g006
Table 1. Description of air quality monitoring sites used in this study.
1 AQMSDescriptionLatitude (dd)Longitude (dd)2 Elevation3 BVD
Centralcity area, commercial area, and urban populated area22.282114.1584.50.111
Tsuen Wancity area, commercial area, urban populated, and residential area22.372114.115170.088
Tung Chungsuburban and residential area22.289113.94427.50.014
Yuen Longurban and residential area22.447114.039250.032
Tap Munremote rural area22.471114.361110.000
1 Air quality monitoring stations. 2 Evelation of the air quality monitoring stations above ground. 3 Building volume destiny (BVD) within 1 km radius. Note: BVD is a quantitative measure of building density in per unit area. BVD was used here to describe the selected sites because it has been used in the development of Hong Kong’s urban climatic map (https://www.pland.gov.hk/pland_en/p_study/prog_s/ucmapweb/ucmap_project/content/reports/final_report.pdf).
Table 2. The total number of exceedances of daily mean fine particulate matter (PM2.5) mass concentrations in different seasons from 2005 to 2008.
Air Quality Monitoring StationAQO(HK)/AQS(WHO)Number of Exceedances (HK/WHO)
SpringSummerAutumnWinter
Central75 μg·m−3/25 μg·m−30/920/772/902/92
Tung Chung0/720/121/856/92
Tap Mun0/740/130/851/91
Tsuen Wan01/830/262/ 872/92
Yuen Long0/790/212/885/92
Table 3. Seasonal statistics of PM2.5 mass concentrations observed at the air quality monitoring stations in Hong Kong from 2005 to 2008 using the one-way ANOVA test. N corresponds to the number of hourly observations in a season.
Air Quality Monitoring StationsPM2.5 Concentrations μg·m−3)1 Grouping
N2 MeanStDev
Time Period: Spring (2005–2008)
Central680045.7722.24A
Tsuen Wan38.6321.71 B
Yuen Long38.3922.78 B
Tung Chung34.5524.97 C
Tap Mun34.5520.97 C
Time Period: Summer (2005–2008)
Central678131.4820.06A
Tsuen Wan24.1018.19 B
Yuen Long23.1518.89 C
Tap Mun18.2018.88 D
Tung Chung17.9218.16 D
Time Period: Autumn (2005–2008)
Yuen Long686351.3226.87A
Central51.2726.11A
Tung Chung48.2728.99 B
Tsuen Wan47.3925.64 B
Tap Mun43.3724.37 C
Time Period: Winter (2005–2008)
Yuen Long869854.7728.04A
Tung Chung54.0031.76A
Central51.8824.80 B
Tsuen Wan49.7925.79 C
Tap Mun47.4824.19 D
1 Grouping information using the Tukey method in one-way ANOVA test; 2 mean values that do not share a letter (A, B, C, and D) are significantly different.
Table 4. Pearson’s correlation between daily mean PM2.5 and meteorological parameters for the years 2007 and 2008. Bold text represents statistically more significant correlations for p-values < 0.005.
1 AQMSTime PeriodMeteorological Parameters
TEMPRHWDWS
2 r3 PrPrPrP
CentralSpring−0.260.011−0.350.001−0.160.117−0.030.810
Summer0.250.018−0.220.037−0.040.709−0.010.894
Autumn0.100.366−0.260.0120.320.002−0.400.000
Winter0.330.001−0.300.0040.010.898−0.160.120
2007–2008−0.350.000−0.450.000−0.300.000−0.060.274
Tsuen WanSpring−0.200.058−0.610.000−0.290.005−0.320.002
Summer0.360.000−0.230.0300.180.080−0.120.251
Autumn−0.050.655−0.130.2360.070.493−0.180.091
Winter0.170.107−0.330.001−0.090.399−0.370.000
2007–2008−0.420.000−0.470.000−0.400.000−0.130.012
Tung ChungSpring−0.420.000−0.330.001−0.220.039−0.340.001
Summer0.320.002−0.270.0090.060.581−0.140.185
Autumn−0.120.242−0.180.0860.010.921−0.190.065
Winter0.240.021−0.410.0000.190.077−0.290.006
2007–2008−0.500.000−0.490.000−0.360.000−0.300.000
Yuen LongSpring−0.360.000−0.400.000−0.040.676−0.330.001
Summer0.310.002−0.290.0050.090.395−0.360.000
Autumn−0.060.565−0.290.0060.190.073−0.150.168
Winter0.280.008−0.350.0010.010.909−0.260.013
2007–2008−0.430.000−0.560.000−0.240.000−0.170.001
Tap MunSpring−0.380.00--0.070.5120.001.00
Summer0.250.032--0.190.094−0.060.599
Autumn−0.300.010--0.300.0120.260.31
Winter0.300.010--0.090.448−0.080.500
2007–2008−0.530.000--0.320.0000.330.000
1 AQMS = Air Quality Monitoring Stations; 2 r = Pearson’s correlation; 3 P = p-value.
Table 5. Statistics of hourly PM2.5 concentrations from all air quality monitoring stations, including Central, Tap Mun, Tsuen Wan, Yuen Long, and Tung Chung, as a function of corresponding hourly surface wind direction in Hong Kong (2007–2008).
Wind DirectionPM2.5 Concentrations
PM2.5 ≤ 3535 < PM2.5 ≤ 75PM2.5 > 75
NMeanNMeanNMean
45–225°2594320.501716050.95269092.47
230–40°919521.75966852.50344597.90

