Expanding the Theory of Planned Behaviour to Reveal Urban Residents’ Pro-Environment Travel Behaviour


School of Traffic and Transportation Engineering, Central South University, Changsha 410075, China
*
Authors to whom correspondence should be addressed.
Atmosphere 2019, 10(8), 467; https://doi.org/10.3390/atmos10080467
Submission received: 29 June 2019
/
Revised: 11 August 2019
/
Accepted: 12 August 2019
/
Published: 15 August 2019
(This article belongs to the Special Issue Transport Emissions and the Atmosphere)
Abstract
:Exploring the mechanism that influences the choice of urban public travel mode is an important policy research topic that can promote urban residents’ pro-environment travel (PET) behaviour and relieve the pressure on urban traffic and environmental problems. By expanding the theory of planned behaviour by considering the effects of the quality of public transport service and individual behaviour, this paper establishes a mixed PET behaviour model. Grounded theory is used to analyse data obtained from in-depth interviews, with the aim of determining the relationships among different attributes of the quality of public transport service and PET. An empirical examination in the form of a questionnaire was conducted in Changsha, China, to obtain the intensity and mechanism of various factors influencing pro-environment behaviour decision-making. The results reveal three new pieces of information. First, the influence of many psychological variables (except subjective norms) is consistent with the prediction results of the theory of planned behaviour (TPB), and the predictions of the model are accurate. More specifically, intention (0.535) and habit (0.354) are key factors in PET behaviour, while attitude (0.527) has the most significant effect on intention towards PET behaviour. Second, the perceived service quality of public transport has a direct and significant impact on intention towards PET behaviour. Satisfaction with public transport service quality exerts a mediating effect on perceived service quality and PET behaviour. More specifically, operation and management (0.808) and vehicle environment (0.809) have the most important influence on intention towards PET behaviour. Last but not least, the extent of the influence of PET behaviour varies based on travellers’ demographic characteristics. The driving age, income and ownership of private cars show the greatest impact. The perceived service quality of public transport and travellers’ social and economic characteristics all play roles in the psychology of travel decisions, and are associated with PET behaviour on several distinct levels. From the perspectives of passenger psychology, public transport service quality and personal attributes of passengers, this paper provides a scientific basis for decision-making in transportation systems and the formulation of traffic intervention strategies to promote voluntary public reductions in carbon-intensive travel behaviour.
1. Introduction
Pro-environment behaviour means reducing the negative impacts of individual behaviour on nature and human society to a minimum [1]. This concept is used to define pro-environment travel behaviour, which means voluntarily choosing low-carbon travel, including public transport (PT), non-motorised traffic and walking, based on an attitude of caring about the environment and a willingness to sacrifice some degree of convenience, comfort and time. According to a report from the International Energy Agency, a quarter of the total emissions of CO2 comes from traffic, and by 2050, global road traffic emissions are likely to quadruple. As a consequence, reducing carbon-intensive travel patterns, especially the use of private cars, and at the same time increasing the ratio of PT have become paramount and challenging tasks in mitigating climate change and tackling urban traffic problems [2]. In China, urban roads are becoming increasingly crowded, and the service quality of PT has seen a rapid downturn with the explosive growth of private cars. As a result, people have gradually abandoned PT, causing a vicious circle of urban traffic development [3]. Many governments have attempted to mitigate the trend of travelling by private cars through methods such as limiting travel and the purchase of cars, but to no avail. When it comes to the traveller’s final decision on traffic behaviour, such as choosing to give up carbon-intensive modes of travel and use more environmentally friendly PT, there are many factors that make a difference, and the quality of the PT service and personal psychological factors are especially important [4].
Research has shown that when formulating intervention policies, improving the service quality of PT and understanding the psychological factors that affect individuals’ choice of travel mode surpass the effects of other technologies (including improving automotive technology and engineering) in terms of reducing carbon dioxide emissions [5,6,7,8]. Since decisions are made as a result of the combined effects of PT service quality and psychological variables, there is an inevitable bias in only conducting a study of the relationship between unilateral factors and travel decisions. Considering a combination of the influences of the two aspects allows us to get closer to the decision-making mechanisms of travellers in order to guide the formulation of effective traffic intervention policies.
1.1. Expansion and Application of the Theory of Planned Behaviour
Theories such as value norm theory, the theory of planned behaviour (TPB), normative activation models and interpersonal behaviour all enable effective research to be carried out on travelling behaviour from a psychological perspective [7,9,10,11]. The results also indicate that the relationship between pro-environment behaviours and related technology application and intervention policies can be better understood from the perspective of psychology. This understanding can be translated into effective intervention plans, which can make a major contribution to climate change mitigation [12]. One of these theories, TPB, shows strong behavioural prediction ability and is the most widely used theoretical framework [13] to predict and explain different pro-environment travel (PET) behaviour. Since it is still imperfect, several scholars have attempted to integrate TPB with individual habits, personality traits, anticipated feelings of regret, self-identity, descriptive norms, social norms [10,14,15,16,17,18,19,20,21] and other variables that can dramatically improve its predictive ability. It is, therefore, unwise to apply TPB to specific behavioural studies without careful consideration. In terms of travel behaviour research, higher service quality and satisfaction can lead to positive PET behaviour intention. Obviously, a decision on a mode of travel will be affected by the quality of the PT service; this does not take place directly, but indirectly via psychological variables [22]. A psychological understanding of the impact of the quality of a PT service on the travel behaviour mechanism is required. In a comprehensive model, only the influence of service quality, perceived value, satisfaction and other variables influencing the intentions of bus passengers are taken into consideration; the interactions between psychological variables are ignored [2], reducing the prediction effect. Some studies have made valuable attempts to combine customer satisfaction theory with TPB [4]; these focus on the psychological process of mode transformation and do not pay particular attention to behaviour accompanied by a pro-environment attitude. Therefore, one of the gaps in the existing research that is filled by this paper is the expansion of TPB based on customer satisfaction theory, and the determination of the structure of the relationship between PET behaviour and its influencing factors in a specific research context.
1.2. Adopting Qualitative Research for PT Service Quality Measurement
Reliable and sufficient data are needed as the foundation of a PT service quality measurement sub-model. Although it is well known that the quality of a PT service is a decisive factor affecting travel demand, and that improving service quality promotes changes in given modes of travel [23], the issue of how to determine a group of attributes that can be used to comprehensively evaluate the quality of PT services and measure their relative importance in traveller satisfaction remains a challenging and important research field [24,25]. Decision-making on modes of travel is a rather complex psychological process. To understand public motivation and decisions involving complex issues such as carbon emissions and the impact of PT service quality, there is a need for research on adequate methods of investigating how to measure [26] service quality. In [4], six measures of observation were applied as observed variables for measurement, but the source of the calculation method was not given. If we want to understand the influence of passengers’ attributes on the quality of a PT service and the effect of the overall evaluation of service quality on the choice of travel mode, the best way is to investigate passengers. Only in this way can a realistic decision model can be abstracted from a description of their personal experiences and ideas. It is also possible to draw up measurement indicators based on research by other scholars; however, each study has different research purposes, and the measurement indicators are likely to be different. Qualitative research obtains the elements of non-structural problems and their relationships by answering questions, understanding phenomena and analysing human behaviours and opinions, and is therefore widely used in behaviour analysis and intervention policies in the fields of health, tourism and education; there have been few applications in the domain of transportation, especially in the area of travel mode choice [27]. As an analytical technique used in qualitative research, grounded theory (i.e., constructing and revising propositional statements about relationships by questioning and observing informants in specific use contexts) can improve the quality of problem design [28]. By analysing the facts, opinions and motivations described by interviewees, we can identify the attributes of PT service quality that travellers care about most, as observed variables. This design is also conducive to the derivation of subsequent intervention policies and plans, and the attempt to apply qualitative research techniques is one of the contributions of this paper to the existing literature. In this way, the identification and design of observed variables in the sub-model for the measurement of quality in PT service can be made more accurate, and views and valuable opinions about people’s attitudes towards PET behaviour can be more easily collected. Based on this information, the variables influencing decisions on pro-environment travel modes can be determined and a path structure hypothesis of how these variables exert influence on decisions can be established. The next step is to conduct empirical research using a large-scale questionnaire survey in order to test these factors and the structure and degree of their correlation with decision-making behaviour, and finally to formulate a decision-making mechanism model of passenger travel modes that is helpful in developing effective intervention policies.
1.3. Choice of Data Analysis Method
In relation to the mechanism of influence of observed variables on behaviour and intensity measurement, the utility theory of economics was first introduced to the transportation field in the 1970s. This caused a wave of research that employed methods [29,30,31,32], such as the non-aggregate model based on stochastic utility theory and discrete choice models, and the use of the social-economic characteristics of travellers and the attributes of travel plans (e.g., travel time, travel cost, etc.). Although predictions can be made at the statistical level, they usually fail to identify potential psychosocial factors (such as satisfaction and attitude) that play a key role in the decision-making process of travellers, as well as the attributes and habits of PT service quality that have a greater impact on psychological factors; the explanatory ability of these models is also questioned due to the assumption of complete rationality. Some studies have proposed discrete selection models involving latent variables such as service level attributes, values, attitudes, etc., and the results indicate a striking superiority over the traditional model in terms of prediction ability [33,34,35,36]. However, this kind of method focuses more on mathematical models and ignores the theoretical basis and measurement of psychological variables, and no suitable commercial software has been developed to solve its calculation problem. The simultaneous estimation of hybrid multinomial logit (ML) models would require highly complex forms of the simulated likelihood function. A structural equation model (SEM) solves the problem well, as this approach can analyse the relationships between independent variables and dependent variables, and these variables can be either continuous or discrete. In addition, the SEM can be used to evaluate different theoretical models, and hence is an important tool in multivariate statistics. In contrast, TPB was proposed and verified in the context of North American culture. Research on psychosocial factors related to travel behaviour has mainly been conducted in large cities in developed countries. There are few studies of PET behaviour based on TPB in a Chinese context. Due to cultural and regional differences, behaviours may differ, meaning that this exploration is beneficial for the cross-cultural applicability of TPB. As a point of difference from existing studies [4], this paper analyses the influence of various personal attributes such as gender, occupation and income on PET behaviour. To bridge the gaps in the literature, this study aims to establish a relationship model of the major determinants of PET behaviour by expanding TPB with satisfaction theory and habit variables.
The remaining parts of this study are structured as follows. The following section establishes a comprehensive conceptual model framework and hypothesis. The methodology section gives a detailed description of the qualitative and quantitative research to recognise the concerned factors. We solve problems with an SEM to reveal the relative importance and the path of action of the psychological factors affecting PET behaviour and service quality attributes. Finally, the impacts of differences in demographic characteristics are discussed, followed by a conclusion and future works.
2. Conceptual Model and Hypotheses
2.1. TPB
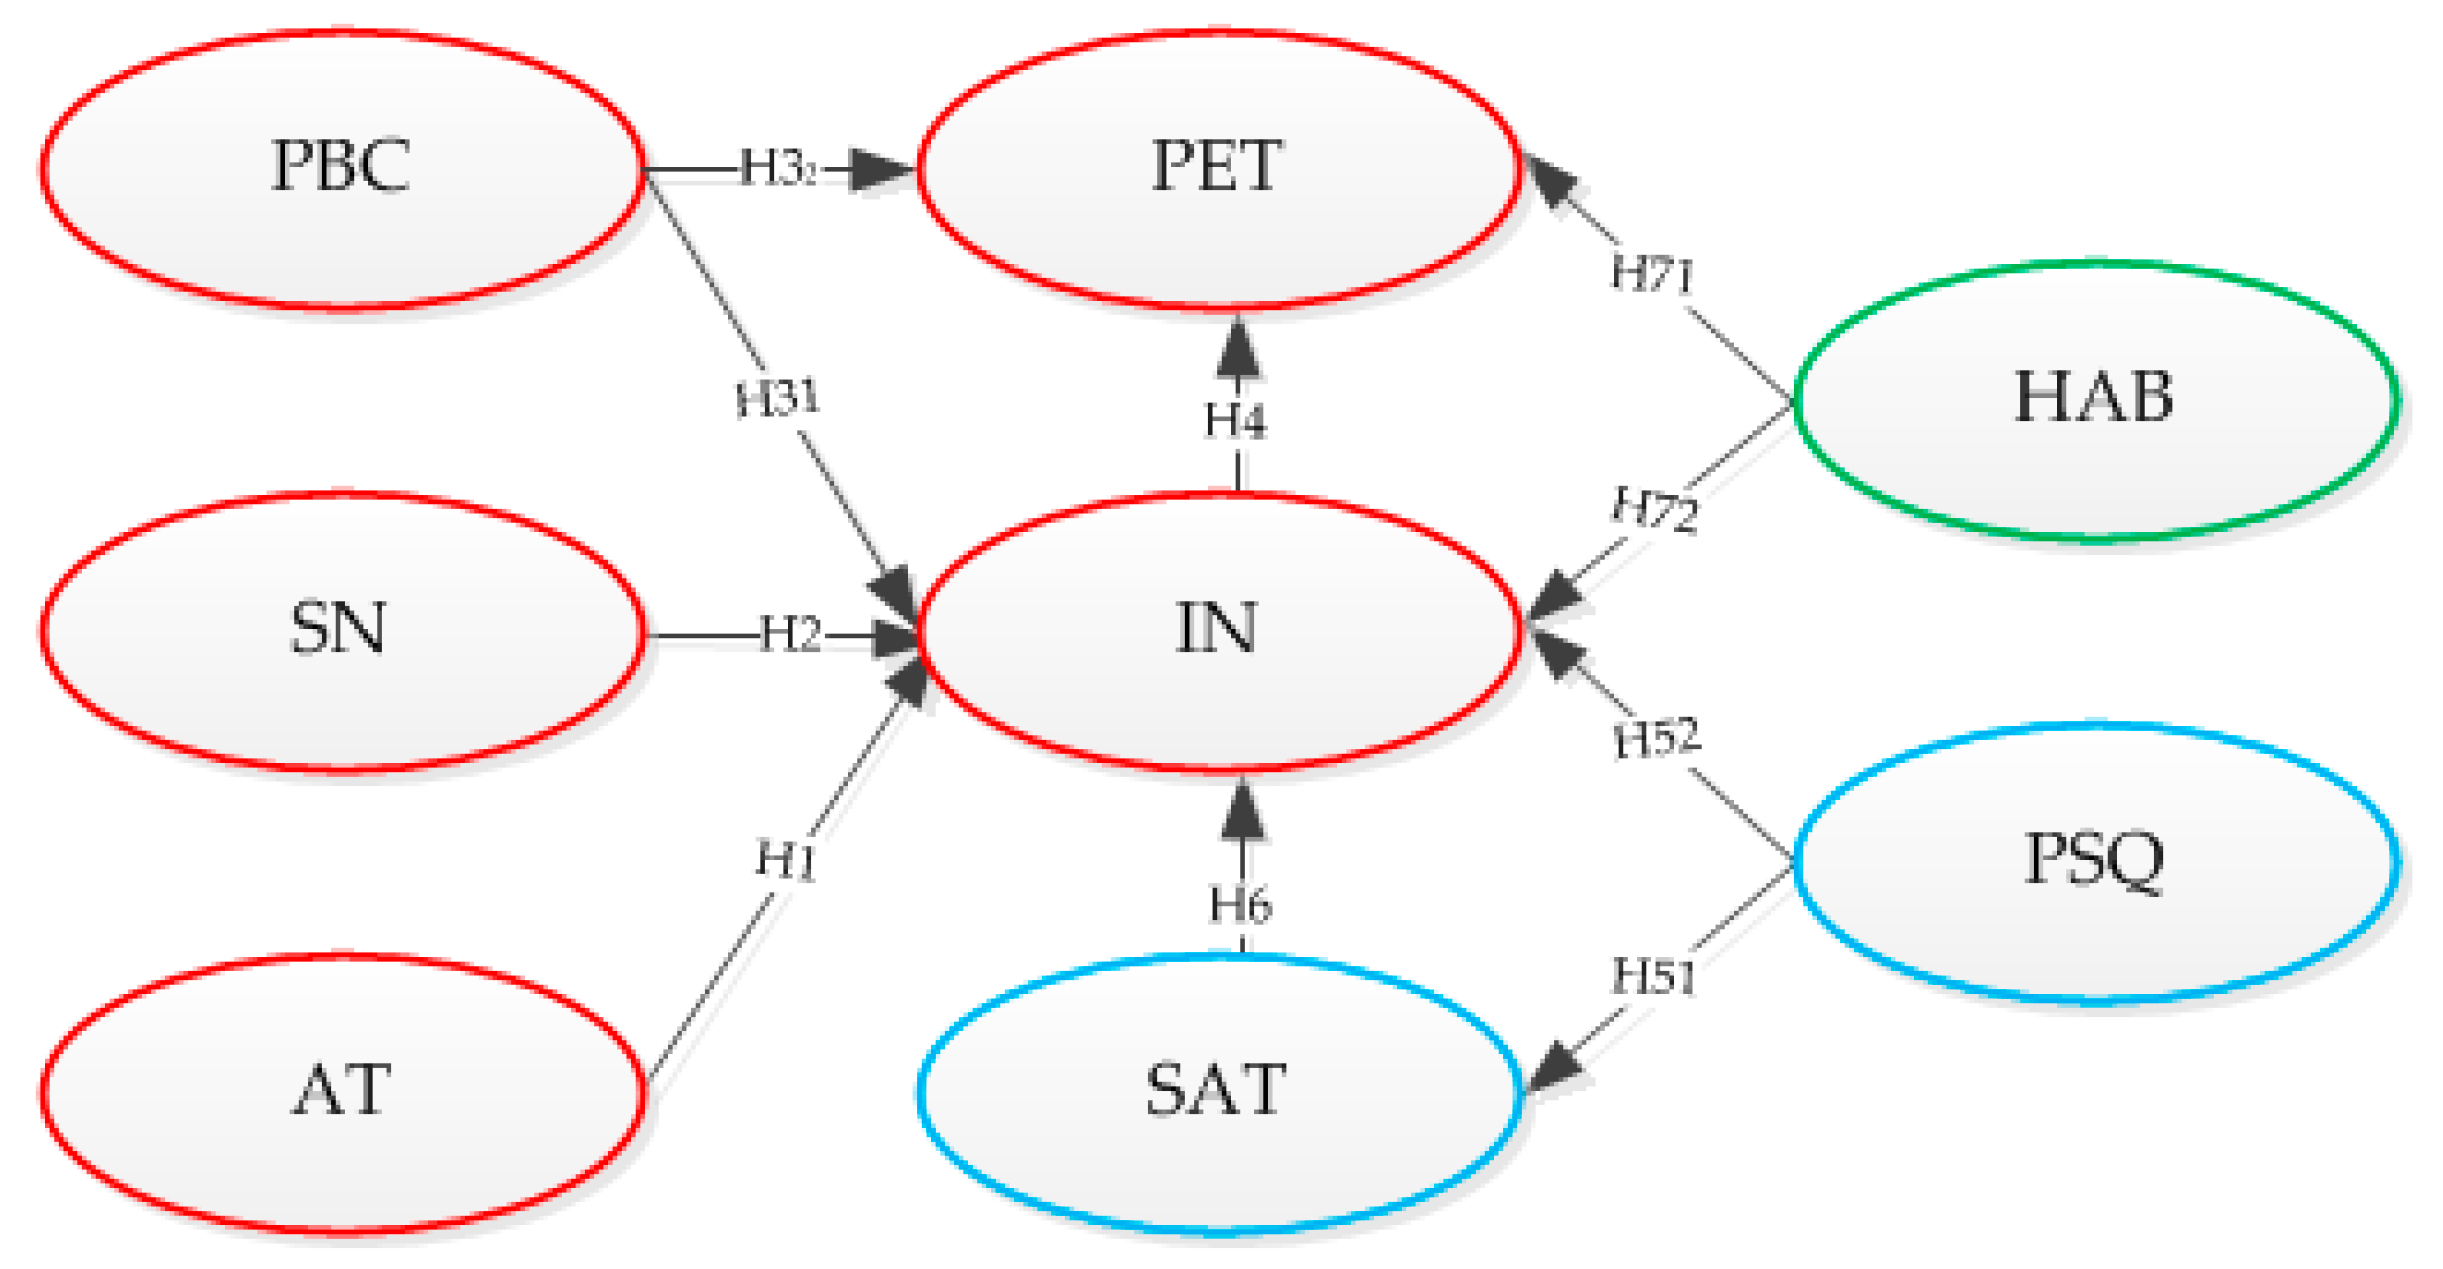
TPB was proposed by Ajzen, based on the theory of reasoned action (which mainly predicts acts that are completely controlled by will), and introduced perceived behavioural control, which improved the explanatory ability of individual behaviour prediction [37]. The main components of TPB include a person’s attitudes (AT), subjective norms (SN), perceived behaviour control (PBC), intentions (IN) and behaviour. TPB assumes that the generation of behaviour is directly dependent on the individual’s intention to perform the behaviour, and that this has three determinants: AT, SN and PBC. AT is an individual’s mental experience, which reflects one’s likes and dislikes and positive or negative evaluations of a particular behaviour. SN refers to the social pressure that an individual perceives when deciding whether or not to perform a certain behaviour. It reflects influences from important figures or groups on the individual’s behaviour decision. PBC describes the degree to which an individual perceives performing a particular behaviour to be easy or difficult. TPB has been proven in many studies to be a good tool for studying the selection of travel mode, and is considered very effective in predicting intention and actual behaviour in the field of PT [10,38,39,40,41]. Ajzen [42] applied TPB to the study of pro-environment behaviour and verified that its constructs were applicable. However, some studies have recognised the drawbacks of the structure of TPB, and its practical application is limited due to the relatively abstract belief factors involved. In addition, the impact of SN on intention has not been fully confirmed, unlike that of AT and PBC. According to the basic hypothesis of TPB, the more positive an attitude, the greater the support received from significant others, and the more effective the PBC, the stronger the intention, and vice versa. By using TPB to reveal the impacts of AT, SN, PBC and IN on pro-environment travel (PET) behaviour, the following hypotheses are posed:
H1.
AT has a direct, positive influence on IN.
H2.
SN has a direct, positive influence on IN.
H3.
PBC has a direct, positive influence on IN (H31) and PET behaviour (H32).
H4.
IN has a direct, positive influence on PET behaviour.
2.2. Satisfaction Theory
DeVos [43] pointed out that numerous research studies since 2010 have recognised the correlation between travel mode choice and corresponding satisfaction. Providing passengers with high-quality PT services encourages them to give up their use of private cars. Satisfaction is often described in terms of the evaluation of consumers’ emotions, reflecting how positive these emotions are towards a certain service [44]. Service quality is a measure of how well the delivered service level matches customer expectations. In one study, Huey-Kuo [45] defined satisfaction as the overall degree of pleasure or satisfaction of passengers using PT. The terms “satisfaction” and “service quality” can be used interchangeably; the difference is that service quality is related to cognition, while satisfaction is related to emotion [2]. In other words, satisfaction is the result of an overall evaluation of the experience of service quality attributes. A structure based on perceived service quality–customer satisfaction–intention has been widely applied [46] in the field of transportation. Empirical tests have been conducted on the direct impact of service quality on passenger satisfaction. Wen and Chen et al. [2] investigated PT and urban express systems in Taiwan and found that perceived service quality had a direct positive impact on satisfaction and intention, and that service quality only influenced intention through satisfaction; hence, the relationship between service quality and intention is indirect [47]. Fu et al. [4] integrated TPB with satisfaction theory to create a PT travel decision model; they discovered that satisfaction had a noticeable impact on PT travel intention and a significant mediating effect on perceived service quality and intention. Increased customer satisfaction translates into new customers and a more positive public image for transportation and other service companies. PT requires reliable and effective methods to confirm the determinants of service quality from the customer perspective in order to achieve these goals. A key problem facing researchers involves the questions of which service quality attributes are important drivers of overall satisfaction and how to determine these attributes. There are still five gaps in the existing research literature [48]: (i) consumer expectation–management perception; (ii) management perception–service quality specifications; (iii) service quality specifications–service delivery; (iv) service delivery–external communications; and (v) expected service–perceived service. This highlights the need to use qualitative research methods and listen closely to the views of passengers.
As stated above and defined in Table A1 in the Appendix A, we introduce satisfaction (SAT) and perceived service quality (PSQ) of PT to reveal a more comprehensive and effective explanation of PET behaviour. As a result, three hypotheses are formulated as follows:
H5.
PSQ has a direct, positive influence on SAT (H51) and IN (H52).
H6.
SAT has a direct, positive influence on IN.
2.3. Habit
After TPB was put forward, many researchers questioned its adequacy, because the structure proposed in the theory may not be sufficient to fully explain people’s intentions and actions. They suggested that variables could be added that were related to prediction and interpretation in order to improve TPB’s prediction ability [10,14,15,16,17,18,19,20,21]. Fishbein and Ajzen pointed out that many other research studies added new variables, such as social norms, moral norms, personal norms and others; these improved the model’s prediction ability, but this has only been verified in the study of specific behaviour [49]. For example, moral norms are related to behaviour that has obvious moral dimensions, including shoplifting, deception and lying. Self-identity and expected influence are also widely used, but their measurements are often reflected in terms of attitudes, PBC and habit (HAB). These three variables overlap greatly with the existing predictors in the theory. It was only when the aspect of past behaviour was added to the model that the explanatory power of future behaviours and intentions appeared, and this was closely related to the variables in the model. In view of this, Ajzen also proposed that past behaviour may have a direct and non-mediated causal effect on intention, in a way that we do not yet understand. One of the remaining challenges for researchers interested in using TPB methods is to explain the causal mechanism of the effect of past behaviour on intention. In terms of research on travel behaviour, people are increasingly aware of the importance of habit as it relates to the use of transportation modes. Psychologist Bas Verplanken [50] proposed that TPB should consider how habits regulate the relationship between intention and actual behaviour in studies focused on car use. Using TPB, Bamberg and Ajzen [51] studied the impact of intervention measures involving prepaid bus tickets on the use of buses among college students, and found that the variable of habit improved predictions of travel mode before behaviour intervention. A study of the travel behaviours of car and bicycle commuters conducted by Benjamin [52] made it clear that when a behaviour is stable, habit can regulate the influence of intention on behaviour. Fu [14], a researcher in Taiwan, found that a heavy habit of car use hindered individuals’ willingness to switch from cars or motorcycles to PT. Verplanken et al. also showed that the willingness of villagers to not drive to nearby cities predicted the choice of travel modes with a weak car use habit, but that willingness had no effect on behaviour with a heavier driving habit [53]. Chowdhury [54] discovered that the relationship between intention and behaviour is strong when habit is weak, but with increased habit intensity, the ability to predict behaviour in terms of willingness decreases, until it no longer predominates. It is not hard to show that habit is an important factor that directly affects use behaviour and intention towards PET behaviour, and may help in determining the internal characteristics of PT use.
The introduction of HAB to TPB can therefore provide a more comprehensive and effective explanation for selection behaviour. Our last hypothesis is as follows:
H7.
HAB has a positive effect on PET behaviour (H71) and IN (H72).
A graphical representation of all of the above hypotheses is shown in Figure 1.
3. Methodology
Whether the idea of encouraging the public to choose environmentally friendly travel can be realised or not depends on the quality of transport services. Therefore, accurately identifying PT service quality attributes that passengers are concerned about is very important to improve service quality and promote pro-environment travel. Qualitative research is widely used within sociology, psychology and related fields. Although this approach has rarely been applied to transport planning to date, this does not mean it is useless in this area. Qualitative approaches are increasingly being used in road safety and public transportation service quality studies [27]. Qualitative techniques can be a supplementary way of obtaining information related to activity-travel decisions that otherwise would be extremely difficult to find. Mars et al. [27] obtained 42 papers from 2001 to 2016 with keywords such as “qualitative”, “transportation” and “travel” from Google Scholar and Web of Science, and analysed the research methods, software, data coding and collection processes used in these studies. The results indicated that qualitative techniques can be a good complement to research activities related to travel decision-making.
3.1. Qualitative Research
After the hypothesis of the theoretical model is put forward, the measurement of latent variables becomes the most important work. There are two kinds of latent variables in the expanded TPB model: one is from the classical TPB, and the other is from the perceived service quality of PT latent variables. The former is designed with the observation variable proposed by Ajzen, and the latter is mainly determined by qualitative research. Therefore, the objective of our qualitative research is the use of personal in-depth interviews and focus group interviews to explore the observational variables of perceived service quality of PT.
We used personal in-depth interviews and focus groups to study the relationship between perceived service quality of PT and pro-environment travel attitude, motivation and behaviour. Personal in-depth interviews are one-to-one deep communication with the interviewees by open-ended questions, focus group interviews have group interaction, which can stimulate some potential memory and opinion collision. In a given research topic, individual in-depth interviews and focus group interviews can be used either alone, or together [55,56]. Considering that focus group interviews have a certain group motivation function, we adopted a combination of one 4-person focus group interview and 23 individual in-depth interviews, which was verified by an information saturability test. To find representative interviewees who could understand the content of the research, we used the purposeful sampling method to select people 20–40 years old who had relatively high travel rates. The information about the 27 interviewees is presented in Table 1. The 4-person focus group was formed by convenience sampling from the 27 interviewees.
3.2. Coding Analysis
Grounded theory is characterised by continuous comparison. To improve the compilation of qualitative data, we conducted open coding of original sources using a well-known qualitative analysis software package, QSR NVivo 11. This process consisted of step-by-step coding and data mining. Over 300 initial concepts were clustered into 16 categories, called third-class categories; this was followed by a process that transformed them into 4 categories, called second-class categories, based on the underlying logical connections of the sub-classes that were discovered in further discussions. To enhance the interpretive effects of these categories and reduce the deviations from coding analysis due to the emotional effects of researchers, we carried out qualitative analysis of 34 documents related to transport services provided by the Ministry of Transport and 22 domestic and foreign research studies on the measurement of transport service quality indicators from the period 2010 to 2017. Based on the results of grounded theory analysis, 4 new variables were constructed reflecting different factors of PT service quality: vehicle environment (VE), transportation network (TN), operation and management (OM) and information and technology (IT). The results of coding are shown in Table A1 in the Appendix A.
3.3. Consistency Checking of Coding Results
The goal of qualitative analysis is to achieve the highest possible consistency between independent researchers. In general, the consistency of coding the same data by different researchers should be higher than 70%. For each individual researcher, the coding consistency should be higher than 80% at the beginning and better than 90% in later periods [57]. Using the coding comparison function in NVivo 11, the same researcher re-coded the original data twice after 1 and 2 months, and removed one secondary node each time. The final result of the consistency analysis for all indicators was higher than 90% (i.e., the accuracy satisfied the requirements).
3.4. Questionnaire
We developed a questionnaire to measure all the latent variables in the text. The design of the questionnaire is mainly based on the standard questionnaire constructed by Ajzen [58] to measure the variables in TPB, as well as the literature of related studies and the information we obtained in-depth interviews [2,4,10,37,40,45,47,49,58,59,60,61]. All of the observed variables were assessed using a 5-point Likert-scales with item responses ranging from 1 (strongly disagree) to 5 (strongly agree). The 11 latent variables in the questionnaire were eventually measured by 38 observed variables, as shown in Table A2 in the Appendix A.
3.5. Tests of the Quantitative Table
3.5.1. Sample Description
We took Changsha citizens over 14 years old as the research object, for citizens of this age group can use PT cards independently. The non-probabilistic convenient sampling method of “street encounter” was used to recruit participants from public places, streets and communities in urban areas to participate in the survey. In street interviews, we also considered the equilibrium in spatial distribution of samples, but did not do a strict spatial probability sampling. In addition, we also posted questionnaires online by personal social accounts and forwarded them to friends for diffusion, inviting Changsha citizens to take the survey. A preliminary analysis of 1065 questionnaires was conducted, and 870 valid questionnaires were obtained after eliminating the invalid ones. The number of valid samples exceeded by 15 times the number of observed questions [62], indicating that there were sufficient samples. Information on the valid samples is given in Table A3 in the Appendix A.
3.5.2. Tests of Reliability and Validity
(1) Test of Reliability
As a criterion for reliability, an item should be excluded if the value of Cronbach’s Alpha (α) is less than 0.6, or if the deletion improves the overall value of Cronbach’s Alpha. The results of SPSS output show that after TN4 is deleted, the Cronbach’s Alpha value of TN as a whole will increase, and thus TN4 should be excluded. The values of Cronbach’s Alpha for these items are shown in Table 2; all are greater than 0.7, indicating that the reliability of the Likert scale fulfils this criterion.
(2) Exploratory Factor Analysis
Due to a lack of standardised mature scales for the measurement of transport service quality, we carried out an exploratory factor analysis to further verify the applicability of the scale. Before this analysis, we used the Kaiser-Meyer-Olkin (KMO) test and Bartlett’s test of sphericity on the items relating to transport service quality. The value of KMO was greater than 0.916, while the chi-square for Bartlett’s test of sphericity was 3018.256. This means that the requirements for the confidence coefficient are satisfied and the model makes sense in terms of factor analysis. Using SPSS 20.0 software and the principal component method, 4 factors with eigenvalues greater than 1 were extracted. These were VE, TN, OM and IT. The cumulative explanatory variance was 68.956%. The factor load matrix after orthogonal rotation is shown in Table A4 in the Appendix A, and the load of each index is greater than 0.5.
(3) Confirmatory Factor Analysis
Confirmatory factor analysis (CFA) was first conducted to analyse the validity and reliability of the constructs in our conceptual model. The model adequacy was assessed by the following fit indices, and the results are shown in Figure 2 and Figure 3. Some common fit indices were used to estimate the model fit [14]: chi-square value index (CMIN), ratio of chi-square value to degrees of freedom (CMIN/DF), goodness-of-fit index (GFI), adjusted goodness-of-fit index (AGFI), normed fit index (NFI), incremental fit index (IFI), Tucker-Lewis index(TLI), comparative fit index (CFI) and root mean square error of approximation (RMSEA). To indicate good fit of the model, CMIN/DF is recommended to be less than 2.0; GFI, AGFI, NFI, IFI, TLI and CFI are suggested to be more than 0.90; and RMSEA is advised to be below 0.08. The results show that the measurement model of attitude towards service quality has a good fit with the collected data: CMIN: 94.434; CMIN/DF: 1.098; GFI: 0.972; AGFI: 0.962; NFI: 0.969; IFI: 0.997; TLI: 0.996); CFI: 0.997; and RMSEA: 0.015, all exceeding the respective acceptance levels mentioned above. Only the results of the second-order confirmatory factor analysis are listed, as shown in Table 3. All normalised factor loads exceeded 0.5, and most were greater than 0.7. They are feasible in the case of p < 0.001, and the average variance extracted (AVE) is also greater than 0.5. Hence, the model converged well. Last but not least, the values of composite reliability (CR) were all greater than 0.8, and the constructive reliability of each latent variable therefore satisfies the requirements for accuracy.
4. Empirical Analysis
4.1. Fitting Test of Structural Equation Model
Our proposed transport service quality model was shown to have good inherent quality in the factor analysis in the preceding section. The SEM, referred to here as the transport service quality pro-environment travel model, was set up as shown in Figure 4. A fitting test was conducted using the AMOS application. The maximum likelihood estimations of CMIN and DF were 723.323 and 612, respectively. Hence, the ratio between CMIN and DF is 1.182, which is less than the required value of 2. The values of GFI, AGFI, NFI, IFI, TLI, CFI and RMSEA were 0.958, 0.952, 0.949, 0.992, 0.991, 0.992 and 0.014, respectively. All of these indicators meet the requirements, implying that the fitting of the structural equations is good. However, according to the parameter values provided by the Modification Indices (M.I) option in the Amos Graphics window, we found that the M.I. value between e11 and e13, e21 and e22, e32 and e34 was larger than the threshold of 4 set in SEM, and the reason for this is that the items of the measurement AT1 and AT3, OM2 and OM1, IN1 and IN3 are similar to each other to a certain extent. Therefore, a covariant relationship is established for the above three groups of error variables, in order to reduce the chi-square value of the model. The parameters of the SEM are presented in Table 4, where every hypothesis is satisfied except H2, and strong relationships between the observed and latent variables are shown to exist.
4.2. Analysis of the Factors of Pro-Environment Travel Behaviour
4.2.1. Path Analysis
The hypothesis testing above revealed four relationships among the variables. First, IN, PBC and HAB have a direct influence on PET behaviour. Second, AT, PSQ and SAT have an indirect influence on PET behaviour. Third, IN acts as a mediating factor of the effects of PBC and HAB. Finally, SAT plays a mediating role between PSQ and IN. These relationships were quantified, and the results are summarised in Table 5.
4.2.2. Analysis of the Effects of TPB Variables
As can be seen in Table 5, passengers’ intentions are the most important factor in pro-environment travel behaviour; this factor has the highest influence coefficient, 0.535, which is consistent with the findings of other related behavioural research [2,9,11,14,19] (i.e., the stronger the intention to use PT, the higher the use percentage). Since attitude has a decisive influence on the formation of pro-environment intentions, providing more useful information about the use of PT or holding a more positive attitude towards it can increase the occurrence of PET behaviour. It is also found that only the SN component of the TPB is inadequate and rarely predicts intention, which is partly attributable to poor measurement, because the TPB variables included in the questionnaire were operationalised as recommended by Ajzen, causing some misunderstandings in the translation process. In fact, extensive research has proved that the SN part of the TPB model is, to some extent, inadequate (for example, Armitage and Conner et al. [63] discovered that SN variables were generally regarded as weak predictors of intention by carrying out a meta-analysis of 185 independent TPB studies; Yin [64] also found that SN variables were only weak predictors of intention by exploring the travel mode choices of citizens in Beijing). PBC has a positive influence on actual behaviour regardless of whether its influence is direct or indirect (i.e., PBC is directly proportional to the occurrence rate of PET behaviour).
4.2.3. Analysis of the Effects of Perceived PT Service Quality and Satisfaction
Transport service quality influences its use tendency through PSQ and the extent of satisfaction. Perceived PT service quality consists of VE, TN, OM and IT, whose weights of influence are 0.809, 0.808, 0.757 and 0.746, respectively. It can be seen that actions such as improving tidiness, reducing waiting time and density, and extending service periods should be prioritised to encourage more people to use PT and to provide passengers with more pleasant and satisfactory travel experiences. We argue that satisfaction has a mediating effect on the relationship between PSQ and intention, which is consistent with the findings of other existing research studies [45,46,47].
4.2.4. Analysis of the Effects of Habit Variables
As shown in Table 5, HAB makes the second largest contribution to the total effect of PET behaviour, smaller only than the effect of intentions. The direct effect of habit is larger than its indirect effect. For instance, the habit of driving private cars can prevent people from using public transport, and because of the direct and strong impact of habits on people, the effect of other measures to encourage people to use public transport will be weakened. Thus, reducing the attraction of cars is efficient in spurring people to use PT.
4.3. Analysis of the Effects of Social Economy Attributes on Latent Variables
Due to the statistics of the population information, factors related to economy and social-cultural background not only have psychological effects on the integrated model but also considerably increase the explanatory ability of those models. The research methods used in this study were the independent-sample t-test and analysis of variance in SPSS, where the confidence interval was 95% and the variables were gender, age, educational background, job and number of private cars, to our independent and identical samples. The results revealed that income level and number of private cars had a significant effect on people’s choice of travel mode, while their socio-economic background also had a distinct effect on PET behaviour intentions and perception of service quality. Overall, the perception of service distinctly and significantly depends on the characteristics of passengers, as shown in Table 6.
5. Discussion
TPB has been shown to be an effective tool for studying PET behaviour, but there are also theoretical drawbacks. To understand the comprehensive impact on individual behaviour of both sociodemographic and psychological variables, we need to expand the theoretical framework of TPB to the actual background we are studying. In this case, we took into account PSQ and HAB, not only because previous researchers had confirmed the relationship between these two variables and pro-environment modes of travel, but also because we learned from the overall analysis that they significantly affect and intersect with the structure in TPB. For example, providing higher service quality can improve the image of PT enterprises, making public attitudes towards PT more positive. At the same time, this quality improvement will also cause a reduction in the perception of difficulties related to this mode of travel, and promoting the use of PT will contribute to the forming of habits. Hence, taking this complex relationship into consideration, we develop a model of public pro-environment travel decision-making. The model is based on an analysis of data drawn from in-depth interviews with passengers using coding theory and an analysis of their behaviour and viewpoints, in order to obtain the specific attributes of PT service quality that affect pro-environment travel decision-making and the relationship between these attributes and other psychological variables. As the results of the model test show, most of our hypotheses are confirmed, which provides support for the integrated theoretical model.
Passenger intention (0.535) is still the most crucial and direct factor influencing PET behaviour. First, passenger attitude is the strongest predictive factor of passenger intention. Hence, raising passengers’ awareness of public transit and creating a more positive attitude are key to promoting pro-environment behaviour. For example, public service advertising and demonstrations by public figures and government officials can help to promote PT to passengers and help them maintain a more positive attitude towards it. Second, the impact of PBC on intention is also significant, and improving PBC with regard to the ability to use PT and reducing the perception of difficulty are also very important. This is because many people choose PT for economic or other reasons, such as road congestion, parking difficulty, etc. For the former, as soon as their economic situation permits, their use of cars will greatly increase, while for the latter, if traffic conditions improve, they will immediately abandon PT and use cars instead. Hence, a program of simply expanding the roads and improving the conditions for private car travel may cause private car users to feel greater inconvenience or difficulty when using PT. This promotes the use of private cars, causing people to be caught up in a cycle of more crowded roads and a worse environment. To reduce the perceived difficulty of using PT and improve the public’s perceptual ability to control PT, we need to pay attention to improvements in the PT infrastructure, meaning that passengers are closer to stations, making it more convenient to use public transit, and improving the efficiency of public transit operation. The influence of habit has been widely recognised, and may promote greater development of public transit once the habit has been formed through frequent use [14].
In this paper, we find that habit (0.354) is a key factor affecting PET behaviour. The implementation of certain policies (such as offering concessionary or free tickets) to help people develop the habit of using PT provides a more lasting basis for the choice of pro-environment modes of travel. People who are not dependent on cars may be guided by general interventions, such as lowering the cost or even offering free travel within a certain period of time. People will then develop the habit through the frequent use of PT tools, in a step-by-step way. The habit of car use can greatly hinder PET behaviour, mainly because once the habit of not using PT is formed, the direct negative impact on PET behaviour will be more obvious. Trying to change attitudes or the effects of PBC and other measures will then also be very difficult. In addition to the above general interventions, we can also increase non-PT travel costs and encourage working at home and other ways of avoiding travelling at rush hour in order to lessen the demand for carbon-intensive travel. However, it is more important to cultivate an environmentally friendly attitude and a sense of responsibility for the environment and to stimulate an inherent psychological motivation towards pro-environment travel through integrated measures such as public service advertisements or other civic education plans and providing information on carbon emissions.
There is no dispute regarding the impact of PT service quality on pro-environment travel; however, passengers may have different needs for certain quality attributes, which may have different effects on the results. Instead of simply using abstract concepts such as safety, comfort and stability to describe PT service quality, we communicated face-to-face with interviewees on the basis of referring to but not fully relying on existing research results. We analysed their psychological processes based on the facts, opinions and motivations they described, and as a result, specific and measurable attributes of PT service quality and personal socio-economic statistical characteristics were obtained as the observed variables of latent variables. These observed variables can be more easily used by policy-makers or planners, and can produce social effects more quickly. From the results of hypothesis testing, it is not difficult to determine that the perception of PT service quality has a direct and significant impact on the willingness to use pro-environment modes of travel, and that satisfaction also plays an intermediary role, which has again been proven. OM (0.808) and VE (0.826) have the highest perceived impact on service quality. Hence, providing more routes and vehicles and offering more seats can ease congestion, while improving the sanitary conditions of the vehicles and passengers’ perceptions of the environmental services offered. It is also important to ensure that vehicles arrive on time as much as possible, reduce waiting time for passengers, provide adequate operating periods and closely monitor the driving technology and behaviour of drivers; establishing concessionary fares can also improve the perception of the level of OM. These findings can help PT enterprises to prioritise important service items, although it should be noted that the cost of providing better service quality is often too high, and this can in turn be passed on to passengers by increasing fares [2]. Hence, it is crucial for PT enterprises to consider synergies between measures.
Subjective normative structure is usually regarded as a weak predictor of intention, and to a certain extent, this is due to poor measurement. The measurement of SN is mainly related to perceived social pressure; however, most people’s behaviour is not necessarily affected by social pressure [62]. The results of this paper support this view in the context of medium-sized cities in China. Easterners are more likely to be influenced by the important people in their lives rather than pressure from the wider society, in contrast to the results of some studies of Western cultural backgrounds. Hence, we show that in the context of China, demographic and socio-economic characteristics will affect pro-environment travel behaviour to varying degrees, and this has a very important impact on explaining the significance of other psychological structures in this model [10]. Our results show that the effects on PET behaviour vary greatly based on driving experience, income and private car ownership. The perception of PT service quality, such as VE, TN, OM, IT and so on, also varies greatly between people of different genders, occupations and ages. Hence, when formulating traffic intervention plans, attention should be paid to the construction of an integrated and multi-level intelligent public transport system to provide more accurate, effective and personalised services for travellers with different personal attributes.
6. Conclusions and Future Work
Promoting pro-environment travel to the public has become important in order to alleviate the environmental pressures caused by urban traffic problems. In this paper, we identified a group of variables that can fully describe the psychological and social aspects that affect pro-environment travel choices, and can explain how these variables interact. This paper extends the theoretical framework of TPB using the theory of customer satisfaction and habit variables, and carries out a random sampling survey of travellers in Changsha, China to obtain data to test the hypothetical causal path. Similar to previous studies, TPB was also found to be useful in explaining PET behaviour. The attributes, habits and individual economic and social statistical characteristics of the quality of PT service were shown to influence the psychological process of travel decision-making and are associated with PET behaviour to various degrees.
These conclusions can provide support for planners of interventions related to pro-environment transport behaviour. In future research work, we will build on our knowledge that improving the quality of public transit service in terms of its OM, VE and the degree of information provision is conducive to encouraging PET behaviour. If we can also identify the key trigger attributes and the threshold for triggering behaviour, this will be conducive to the development of an effective intervention plan. In the authors’ view, this is a very interesting and valuable subject. Although the random sampling method was used in the present research, we intend to use other sampling methods (e.g., stratified sampling, cluster sampling) and compare them. In this way, the optimal sampling method with the least random error can be identified. A more detailed classification should also be made of interviewees, followed by multiple group analysis. This would enable researchers to identify travel behaviour more accurately, and could help governments formulate more practical and reasonable policies and intervention plans. In the future, other surveys will be conducted in other areas, such as suburban and rural districts. Further study involving a geometrical analysis of PET behaviour will also be carried out.
Author Contributions
W.C. and X.F. conceived the research and provided theoretical and technical guidance. C.C. collected data, made the computations and applied the analysis methods. C.C. and Z.K. analysed the work, commented on the results and figures and wrote the manuscript.
Funding
This research was supported by the Hunan Provincial Natural Science Foundation (Grant No. 2018JJ2537) and the Science Progress and Innovation Program of Hunan DOT (Grant No. 201723). This research was also supported by the National Natural Science Foundation of China (Grant No. 61203162).
Acknowledgments
The authors acknowledge more than 800 anonymous survey respondents who filled out the questionnaires.
Conflicts of Interest
The authors declare no conflict of interest.
Appendix A

Table A1.
Coding results of interview data of 27 interviewees (23 individuals and 4 in a group).
| First-class Categories | Second-class Categories | Third-class Categories | Number of interviews (N = 24) | Frequency | Coding Examples |
|---|---|---|---|---|---|
| PSQ | Vehicle environment (VE) | Density of passengers | 20 | 33 | Crowded while standing, extremely difficult to move; vehicle is packed with passengers |
| Hygiene and safety environment | 17 | 29 | It’s too hot in the car; too messy to bear | ||
| Integrity of facilities | 9 | 17 | Seats; arrival broadcasts; safety hammers; monitors | ||
| Transportation network (TN) | Convenience of transfer | 7 | 9 | Inconvenient transfers; several transfers are required | |
| Platform coverage | 10 | 21 | More than a 10-minute walk to the station | ||
| Through route | 11 | 20 | A through transit route is unavailable; the No. 202 bus takes a long detour | ||
| Efficiency of bus transit | 13 | 21 | Buses run too slowly; commuting by bus causes passengers to be late for work | ||
| Operation and management (OM) | Frequency | 14 | 21 | Frequency is too low; passengers have to wait for too long | |
| Punctuality | 10 | 20 | Arriving at stops on time and without delays on live schedules | ||
| Service time | 6 | 7 | Service stops by 6 or 7 pm; the length of the service period is too short | ||
| Drivers’ professional skills | 19 | 32 | Drivers frequently brake sharply; obey rules on stopping at certain places; easily lose their temper | ||
| Fares | 12 | 19 | Fares are cheap; transit fares are reasonable | ||
| Information and technology (IT) | Top-up methods | 4 | 7 | Top-up for IC cards is available on the Internet | |
| Modes of payment | 6 | 14 | Payment by smartphone; multiple-day travel pass is available | ||
| Wi-Fi coverage | 10 | 19 | Wi-Fi is available on transit; Wi-Fi is the most crucial issue | ||
| Real-time traffic information | 5 | 11 | Digital boards show estimated arrival times with route numbers |
Note: Number of interviews (N = 24) means the number of interviews in which third-class categories were mentioned in 24 interviews; Frequency means the number of times one certain word or one sentence is mentioned repeatedly.
Table A2.
Variables, definitions and observed items.
| Latent Variables and Observation Variables | Definitions and Observed Items |
|---|---|
| SN: These comprise a descriptive norm or prohibition. The specific meaning is an individual’s perception of social pressure and the extent to which he/she has been influenced by others when deciding whether or not to engage in a particular pro-environment travel behaviour. | |
| SN1 | My family or close friends support me in pro-environment travel. |
| SN2 | Government policies have an important effect on my decision. |
| SN3 | My family or close friends use pro-environment modes of travel. |
| SN4 | The social vibe encourages me to use PT. |
| PBC: Including self-efficacy and self-control, this refers to the extent to which individuals perceive pro-environment travel behaviours to be easy or difficult, and how much these are limited by their resources and opportunities (e.g., travel information, time and money). This variable reflects an individual’s ability to control objective situations. | |
| PBC1: | Individuals choose pro-environment travel, and this entirely depends on their perception. |
| PBC2: | Pro-environment travel is readily accessible to me. |
| PBC3: | I have the confidence to use only pro-environment modes of travel in the next few weeks. |
| AT: This refers to individuals’ positive or negative evaluation of pro-environment travel behaviour, reflecting the extent to which they like or dislike it (i.e., whether they feel happy or sad, or evaluate it as beneficial or harmful, useless or useful). | |
| AT1: | I love taking PT. |
| AT2: | Using pro-environment modes of travel has benefits. |
| AT3: | I am delighted with my journey on PT. |
| IN: Defined as the subjective probability of an individual’s behaviour, this reflects his/her willingness to use a pro-environment mode of travel and the possibility of using it continuously and recommending it to others. | |
| IN1: | I am willing to use PT the next time I travel. |
| IN2: | I am willing to recommend PT to others. |
| IN3: | I intend to take PT rather than drive in the future. |
| SAT: Satisfaction is described as an emotional assessment of the extent to which positive emotions are experienced when using PT (i.e., the level of satisfaction), which depends on the extent to which the expected service is realised. | |
| SAT1: | I am satisfied with taking PT. |
| SAT2: | The use of pro-environment modes of travel is a brilliant choice. |
| SAT3: | I am barely satisfied with the PT service offered. |
| HAB: Habit is defined as behaviour without careful thought, which refers to not only the experience and frequency of using PT but also the extent to which difficulty is experienced in abandoning the use of pro-environment modes of travel. | |
| HAB1: | Taking PT has become part of my life. |
| HAB2: | It is hard to give up taking PT. |
| HAB3: | I often spontaneously take PT. |
| PET: This variable is defined as taking place in a specific environment at a specific time with a specific purpose. In this paper, it refers to taking pro-environment modes of transport instead of driving. | |
| PET1: | In general, I take PT. |
| PET2: | I have often taken PT within the last month. |
| PET3: | I have taken pro-environment modes of transport more frequently than driving within the last month. |
| VE: This defines passengers’ perception of the comfort, safety and availability of the facilities in transit (e.g., density of passengers, health and safety, handrails or rings, voice broadcasts and completeness of safety hammer). | |
| VE1: | The PT vehicle is spacious, not crowded with passengers and everyone obeys the rules. |
| VE2: | The PT vehicle is tidy and comfortable. |
| VE3: | A complete safety set is always available. |
| TN: This defines passengers’ perception of the convenience and speed of the layout of the transport network. More specifically, it includes the convenience of transfers, station coverage, through transit and the operating efficiency of vehicles. | |
| TN1: | Few transfers are needed, and transfers are convenient. |
| TN2: | Taking PT is convenient due to the high rate of coverage of stations. |
| TN3: | The designs of routes are reasonable, and detours are rare. |
| TN4: | Vehicles are efficient and fast. |
| OM: This is defined as passengers’ perception of reliability and economy. More specifically, it refers to frequency, punctuality, service time, professional skills of drivers, fares, etc. | |
| OM1: | Headway and waiting times are short. |
| OM2: | Vehicles always arrive at stops punctually. |
| OM3: | The schedule is reasonable and meets passengers’ demands. |
| OM4: | Drivers are patient, skilful and professional (e.g., drive smoothly). |
| OM5: | Fares are cheap and discounts are offered (i.e., they impose little burden). |
| IT: This refers to PT passengers’ perception of information technology service. Online recharge of IC cards, payment methods, Wi-Fi network coverage and real-time traffic information can be provided. | |
| IT1: | Online top-up of IC cards is available to passengers. |
| IT2: | Payments are user-friendly and online payments are available. |
| IT3: | Wi-Fi is accessible in nearly every vehicle. |
| IT4: | Real-time digital information boards are provided on platforms, and these are reliable. |
Note: Latent variables and observation variables are a combination of variables listed in this table, e.g., SN is the latent variable of four combined observation variables (SN1, SN2, SN3, SN4).
Table A3.
Characteristics of participants of 870 valid samples.
| Features | Participants | Features | Participants | ||||
|---|---|---|---|---|---|---|---|
| Population | Proportion (%) | Population | Proportion (%) | ||||
| Gender | Male | 370 | 42.53 | Number of private vehicles | 0 | 360 | 41.38 |
| Female | 500 | 57.47 | 1 | 434 | 49.89 | ||
| Age | Under 18 | 12 | 1.38 | 2 | 57 | 6.55 | |
| 18–30 | 324 | 37.24 | >2 | 19 | 2.18 | ||
| 31–50 | 418 | 48.05 | Job | Student | 191 | 21.95 | |
| 51–60 | 112 | 12.87 | White collar/institution staff | 362 | 41.61 | ||
| Over 60 | 4 | 0.46 | Government official | 57 | 6.55 | ||
| Monthly income (RMB) | Under 2000 | 232 | 26.67 | Dealer | 61 | 7.01 | |
| 2000–4000 | 241 | 27.7 | Worker/steward | 56 | 6.44 | ||
| 4001–7000 | 232 | 26.67 | Retired | 21 | 2.41 | ||
| 7001–10,000 | 89 | 10.23 | Other | 122 | 14.02 | ||
| Over 10,000 | 76 | 8.74 | Driving years | No driver license | 293 | 33.68 | |
| Educational background | Below secondary school | 79 | 9.08 | Within a year | 125 | 14.37 | |
| Senior high school and secondary technical school | 129 | 14.83 | 1–5 years | 190 | 21.84 | ||
| Junior college and undergraduate | 492 | 56.55 | 5–10 years | 151 | 17.36 | ||
| Graduate and doctor | 170 | 19.54 | >10 years | 111 | 12.76 | ||
Table A4.
Factor loadings after factors are rotated.
| Factor1 | Factor2 | Factor3 | Factor4 | |
|---|---|---|---|---|
| VE1 | 0.287 | 0.203 | 0.783 | 0.169 |
| VE2 | 0.220 | 0.238 | 0.759 | 0.205 |
| VE3 | 0.202 | 0.152 | 0.782 | 0.198 |
| TN1 | 0.208 | 0.148 | 0.271 | 0.722 |
| TN2 | 0.152 | 0.194 | 0.144 | 0.795 |
| TN3 | 0.216 | 0.143 | 0.138 | 0.805 |
| OM1 | 0.748 | 0.209 | 0.257 | 0.140 |
| OM2 | 0.735 | 0.164 | 0.202 | 0.135 |
| OM3 | 0.757 | 0.140 | 0.239 | 0.145 |
| OM4 | 0.770 | 0.174 | 0.095 | 0.211 |
| OM5 | 0.752 | 0.216 | 0.118 | 0.149 |
| IT1 | 0.227 | 0.766 | 0.167 | 0.167 |
| IT2 | 0.192 | 0.774 | 0.115 | 0.150 |
| IT3 | 0.165 | 0.799 | 0.138 | 0.137 |
| IT4 | 0.172 | 0.756 | 0.204 | 0.105 |
| Initial eigenvalue | 6.475 | 1.500 | 1.315 | 1.053 |
| Interpretation variance (%) | 21.742 | 18.424 | 14.672 | 14.118 |
References
- Kollmuss, A.; Agyeman, J. Mind the gap: Why do people act environmentally and what are the barriers to pro-environmental behavior? Environ. Educ. Res. 2002, 8, 239–260. [Google Scholar] [CrossRef]
- Lai, W.T.; Chen, C.F. Behavioral intentions of public transit passengers—The roles of service quality, perceived value, satisfaction and involvement. Transp. Policy 2011, 18, 318–325. [Google Scholar] [CrossRef]
- Fang, X.P.; Xu, Y.J.; Chen, W.Y. Understanding attitudes towards pro-environmental travel: An empirical study from Tangshan city in China. Comput. Intell. Neurosci. 2014, 10, 43–50. [Google Scholar]
- Fu, X.; Juan, Z. Understanding public transit use behavior: Integration of the theory of planned behavior and the customer satisfaction theory. Transportation 2017, 44, 1–22. [Google Scholar] [CrossRef]
- Redman, L.; Friman, M.; Garling, T.; Hartig, T. Quality attributes of public transport that attract car users: A research review. Transp. Policy 2013, 25, 119–127. [Google Scholar] [CrossRef]
- Murray, A.T. Strategic analysis of public transport coverage. Socio Econ. Plan. Sci. 2001, 35, 175–188. [Google Scholar] [CrossRef]
- Donald, I.J.; Cooper, S.R.; Conchie, S.M. An extended theory of planned behaviour model of the psychological factors affecting commuters’ transport mode use. J. Environ. Psychol. 2014, 40, 39–48. [Google Scholar] [CrossRef]
- Thomas, G.O.; Walker, I.; Musselwhite, C. Grounded theory analysis of commuters discussing a workplace carbon-reduction target: Autonomy, satisfaction, and willingness to change behaviour in drivers, pedestrians, bicyclists, motorcyclists, and bus users. Transp. Res. Part F Traffic Psychol. Behav. 2014, 26, 72–81. [Google Scholar] [CrossRef]
- Xingjun, R.; Shanyong, W.; Qian, C.; Shuai, Y. Exploring the interaction effects of norms and attitudes on green travel intention: An empirical study in eastern China. J. Clean. Prod. 2018, 197, 1317–1327. [Google Scholar]
- Bamberg, S.; Hunecke, M.; Blobaum, A. Social context, personal norms and the use of public transportation: Two field studies. J. Environ. Psychol. 2007, 27, 190–203. [Google Scholar] [CrossRef]
- Kang, A.S.; Jayaraman, K.; Soh, K.-L.; Wong, W.P. Convenience, flexible service, and commute impedance as the predictors of drivers’ intention to switch and behavioral readiness to use public transport. Transp. Res. Part. F Psychol. Behav. 2019, 62, 505–519. [Google Scholar] [CrossRef]
- Stern, P.C. Contributions of psychology to limiting climate change. Am. Psychol. 2011, 66, 127–160. [Google Scholar] [CrossRef] [PubMed]
- Lanzini, P.; Khan, S.A. Shedding light on the psychological and behavioral determinants of travel mode choice: A meta-analysis. Transp. Res. Part F Psychol. Behav. 2017, 48, 13–27. [Google Scholar] [CrossRef]
- Chen, C.F.; Chao, W.H. Habitual or reasoned? Using the theory of planned behavior, technology acceptance model, and habit to examine switching intentions toward public transit. Transp. Res. Part F Traffic Psychol. Behav. 2011, 14, 128–137. [Google Scholar] [CrossRef]
- Jing, P.; Wang, J.; Chen, L.; Zha, Q. Incorporating the extended theory of planned behavior in a school travel mode choice model: A case study of Shaoxing, China. Transp. Plan. Technol. 2017, 41, 1–19. [Google Scholar] [CrossRef]
- Wenting, D.; Guangrong, J. A Review of the Theory of Planned Behavior. Adv. Psychol. Sci. 2008, 2, 315–320. [Google Scholar]
- Lo, S.H.; van Breukelen, G.J.P.; Peters, G.-J.Y.; Kok, G. Proenvironmental travel behavior among office workers: A qualitative study of individual and organizational determinants. Transp. Res. Part A 2013, 56, 11–22. [Google Scholar] [CrossRef]
- Heath, Y.; Gifford, R. Extending the theory of planned behavior: Predicting the use of public transportation 1. J. Appl. Soc. Psychol. 2002, 32, 2154–2189. [Google Scholar] [CrossRef]
- Eriksson, L.; Forward, S.E. Is the intention to travel in a pro-environmental manner and the intention to use the car determined by different factors? Transp. Res. Part D Transp. Environ. 2011, 16, 372–376. [Google Scholar] [CrossRef]
- Kaiser, F.G. A moral extension of the theory of planned behavior: Norms and anticipated feelings of regret in conservationism. Personal. Individ. Differ. 2006, 41, 71–81. [Google Scholar] [CrossRef]
- Forward, S.E. The theory of planned behaviour: The role of descriptive norms and past behaviour in the prediction of drivers’ intentions to violate. Transp. Res. Part F Traffic Psychol. Behav. 2009, 12, 198–207. [Google Scholar] [CrossRef]
- Fujii, S.; Kitamura, R. What does a one-month free bus ticket do to habitual drivers? An experimental analysis of habit and attitude change. Transportation 2003, 30, 81–95. [Google Scholar] [CrossRef]
- Prioni, P.; Hensher, D.A. Measuring service quality in scheduled bus services. J. Public Transp. 2000, 3, 51–74. [Google Scholar] [CrossRef]
- Beirão, G.; Sarsfield Cabral, J.A. Understanding attitudes towards public transport and private car: A qualitative study. Transp. Policy 2007, 14, 0–489. [Google Scholar] [CrossRef]
- Hensher, D.A.; Stopher, P.; Bullock, P. Service quality––Developing a service quality index in the provision of commercial bus contracts. Transp. Res. Part A 2003, 37, 499–517. [Google Scholar] [CrossRef]
- Schwanen, T.; Banister, D.; Anable, J. Scientific research about climate change mitigation in transport: A critical review. Transp. Res. Part A 2011, 45, 993–1006. [Google Scholar] [CrossRef] [Green Version]
- Mars, L.; Arroyo, R.; Ruiz, T. Qualitative research in travel behavior studies. Transp. Res. Procedia 2016, 18, 434–445. [Google Scholar] [CrossRef]
- Glaser, B.G.; Strauss, A.L.; Strutzel, E. The discovery of grounded theory: Strategies for qualitative research. Nurs. Res. 1968, 17, 364. [Google Scholar] [CrossRef]
- Ben-Akiva, M.; De Palma, A.; Kanaroglou, P. Dynamic model of peak period traffic congestion with elastic arrival rates. Transp. Sci. 1986, 20, 164–181. [Google Scholar] [CrossRef]
- Bai, T.; Li, X.; Sun, Z. Effects of cost adjustment on travel mode choice: Analysis and comparison of different logit models. Transp. Res. Procedia 2017, 25, 2653–2663. [Google Scholar] [CrossRef]
- Salon, D. Neighborhoods, cars, and commuting in New York City: A discrete choice approach. Transp. Res. Part A Policy Pract. 2009, 43, 180–196. [Google Scholar] [CrossRef] [Green Version]
- Yun, M.P.; Liu, G.Y.; Liu, F. Influence of change of public transportation service quality on travel mode choice behavior. China J. Highw. Transp. 2017, 30, 119–125. [Google Scholar]
- Habib, K.M.N.; Kattan, L.; Islam, M.T. Model of personal attitudes towards transit service quality. J. Adv. Transp. 2011, 45, 271–285. [Google Scholar] [CrossRef]
- Yáñez, M.F.; Raveau, S.; de Ortúzar, J.D. Inclusion of latent variables in mixed logit models: Modelling and forecasting. Transp. Res. Part A Policy Pract. 2010, 44, 744–753. [Google Scholar] [CrossRef]
- Espino, R.; Román, C.; De Ortúzar, J.D. Analysing demand for suburban trips: A mixed RP/SP model with latent variables and interaction effects. Transportation 2006, 33, 241–261. [Google Scholar] [CrossRef]
- Paulssen, M.; Temme, D.; Vij, A.; Walker, J. Values, attitudes and travel behavior: A hierarchical latent variable mixed logit model of travel mode choice. Transportation 2014, 41, 873–888. [Google Scholar] [CrossRef]
- Ajzen, I. The theory of planned behaviour. Organ. Behav. Hum. Decis. Process. 1991, 50, 179–211. [Google Scholar] [CrossRef]
- Gardner, B.; Abraham, C. Psychological correlates of car use: A meta-analysis. Transp. Res. Part F Traffic Psychol. Behav. 2008, 11, 300–311. [Google Scholar] [CrossRef]
- Ahern, A. The Potential Impact of New Urban Public Transport Systems on Travel Behaviour. Ph.D. Thesis, University of London, London, UK, 2001; pp. 277–287. [Google Scholar]
- Lo, S.H.; Breukelen, G.J.P.V.; Peters, G.J.Y.; Kok, G. Commuting travel mode choice among office workers: Comparing an extended theory of planned behavior model between regions and organizational sectors. Travel Behav. Soc. 2016, 4, 1–10. [Google Scholar] [CrossRef]
- Liu, D.; Du, H.; Southworth, F.; Ma, S. The influence of social-psychological factors on the intention to choose low-carbon travel modes in Tianjin, China. Transp. Res. Part A 2017, 105, 42–53. [Google Scholar] [CrossRef]
- Leeuw, A.D.; Valois, P.; Ajzen, I.; Schmidt, P. Using the theory of planned behavior to identify key beliefs underlying pro-environmental behavior in high-school students: Implications for educational interventions. J. Environ. Psychol. 2015, 42, 128–138. [Google Scholar] [CrossRef]
- De Vos, J. Satisfaction-induced travel behaviour. Transp. Res. Part F Psychol. Behav. 2019, 63, 12–21. [Google Scholar] [CrossRef]
- Oliver, R.L. Satisfaction: A Behavioral Perspective on the Consumer; McGraw-Hill: New York, NY, USA, 1997. [Google Scholar]
- Chen, H.K. The structural interrelationships of group service quality, customer satisfaction and behavioral intention for bus passengers. Int. J. Sustain. Transp. 2016, 10, 150106050212006. [Google Scholar] [CrossRef]
- De Oña, R.; Machado, J.L.; de Oña, J. Perceived service quality, customer satisfaction, and behavioral intentions: Structural equation model for the Metro of Seville, Spain. Transp. Res. Rec. J. Transp. Res. Board 2015, 1, 76–85. [Google Scholar] [CrossRef]
- Cronin, J.J.; Brady, M.K.; Hult, G.T.M. Assessing the effects of quality, value, and customer satisfaction on consumer behavioral intentions in service environments. J. Retail. 2000, 76, 193–218. [Google Scholar] [CrossRef]
- TRB (Transportation Research Board). A Handbook for Measuring Customer Satisfaction and Service Quality; Transit Cooperative Research Program, Report 47; National Academy Press: Washington, DC, USA, 1999. [Google Scholar]
- Fishbein, M.; Ajzen, I. Predicting and Changing Behavior: The Reasoned Action Approach; Psychology Press: New York, NY, USA, 2009; pp. 3–21. [Google Scholar]
- Schwanen, T.; Banister, D.; Anable, J. Rethinking habit and their role in behaviour change: The case of low-carbon mobility. J. Transp. Geogr. 2012, 24, 522–532. [Google Scholar] [CrossRef]
- Bamberg, S.; Ajzen, I.; Schmidt, P. Choice of travel mode in the theory of planned behavior: The Roles of past behavior, habit, and reasoned action. Basic Appl. Soc. Psychol. 2003, 25, 175–187. [Google Scholar] [CrossRef]
- Gardner, B. Modelling motivation and habit in stable travel mode contexts. Transp. Res. Part F Traffic Psychol. Behav. 2009, 12, 68–76. [Google Scholar] [CrossRef]
- Verplanken, B.; Aarts, H.; Knippenberg, A.V.V.; Moonen, A. Habit versus planned behavior: A field experiment. Br. J. Soc. Psychol. 1998, 37, 111–128. [Google Scholar] [CrossRef]
- Chowdhury, S.; Ceder, A. Users’willingness to ride an integrated public-transport service: A literature review. Transp. Policy 2016, 48, 183–195. [Google Scholar] [CrossRef]
- Hine, J.; Scott, J. Seamless, accessible travel: users’ views of the public transport journey and interchange. Transp. Policy 2000, 7, 217–226. [Google Scholar] [CrossRef]
- Johnstone, M.L. Depth Interviews and Focus Groups. Formative Research in Social Marketing; Springer Publications: Singapore, 2017; pp. 67–87. [Google Scholar]
- Huberman, A.M.; Miles, M.B. Qualitative Data Analysis: An. Expanded Sourcebook; Sage Publications Inc.: London, UK; Thousand Oaks, CA, USA, 1994; pp. 105–138. [Google Scholar]
- Ajzen, I. Constructing a Theory of Planned Behavior Questionnaire. Available online: http://people.umass.edu/aizen/pdf/tpb.measurement.pdf (accessed on 21 August 2013).
- Yu, K.T.; Lee, N.H.; Wu, G.S. An empirical research of Kinmen tourists’ behavioral tendencies model—A case of cross-validation in causal modeling. J. Tour. Stud. 2005, 11, 355–384. [Google Scholar]
- Tsai, C.Y. Applying the theory of planned behavior to explore the independent travelers’ behavior. Afr. J. Bus. Manag. 2010, 4, 221–234. [Google Scholar]
- Garling, T.; Axhausen, K.W. Introduction: Habitual travel choice. Transportation 2003, 30, 1–11. [Google Scholar] [CrossRef]
- Golob, T.F. Structural equation modeling for travel behavior research. Transp. Res. Part B Methodol. 2003, 37, 1–25. [Google Scholar] [CrossRef] [Green Version]
- Armitage, C.J.; Conner, M. Efficacy of the theory of planned behaviour: A meta-analytic review. Br. J. Soc. Psychol. 2001, 40, 471–499. [Google Scholar] [CrossRef]
- Bresnahan, M.; Young, L.S.; Smith, S.W.; Shearman, S.; Nebashi, R.; Park, C.Y.; Yoo, J. A theory of planned behavior study of college students’ intention to register as organ donors in Japan, Korea, and the United States. Health Commun. 2007, 21, 201–211. [Google Scholar] [CrossRef]
Figure 1.
Graphical conceptual model of the hypotheses. PBC, perceived behaviour control; SN, subjective norms; AT, attitudes; PET, pro-environment travel; IN, intentions; SAT, satisfaction; HAB, habit; PSQ, perceived service quality.
Figure 1.
Graphical conceptual model of the hypotheses. PBC, perceived behaviour control; SN, subjective norms; AT, attitudes; PET, pro-environment travel; IN, intentions; SAT, satisfaction; HAB, habit; PSQ, perceived service quality.

Figure 2.
Confirmatory factor analysis: model 1.

Figure 3.
Confirmatory factor analysis: model 2.

Figure 4.
Structural equation model (SEM) framework diagram of public transport (PT) service quality PET behaviour model.
Figure 4.
Structural equation model (SEM) framework diagram of public transport (PT) service quality PET behaviour model.

Table 1.
Characteristics of 27 interviewees.
| Features | Population | Proportion (%) | Features | Population | Proportion (%) | ||
|---|---|---|---|---|---|---|---|
| Gender | Male | 15 | 55 | Age | Under 25 | 9 | 33 |
| Female | 12 | 45 | 26–35 | 14 | 52 | ||
| Educational background | Junior colleges | 3 | 11 | Over 36 | 4 | 15 | |
| Job | Student | 8 | 30 | ||||
| Undergraduate | 18 | 67 | Government official | 7 | 26 | ||
| Graduate | 6 | 22 | Dealer | 3 | 11 | ||
| Interview type | Face-to-face | 19 | 70 | Staff | 6 | 22 | |
| Internet | 8 | 30 | Researcher | 3 | 11 | ||
Table 2.
Cronbach’s Alpha (α) for variables.
| Factors | AT | SN | PBC | IN | SAT | HAB | PET | VE | TN | OM | IT |
|---|---|---|---|---|---|---|---|---|---|---|---|
| Number of observed variables | 3 | 4 | 3 | 3 | 3 | 3 | 3 | 3 | 4 | 5 | 4 |
| Cronbach α of observed variables | 0.81 | 0.87 | 0.81 | 0.80 | 0.78 | 0.81 | 0.80 | 0.82 | 0.79 | 0.86 | 0.84 |
| Cronbach α of all observed variables | 0.87 | ||||||||||
Table 3.
Parameters of confirmatory factor analysis (CFA). C.R., critical ratio; AVE, average variance extracted; CR, composite reliability.
Table 3.
Parameters of confirmatory factor analysis (CFA). C.R., critical ratio; AVE, average variance extracted; CR, composite reliability.
| Path | C.R. | p | Standardised Loading | AVE | CR |
|---|---|---|---|---|---|
| OM ← PSQ | 0.808 | 0.6092 | 0.8616 | ||
| TN ← PSQ | 9.895 | *** | 0.746 | ||
| VE ← PSQ | 11.042 | *** | 0.809 | ||
| IT ← PSQ | 10.554 | *** | 0.757 | ||
| IT3 ← IT | 0.782 | 0.5726 | 0.8427 | ||
| IT2 ← IT | 15.595 | *** | 0.76 | ||
| IT1 ← IT | 15.45 | *** | 0.753 | ||
| IT4 ← IT | 14.976 | *** | 0.731 | ||
| OM1 ← OM | 0.792 | 0.5391 | 0.8537 | ||
| OM2 ← OM | 15.732 | *** | 0.743 | ||
| OM3 ← OM | 15.541 | *** | 0.735 | ||
| OM4 ← OM | 14.702 | *** | 0.7 | ||
| OM5 ← OM | 14.635 | *** | 0.697 | ||
| VE1 ← VE | 0.808 | 0.6189 | 0.8296 | ||
| VE2 ← VE | 16.522 | *** | 0.798 | ||
| VE3 ← VE | 15.651 | *** | 0.753 | ||
| TN1 ← TN | 0.723 | 0.5752 | 0.8023 | ||
| TN2 ← TN | 13.929 | *** | 0.784 | ||
| TN3 ← TN | 13.75 | *** | 0.767 |
Note: All normalisation regression coefficients of null paths in the table were defined as a fixed parameter of 1. It is not necessary for these paths to take significant tests, and their standard error and critical ratio have an equal t-value where their significant levels are null. *** p-value > 0.001.
Table 4.
Summarisation of the outcomes for the hypotheses.
| Hypothesis | S.E. | C.R. | p | Normalisation Parameter | Test Results |
|---|---|---|---|---|---|
| SAT ← PSQ | 0.062 | 8.29 | <0.05 | 0.383 | Confirmed |
| IN ← HAB | 0.047 | 6.817 | <0.05 | 0.303 | Confirmed |
| IN ← PBC | 0.04 | 10.059 | <0.05 | 0.417 | Confirmed |
| IN ← SN | 0.032 | 0.422 | 0.673 | 0.015 | Unconfirmed |
| IN ← AT | 0.039 | 12.801 | <0.05 | 0.527 | Confirmed |
| IN ← PSQ | 0.055 | 7.922 | <0.05 | 0.368 | Confirmed |
| IN ← SAT | 0.043 | 6.891 | <0.05 | 0.307 | Confirmed |
| PET ← HAB | 0.044 | 7.385 | <0.05 | 0.354 | Confirmed |
| PET ← PBC | 0.049 | 6.797 | <0.05 | 0.289 | Confirmed |
| PET ← IN | 0.052 | 14.703 | <0.05 | 0.535 | Confirmed |
Table 5.
Standardised direct, indirect, and total effects of latent variables on target behaviour.
| Latent Variable | Target Behaviour | Direct Effects | Indirect Effects | Total Effects |
|---|---|---|---|---|
| PBC | pro-environmental travel behaviour | 0.289 | 0.223 | 0.512 |
| AT | 0.00 | 0.281 | 0.281 | |
| SAT | 0.00 | 0.164 | 0.164 | |
| PSQ | 0.00 | 0.197 | 0.197 | |
| HAB | 0.354 | 0.162 | 0.516 | |
| IN | 0.535 | 0.00 | 0.535 |
Table 6.
Influence of socio-demographic characteristics on latent variables.
| Latent Variable | Gender | Age | Educational Background | Job | Number of Private Cars | Driving Years | Income |
|---|---|---|---|---|---|---|---|
| VE | −24.829 | 22.019*** | 2.031 | 9.929*** | 0.042*** | 0.443 | 0.629*** |
| TN | −18.086*** | 11.725*** | 0.475 | 4.331*** | 0.565 | 0.918*** | 1.947 |
| OM | −21.851*** | 8.535 | 0.833 | 9.359*** | 0.351*** | 0.519*** | 0.513 |
| IT | −21.143 | 14.625*** | 0.104 | 5.607 | 0.562 | 0.981 | 0.952*** |
| HAB | 0.969*** | 0.374 | 1.945 | 7.139 | 0.653*** | 0.787*** | 0.495*** |
| PBC | 1.971* | 1.158 | 0.200*** | 1.141 | 3.488* | 2.127** | 1.717*** |
| SN | 0.369 | 2.525* | 0.203 | 1.821 | 1.348 | 1.635 | 0.545 |
| AT | −1.058 | 0.712*** | 1.520** | 1.347 | 13.103*** | 1.169 | 1.017 |
| SAT | −6.652*** | 1.555 | 0.712 | 1.369 | 1.201 | 1.915*** | 1.127 |
| IN | 0.94 | 0.447 | 0.820 | 2.284* | 17.222*** | 1.125 | 0.722*** |
| PET behaviour | 0.123 | 0.446 | 0.111** | 2.869** | 4.409*** | 1.500*** | 1.267*** |
* p < 0.05; ** p < 0.01; *** p < 0.001.
© 2019 by the authors. Licensee MDPI, Basel, Switzerland. This article is an open access article distributed under the terms and conditions of the Creative Commons Attribution (CC BY) license (http://creativecommons.org/licenses/by/4.0/).
Share and Cite
MDPI and ACS Style
Chen, W.; Cao, C.; Fang, X.; Kang, Z. Expanding the Theory of Planned Behaviour to Reveal Urban Residents’ Pro-Environment Travel Behaviour. Atmosphere 2019, 10, 467. https://doi.org/10.3390/atmos10080467
AMA Style
Chen W, Cao C, Fang X, Kang Z. Expanding the Theory of Planned Behaviour to Reveal Urban Residents’ Pro-Environment Travel Behaviour. Atmosphere. 2019; 10(8):467. https://doi.org/10.3390/atmos10080467
Chicago/Turabian StyleChen, Weiya, Chao Cao, Xiaoping Fang, and Zixuan Kang. 2019. "Expanding the Theory of Planned Behaviour to Reveal Urban Residents’ Pro-Environment Travel Behaviour" Atmosphere 10, no. 8: 467. https://doi.org/10.3390/atmos10080467
Note that from the first issue of 2016, this journal uses article numbers instead of page numbers. See further details here.