Article

Characterization of Real-World Pollutant Emissions and Fuel Consumption of Heavy-Duty Diesel Trucks with Latest Emissions Control

by
Christos Keramydas
1,
Leonidas Ntziachristos
2,*,
Christos Tziourtzioumis
3,
Georgios Papadopoulos
3,
Ting-Shek Lo
4,
Kwok-Lam Ng
4,
Hok-Lai Anson Wong
4 and
Carol Ka-Lok Wong
4
1
Department of Supply Chain Management, International Hellenic University, GR 60100 Katerini, Greece
2
Department of Mechanical Engineering, Aristotle University of Thessaloniki, P.O. Box 483, GR 54124 Thessaloniki, Greece
3
Emisia S.A., 21 Antoni Tritsi str., P.O. Box 8138, GR 57001 Thessaloniki, Greece
4
Environmental Protection Department, Hong Kong SAR Government, Hong Kong, China
*
Author to whom correspondence should be addressed.
Atmosphere 2019, 10(9), 535; https://doi.org/10.3390/atmos10090535
Submission received: 16 July 2019 / Revised: 16 August 2019 / Accepted: 6 September 2019 / Published: 10 September 2019
(This article belongs to the Special Issue Transport Emissions and the Atmosphere)

Abstract

:
Heavy-duty diesel trucks (HDDTs) comprise a key source of road transport emissions and energy consumption worldwide mainly due to the growth of road freight traffic during the last two decades. Addressing their air pollutant and greenhouse gas emissions is therefore required, while accurate emission factors are needed to logistically optimize their operation. This study characterizes real-world emissions and fuel consumption (FC) of HDDTs and investigates the factors that affect their performance. Twenty-two diesel-fueled, Euro IV to Euro VI, HDDTs of six different manufacturers were measured in the road network of the Hong Kong metropolitan area, using portable emission measurement systems (PEMS). The testing routes included urban, highway and mixed urban/highway driving. The data collected corresponds to a wide range of driving, operating, and ambient conditions. Real-world distance- and energy-based emission levels are presented in a comparative manner to capture the effect of after-treatment technologies and the role of the evolution of Euro standards on emissions performance. The emission factors’ uncertainty is analyzed. The impact of speed, road grade and vehicle weight loading on FC and emissions is investigated. An analysis of diesel particulate filter (DPF) regenerations and ammonia (NH3) slip events are presented along with the study of Nitrous oxide (N2O) formation. The results reveal deviations of real-world HDDTs emissions from emission limits, as well as the significant impact of different operating and driving factors on their performance. The occasional high levels of N2O emissions from selective catalytic reduction equipped HDDTs is also revealed, an issue that has not been thoroughly considered so far.

1. Introduction

Heavy-duty diesel truck (HDDTs) comprise a key source of road transport emissions and energy consumption worldwide, mainly due to the growth of road freight traffic during the last two decades. Indicatively, the European road freight transport activity increased by 11.8% from 2013 to 2017 [1]. This sector of transport activity is expected to further rise in the near future having a crucial role in serving the overall freight system [2]. In terms of the global trucks’ fleet, according to the International Organization of Motor Vehicle Manufacturers, the global production of heavy trucks increased by 21% from 2016 to 2018 [3].
With respect to emissions, a common observation across different regions around the world is that the share of trucks’ emissions to the respective regional emissions inventories is significant and disproportionate to their activity. Indicatively, medium and heavy-duty trucks account for 23% of total Green House Gas (GHG) emissions from the transportation sector in the US [4], and around 17% of GHG emissions and 21% of Nitrogen oxides (NOx) emissions from road transport in the U.K., with a share of just 5% of the total vehicle miles traveled [5]. In the European Union (EU), although heavy-duty vehicles (HDVs) represent only 4% of the on-road fleet, they are responsible for 30% of on-road carbon dioxide (CO2) emissions [6]. In Hong Kong (HK), medium and HDDTs are associated to the major NOx and particulate matter (PM10) shares in the respective vehicle emission inventory (2017), exhibiting a contribution of 28% and 37%, respectively, even though they only account for 6% of the total vehicle population and 10% of the total annual vehicle kilometers traveled. From an energy consumption point of view, freight trucks correspond to the largest share of total energy use in freight transportation, approximately 60% of the overall share of all freight transport modes, although they account only for 20% of the total global tonne-kilometers [7,8]. Road freight vehicles are also the main source of global oil demand with a share of 20% [8]. In this context, the qualification and quantification of HDDTs emissions, including GHG gases, is necessary in order to reduce their emissions in an effort to improve air quality, reduce their energy consumption, and logistically optimize their operation.
Several studies have been conducted to examine the emission performance of diesel engines and trucks. A number of experimental methods, such as remote sensing, dynamometer, vehicle chasing, etc., have been used thus far to characterize emissions from HDDTs. Portable Emission Measurement Systems (PEMS) are a relatively new alternative that offers a robust option for detailed characterization of real-world emissions. The main advantage of PEMS is that they allow for studying the effect of several variables (traffic conditions, road grade, weather, etc.) on emissions, which are not easy to study otherwise. Wu et al. (2012) [9], collecting on-road PEMS emission data from 135 heavy-duty diesel vehicles (including 55 buses and 80 trucks) in Beijing, found that the on-road NOx emissions for Euro II and Euro III diesel vehicles were 20–70% and 60–130% higher than the respective emission limits. Huo et al. (2012) [10], using PEMS, measured 175 diesel trucks (from Euro 0 to Euro IV) in five cities in China (Beijing, Xi’an, Shenzhen, Jinan, and Yichang). Although the emission levels of hydrocarbons (HC), carbon monoxide (CO), and PM2.5 decreased with the emission standards stringency, NOx exhibited a different behavior. Particularly, they found that the NOx emission levels of the Euro II light and heavy-duty diesel trucks were 6% and 3% higher, than that of Euro I, respectively, while the emission levels of Euro IV heavy duty diesel trucks were 35% lower than that of Euro III.
The somewhat abnormal NOx behavior has also been observed for some Euro V diesel vehicles. Fontaras et al. (2012) [11] tested one Euro V diesel truck with PEMS in the city of Milan and found that NOx exceeded the emission limit by four times over normal work conditions, while HC and PM levels were found within limits. Bertoa et al. (2016) [12] tested a Euro V HDV with Selective Catalytic Reduction (SCR) after-treatment also using PEMS, under different driving conditions with a large share of urban operation, and found that NOx emissions exceeded the respective Euro limit by four times. Thus, despite the evolution and the increasing stringency of the emission standards during the years and the use of more efficient after-treatment systems, vehicles exhibit NOx levels higher than the corresponding limits when driven in real-world conditions. However, the different behavior of the on-road NOx emissions has been observed with the introduction of the Euro VI standard. Grigoratos et al. [13] measured on-road PEMS emission data from five Euro VI HDVs (including four trucks and one bus) with diesel oxidation catalyst (DOC), diesel particulate filter (DPF), SCR, and ammonia slip catalyst (ASC) over a route that contains urban, rural and motorway parts, and found that only one vehicle exceeded the Euro VI engine certification NOx limit by a factor of 1.7.
The aim of this study is to comparatively characterize real-world pollutant emissions and fuel consumption of HDDTs in a multi-fold manner. To that end, 22 diesel-fueled, Euro IV to Euro VI, HDDTs of six different manufacturers were measured in the road network of the wider Hong Kong metropolitan area. The study provides a set of estimated emission factors for HDDTs under the real-world driving and operation conditions of a metropolitan urban road network. The uncertainty associated with these EFs is also estimated and analyzed. The effect of alternative combinations of after-treatment technologies, as well as of the evolution of Euro standards on the emissions performance of HDDTs is studied. The investigation is also extended to DPF regenerations and ammonia slip events, related to the SCR operation. The N2O emission levels is another issue of interest. The effect of different factors, such as speed, road grade, and vehicle weight loading on emissions and fuel consumption is also examined. The scope of the study is to provide the necessary emission factors input for estimating emission inventories in metropolitan areas, and also to present some useful insights with respect to the impact of several factors on the fuel consumption and emissions performance of HDDTs, as a valuable modeling input for future micro- or meso-scale modeling efforts.

2. Experiments

2.1. Vehicles’ Specifications

The sample of the vehicles under study included 22 HDDTs. The vehicles originated from six different manufacturers and were certified under, either the Euro IV, the Euro V, or the Euro VI emissions standard. Each vehicle was supplied with a combination of the following individual after-treatment technologies: DOC which mostly addresses HC, CO, and PM, DPF, mostly for PM and subsequently for CO and HC, two emission control options for NOx, namely Exhaust Gas Recirculation (EGR), and SCR.
Table 1 presents the main specifications of the sample vehicles. The odometer readings of the vehicles varied from 490 to 566,751 km, corresponding to a physical average age of 4.1 years, varying from one to nine years. The average weight, including all measurement devices and the driver, was 14,431 kg, ranging from 10,420 kg to 26,710 kg.

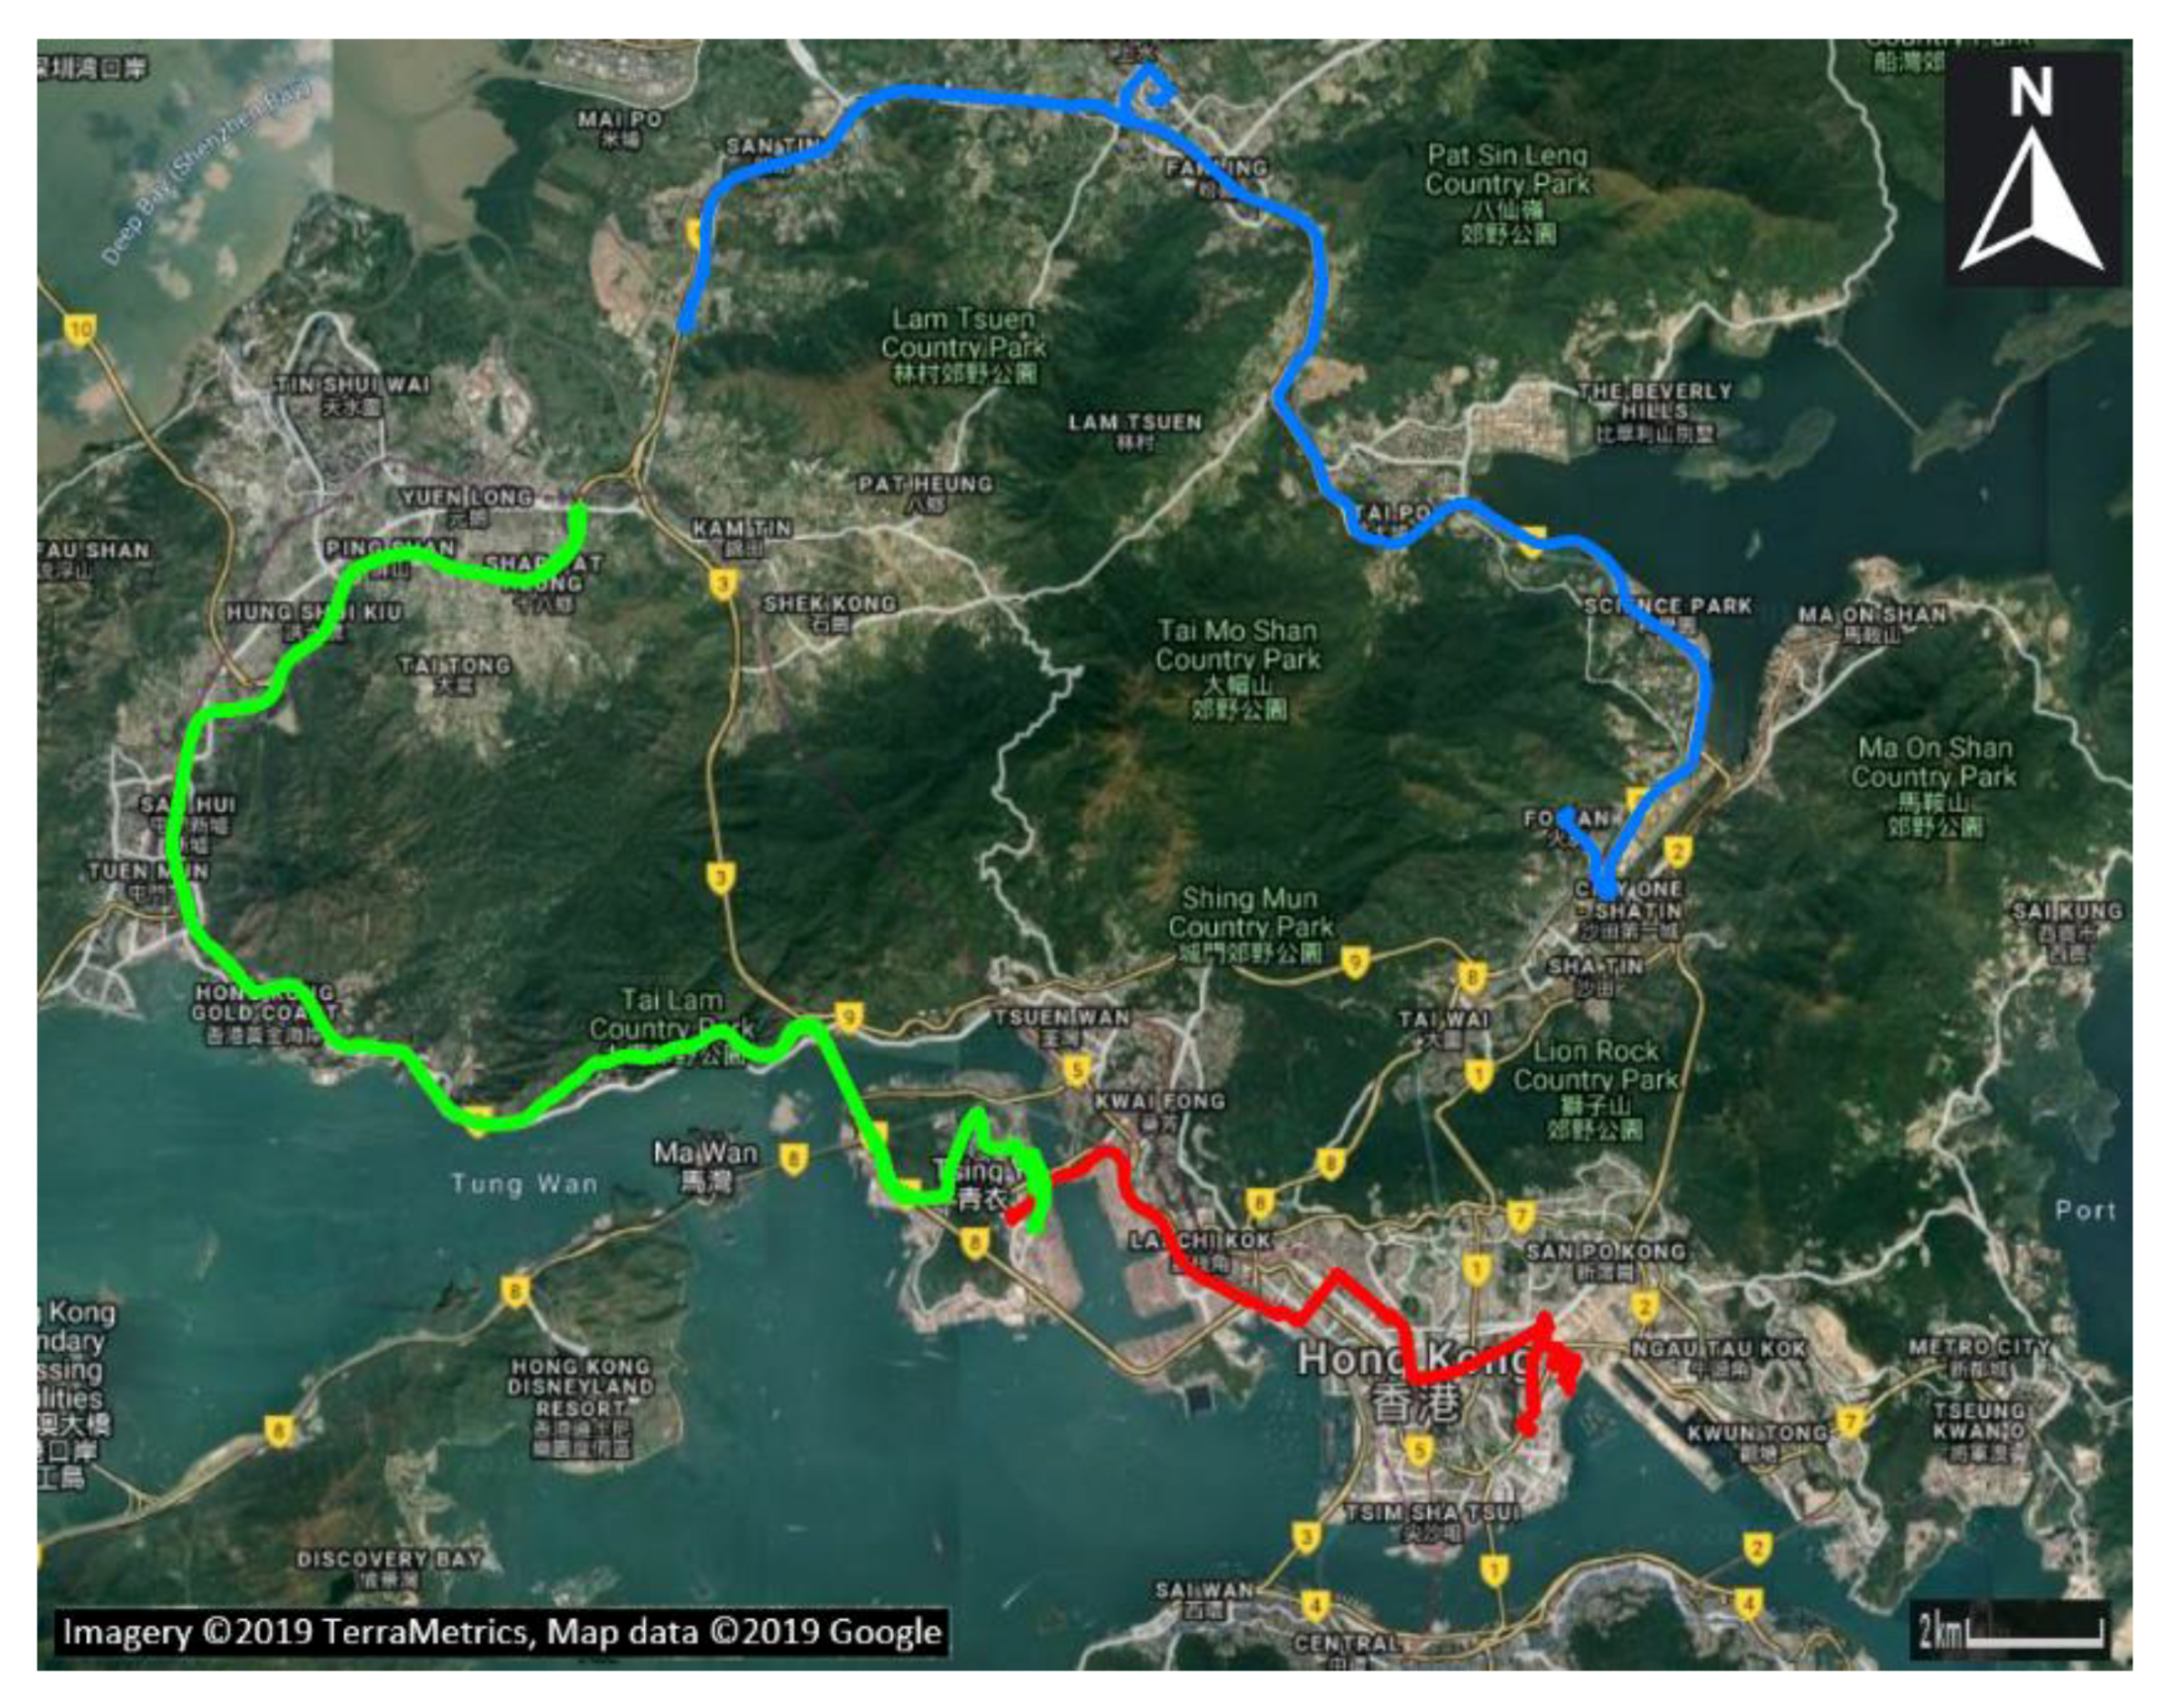
2.2. Testing Routes and Conditions

The experimentation was conducted during the period from 2011 to 2018 and included a mix of free driving and fixed routes in the wider metropolitan area of HK, comprising a combination of urban, rural and highway driving. Three indicative test routes are presented in Figure 1. Tests were spread over different weekdays and hours of the day to cover a range of typical busy morning and early afternoon conditions, as well as afternoon rush hours. Trips were also spread over all seasons of the year. As a result of the driving conditions mix, the available emissions data correspond to a wide range of driving, operating, and ambient conditions. The average duration of a trip included approximately one hour of PEMS measurements (the one-hour testing duration was selected due to data management and technical/measurement reasons). The average distance traveled per trip was 44.5 km.
Table 2 presents the test conditions for each vehicle category. Since the tests were performed on the road under real-driving conditions, there are normal differences between, and also within, the various vehicle categories. In general, we observe that the mean power, calculated by the equation of motion and input from the driving conditions (Appendix B), is much lower than the rated power, even if a number of demanding trips momentarily reach the rated power. An explanation behind this observation is that the respective regulations in HK require a maximum speed of 70 km/h for any vehicle weighing over 5.5 tn. To check that power demand is correctly calculated, and by estimating fuel based on the carbon balance method [14], we have estimated an average powertrain efficiency of 35.1% ± 4.7%, which appears rational for HDDTs under these sub-optimal driving conditions. One interesting observation in Table 2 is that exhaust gas temperature generally increases with technology improvement, presumably to retain high efficiency in the after-treatment devices.

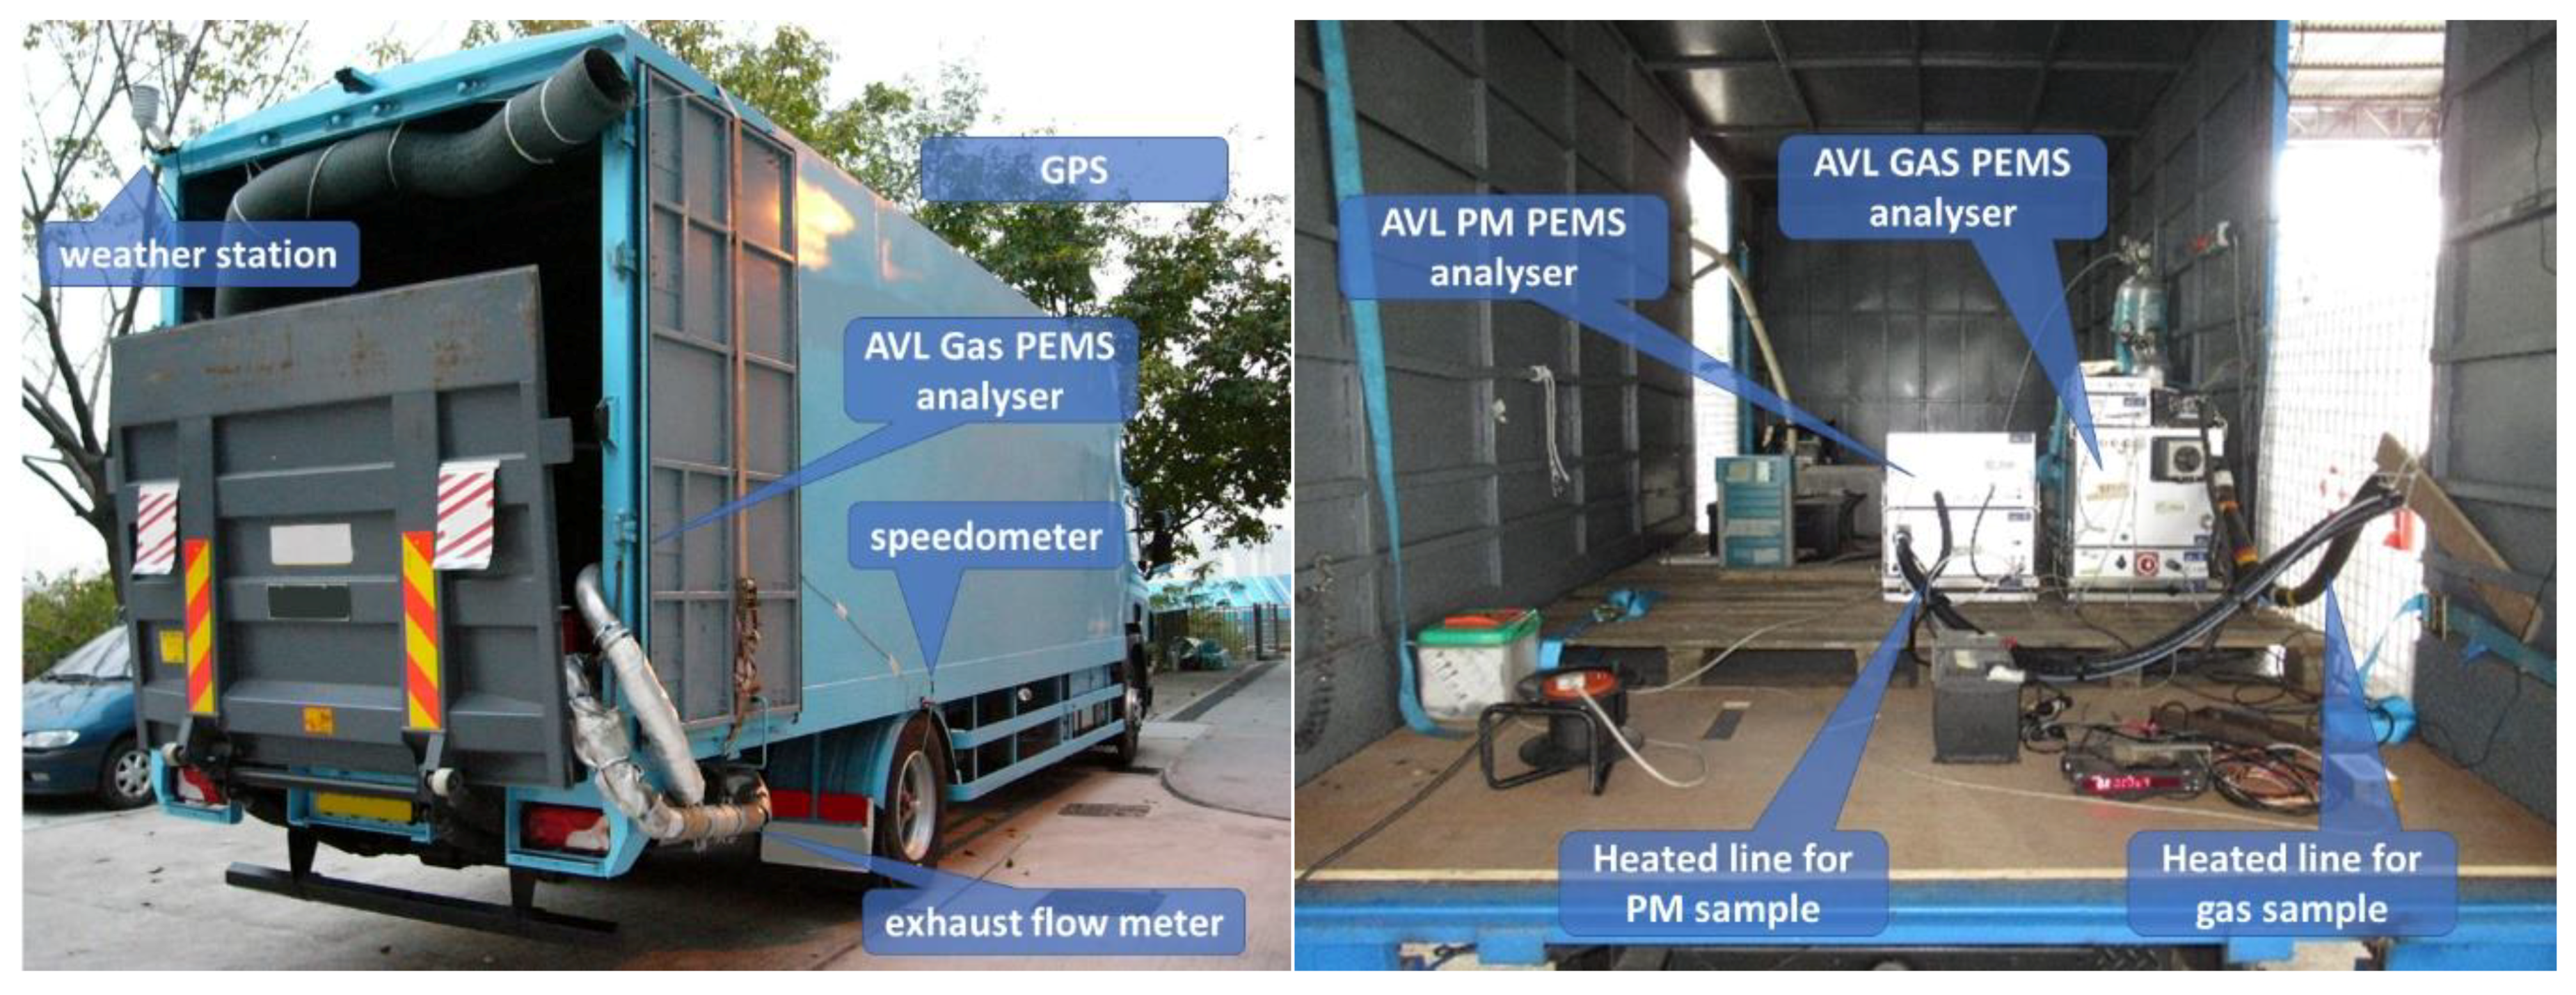
2.3. Instruments and Procedures

A SEMTECH-DS (Sensors, Inc., Saline, MI, USA) or an AVL M.O.V.E. GAS PEMS (AVL List GmbH, Graz, Austria) was used to measure regulated gaseous emissions (Figure 2), i.e., CO, CO2, nitrogen monoxide (NO), nitrogen dioxide (NO2), and total hydrocarbons (THC). A portable Fourier-Transform Infrared Spectroscopy (FTIR) analyzer (A&D Technology Inc., Ann Arbor, MI, USA) was used for the measurement of non-regulated pollutants, including ammonia (NH3) and nitrous oxide (N2O). A SEMTECΗ EFM-2 or EFM-HS flowmeter (Sensors, Inc., USA) was employed to measure the exhaust flowrate. Location and altitude parameters were recorded using a global positioning system (GPS) and dead reckoning system. Engine operation parameters were recorded using the on-board diagnostics (OBD) port and an external engine speed sensor, whenever this was possible. An external speedometer (Peiseler GmbH, Remscheid, Germany) was installed on one of the vehicle’s rear wheels to independently measure traveling speed. The thermocouple positioned at the PEMS flowmeter was also user to record the exhaust gas temperature.
The tests were conducted following international guidelines in terms of PEMS analyzers setup, calibration, and auditing (subpart J of part 1065 of Title 40 of Code of the Federal Regulations published by US EPA [15] and ISO16183 [16]). Data quality was maintained by ensuring calibrations were up-to-date, and by following pre-test and post-test procedures as described in more detail in Keramydas et al. [17] and Smit et al. [18].

3. Results and Discussion

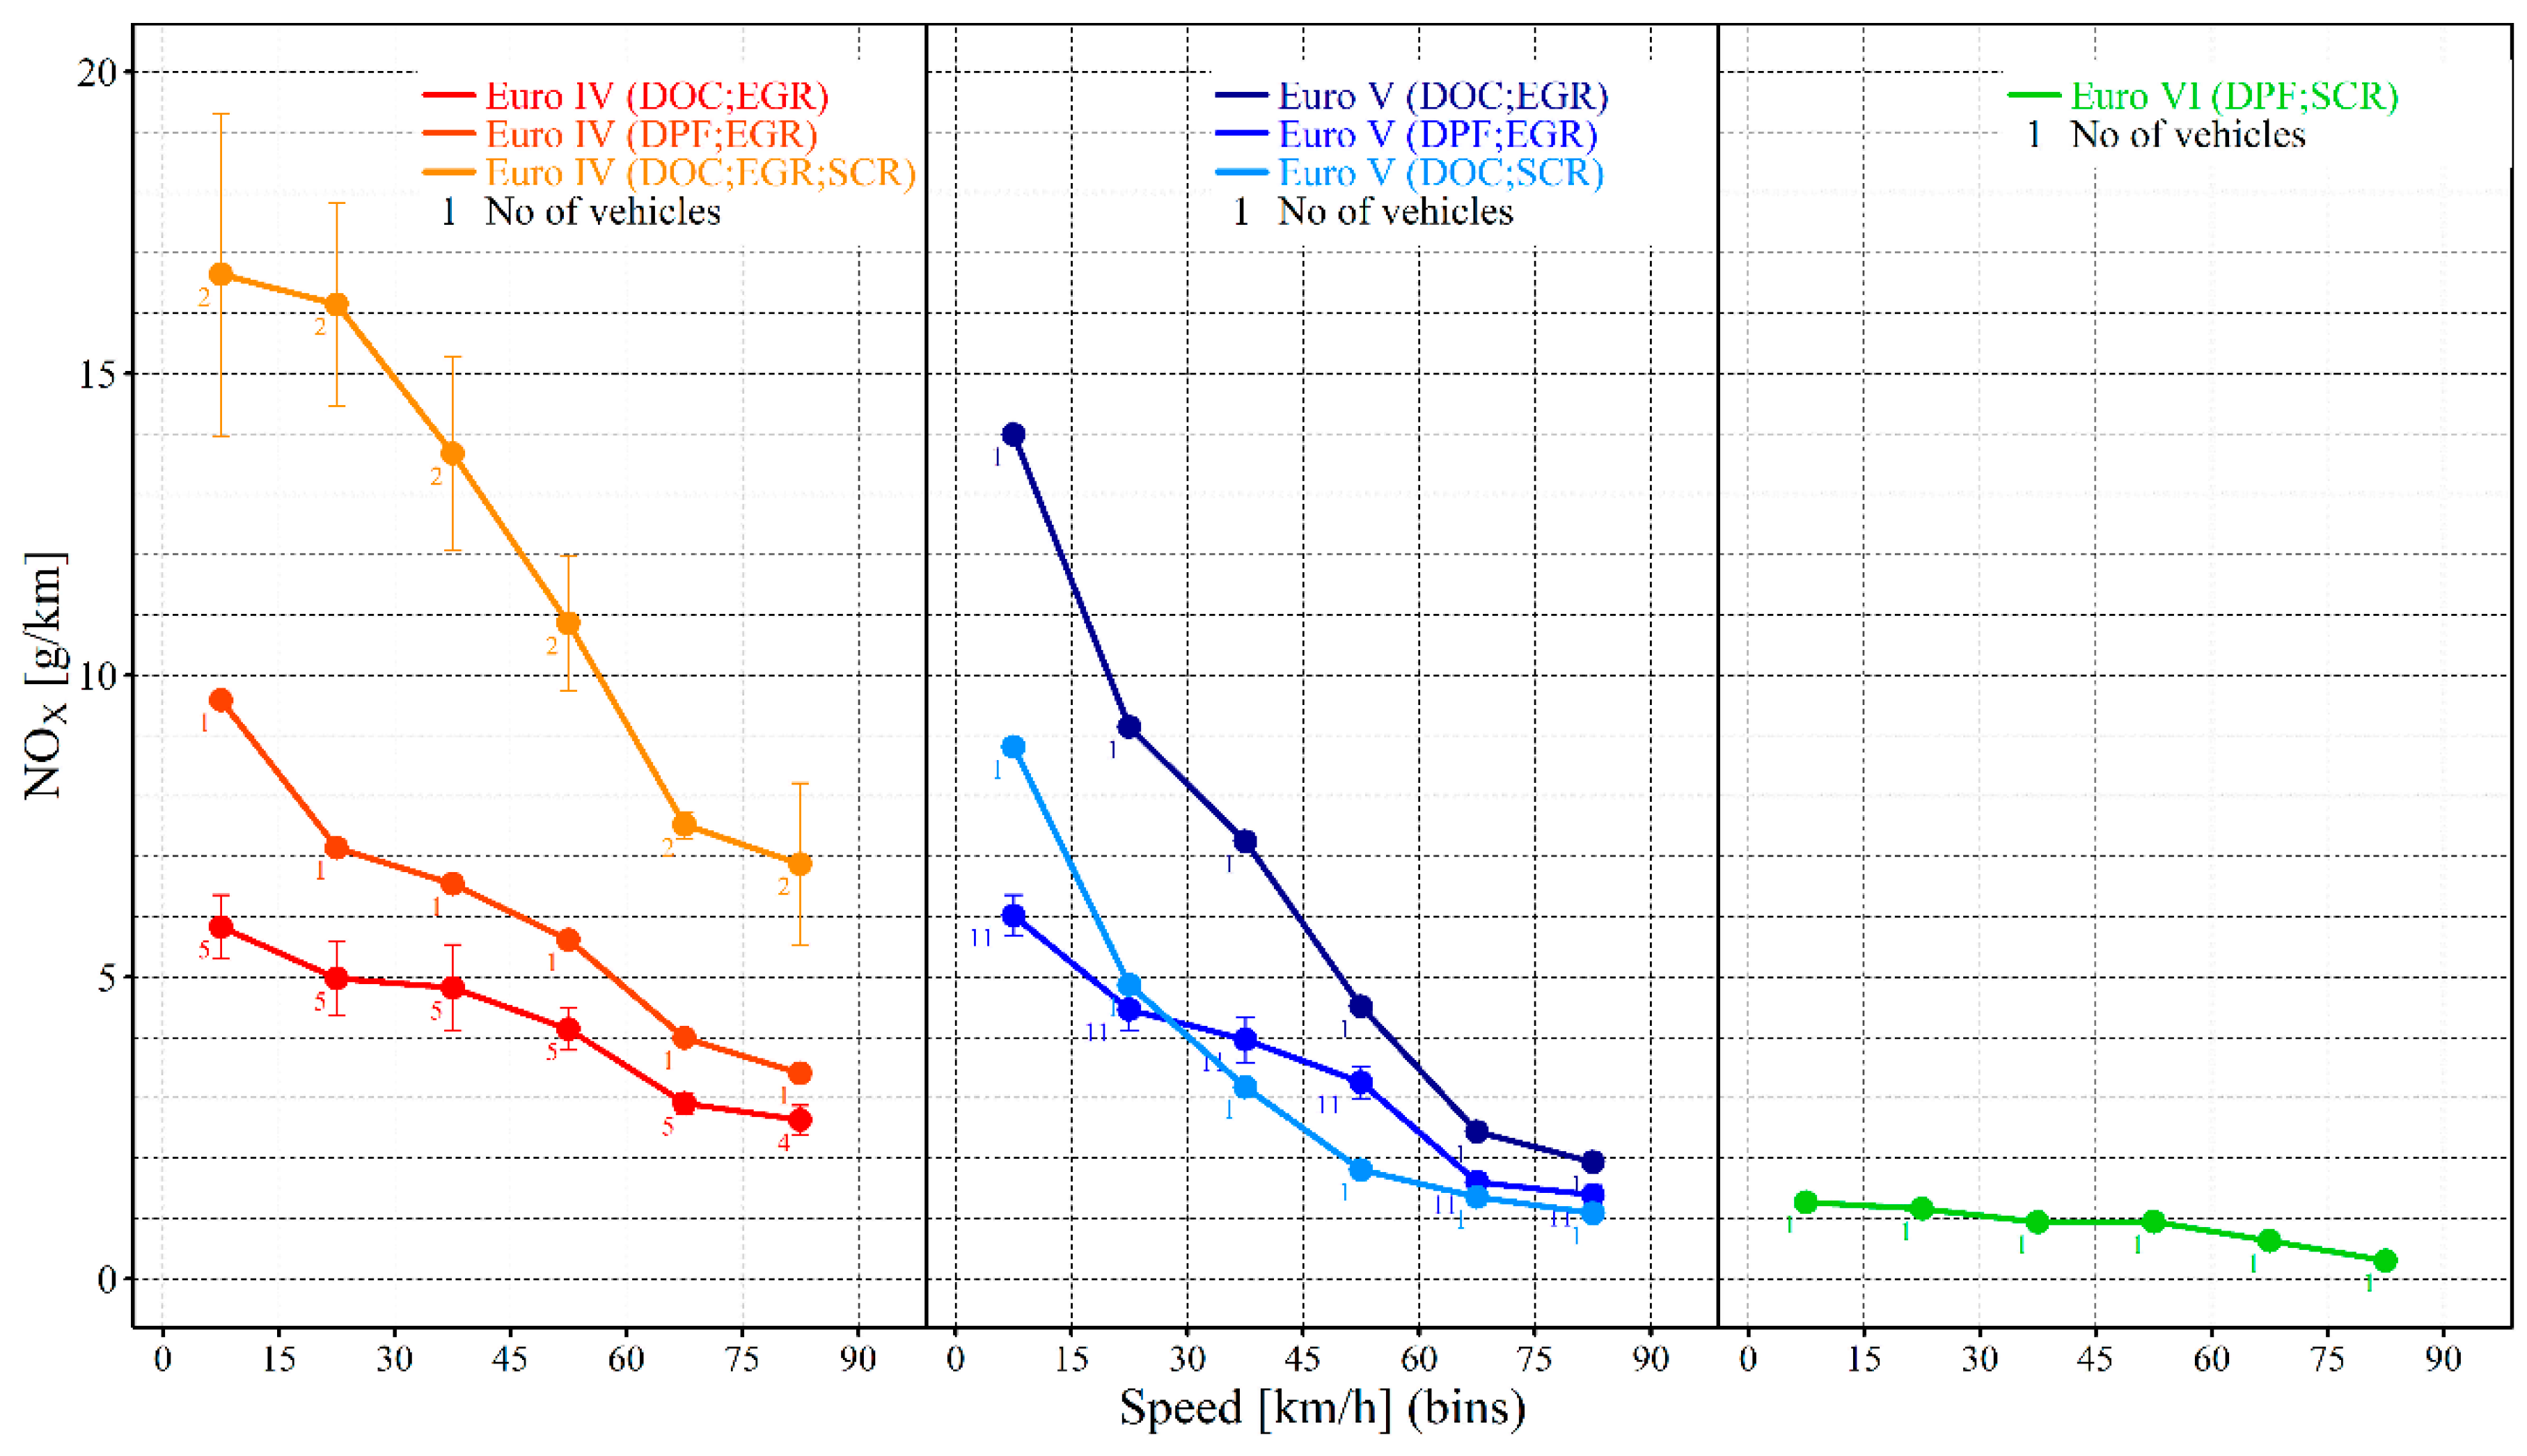
3.1. Emissions of Regulated Pollutants

The NOx distance-based fuel consumption levels as a function of speed for the different Euro standards and emission control technologies are depicted in Figure 3. Singular emission values over speed were based on respective 500 m distance-integrated driving sequences data and these were then binned to 15 km/h-classes of average speed. In Figure 3, dots represent the average NOx levels for the (n) number of vehicles falling into this particular bin. The error-bar ranges correspond to the standard error limits (average ± standard error) of these (n) values. A monotonic decrease in emissions with speed is observed, indicating the clear effect of speed.
Figure 3 leads to some interesting observations. First, Euro VI appears by far the cleanest technology, even at very low urban speeds. Actually, it is much cleaner than the SCR-equipped Euro IV and V trucks, especially at the low-speed region, depicting a much better performance of late SCR systems compared to earlier ones. The second observation relates to the clear difference in emission performance depending on emission control technology. This obviously has to do with the overall emission control calibration. For example, in the Euro V case SCR vehicles appear as the best performers for most of the speed range while in Euro IV, SCR+EGR vehicles appear as the overall worst performers. Large differences also appear between different models with EGR systems. Actually, differences between EGR equipped vehicles within the same standard are larger than differences between Euro IV and V.
Comparing energy-based emission levels with corresponding emission limits indicated that all vehicle classes except Euro VI exceed the limit to a certain degree. Euro VI emission levels are on par with the limit, with slight variation according to speed bin considered. Such differences can be justified by the difference in driving conditions. The calculated emission levels in g/kWh for each vehicle group, along with the respective Euro standard limits, are presented in Table 3. An interesting observation is that the Euro V (DOC, EGR) and (DPF, EGR) vehicles exhibit higher NOx emission level ratios, i.e., ratio of the calculated emission levels over the respective Euro standard limits, than the respective Euro IV vehicles of similar after-treatment technologies. Overall, the results provide a useful insight into the significant deviations between real-world driving emissions and the legislative limits employed for the Euro certification of vehicles.
The distance-based emission levels of PM, THC, CO pollutants, and fuel consumption (FC) over speed are presented in the Appendix A (Figure A1, Figure A2, Figure A3 and Figure A4).
The respective energy-based emission levels, calculated as the median of the corresponding speed-bin values, and the associated Euro standard limits are presented in Figure 4 (n.a. denotes vehicle classes where no measurements/data were available). PM emission levels for Euro IV vehicles and the Euro V (DOC, SCR) one are above the respective regulatory limits (Euro IV: 0.03 g/kWh, Euro V: 0.03 g/kWh, Euro VI: 0.01 g/kWh). The Euro V (DPF, EGR) vehicle was measured below the limit. Euro IV (DOC, EGR) vehicles have the highest PM emission levels, whereas the Euro V (DPF, EGR) vehicles have the lowest ones, but very close to the PM emissions of Euro IV vehicles of similar technology. In both Euro classes, the DPF-equipped vehicles appear to have lower emissions than the respective DOC-equipped ones.
THC emission levels for all vehicle categories are below the respective regulatory limits for NMHC (Euro IV: 0.55 g/kWh, Euro V: 0.55 g/kWh Euro VI: 0.16 g/kWh). Euro IV (DPF, EGR) vehicles have the highest emission levels, whereas the Euro VI vehicle exhibits the lowest ones.
As regards CO emissions, an interesting observation is that in both the Euro IV and Euro V categories, the ranking of the groups in terms of CO emissions is similar, as follows (higher to lower emissions): (DOC, SCR), (DPF, EGR), and (DOC, EGR). CO emission levels for all vehicle categories, but Euro IV (DOC, EGR, SCR), are below the respective regulatory limit (Euro IV, V, and V: 4.00 g/kWh). The CO emissions-to-limit ratio range from 0.08 to 0.49 and only the emissions of the Euro IV (DOC, EGR, SCR) vehicles are 1.7 times as high as the Euro standard limit.
The reasons for some exceedances of CO limits and some comparatively higher THC emission levels from some Euro IV vehicles are largely unknown and can only be hypothesized. Exceedances of limits for these pollutants are not necessarily associated with a malfunctioning emission control system, such systems are mostly there for NOx and PM reductions and not so much for CO or THC. In general, high CO and THC emissions on a diesel vehicle without DPF like one of the Euro IV categories showing high levels of these emissions may be caused by spray formation (e.g., worn or partly blocked injector) issues or faulty EGR operation and air metering. For DPF-equipped vehicles, emissions of such pollutants may also increase by high backpressure caused by the DPF. Some of these issues may be individual vehicle-specific, as vehicles age and wear out. This may also explain the high variability of emissions, especially for the Euro IV SCR-equipped vehicles.
Table 4 presents the comparison of the emission levels measured in this study to the ones of similar studies. Euro IV HDDTs in HK appear to be, more or less, at similar levels, except CO2 emissions, compared to the levels reported by Yao et al. [19] and Huo et al. [10] (Beijing and Jinan, China). All emissions of the Euro V vehicles in this study were measured to be lower than those reported by Fontaras et al. [11] (Milan Italy). This is possibly explained due to the significantly different speeds during testing (47 km/h in HK compared to 7 km/h in the tests at Milan). With regards to the Euro VI vehicles, the emissions of HDDTs in the current study appear to be at higher levels, except HC emissions, compared to the levels reported by Grigoratos et al. [13]. The comparison with the work of Heinje et al. [20] indicated that the NOx emission levels of Euro VI vehicles in the current study were higher, and CO and THC emissions were significantly lower. As the experimental results of this kind of studies heavily depend on the driving, operating and ambient conditions during testing, one has to be aware of the respective experimental configurations when interpreting the results in a comparative manner.

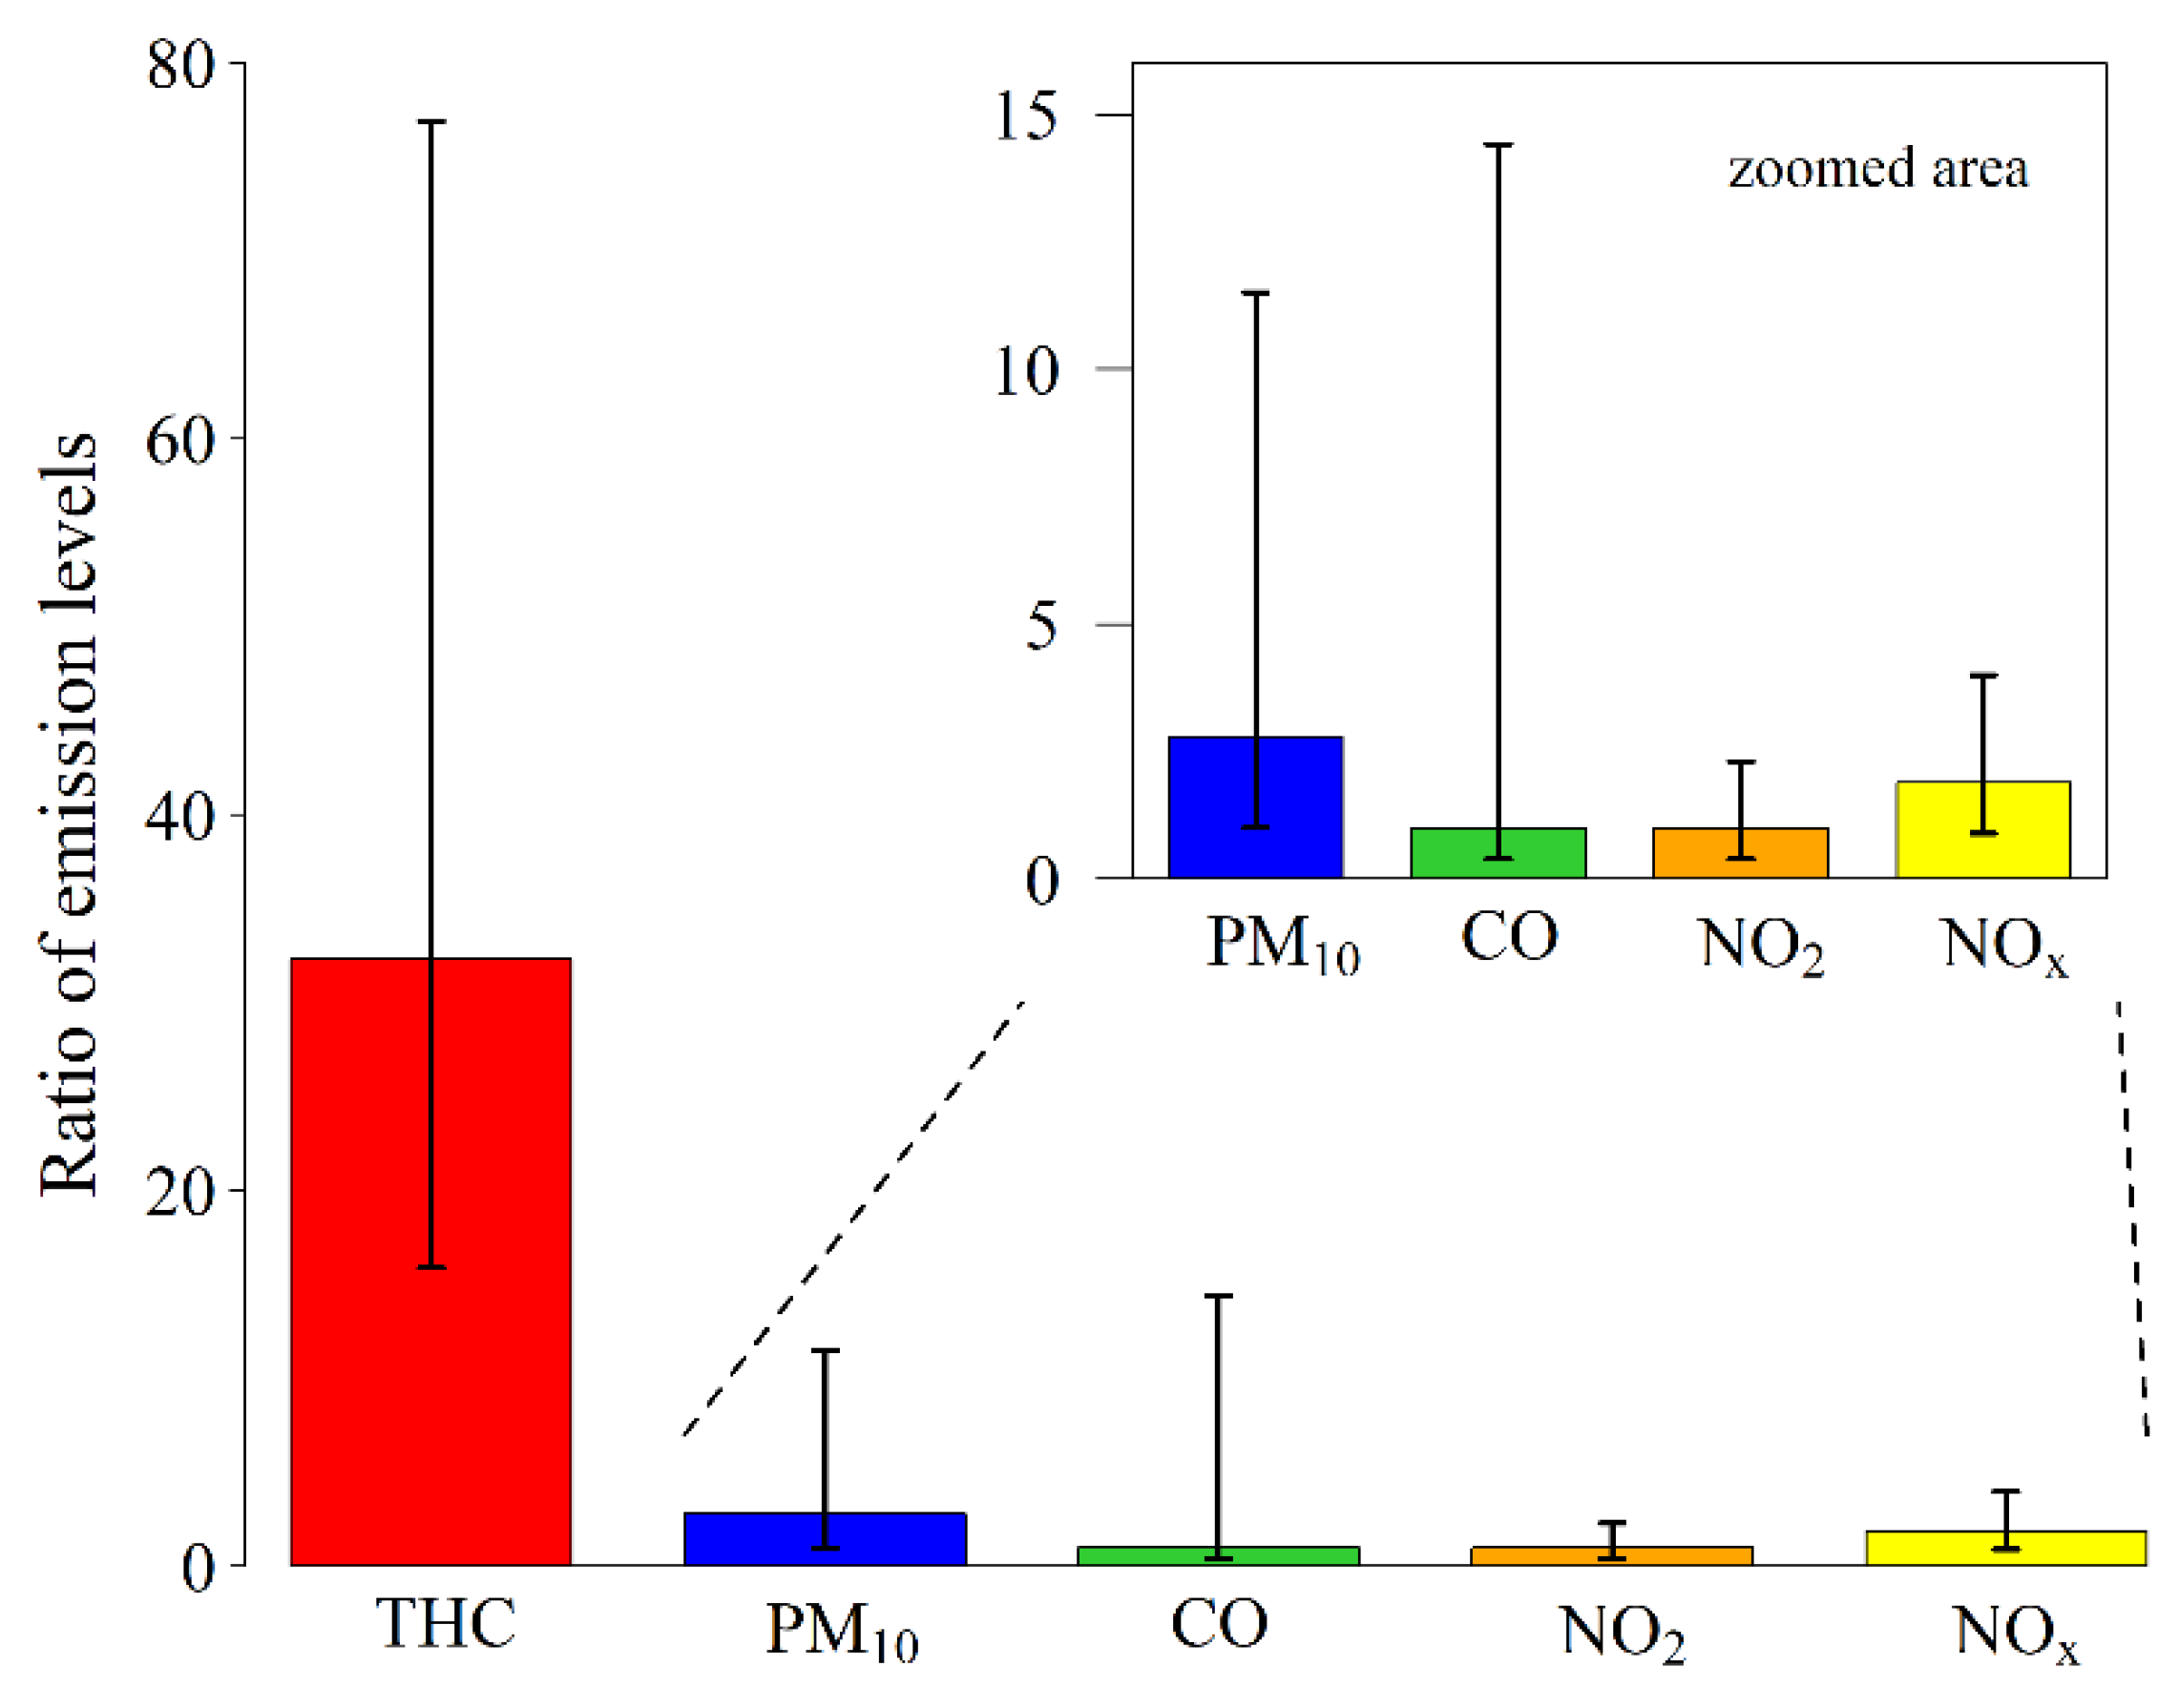
3.2. Variance of Emission Levels

The estimated variance of the mean emission level within each speed bin was calculated based on the unweighted mean, statistical approach (unweighted sum of squares—USS estimators) z to address differences among the sample sizes of the vehicles included in each vehicle class. The coefficient of variance (CoV) of the NOx emissions within each speed bin was calculated for the three vehicles classes which comprised two vehicles or more. The median values of the respective speed-bin CoV were 9%, 11%, and 9% for the Euro IV (DOC, EGR), Euro IV (DOC, EGR, SCR), and Euro V (DPF, EGR) vehicle classes, ranging from 3% to 19% for the different bins.
A random-effects analysis-of-variance (ANOVA) procedure was employed [21,22] to assess the impact of factor individual vehicle on emissions, i.e., to investigate the contribution of variance between vehicles and variance within vehicles to the calculated uncertainty of the emission factors. The analysis was applied to Euro IV (DOC, EGR) and Euro V (DPF, EGR) vehicle classes as these classes included five and 11 vehicles respectively, thus providing a satisfactory sample size to extract some reliable results on the effect of individual vehicles—within a given vehicle class—on emission factors. The results revealed that the impact of the individual vehicle factor on emissions is statistically significant (p-value= ~0.000 to 0.002) for both vehicle classes that were examined. The average contribution of the between-vehicles variance to the total variance within a speed bin, most commonly named as interclass ratio [23,24], was 8.7% (2.3% to 16%) and 15% (7.9% to 16%), respectively, for the two groups of HDDTs. As a reference value for comparative reasons, the respective values for CO2 emission levels were 7.3% (1.3% to 9.4%) and 6.4% (2.7% to 11.9%), respectively, lower than the corresponding NOx ones, indicating a more robust behavior of the different vehicles in CO2 performance. The within-vehicle variance due to factors (e.g., driving conditions) other than the vehicle differences, as well as randomness, seem to be the most important component of the total variability of the estimated emissions factors.

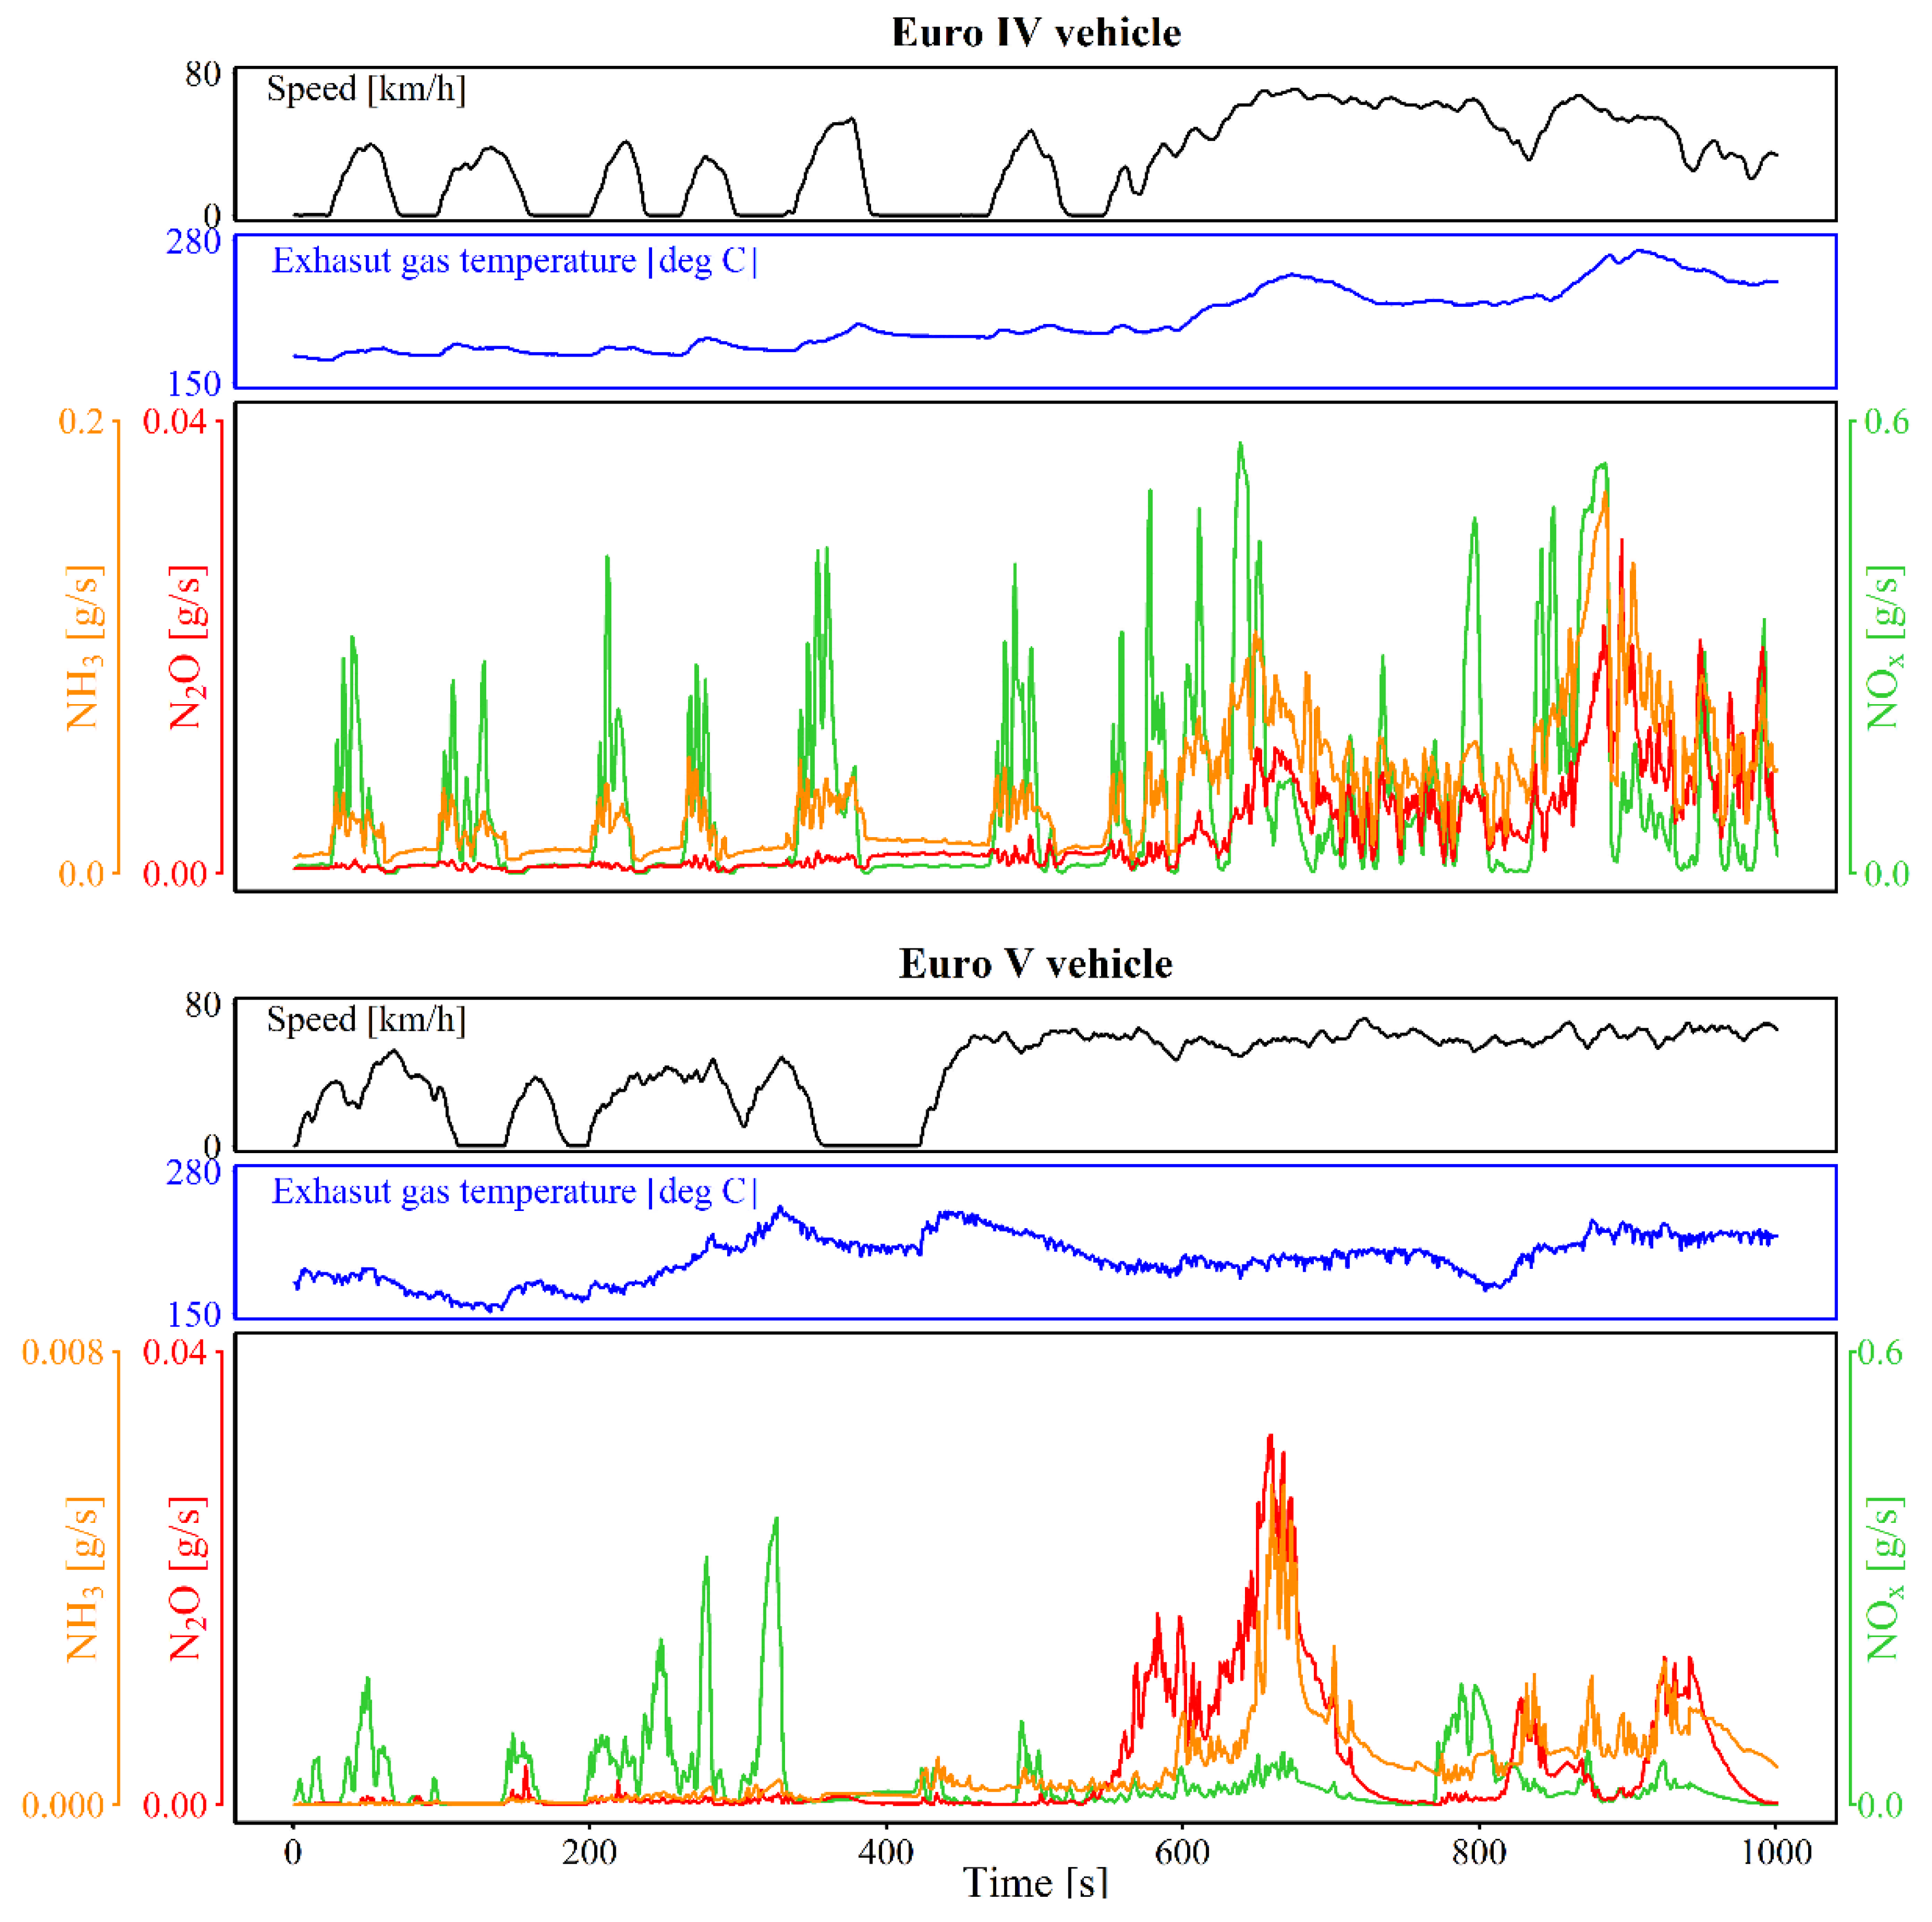
3.3. Emissions of Non-Regulated Pollutants

The available FTIR dataset included NH3 and N2O measurements for three vehicles, i.e., one Euro IV (DOC/EGR/SCR), one Euro V (DOC/SCR), and one Euro VI (DPF/SCR) vehicle. The instantaneous NH3 and N2O mean exhaust contents (ppm) and the respective 500 m driving sequences mean distance-based emissions levels (mg/km) along with the corresponding minimum and maximum values are presented in Table 5.
The instantaneous NH3 exhaust content for the Euro IV vehicle was above the respective Euro VI provisions for heavy-duty engines, i.e., an ammonia concentration limit of 10 ppm [25]. Average NH3 exhaust contents for the Euro V vehicle were marginally higher than this limit, whereas the emissions for the Euro VI vehicle were significantly lower than the regulatory limit and mostly below the detection limit of the instruments.
N2O is a powerful greenhouse gas with a high 100-years global warming potential (GWP100, N2O = 265), albeit not regulated thus far by the EU. In this study, two of the vehicles, i.e., the Euro IV and Euro V trucks, could be characterized as high N2O emitters, as the respective CO2 equivalent emissions of N2O contributes approximately an additional 11% and 14%, respectively, to the corresponding total greenhouse gases’ levels. The Euro VI vehicle appears to be a low emitter with the respective contribution limited to 2.3%.
The three vehicles belong to three different Euro technologies, but they are all equipped with an SCR system. Despite the differences in their particular characteristics, and although NH3 and N2O are not yet regulated pollutants in the context of Euro standards, the results provide some evidence on the reduction of both NH3 and N2O emission levels for more recent technologies. This could be considered as an indirect index of the improvement of the respective SCR technologies over the years.
The N2O, NH3, and NOx emission mass rates and the exhaust gas temperature profiles of a trip excerpt example for a Euro IV and a Euro V HGV are illustrated in Figure 5.
In the top panel (Euro IV), we observe that there is a region of low NOX emissions where NH3 and N2O levels are high and also the temperature is high. This is shown to be assisted by the rather simplified urea injection strategy in this vehicle. Urea slip seems to be proportional to steady-state temperature and no ammonia slip is observed during transients, leading to peaking NOx emissions. This means that limited ammonia storage is possible on the particular catalyst, and this results in high ammonia slip and N2O formation.
On the Euro V vehicle (bottom panel), the performance is somehow different as N2O is mostly formed during accelerations and there is much less ammonia slip. It is obvious that a different ammonia injection strategy is used in this vehicle, seems as there is much more ammonia storage (ammonia profile does not follow speed profile), and this also affects N2O emissions. By comparing the two vehicles, the formation of these two components seems to be very much specific on catalyst type and SCR calibration.

3.4. DPF Regenerations’ Characteristics

A number of DPF regenerations were observed during the HDDTs’ testing campaign, originating from nine different vehicles. Table 6 presents the main characteristics for 19 representative regeneration cases (events that started and were completed during a single trip). THC emissions and exhaust temperature were the two quantities that appeared to be most affected by these events, exhibiting some extremely high levels during the regenerations, as presented in Figure 6 (regeneration events correspond to three different vehicles).
To obtain a view of the effect of regenerations on pollutant emissions, we calculated—for each regeneration and pollutant—the ratio of the distance-based emission level of the pollutant during the regeneration event over the respective emission level before the start of the event, i.e., at no regeneration conditions, and at the same average speed. As the respective distribution of the ratios (per pollutant) was significantly skewed for some of the pollutants, e.g., CO, including both very low and very high values, Figure 7 presents the median value of these ratios along with the respective 10th and 90th percentiles. THC levels during the regeneration were 32 times as high as the levels under no regeneration conditions. However, the effect of DPF regeneration on NOx and CO is less significant or less clear, respectively, compared to THC emissions. NOx emissions during the events were found to be higher than the respective ones under no regeneration conditions by a factor of 1.9. CO emissions exhibit a mixed performance as both increasing and decreasing trends were observed, CO emissions during regenerations were measured to be at similar levels as before regenerations (median = 1), but also a few high ratio values were observed. PM emissions during regeneration were measured to be 2.8 times as high as the respective levels before regeneration. DPF regeneration seems to impact the rather low-level THC emissions and also PM emissions.
NO2 may be used towards the oxidization of the particles trapped inside the DPF. The median value of the ratios of the NO2 emission levels during the regeneration process over the respective levels before the regeneration is also presented in Figure 7. NO2 levels during the regeneration are similar (median = 1.0) to the levels before the process begins, which is suggestive of mostly O2-led regeneration rather than NO2-one.

3.5. The Impact of Road Grade on Emissions and Fuel Consumption

Based on the 500 m integrated data, Figure 8 illustrates the impact of road grade on NOx emissions and fuel consumption levels. Three generic classes of road grade were examined, namely (i) flat road driving (road grade between −0.5% and +0.5%), (ii) uphill driving (road grade > +0.5% and up to +6%), and (iii) downhill driving (road grade < −0.5% and down to −6%). NOx emissions and FC for the uphill and downhill driving modes are expressed as ratios over flat driving (reference level). As emissions and FC were initially calculated per speed bin to eliminate the impact of speed on the outcomes, Figure 8 depicts the median value of the respective speed bin ratios.
A monotonical increase of NOx emissions and FC with road grade is observed for uphill driving, with a few exceptions mostly due to small sample sizes, particularly for the Euro VI category (one vehicle was tested). Similarly, a monotonical decrease was observed for the downhill driving mode. Interestingly, the impact of road grade on NOx emissions and FC appears to be quite consistent among the different vehicle categories. The average uphill driving NOx emissions may range from 1.07 (road grade: 0.5–1%) to 3.35 (road grade: 5–6%) times the respective flat road levels, whereas FC may range from 1.23 (road grade: 0.5–1%) to 2.57 (road grade: 5–6%) times the respective flat road levels. The impact of road grade on FC is more consistent than the one on NOx emissions. No clear conclusions can be drawn with respect to CO, THC, and PM emissions in terms of the systematic impact of road grade on these pollutants.
The different NOx pattern of the Euro VI vehicles, compared to previous technologies, as road gradient increases may have to do with their SCR operation. The Euro VI vehicle was equipped with an SCR device. In general, the SCR efficiency drops above the optimum range of 250–350 °C. The average temperature at the tailpipe was at 260 °C over these high gradient driving conditions, suggestive of temperatures that can exceed 350 °C at the SCR. Therefore, high engine-out NOx emissions at such high load conditions and the compromised performance of the SCR due to high temperatures seem probable reasons for this significant increase in NOx only at this highest road gradient case.

3.6. The Impact of Loading on Fuel Consumption and Emissions

Ten of the vehicles were measured under different weight loadings, i.e., 30%, 50% (half truckload, HTL), and 100% (full truckload, FTL) of their payload (average payload ~ 6t). A fixed route was selected for each truck and all measurements were conducted on this specific route to ensure similar testing conditions for the trips of different loadings. The 30% loading setting was considered as the reference loading, thus the average FC (L/100 km) and the average distance-based NOx and PM emissions (g/km) for the HTL and FTL cases were expressed as a ratio over the corresponding 30% reference values. The one-way repeated-measures ANOVA was employed to check for the statistical significance of the effect of the factor weight loading on emissions and FC (a = 5%). The bar plots of Figure 9 present the average emissions and FC ratio of all ten vehicles for the different loading classes. The error bars correspond to the respective ± one standard deviation limits.
The impact of loading found to be statistically significant for NOx emissions and FC (p-value = 0.002 and <0.001). The effect of loading on PM emissions found to be statistically non-significant (p-value = 0.111). The notable differences in PM emissions that were observed between the sample vehicles, as also indicated by the respective error bars, seem to affect these outcomes.
The results reveal a positive correlation of loading with fuel consumption and emissions. NOx emissions were observed to increase by 7.8% on average for the HTL setting (ratio range from 0.93 to 1.28) and by 23% on average for the FTL setting (ratio range from 1.13 to 1.42), compared to the respective 30% reference loading values. PM emissions were observed to increase by 16% on average under the HTL setting (ratio range from 0.37 to 1.83) and by 29% on average under the FTL one (ratio range from 0.78 to 1.77), also compared to the 30% loading setting. Fuel consumption measured to be 6.3% higher, on average, under the 50% loading (ratio range from 0.99 to 1.12) and 15% higher, on average, under the 100% loading (ratio range from 1.04 to 1.24) compared to the respective 30% loading values.

4. Conclusions

In this study, 22 heavy-duty diesel trucks of different euro standards (Euro IV, Euro V, and Euro VI) and combinations of emission control technologies (DOC, DPF, EGR, SCR) were tested using PEMS in the metropolitan urban road network of Hong Kong.
The speed factor seems to both significantly and non-linearly affect NOx emission levels. All vehicle categories appeared to exceed the respective NOx regulatory limits, except the Euro VI vehicle, which appeared to emit within limits for most of the driving conditions (except at road grade above 6%). NOx, as well as, CO, THC, and PM emission factors (g/km) appeared to have a negative correlation with speed, across the speed range that was examined, with very few exceptions. A similar trend has been also observed in previous studies on HDDTs. All the vehicle classes that were measured in this study complied with the respective THC Euro standard limits. This was also the case for CO emissions, with the exception of the Euro IV (DOC, EGR, SCR) HDDTs class. With respect to PM emissions, only one class out of the four that were measured, i.e., the Euro V (DPF, EGR) HDDTs, appeared to comply with the respective Euro limits.
NH3 concentrations were marginally higher or lower than the respective Euro VI regulation provisions for two of the vehicles for which FTIR data were available, i.e., the Euro V and the Euro VI ones, respectively, but there was one Euro IV vehicle where ammonia reached almost 20 times as high as the respective regulatory provisions (applicable for Euro VI). N2O emissions (CO2 equivalent) contributed with a significantly high share of approximately 11–14% to the respective total greenhouse gases levels for two of the vehicles (Euro IV and Euro V).
Overall, the results provide some evidence on the significant deviations between real-world driving emissions and the legislative limits employed for the Euro certification of vehicles.
Road grade was another factor that seemed to clearly affect fuel consumption and emissions with a consistent impact across the groups of vehicles. Vehicle loading also appeared to have a significant impact on fuel consumption and NOx emissions.
DPF regeneration events, mainly affected THC, raising the average regeneration emissions at levels that are 12 times higher than in normal-state DPF THC emissions. The impact of the DPF regeneration on the NOx emissions requires further detailing, focusing on the individual character per vehicle.
The results of this study provide some valuable insights on the emission levels of HDDTs and the associated uncertainty, the emissions behavior of this class of vehicles and the main factors that have a role in this behavior, as well as the most significant events that affect their performance. The outcomes could be employed as an input in estimating emission inventories in metropolitan areas, and also in future micro- and meso-scale emissions modeling efforts. Finally, local authorities could also benefit from the outcomes, as they provide useful support for policy-making decisions.

Author Contributions

The contribution of the authors is summarized as follows: conceptualization, C.K., L.N., T.-S.L. and C.K.-L.W.; data curation, T.-S.L., K.-L.N., H.-L.A.W., and C.K.-L.W.; formal analysis, C.K., L.N., C.T., and G.P.; investigation, T.-S.L., K.-L.N., H.-L.A.W., and C.K.-L.W.; methodology, C.K., L.N., C.T., and G.P.; resources, T.-S.L., K.-L.N., H.-L.A.W., and C.K.-L.W.; software, C.K., C.T., G.P., K.-L.N., and H.-L.A.W.; validation, L.N., T.-S.L. and C.K.-L.W.; writing—original draft, C.K., L.N., C.T. and G.P.; writing—review and editing, C.K., L.N., C.T., T.-S.L., K.-L.N., and C.K.-L.W.

Funding

The study is implemented in the framework of the project entitled “Provision of Service for Analysing Vehicle Emission Data collected by Portable Emission Measuring Systems” (ref. #17-00778), commissioned by the Hong Kong Environmental Protection Department (HK EPD). The contents of this paper are solely the responsibility of the authors and do not necessarily represent official views of the Hong Kong SAR Government.

Acknowledgments

The authors are grateful for the data and the technical support provided by the Hong Kong Environmental Protection Department.

Conflicts of Interest

The authors declare no conflict of interest. The scientific officer of HK EPD and the authors from HK EPD were involved in the study as described in the Authors Contributions paragraph.

Appendix A

Figure A1, Figure A2, Figure A3 and Figure A4 present the mean distance-based emission levels for PM, THC, CO pollutants, and FC, respectively, along with with the corresponding ± one standard error limits. The results were obtained based on the 500 m driving sequences data. PM emissions were measured for a subset of the available HDDTs (classes and vehicles).
Figure A1. Sample mean and ± one standard error limits of the distance-based PM emission levels over speed (500 m driving sequences).
Atmosphere 10 00535 g0a1
Figure A2. Sample mean and ± one standard error limits of the distance-based THC emission levels over speed (500 m driving sequences).
Atmosphere 10 00535 g0a2
Figure A3. Sample mean and ± one standard error limits of the distance-based CO emission levels over speed (500 m driving sequences).
Atmosphere 10 00535 g0a3
Figure A4. Sample mean and ± one standard error limits of the distance-based FC levels over speed (500 m driving sequences).
Atmosphere 10 00535 g0a4

Appendix B

The instantaneous power was calculated by Equation (A1), which is detailed in Equation (A2):
P = P air + P rolres + P inertia + P grade + P aux
P = 1 2 ρ C d Av 3 + τ 0 gmv + [ m tare ( 1 + λ ) + m load ] va + mgvsin ( b ) + P aux
In Equation (A1), P is the total instantaneous power (W) required for vehicle traction and consumed by its auxiliaries, with the individual terms referring to different resistance factors, namely P air for aerodynamic, P rolres for tyre-road interaction, P inertia for inertial forces during accelerations, and P grade for gravitational resistance over road grades. P aux is the power consumed by auxiliaries, prominently by the A/C system. In Equation (A2), ρ is the air density (kg m−3; calculated by the ideal gas law and using the measured instantaneous ambient temperature and atmospheric pressure as inputs), C d is the aerodynamic drag coefficient, A is the frontal truck area, v is the vehicle speed (m s−1), τ 0 is the rolling resistance coefficient, g is the gravitational acceleration, m is the total vehicle mass comprising the tare mass of the vehicle ( m tare ) and the mass of and load ( m load ) . The term λ is stands for the equivalent inertia of rotational masses. sin ( b ) is the road grade.

References

  1. European Union. Road Freight Transport Statistics: Statistics Explained; Eurostat: Luxembourg, France, 2018. [Google Scholar]
  2. Engström, R. The Roads’ Role in the Freight Transport System. Transp. Res. Procedia 2016, 14, 1443–1452. [Google Scholar] [CrossRef]
  3. International Organization of Motor Vehicle Manufacturers. World Motor Vehicle Production. 2018. Available online: http://www.oica.net/category/production-statistics/2018-statistics/ (accessed on 25 May 2018).
  4. U.S. Environmental Protection Agency. Fast Facts: U.S. Transportation Sector Greenhouse Gas Emissions 1990–2016; Offce of Transportation and Air Quality: Washington, DC, USA, 2018.
  5. Department for Transport U.K. Freight Carbon Review 2017: Moving Britain Ahead; Department for Transport U.K.: London, UK, 2017.
  6. Muncrief, R.; Sharpe, B. Overview of the Heavy-Duty Vehicle Market and CO2 Emissions in the European Union; The International Council on Clean Transportation: Washington, DC, USA, 2015. [Google Scholar]
  7. U.S. Energy Information Administration. International Energy Outlook 2016; Office of Energy Analysis: Washington, DC, USA, 2016.
  8. International Energy Agency. The Future of Trucks: Implications for Energy and the Environment, 2nd ed.; International Energy Agency: Paris, France, 2017. [Google Scholar]
  9. Wu, Y.; Zhang, S.J.; Li, M.L.; Ge, Y.S.; Shu, J.W.; Zhou, Y.; Xu, Y.Y.; Hu, J.N.; Liu, H.; Fu, L.X.; et al. The challenge to NOx emission control for heavy-duty diesel vehicles in China. Atmos. Chem. Phys. Discuss. 2012, 12, 9365–9379. [Google Scholar] [CrossRef]
  10. Huo, H.; Yao, Z.; Zhang, Y.; Shen, X.; Zhang, Q.; He, K. On-board measurements of emissions from diesel trucks in five cities in China. Atmos. Environ. 2012, 54, 159–167. [Google Scholar] [CrossRef]
  11. Fontaras, G.; Martini, G.; Manfredi, U.; Marotta, A.; Krasenbrink, A.; Maffioletti, F.; Terenghi, R.; Colombo, M. Assessment of on-road emissions of four Euro V diesel and CNG waste collection trucks for supporting air-quality improvement initiatives in the city of Milan. Sci. Total. Environ. 2012, 426, 65–72. [Google Scholar] [CrossRef] [PubMed]
  12. Suarez-Bertoa, R.; Mendoza-Villafuerte, P.; Bonnel, P.; Lilova, V.; Hill, L.; Perujo, A.; Astorga, C.; Ricardo, S.-B.; Pablo, M.-V.; Pierre, B.; et al. On-road measurement of NH3 and N2O emissions from a Euro V heavy-duty vehicle. Atmos. Environ. 2016, 139, 167–175. [Google Scholar] [CrossRef]
  13. Grigoratos, T.; Fontaras, G.; Giechaskiel, B.; Zacharof, N. Real world emissions performance of heavy-duty Euro VI diesel vehicles. Atmos. Environ. 2019, 201, 348–359. [Google Scholar] [CrossRef]
  14. United Nations Economic Commission for Europe (UNECE). UN Agreement Concerning the Adoption of Uniform Technical Prescriptions for Wheeled Vehicles Addendum 100: Regulation No. 101; United Nations: Geneva, Switzerland, 2013. [Google Scholar]
  15. US EPA Subpart J—Field Testing and Portable Emission Measurement Systems; CFR Part 1065; Title 40; Environmental Protection Agency: Washington, DC, USA, 2015; Volume 33.
  16. ISO Standard. ISO 16183: Heavy-Duty Engines Measurement of Gaseous Emissions from Raw Exhaust Gas and of Particulate Emissions Using Partial Flow Dilution Systems under Transient Test Conditions; International Organization for Standardization: Geneva, Switzerland, 2002. [Google Scholar]
  17. Keramydas, C.; Papadopoulos, G.; Ntziachristos, L.; Lo, T.-S.; Ng, K.-L.; Wong, H.-L.; Wong, C.K.-L. Real-World Measurement of Hybrid Buses’ Fuel Consumption and Pollutant Emissions in a Metropolitan Urban Road Network. Energies 2018, 11, 2569. [Google Scholar] [CrossRef]
  18. Smit, R.; Keramydas, C.; Ntziachristos, L.; Lo, T.S.; Ng, K.L.; Wong, H.L.A.; Wong, C.K.-L. Evaluation of Real-World Gaseous Emissions Performance of Selective Catalytic Reduction and Diesel Particulate Filter Bus Retrofits. Environ. Sci. Technol. 2019, 53, 4440–4449. [Google Scholar] [CrossRef] [PubMed]
  19. Yao, Z.; Wu, B.; Wu, Y.; Cao, X.; Jiang, X. Comparison of NOx emissions from China III and China IV in-use diesel trucks based on on-road measurements. Atmos. Environ. 2015, 123, 1–8. [Google Scholar] [CrossRef]
  20. Heijne, V.; Ligterink, N.; Stelwagen, U. 2016 Emission Factors for Diesel Euro-6 Passenger Cars, Light Commercial Vehicles and Euro-VI Trucks; TNO 2016 R10304v2, Prepared for the Dutch Ministry of Infrastucture and the Environment; Netherlands Organisation for Applied Scientific Research (TNO): Delft, The Netherlands, 2016. [Google Scholar]
  21. Rao, P.S.; Sylvestre, E.A. Anova and minque type of estimators for the one-way random effects model. Commun. Stat. Theory Methods 1984, 13, 1667–1673. [Google Scholar] [CrossRef]
  22. Vardeman, S.B.; Wendelberger, J.R. The Expected Sample Variance of Uncorrelated Random Variables with a Common Mean and Some Applications in Unbalanced Random Effects Models. J. Stat. Educ. 2005, 13, 13. [Google Scholar] [CrossRef]
  23. Quinn, G.P.; Keough, M.J. Experimental Design and Data Analysis for Biologists, 1st ed.; Cambridge University Press: New York, NY, USA, 2002; ISBN 0-511-07812-9. [Google Scholar]
  24. Kutner, M.; Nachtsheim, C.; Neter, J.; Li, W. Operations and Decision Sciences. In Applied Linear Statistical Models, 5th ed.; McGraw-Hill/Irwin: New York, NY, USA, 2005; ISBN 0-07-238688-6. [Google Scholar]
  25. European Commission Commission Regulation (EU) No 582/2011 implementing and amending Regulation (EC) No. 595/2009 of the European Parliament and of the Council with respect to emissions from heavy duty vehicles (Euro VI) and amending Annexes I and III to Directive 2007/46/EC of the European Parliament and of the Council. Off. J. Eur. Union 2011, 54, 1–168.
Figure 1. Examples of heavy-duty diesel truck (HDDTs) test routes. The green route (mean speed 60 km/h) corresponds mostly to highway driving, the cyan one (mean speed 40 km/h) represents mixed driving including rural areas, and the red one (mean speed 20 km/h) is in the built environment.
Atmosphere 10 00535 g001
Figure 2. HDDT in test setup configuration. Left photo: GPS (global positioning system), SEMTECΗ EFM-2 or EFM-HS flowmeter (Sensors, Inc., USA), AVL M.O.V.E. GAS/PM PEMS analyzers, speedometer (Peiseler GmbH, Germany), weather station. Right photo: AVL M.O.V.E. GAS PEMS and AVL M.O.V.E. PM PEMS.
Atmosphere 10 00535 g002
Figure 3. Sample mean and ± one standard error limits of the distance-based NOx emission levels over speed (500 m driving sequences). Numbers next to each dot correspond to number of vehicles that have been averaged.
Atmosphere 10 00535 g003
Figure 4. Comparison of the energy-based emission factors (median value of speed-bins) per vehicle class to the respective Euro standard limits. Error bars correspond to ± one standard error limits.
Atmosphere 10 00535 g004
Figure 5. Example of a typical on-road trip of the Euro IV (DOC/EGR/SCR) and Euro V (DPF/SCR) vehicles. Profiles of NH3, N2O, and NOx mass rates, and exhaust gas temperature and vehicle speed signals.
Atmosphere 10 00535 g005
Figure 6. Total hydrocarbons (THC) and exhaust gas temperature overtime for three indicative diesel particulate filter (DPF) regeneration events.
Atmosphere 10 00535 g006
Figure 7. Median value and 10th and 90th percentiles of the calculated ratios (per regeneration) of the emission levels during regeneration over the respective levels before regeneration (at no regeneration conditions and same average speed) for THC, CO, NO, NO2, and PM pollutants.
Atmosphere 10 00535 g007
Figure 8. NOx emissions and fuel consumption (FC) ratios of uphill (road grade > +0.5%) and downhill (road grade < −0.5%) driving over flat road driving (|grade| < 0.5%) as a function of absolute road grade classes for Euro IV, Euro V, and Euro VI HDDTs (500 m driving sequences data).
Atmosphere 10 00535 g008
Figure 9. Average NOx and PM emissions ratios and FC ratio over the respective 30% loading reference values for the 30%, 50%, and 100% weight loadings, the error bars correspond to the respective ± one standard deviation limits.
Atmosphere 10 00535 g009
Table 1. Vehicles specifications.
Vehicles SpecificationsEuro IVEuro VEuro VI
DOC;EGRDPF;EGRDOC;EGR;
SCR
DOC;EGRDPF;EGRDOC;SCRDPF;SCR
No of vehicles51211111
Registration year2008–201020082008–201020102011–201620132013
Gross Vehicle Weight (tn)161624/3016161624
Odometer (km) *221,872128,757110,89614,856101,050193,45612,158
Engine displacement (L)7.77.812.9/13.19.37.7/7.87.19.3
Rated power (kW)184@2500191@2400309@2000
279@1800
206@1900191@2400
206@2400
217@2300265@1900
NOx/PM Euro Standard limit (g/kWh)3.50/0.032.00/0.030.46/0.01
* average value.
Table 2. Testing conditions per vehicle category.
Testing Parameter/ConditionEuro IVEuro VEuro VI
DOC;EGRDPF;EGRDOC;EGR;
SCR
DOC;EGRDPF;EGRDOC;SCRDPF;SCR
Exhaust Gas Temperature (°C)181 *
(173–200) †
179203
(201–205)
148203
(169–242)
197228
Speed (km/h)41
(33–45)
4937
(34–40)
5347
(36–53)
5034
Ambient Temperature (°C)25
(21–32)
2217
(16–19)
1726
(16–33)
3134
Humidity (%)62
(40–77)
5542
(42–43)
5965
(50–80)
6340
Altitude (m)20
(15–25)
2623
(20–25)
2527
(22–30)
3027
Power (kW)34
(29–39)
4553
(45–62)
4540
(32–47)
4046
* Mean of averages per vehicle, † minimum and maximum of averages per vehicle.
Table 3. NOx Euro standard emission limits and emission levels (g/kWh) per HDDT group.
NOx EmissionsEuro IVEuro VEuro VI
DOC;EGRDPF;EGRDOC;EGR;SCRDOC;EGRDPF;EGRDOC;SCRDPF;SCR
Calculated emission level (g/kWh)5.06.09.46.23.94.20.64
Euro standard limit (g/kWh)3.53.53.52.02.02.00.46
Table 4. Comparison of the results of this study to the results of similar studies.
StudyEuroSampleSpeed
(km/h)
NOx
(g/km)
CO
(g/km)
HC
(mg/km)
CO2
(g/km)
Current studyIV8415.5
(3.0–11) **
1.4
(0.16–4.0) **
110
(31–235) **
776
(578–1209) **
Yao et al. (2015) *3496.1 ± 1.0 *2.1 ± 0.6 *90 ± 120 *440 ± 14 *
Huo et al. (2012)2n.a5.3 ± 1.2 *1.2 ± 0.4 *n.an.a
Current studyV13472.51
(1.61–3.67) **
0.18
(0.00029–0.67) **
40
(7.9–172) **
658
(499–821) **
Fontaras et al. (2012)16.732.37.42102400
Current studyVI1340.9551.1112916
Heijne et al. (2016)630–450.37
(0.24–0.55) **
1.41
(0.97–2.02) **
80
(40–110) **
964
(568–1477) **
Grigoratos et al. (2019)465–700.378
(0.10–0.98) **
0.950
(0.65–1.22) **
113
(60–140) **
721
(554–832) **
China IV same as Euro IV steady-state, * Standard deviation, ** (Minimum–maximum) value of the respective vehicle-specific values, n.a: non-available value.
Table 5. NH3 and N2O mean, minimum, and maximum exhaust contents (ppm) and distance-based emissions levels (mg/km) for three HDDTs (1 Euro IV, 1 Euro V, 1 Euro VI).
PollutantEuro IVEuro VEuro VI
ppm
(mini–maxi) £
mg/km §
(min–max) ¥
ppm
(mini–maxi)
mg/km
(min–max)
ppm
(mini–maxi)
mg/km
(min–max)
NH3195
(0.613–1610)
1720
(136–11,500)
13.7
(0.250–300)
81.2
(0.972–1060)
0.415
(0.250–2.26)
2.75
(0.655–20.3)
N2O22.9
(0.250–293)
496
(10.9–3180)
23.4
(0.250–237)
337
(3.54–4420)
4.98
(0.250–79.8)
72.1
(7.25–742)
based on instantaneous (second by second) data, £ minimum and maximum value of the respective instantaneous data, § based on 500 m driving sequences, ¥ minimum and maximum value of the respective 500 m driving sequences data.
Table 6. Main characteristics of the regeneration events (average ± standard deviation).
Quantity (units)Value
Duration (s)884 ± 356
Distance (km)13 ± 6.2
Average speed (km/h)55 ± 17
Average exhaust temperature (°C)358 ± 45

