Article

Heterogeneous Uptake of N2O5 in Sand Dust and Urban Aerosols Observed during the Dry Season in Beijing

1
Department of Civil and Environmental Engineering, The Hong Kong Polytechnic University, Hong Kong, China
2
State Key Laboratory of Environmental Criteria and Risk Assessment, Chinese Research Academy of Environmental Sciences, Beijing 100012, China
3
Collaborative Innovation Center on Atmospheric Environment and Equipment Technology, Nanjing University of Information Science and Technology, Nanjing 210044, China
4
Environment Research Institute, Shandong University, Ji’nan 250100, China
*
Author to whom correspondence should be addressed.
Now at Department of Environmental Science, Policy and Management, University of California, Berkeley, CA 94720-3110, USA.
Now at Shenhua Group Zhungeer Energy Co., Ltd, Eerduosi 010300, China.
Atmosphere 2019, 10(4), 204; https://doi.org/10.3390/atmos10040204
Submission received: 22 March 2019 / Revised: 13 April 2019 / Accepted: 15 April 2019 / Published: 18 April 2019
(This article belongs to the Special Issue Air Quality in the Asia-Pacific Region)

Abstract

:
The uptake of dinitrogen pentoxide (N2O5) on aerosols affects the nocturnal removal of NOx and particulate nitrate formation in the atmosphere. This study investigates N2O5 uptake processes using field observations from an urban site in Beijing during April–May 2017, a period characterized by dry weather conditions. For the first time, a very large N2O5 uptake rate (k(N2O5) up to ~0.01 s−1) was observed during a sand storm event, and the uptake coefficient (γ(N2O5)) was estimated to be 0.044. The γ(N2O5) in urban air masses was also determined and exhibited moderate correlation (r = 0.68) with aerosol volume to surface ratio (Va/Sa), but little relation to aerosol water, nitrate, and chloride, a finding that contrasts with previous results. Several commonly used parameterizations of γ(N2O5) underestimated the field-derived γ(N2O5). A new parameterization is suggested for dry conditions, which considers the effect of Va/Sa, temperature, and relative humidity.

1. Introduction

Dinitrogen pentoxide (N2O5) is an important nighttime reservoir of NOx which is a key precursor to photochemical production of ozone [1]. The loss of N2O5 on aerosol surface, therefore, affects the lifetime of NOx and produces nitrate aerosol, contributing to particulate pollution (e.g., [2]). The formation of N2O5 is initiated by the gas phase production of nitrate radical (NO3), which is in rapid equilibrium with N2O5 (R2) [3,4]. As (R2) is a second-order reaction, M in (R2) denotes the third body, i.e., ambient air.
(R1)    NO2(g) + O3(g) → NO3(g) + O2(g)
(R2)   NO3(g) + NO2(g) + M ↔ N2O5(g) + M
NO3 and N2O5 are partially removed via gas phase reactions of NO3 with volatile organic compounds (VOCs) and NO [5]:
(R3)   NO3(g) + VOCs → products
(R4)   NO3(g) + NO(g) → 2NO2(g)
N2O5 can undergo homogeneous hydrolysis with water vapor in the gas phase [6], producing nitric acid (R5) or heterogeneous hydrolysis of N2O5 on the aerosol surface forming nitryl chloride (ClNO2) and particulate nitrate (NO3) (R6) [7,8]. ClNO2 yield (φ(ClNO2)) is used to describe the amount of ClNO2 production from unit loss of N2O5 on aerosols [9].
(R5)   N2O5(g) + H2O(g) → 2HNO3(g)
(R6)   N2O5(g) + (H2O or Cl) (aq) → NO3(aq) + ClNO2(g)
The rate of N2O5 uptake on aerosols (k(N2O5), s−1) can be expressed as (Equation (1)), where c(N2O5) (m/s) is the mean molecular speed of N2O5, Sa (μm2/cm3) is the aerosol surface area density, and γ(N2O5) is the uptake probability of N2O5 on the aerosol surface.
k ( N 2 O 5 ) = 1 4   c ( N 2 O 5 ) S a γ ( N 2 O 5 )
γ(N2O5) is highly variable (10−4 to 0.2) and has complicated dependences on the chemical composition and physical properties of aerosols according to field studies (e.g., [2,10,11]). Laboratory studies have found that N2O5 uptake is enhanced by chloride and aerosol water content ([H2O]) but suppressed by inorganic nitrate [12,13,14,15] and aerosol organic coating [16,17]. Sand dust has also been found to be an important interface for N2O5 uptake [18,19], but differing results have been obtained even for the same dust type [19,20,21,22]. For example, different laboratory studies of Saharan dust reported γ(N2O5) in the range 0.013~0.2 [20,21,23,24]. Although laboratory studies have suggested large γ(N2O5) on mineral dust, there have been no reports on direct observations of N2O5 uptake on ambient mineral dust.
Several parameterizations of γ(N2O5) have been proposed to predict γ(N2O5) based on laboratory results on the relation of γ(N2O5) to temperature, relative humidity (RH), aerosol size, and aerosol inorganic and organic content (e.g., [14,16,25,26]). To evaluate the validity of these parameterizations in the real atmosphere, γ(N2O5) was derived using field observations or direct measurements of N2O5 reactivity [10,27,28,29]. The enhancement effect of chloride and [H2O] and the inhibition effect of nitrate on γ(N2O5) have been observed in the field [11,30,31,32]. However, the parameterized γ(N2O5) based on the observed physiochemical properties of aerosols has been found to be inconsistent with observed γ(N2O5) [10,31]. For example, the widely adopted parameterization proposed by Bertram and Thornton (denoted γ(N2O5)BT) has often yielded higher values than the observed or directly measured γ(N2O5) when the observed γ(N2O5) is small (<0.02) [11,28,32,33]. The discrepancy may be due to overestimation of the enhancement effect of chloride, presence of organic aerosols, and unknown suppression effects on N2O5 uptake [33]. More investigation of γ(N2O5) in the real atmosphere is needed to improve the parametrization, while observation of N2O5 uptake on ambient sand dust is also desirable.
The present study examines the heterogeneous uptake of N2O5 based on field measurements in urban Beijing during April and May 2017, when RH was low (27 ± 18%, average ± standard deviation) and dust storms took place. We first introduce the meteorological conditions, chemical characteristics, and diurnal patterns of N2O5 and related chemical species at the sampling site. The loss rate coefficients of N2O5 are calculated to reveal the dominant removal pathways of N2O5. γ(N2O5) is then estimated from the field measurements and compared to parameterized values. Meteorological and chemical factors that influence γ(N2O5) are examined. A modified parameterization is proposed for relatively dry conditions.

2. Methods

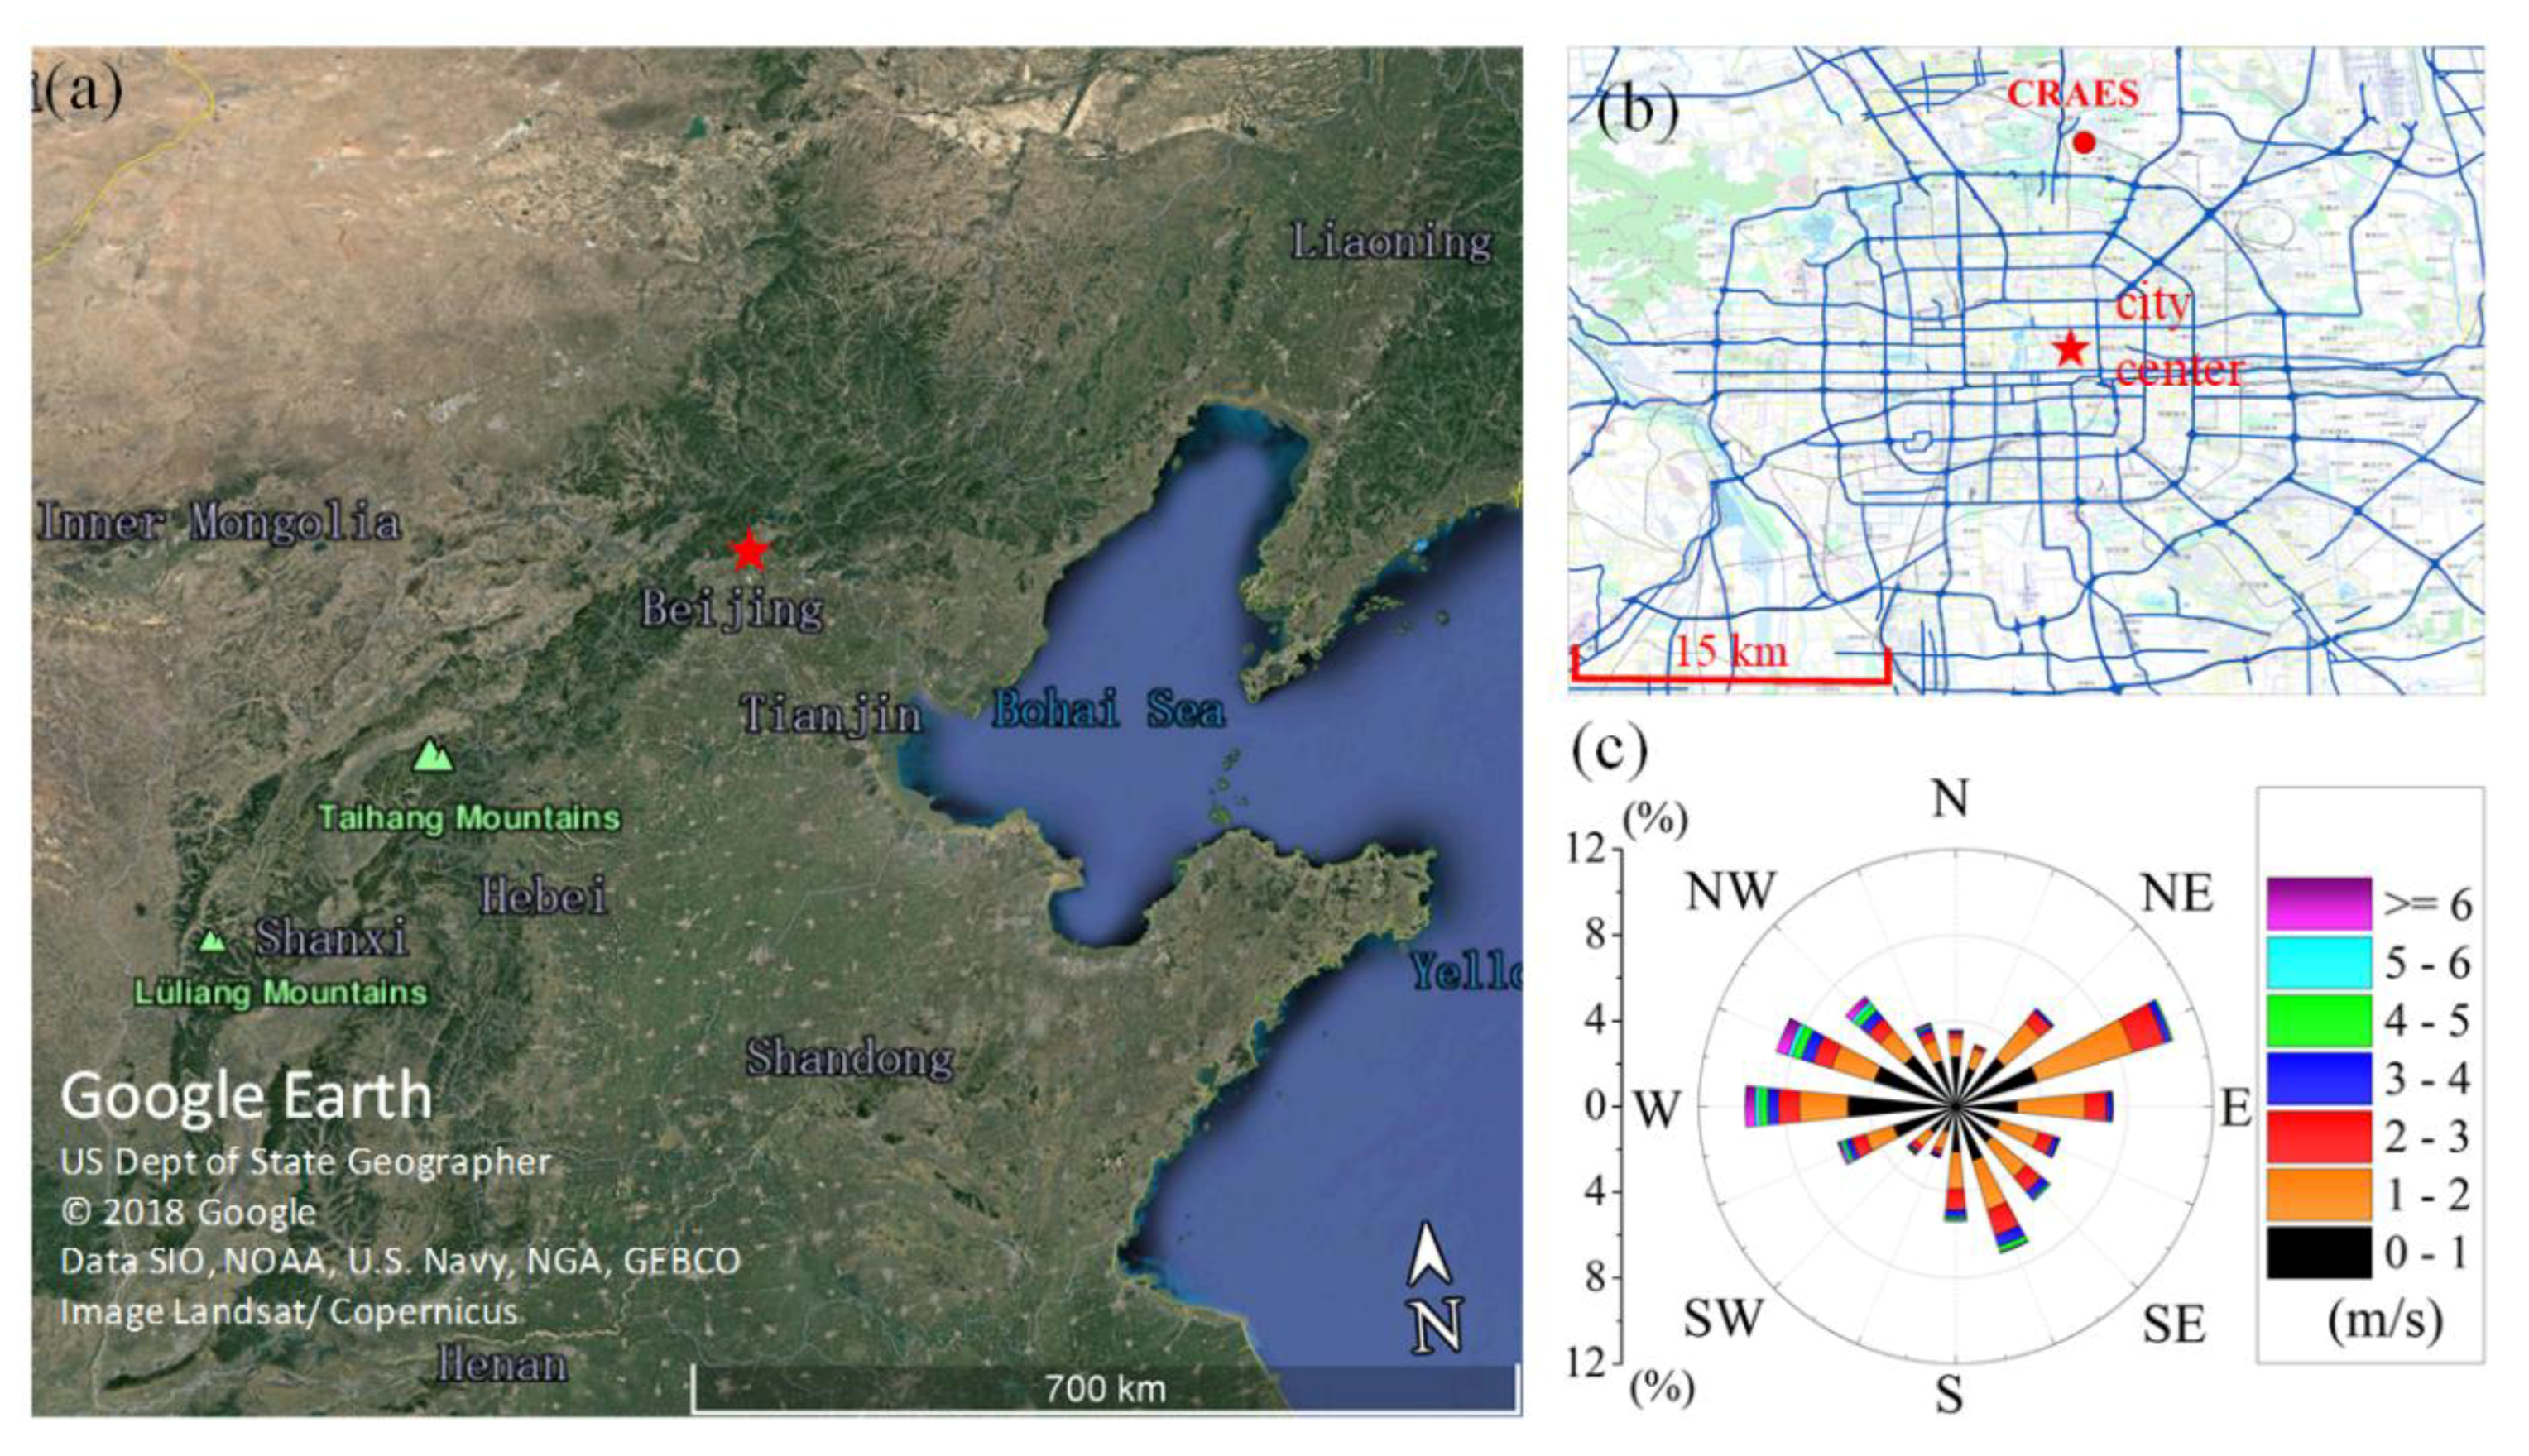
2.1. Measurement Site and Period

Field measurements were conducted in spring 2017 (April 24th to May 31st) at the Chinese Research Academy of Environmental Science (CRAES) (40.04° N, 116.42° E), which is situated in the northern part of the Beijing urban area (Figure 1). The surrounding areas are mainly residential, with some commercial buildings. For more information on the measurement site, the reader is referred to [34,35]. The Gobi Desert and Inner Mongolia lie to the northwest of Beijing, and sand dust from these regions can impact Beijing during the spring (e.g., [36]).

2.2. Instruments

2.2.1. Chemical Ionization Mass Spectrometry (CIMS) Setup

ClNO2 and N2O5 were simultaneously measured using a quadrupole CIMS. The same instrument was used in several previous field studies [32,37,38,39]. The reader is referred to the earlier publications for detailed information on the principles, configuration, and calibration methods. Briefly, ClNO2 and N2O5 molecules are combined with the reagent I(H2O) to generate I(ClNO2) and I(N2O5) in CIMS, which are detected at m/z 208 and m/z 235, respectively. In the present study, the detection limits were 3 pptv and 4 pptv (3σ, 1 min average) for N2O5 and ClNO2, respectively. The sensitivities of N2O5 and ClNO2 were determined to be 0.78 ± 0.05 Hz/pptv and 0.58 ± 0.04 Hz/pptv, respectively, based on daily calibrations. The dependency of N2O5 sensitivity on RH was measured on-site and used to correct ambient N2O5 data (Figure S2). The indoor temperature was kept constant at ~296 K by air conditioners.
The sampling inlet of the CIMS system was installed ~1.5 m above the roof of a four-story building (~15 m a.s.l.). The sampling line was 3.5 m PFA tubing (1/4-inch O.D.), which was replaced daily with a new one that was washed to reduce the loss of N2O5 in the sample line. The total flow through the sample line was ~10 liters per minute (LPM), with 1.5 LPM being distributed to CIMS and 4.0 LPM to other instruments, while the remaining flow was discarded by a bypass pump. The loss of N2O5 in the sampling line was checked every two days, which was <10% after one day of use. Overall uncertainty was 25% for N2O5 and ClNO2 [38]. The measurements were conducted at a time resolution of ~10 s, and the data were later averaged to 1 min for further analysis.

2.2.2. Other Measurements

Trace gases, aerosol, and VOC composition related to N2O5 and ClNO2 were concurrently measured. NO and NO2 were measured using a chemiluminescence analyzer equipped with a blue-light converter (model 42i-TL, Thermo Scientific Company, Waltham, MA, USA). NOy was measured using a total reactive nitrogen oxides analyzer with a MoO converter heated to 350 °C (model EC9843, Ecotech Company, Melbourne, Australia). O3 and SO2 were detected using UV photometry (model 49i, Thermo Scientific Company, Waltham, MA, USA) and pulsed-UV fluorescence (model 43C, Thermo Scientific Company, Waltham, MA, USA), respectively. All of the instruments were calibrated every two weeks. PM2.5 mass concentration was measured using a beta attenuation monitor (model BAM 1020, Met One Instrument Inc., Grants Pass, WA, USA). Ionic compositions of PM2.5 (Na+, NH4+, K+, Mg2+, Ca2+, Cl, NO3, SO42−) were measured on an hourly basis utilizing the Monitor for AeRosols and GAses in ambient air (MARGA, Metrohm Company, Herisau, Switzerland) [40,41]. An internal standard, bromide lithium, was used for regular calibration. VOCs were measured by an online gas chromatograph equipped with a flame ionization detector (GC-FID) (Chromatotec Group, Bordeaux, France) [42]. A list of measured species and reaction rate constants with NO3 radical at 298K are shown in Table S1 [5]. Organic carbon (OC) and elemental carbon (EC) were measured by an OC-EC field analyzer (model-4, Sunset Laboratory Inc., Tigard, OR, USA).
The dry-state particle size distribution was measured by a wide-range particle spectrometer (WPS Model 1000XP, MSP Corporation, Shoreview, MN, USA) covering the 10 nm~10 μm size ranges [43]. Aerosol surface area density (Sa) was estimated by assuming that particles were spherical. Hygroscopic growth of aerosols was estimated following the method in [44], and a growth factor for the diameter of particles, GF = 0.582 ( 8.46 + 1 1 RH ) 1 / 3 was adopted for all the size ranges [45,46]. The growth factor for Sa is the square of GF. Particles larger than 10 μm were significant in the heavy sand storm event, but they cannot be captured by the WPS instrument. Thus, the Sa in such cases was estimated based on its relationship to PM2.5 during the observation period (Figure S6). For the same reason, the calculation of Va/Sa is not applicable during heavy storm events. In other cases, it is assumed that particles larger than 10 μm contribute little to the total aerosol surface area.

2.3. Estimation of γ(N2O5) and φ(ClNO2)

A modified steady state method was applied to estimate γ(N2O5) and φ(ClNO2) [3,39,42,47]. Due to rapid equilibrium between NO3 and N2O5, these two species are regarded as a pair. The changing rate of the NO3 and N2O5 pair equals the production rate of NO3 radial minus the total loss rate of NO3 and N2O5 (Equation (2)), assuming that transportation effect can be ignored.
d([N2O5] + [NO3])/dt = d[NO3]/dt + d[N2O5]/dt
= k1[NO2][O3] − k(NO3)[NO3] − k(N2O5)[N2O5]
where k1 is the rate constant of (R1). k(NO3), known as NO3 reactivity, is expressed as follows:
k ( NO 3 ) = k NO + NO 3 [ NO ] + k i [ VOC i ]
where ki is the rate constant of NO3 + VOC reactions. The NO3 radical concentration is estimated from the NO3 and N2O5 equilibrium:
[ NO 3 ] = [ N 2 O 5 ] [ NO 2 ] K eq
where Keq is the temperature-dependent equilibrium coefficient of the NO3–N2O5 pair. Substitution of (Equation (3)) and (Equation (4)) into (Equation (2)) and rearrangement yields (Equation (5)) as follows, where k(N2O5) is extracted.
k(N2O5) = (k1[NO2][O3] − k(NO3)[N2O5]/([NO2]Keq) − d[N2O5]/dt
d[NO3]/dt)/[N2O5].
d[N2O5]/dt and d[NO3]/dt are approximated as the rate of increase of [N2O5] and [NO3] over 5 min, and thus can be replaced by δ[N2O5]/ δt and δ[NO3]/ δt with δt = 5 min. Then, the time series of k(N2O5) can be derived. The heterogeneous loss rate coefficient of N2O5 (k(N2O5)het) is obtained when the homogeneous loss rate coefficient of N2O5 is subtracted [6,48].
k(N2O5)het = k(N2O5) − k(N2O5)homo
k ( N 2 O 5 ) homo = k a × [ H 2 O ] + k b × [ H 2 O ] 2 .
When the surface area density (Sa) of aerosols and velocity of N2O5 molecules (c(N2O5)) are available, γ(N2O5) can be obtained following (Equation (1)). Then φ(ClNO2) can be calculated using the below formula by integrating over the whole period of the selected case.
φ ( ClNO 2 ) = Δ [ ClNO 2 ] k ( N 2 O 5 ) het [ N 2 O 5 ] d t

2.4. Parameterizations of γ(N2O5) and φ(ClNO2)

We evaluated three parameterizations of γ(N2O5). The first relates γ(N2O5) to RH and temperature (T) (denoted γ(N2O5)EJ) [25] in which the dependences of γ(N2O5) on RH and T were separately derived on ammonium sulfate aerosol [12,13].
γ(N2O5)EJ = (2.79 × 10⁻⁴ + 1.3 × 10⁻⁴ × RH − 3.43 × 10⁻⁶ × RH2 + 7.52 ×
10−8 × RH3) × 10(0.04 × (T − 294)
The second parameterization of γ(N2O5) (denoted γ(N2O5)BT) considers the bulk concentration of chloride [Cl], nitrate [NO3], and aerosol water content ([H2O]) [14]. Three important assumptions are adopted to establish this parameterization: (1) the whole particle is in an aqueous phase; (2) aerosols can be supersaturated; and (3) the accommodated N2O5 can react within the whole particle volume. Then γ(N2O5)BT is expressed as (Equation (10)).
γ ( N 2 O 5 ) BT = A k ( 1 1 1 + k R 3 [ H 2 O ] k R 2 b [ NO 3 ] + k R 4 [ Cl ] k R 2 b [ NO 3 ] )
where [H2O], [Cl], and [NO3] are derived from the extended aerosol inorganics model (E-AIM) (Text S1) [49]. Organic aerosols were not considered in the E-AIM model. kR2b, kR3, and kR4 are reaction rate constants: kR4/kR2b = 29 ± 6; kR3/kR2b = 0.06 ± 0.01 [14]. A is proportional to Va/Sa. k is an empirical pre-factor in which k = β(1 − exp(−δ[H2O])) with β = (11.5 ± 3) × 105 and δ = 0.13 ± 0.05.
The third parameterization (denoted γ(N2O5)A) adds the inhibition effect of the organic coating on γ(N2O5) [16].
1 γ ( N 2 O 5 ) A = 1 γ core + 1 γ Org
γ Org = 4 RT H org D org R c c ( N 2 O 5 ) L R p
(Equation (11)) treats the N2O5 uptake process as a net effect through the aqueous core (γcore) and the organic coating (γOrg). In this study, γcore adopts Bertram and Thornton’s parameterization for easy comparison with previous studies [29,31]. γOrg is calculated using (Equation (12)), in which Rc is the radius of the aqueous core, Rp denotes the radius of the particle, and L means the depth of the organic coating. And Rc, Rp, and L are calculated following a previous study [50]. Horg and Dorg are the Henry’s law constant and the diffusion coefficient of N2O5 in organic coating, which are calculated by assuming HorgDorg = 0.03HaqDaq [2,11]. Haq (5000 M/atm) and Daq (10−9 m2/s) are the corresponding parameters of N2O5 in the aqueous core [2].
The parameterized ClNO2 yield is also calculated using the following equation [14].
φ ( ClNO 2 ) BT = ( 1 + [ H 2 O ] 483 [ Cl ] ) 1

3. Results and Discussion

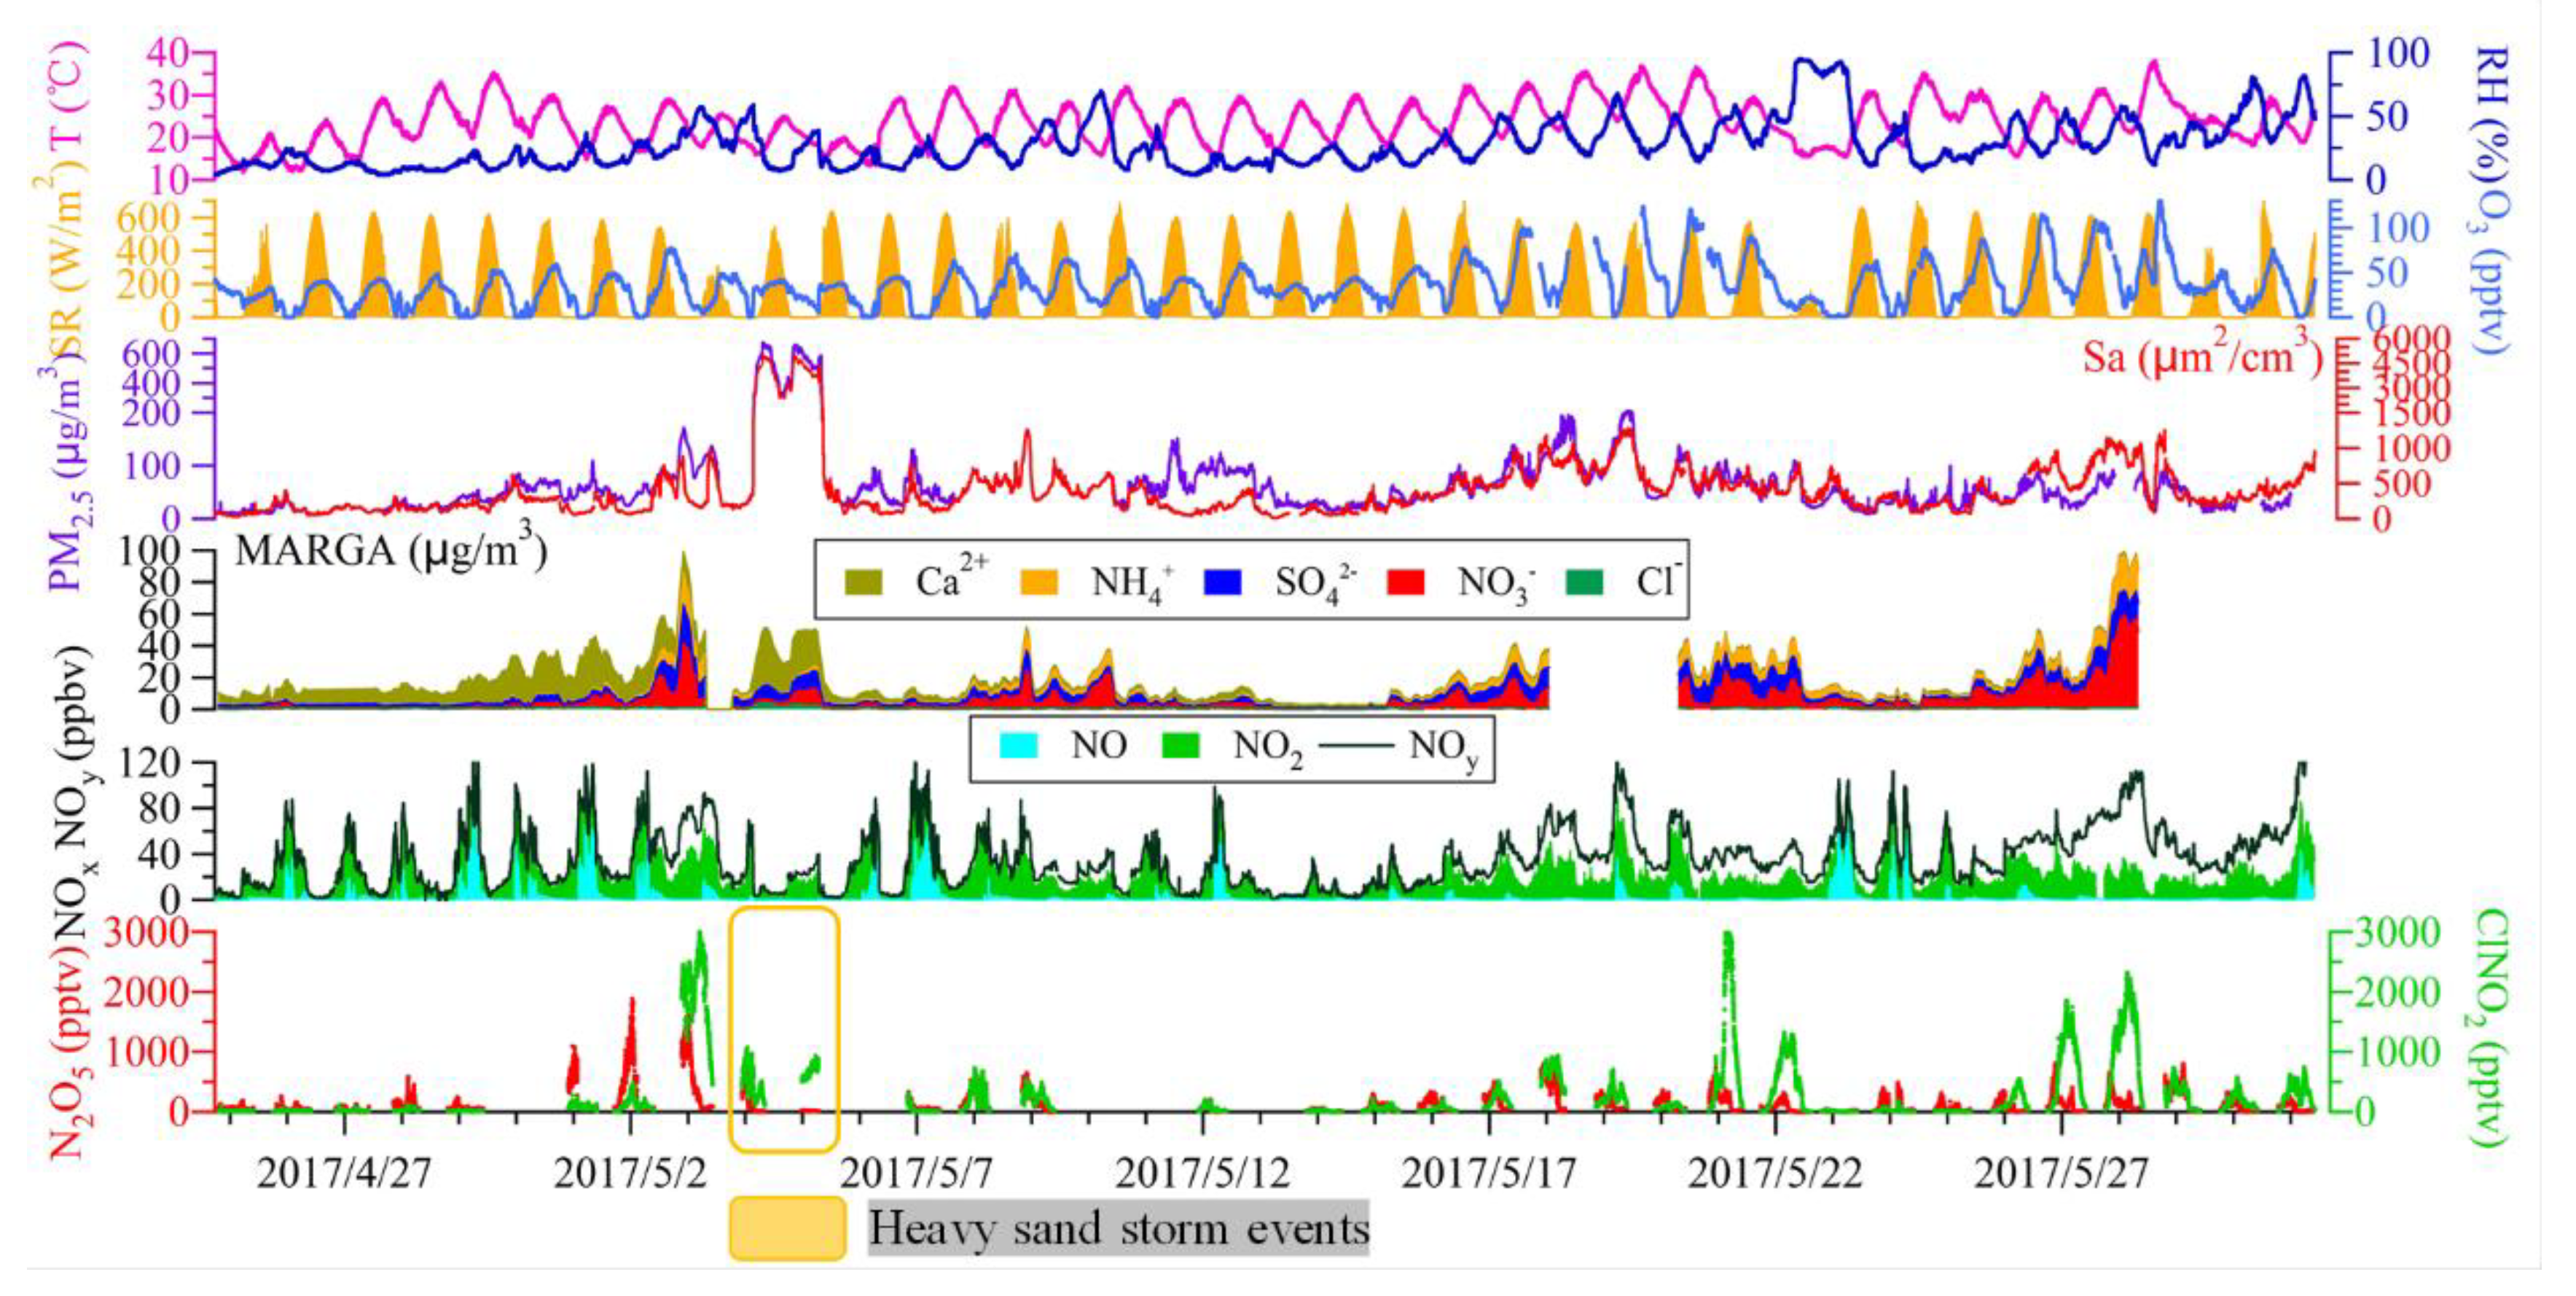
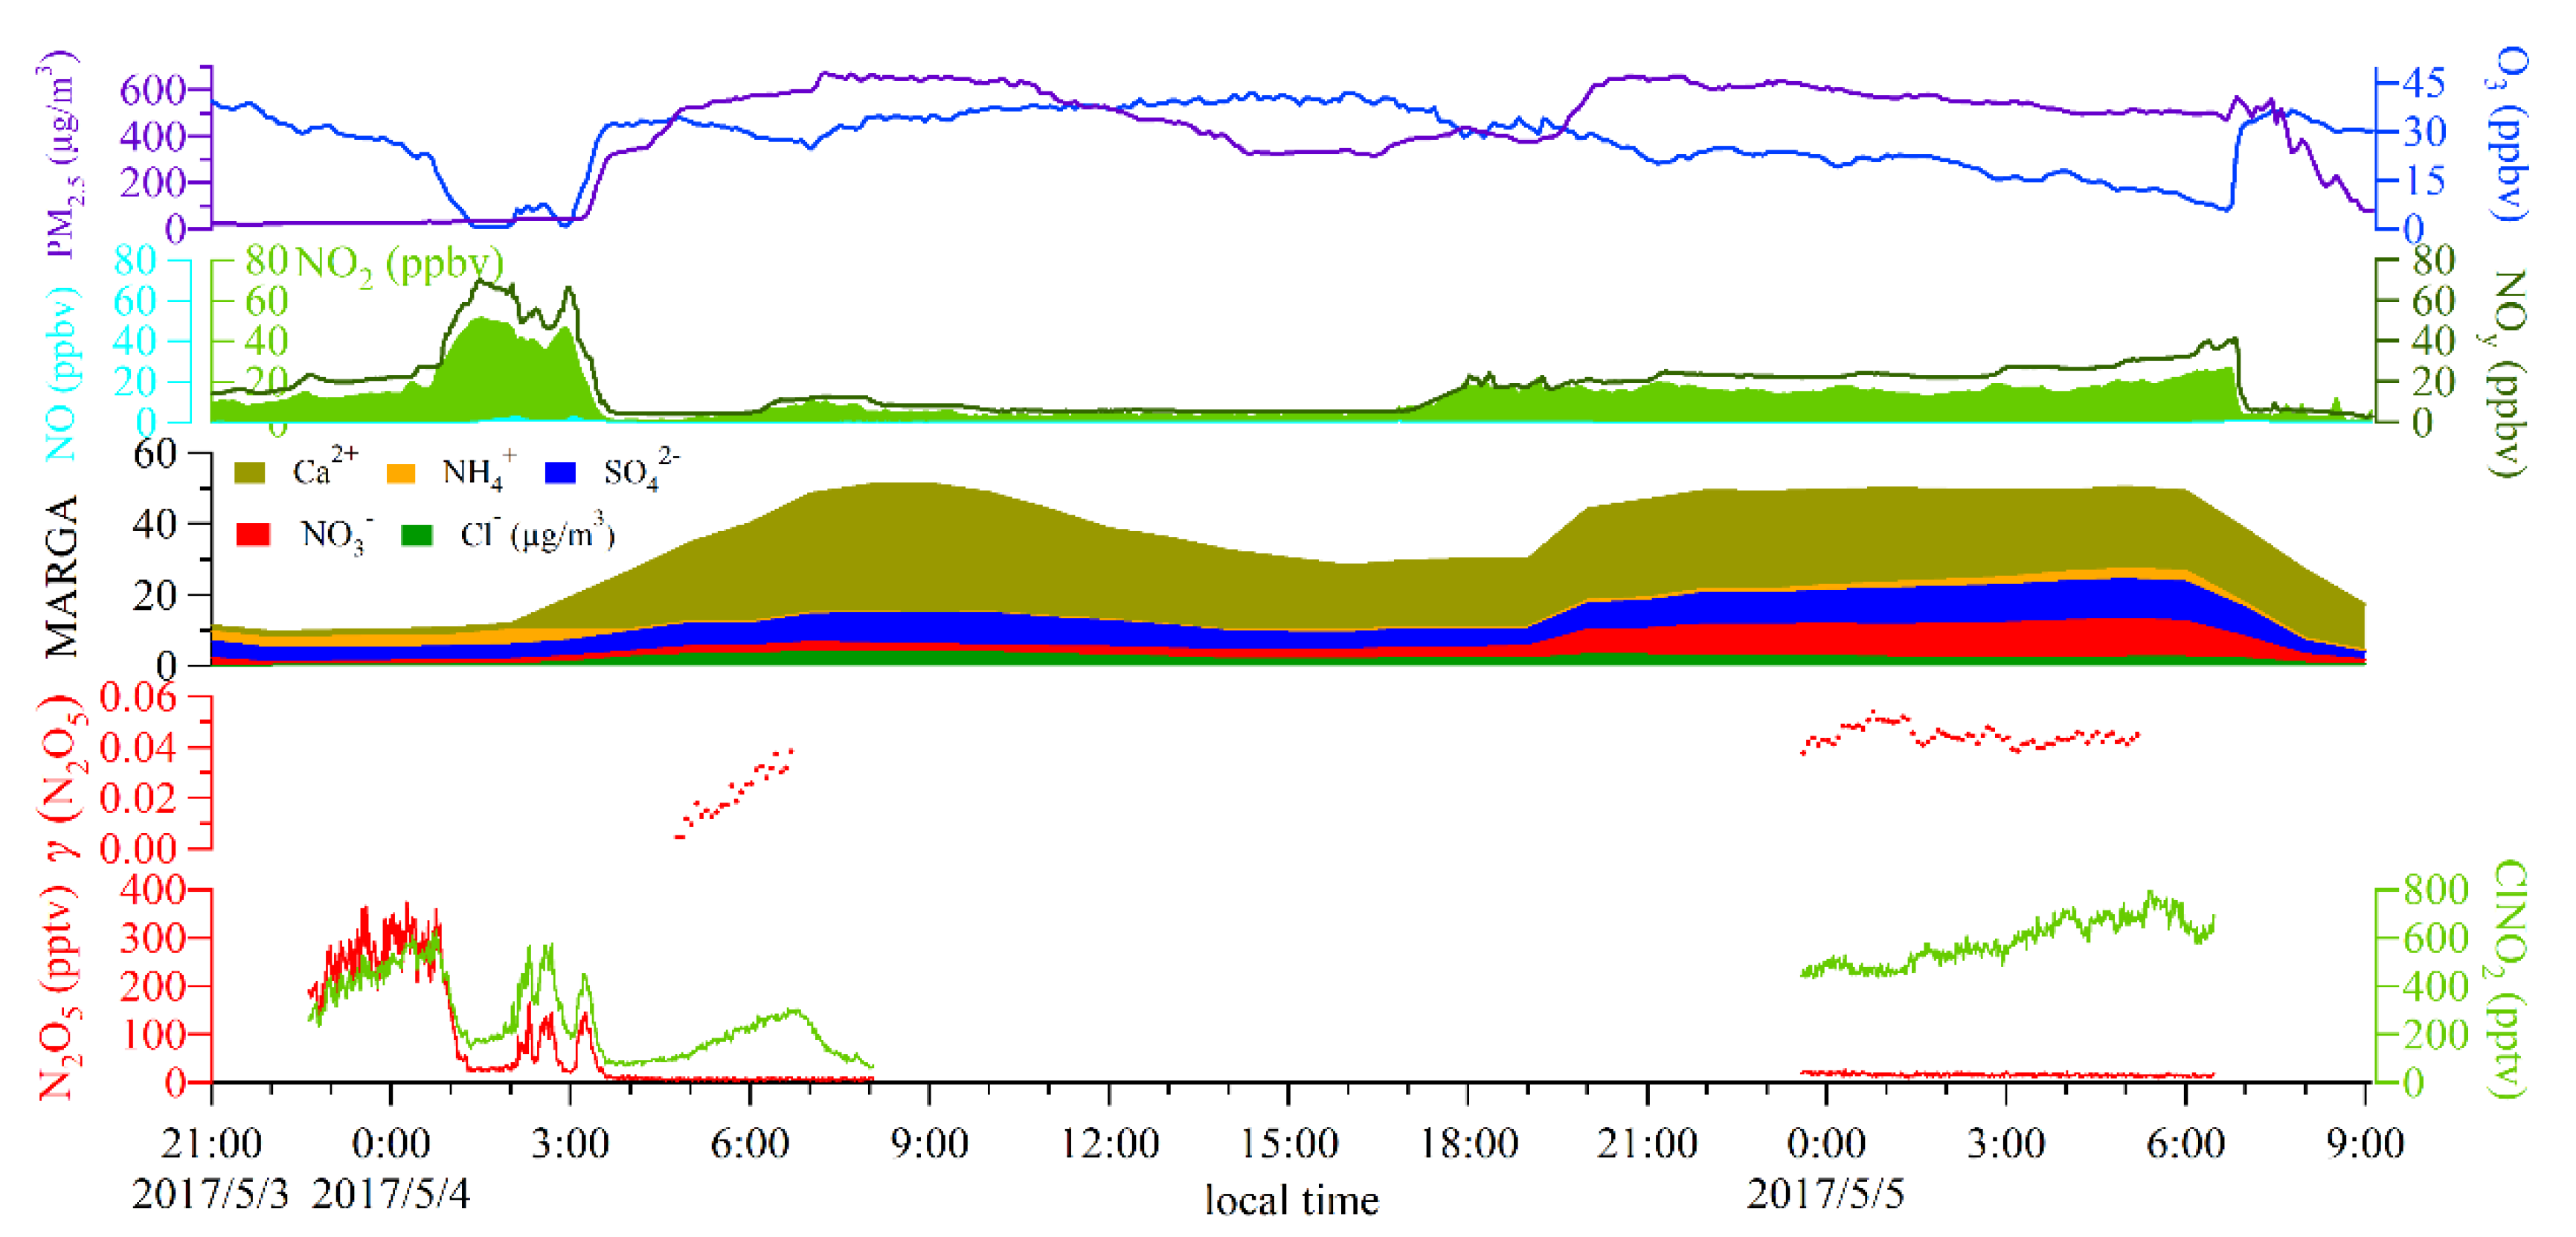
3.1. Overall Observations

Measurement results for N2O5, ClNO2, and related chemical and meteorological parameters are shown in Figure 2 for the period from 24th April to 31st May. The weather conditions were mainly sunny, except for a little rain on 23rd May. Wind speeds were mostly below 3 m/s (Figure 1c). A prominent feature of the field study was dry weather, with an average relative humidity (RH) of 27 ± 18% during the whole campaign. Both N2O5 and ClNO2 exhibited typical diurnal variations, increasing during the night and decreasing during the day (Figure S3).
The early part of the study (24th April to 2nd May) was influenced by dry air masses mainly from the northwest, as indicated by the backward trajectories (Figure S1) calculated using the online hybrid single-particle lagrangian integrated trajectory (HYSPLIT) model [51]. N2O5 levels were higher than those of ClNO2 from 24th April to 1st May with low aerosol loadings, suggesting low N2O5 uptake or ClNO2 yield. This period was influenced by light dust, as indicated by abundant Ca2+ (10–40 μg/m3) and moderate PM2.5 (20–100 μg/m3) mixed with fresh urban emissions. The night of May 2nd was an exception as the air mass originated from the southeast, bringing humid air and higher ClNO2 to N2O5 ratios. Overall, this period is referred to as “light dust” in the subsequent discussion.
A heavy sand storm impacted Beijing on the night of 3rd and 4th May, with PM2.5 reaching ~700 μg/m3 (Figure 2). The sand storm event is displayed separately for clarity (Figure 3). ClNO2 mixing ratios of up to 0.82 ppbv and much lower N2O5 levels (10–20 pptv) were observed, indicating rapid N2O5 loss on sand dust. To our knowledge, this is the first observation of N2O5 and ClNO2 during a heavy dust event. This period is denoted as a “sand storm.”
In the later period of observation (14th May to 31st May, Figure S3), air masses arrived from the south or east (Figure S1), with a mean RH in the range 20~60%. Daytime ozone levels were 80–120 ppbv, indicating moderately high photochemical pollution. This period is named “urban air.” During this period, ClNO2 levels were generally higher than those of N2O5. The levels of N2O5 (up to 0.7 ppbv) and ClNO2 (up to 3.0 ppbv) were slightly higher than or comparable to values previously reported in polluted North China and urban/industrial regions of the US and EU [32,38,52,53,54,55,56,57,58], but lower than our previous observations in southern China [37,39].

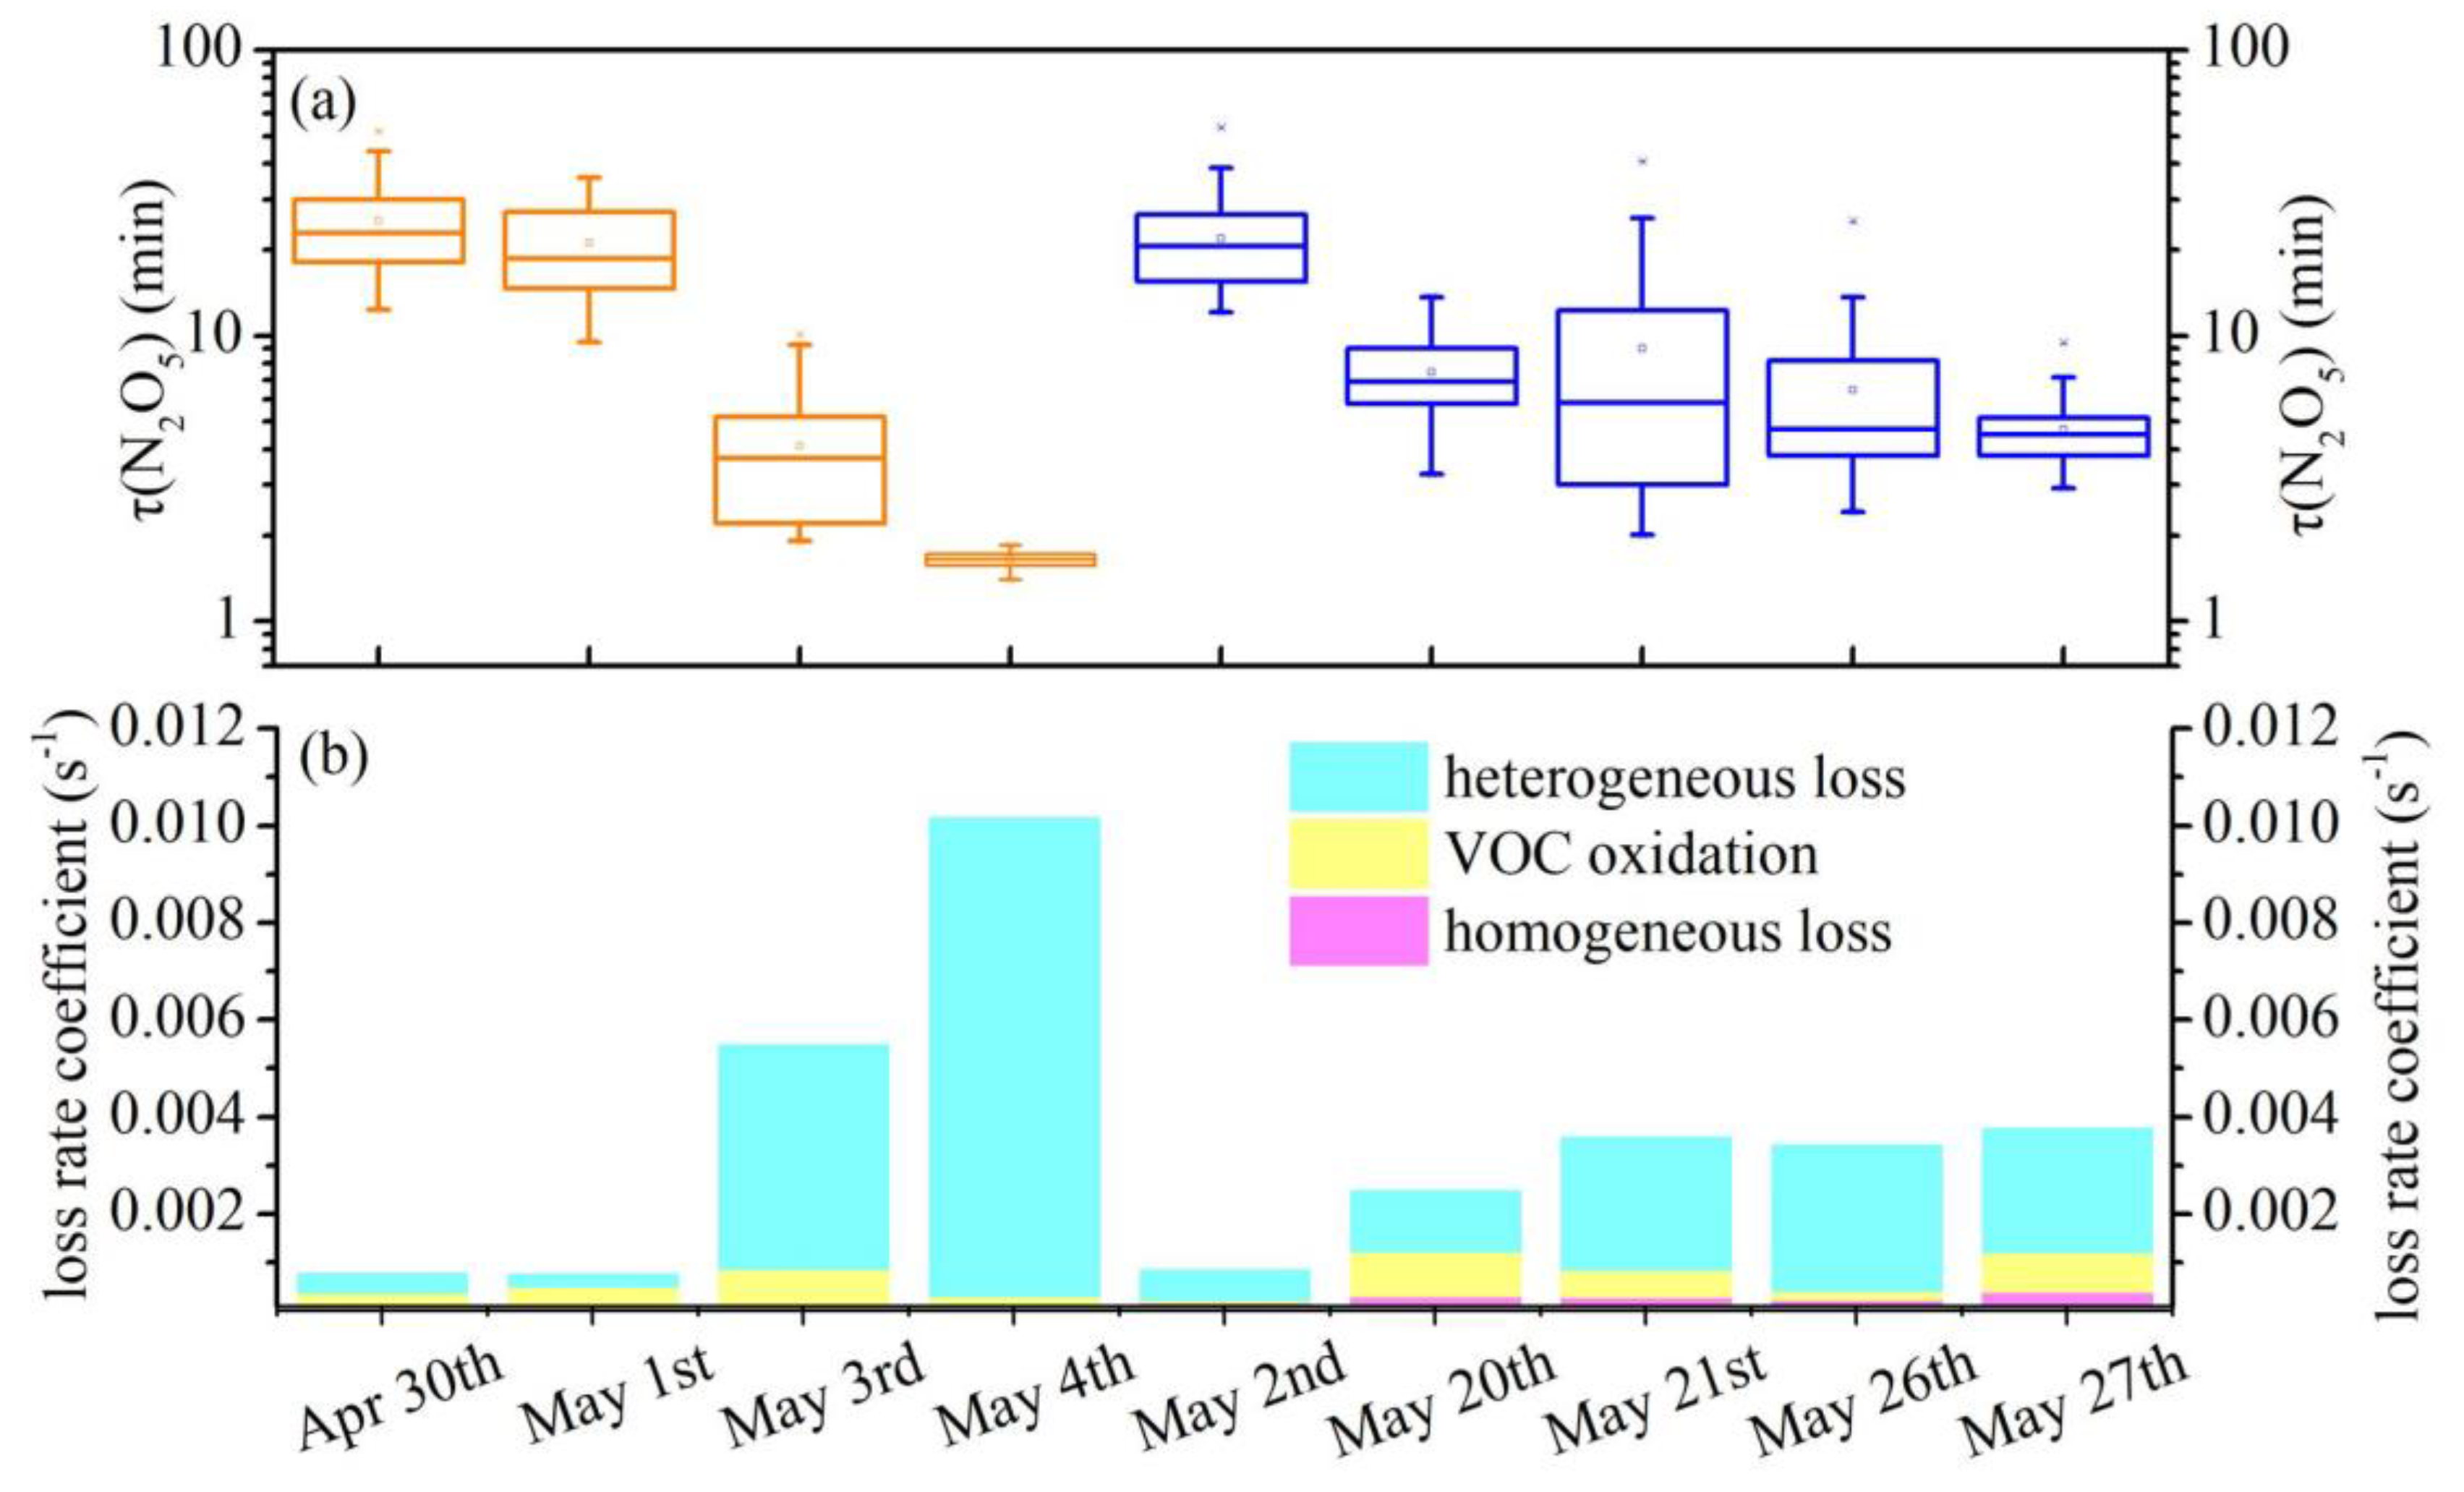
3.2. N2O5 Reactivity and Loss Pathways

This section examines the relative importance of the three N2O5 loss reactions, i.e., VOC oxidation, homogeneous loss, and heterogeneous loss. The lifetime of N2O5 (τ(N2O5)) is a measure of its total reactivity and was estimated using (Equation (14)). P(NO3) is the production rate of NO3 radical from the NO2 and O3 reaction. We selected nighttime periods with abundant N2O5 or ClNO2 and low NO levels (NO < 0.1 ppbv). A total of nine cases were selected (see Figure 4), including two “light dust” (30th April and 1st May), two “sand storm” (3rd May and 4th May), and five “urban air.” Results show that the τ(N2O5) ranged from 1 min to 45 min (Figure 4a). The shortest τ(N2O5) was found in the sand storm on May 4th night, which is attributable to the rapid heterogeneous loss rate coefficient of N2O5 (up to 0.01 s−1, Figure 4b).
τ ( N 2 O 5 ) = N 2 O 5   concentration N 2 O 5   loss   rate = [ N 2 O 5 ] P ( NO 3 ) δ [ N 2 O 5 ] / δ t δ [ NO 3 ] / δ t
The loss rate coefficients of N2O5 uptake were calculated and compared with other loss pathways (Figure 4b). The indirect loss through gas-phase reactions of NO3 radical with VOCs contributed 1.9%~30.2% of total N2O5 loss. Biogenic VOCs dominated the nocturnal NO3 + VOCs reaction (67.2% of NO3 loss), while aromatic hydrocarbons (20.1%) and alkenes (12.5%) also made significant contributions. The homogeneous loss of N2O5 by H2O(g) contributed 1.2%–20.6% of N2O5 loss. These values may be the upper limit if the rate constant of the homogeneous N2O5 hydrolysis adopted from [6] is overestimated as suggested by [10,59]. The most important removal pathway of N2O5 was heterogeneous uptake on aerosols, contributing 58.1%–96.9% of total N2O5 loss. The heterogeneous loss rate coefficient of N2O5 (k(N2O5)het) was most prominent in the sand storm on the nights of 3rd May and 4th May.
It is worth noting that other potential NO3 loss pathways which were not considered in our analysis may give rise to uncertainties in our result. For example, NO3 + VOCs reactions can produce HOx and ROx radicals, which consume NO3 radical [60]. In addition, NO3 is subject to heterogeneous loss [61]. Due to a lack of measurements of ROx, and HOx, and limited knowledge on the NO3 uptake coefficient, these NO3 loss pathways are not included here.

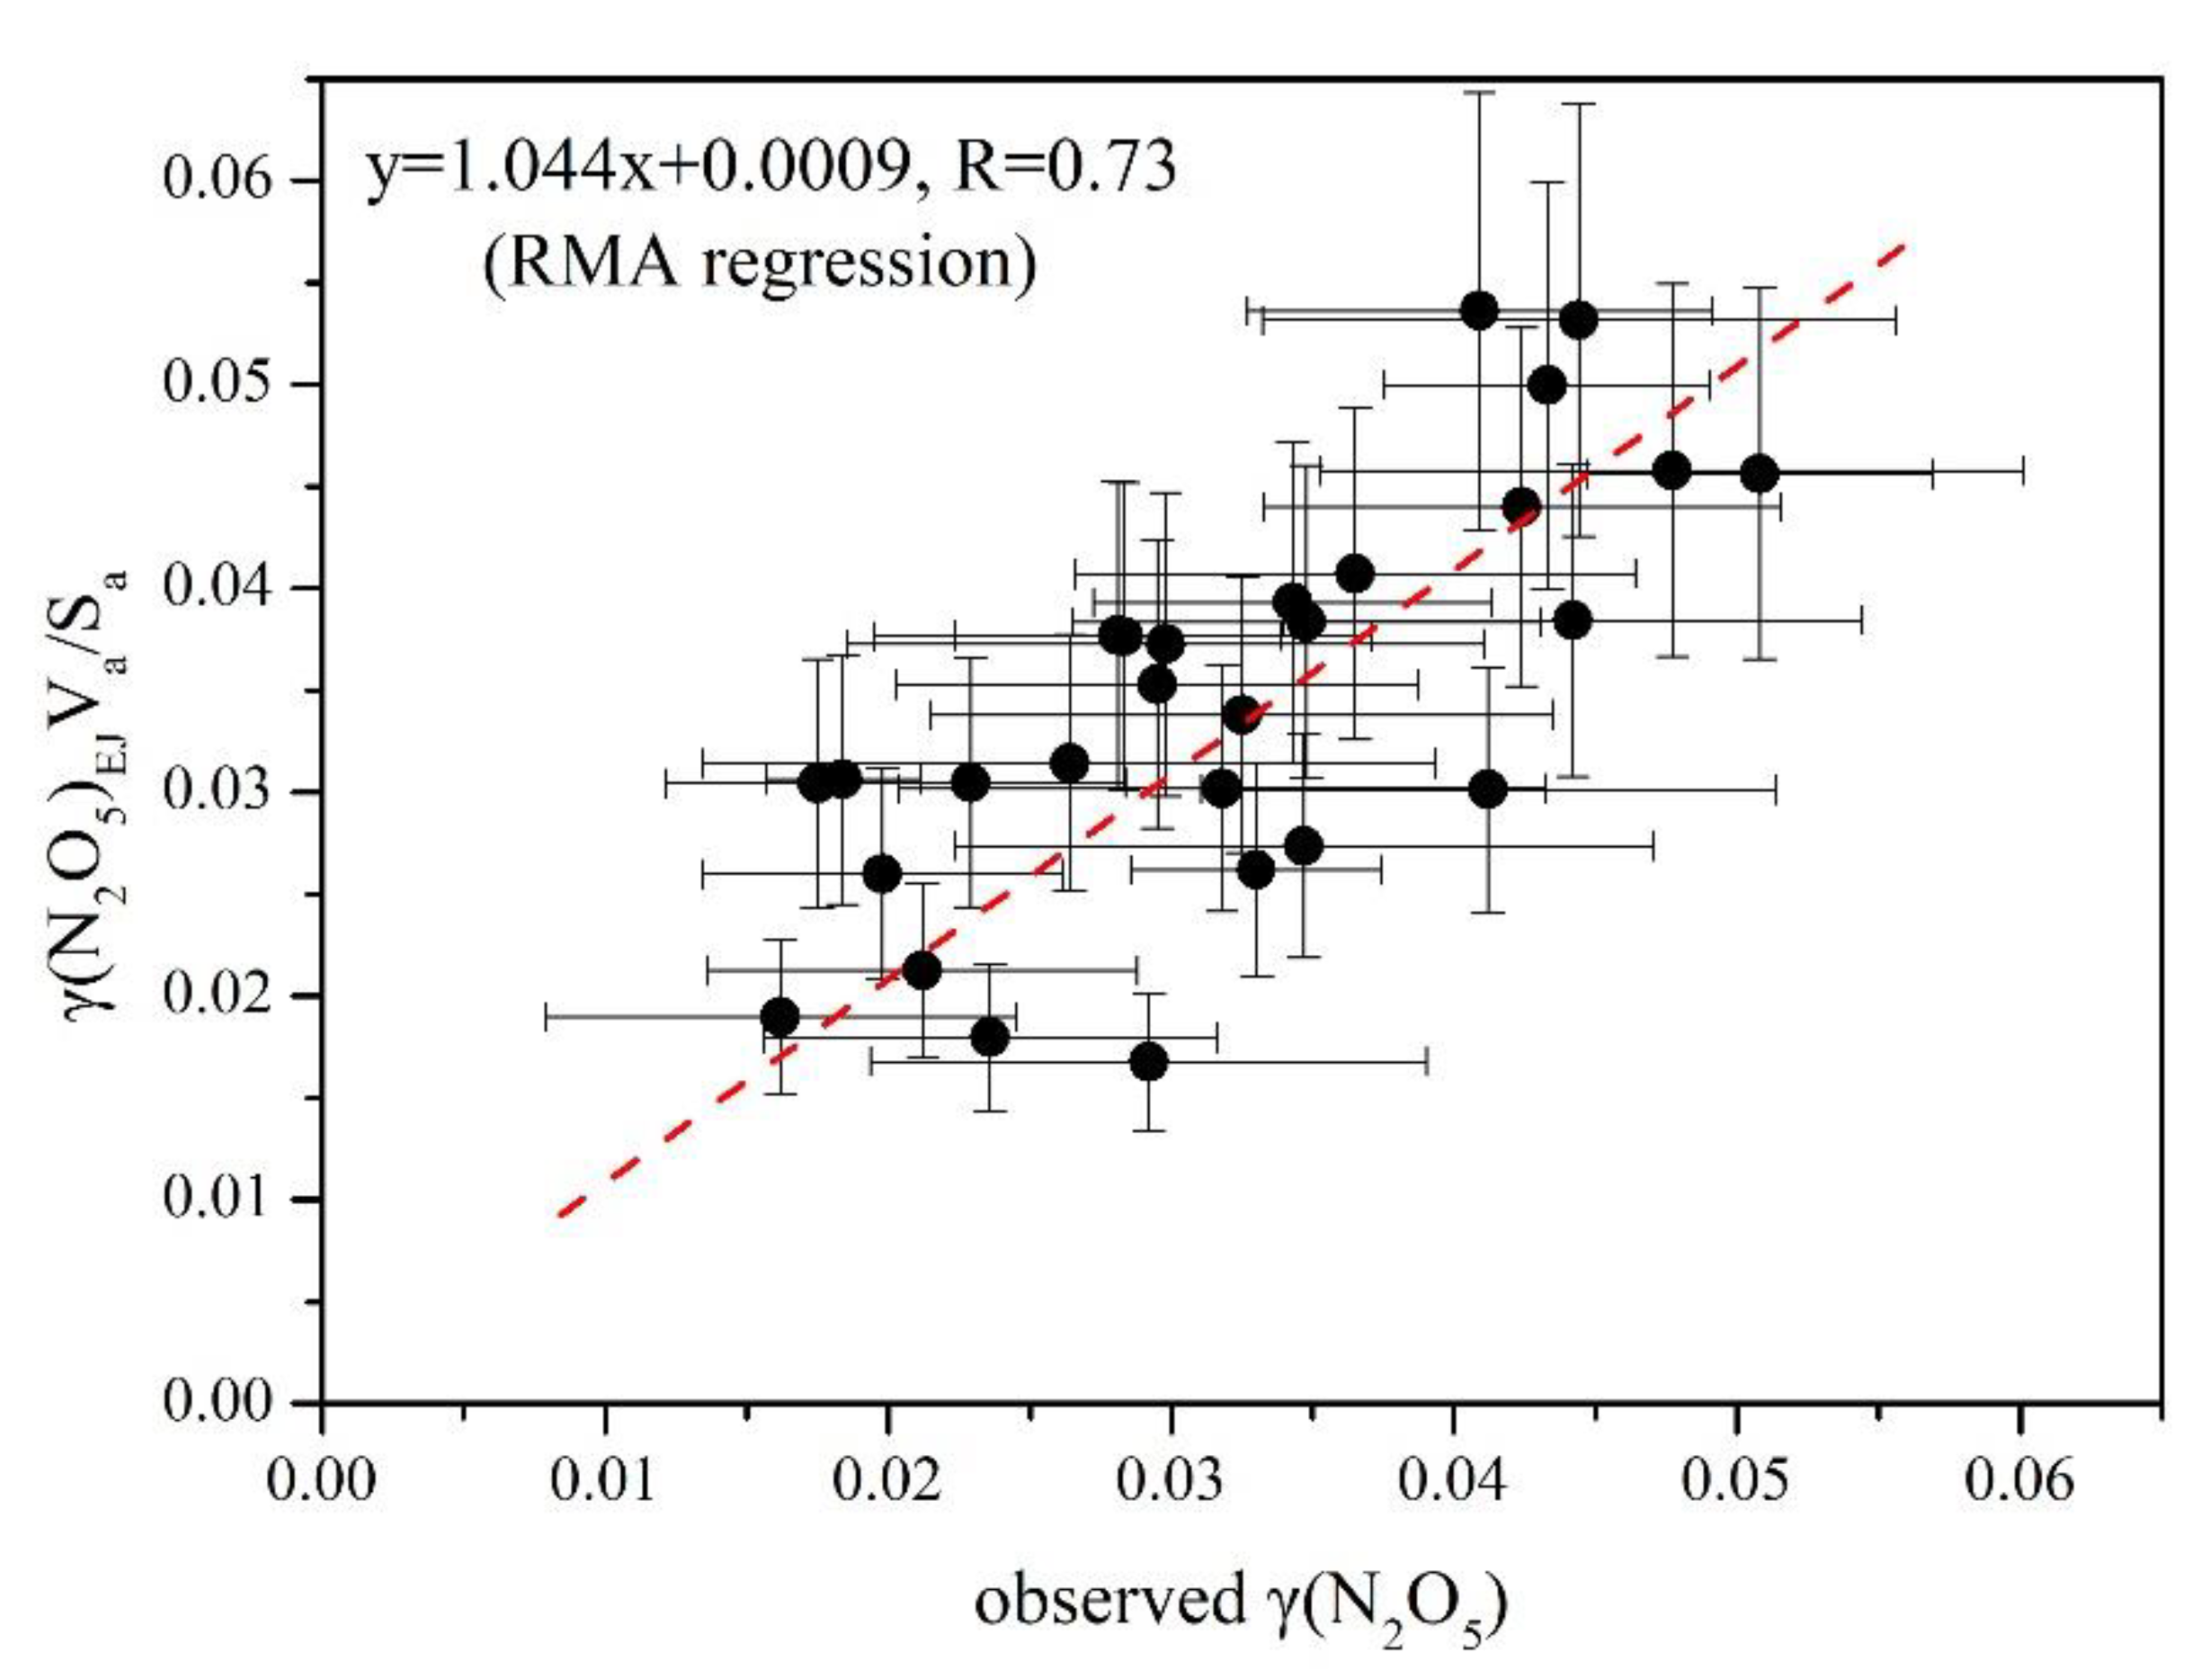
3.3. Derivation of γ(N2O5) and Evaluation of Parameterizations

To estimate γ(N2O5) from the measurement data, the following selection criteria were adopted; the procedures were similar to those used in previous studies with minor modifications [11,47].
  • The air mass should be stable without dramatic changes in temperature, RH, and wind direction. Wind speed should be less than 3 m/s to minimize the effect of air mass transport.
  • Ambient NO should be below 0.1 ppbv. Otherwise, little production of N2O5 would occur.
  • ClNO2 should exhibit an increasing trend, indicating considerable uptake of N2O5. In cases with decreasing or fluctuating ClNO2, physical processes or changes of air mass may invalidate the method for the estimation of γ(N2O5).
  • Sa should be above 200 μm2/cm3 to facilitate significant N2O5 uptake. In cases with Sa below 200 μm2/cm3, we found that the derived γ(N2O5) was either abnormally high (for example, above 0.1), or even negative. This phenomenon indicates that the method we adopted may be invalid in low aerosol loadings.
Two examples that satisfy the criteria are shown in Figure S4. In total, nine cases were selected, with durations of 2 to 7 h, and γ(N2O5) and φ(ClNO2) were calculated following the method in Section 2.3, as summarized in Table 1. γ(N2O5) ranged from 0.013 to 0.042 in urban air masses. The γ(N2O5) range is comparable to the results of one previous study in urban Beijing (0.012~0.055) [57] and higher than those obtained in some places in the US and Europe [27,59], but lower than other results obtained over the North China Plain [32,44]. The field-derived φ(ClNO2) (0.218 ± 0.247) was much lower than parameterized values using (Equation (13)) (0.796 ± 0.056) in all cases, which is consistent with the findings in previous studies, suggesting an overestimation of ClNO2 yield in the current parameterization or an unknown suppression effect on ClNO2 yield [32,62].
The γ(N2O5) derived on the night of 3rd May (4th May 04:00~06:00) and 4th May (4th May 23:00 to 5th May 05:00) represents the N2O5 uptake in the early and later stage of the sand storm event. Five-minute average γ(N2O5) was low (0.008) at the beginning of the dust storm at ~04:00 on 4th May (see Figure 3), but γ(N2O5) increased gradually to 0.039 at 06:00 when aerosols reached high levels. The γ(N2O5) continued to increase and remained at ~0.044 on the following night, with sustained high levels of aerosols. This stable value can be considered the γ(N2O5) on ambient dust particles in the region, and this field-derived value compares well with the laboratory-determined γ(N2O5) ((5 ± 2) × 10−2) on bulk CaCO3 dust [21]. The γ(N2O5) on May 5th was higher than in urban air masses (see Table 1), although the aerosol water content ([H2O]) was relatively low (14~21 M) during the dust storm, according to E-AIM (Figure S5). Assuming a volume-limited mechanism, larger particle size in the sand dust plumes might be responsible for the high γ(N2O5) on 5th May. Another possibility is that E-AIM (model III), which is used in the present work, underestimates the [H2O] adsorbed by sand dust particles because it does not consider the significant enhancement of hygroscopicity in the conversion of CaCO3 to deliquescent Ca2+ [63].
To evaluate the applicability of the commonly used parameterizations, the field-determined 5-min average γ(N2O5) values were averaged to hourly values and compared with three parameterized γ(N2O5) values (Figure 5), calculated according to the approaches introduced in Section 2.4 and based on the hourly average of the input parameters. We also calculated and showed propagated errors of three parameterized γ(N2O5) by taking partial differentials of the variables in the parameterization formula and the measurement uncertainty for each variable. Because the measured Va/Sa is invalid for the heavy sand storm event (method Section 2.2), parameterized γ(N2O5) was not calculated in that case. Overall, the parameterized γ(N2O5)BT (0.026 ± 0.003) was lower than the field-observed γ(N2O5) (0.032 ± 0.010) and had much less variability. This result contrasts with previous studies, which usually indicated higher parameterized γ(N2O5)BT [11,30,31,33]. The parameterization that considered only T and RH (γ(N2O5)EJ) was systematically lower than the field-observed γ(N2O5), which differs from the good fit of γ(N2O5)EJ at Wangdu in the humid summer period [11]. When the organic coating effect was considered and combined with γ(N2O5)BT, the parameterized γ(N2O5)A using (Equation (11)) was even lower. The significant underestimation of γ(N2O5) when organic coatings were considered is similar to the findings of previous studies (e.g., [11]).

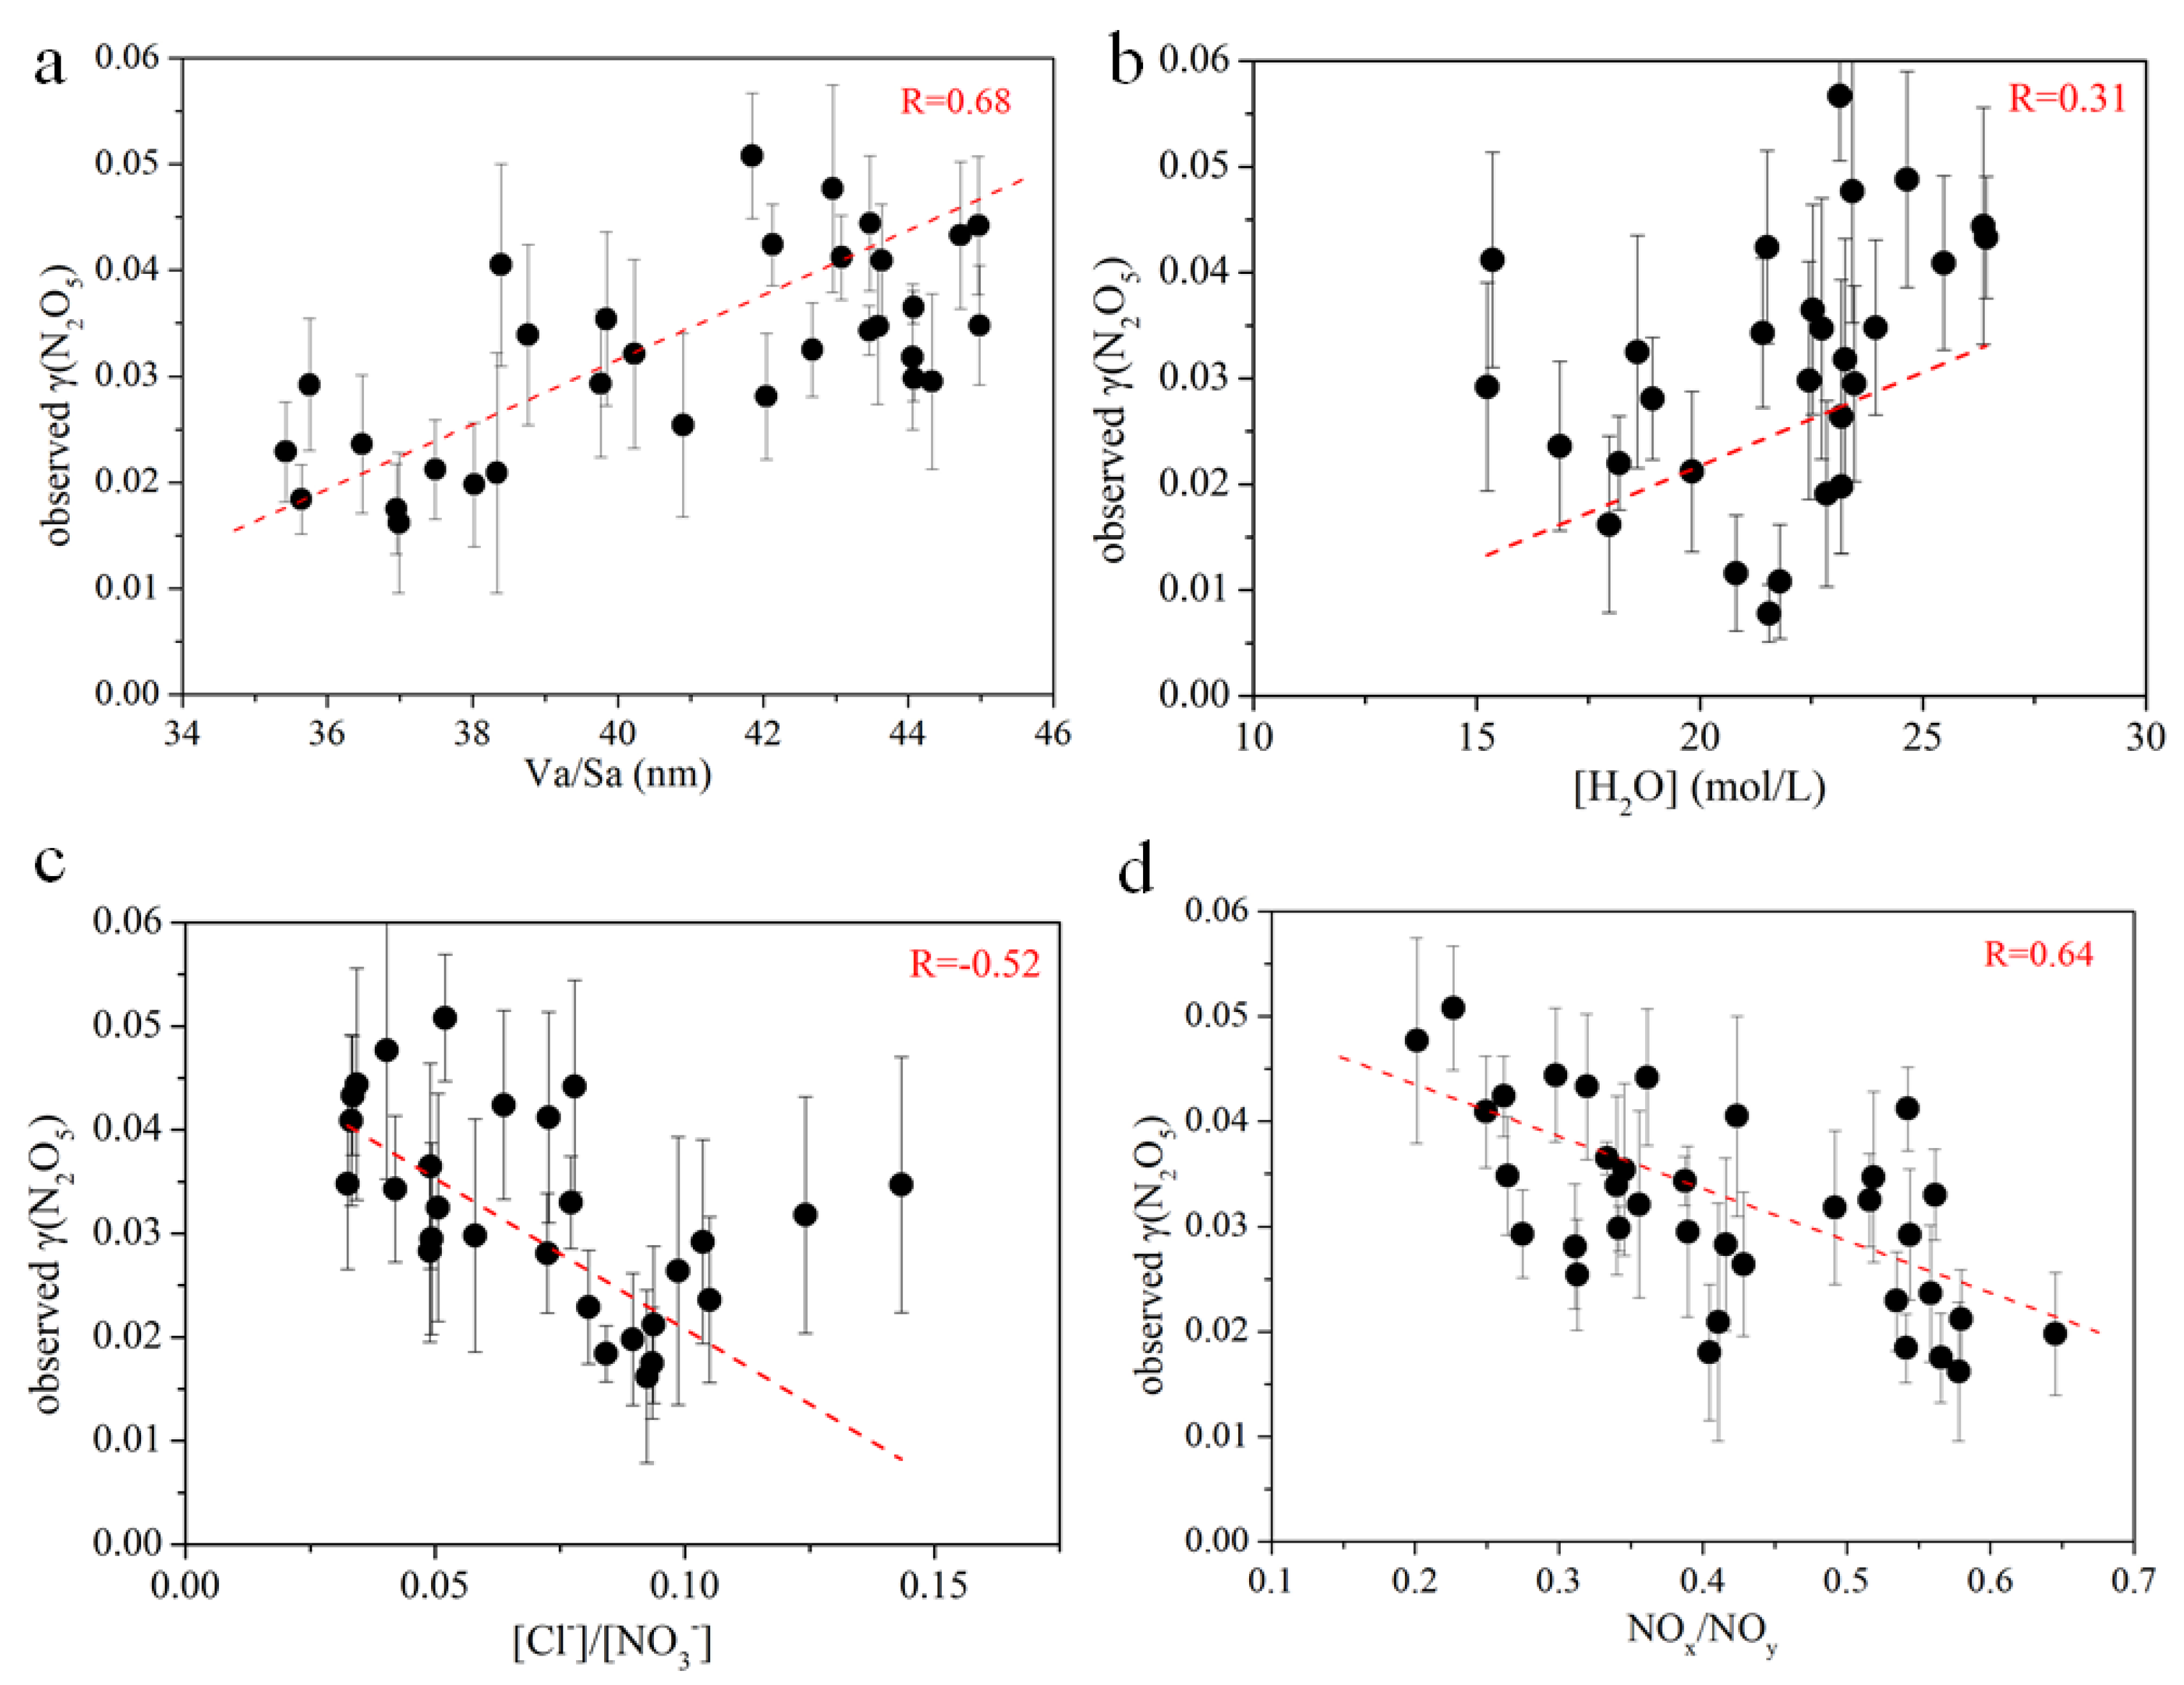
3.4. Influencing Factors of γ(N2O5) and Implications

To further investigate the discrepancy between the observed γ(N2O5) and related parameterizations, various influencing factors of γ(N2O5) were examined, namely aerosol volume to surface ratio (Va/Sa), water content ([H2O]), and ratio of chloride to nitrate ([Cl]/[NO3]). The observed γ(N2O5) shows moderate correlation with Va/Sa (R = 0.68, Figure 6a) but does not exhibit a clear relationship with [H2O] and [Cl]/[NO3] (Figure 6b,c). It seems that the parameter Va/Sa alone can explain the variation of γ(N2O5) in the present study. Including the chemical composition (NO3, H2O, and Cl) worsens the result of parameterizations. This result contrasts with those of previous studies, which were conducted in conditions with higher relative humidity. Positive correlations between γ(N2O5) and [H2O]/[NO3] were reported in Seattle, California, and over the eastern United States [10,28,33]. Our studies in China observed the enhancement effects of [Cl] and [H2O] and the suppression effect of [NO3] [11,32]. No correlation between γ(N2O5) and aerosol size (R2 = 0.025) was found in the northeastern US [10].
The finding that γ(N2O5) is dependent on Va/Sa but not chemical composition may be explained by the dry conditions encountered in this study. The deliquescence relative humidities (DRH) of (NH4)2SO4, NH4Cl, and NH4NO3 at 298 K are 79.9%, 80%, and 61.8% [64], respectively, which is much higher than the RH in this study. Thus, the inorganic components of aerosols (Cl and NO3) observed during our study may not be in the aqueous phase, making aqueous chemical reactions irrelevant to N2O5 uptake. Another interesting observation is the negative correlation between γ(N2O5) and the NOx/NOy ratio (R = 0.64) (Figure 6d). Because NOx/NOy is a measure of the chemical aging of air masses, the negative correlation between γ(N2O5) and NOx/NOy may imply a chemical enhancement effect of unknown secondary products on N2O5 uptake or be explained by the larger particle size as the air masses age.
We then attempted to explore other forms of parameterizations that would better fit the observed γ(N2O5). As the field-derived γ(N2O5) did not show dependence on chemical compositions (i.e., NO3, H2O, and Cl) but exhibited positive correlation with Va/Sa, it was desirable to have a parameterization without [NO3], [H2O], or [Cl] but containing Va/Sa. It turned out that multiplying γ(N2O5)EJ with Va/Sa yielded a good representation of the observed γ(N2O5), with a slope of 1.044, an intercept of 0.0009, and a correlation coefficient of 0.73 as shown in Figure 7 (RMA regression) [25].
Therefore, we propose the following parameterization for dry conditions based on γ(N2O5)EJ:
γ ( N 2 O 5 ) dry = 0.958 × V a S a × γ ( N 2 O 5 ) EJ = 0.958 × V a S a × ( 2.79 × 10 4 + 1.3 × 10 4 × RH 3.43 × 10 6 × RH 2 + 7.52 × 10 8 × RH 3 ) × 10 ( 0.04 × ( T 294 )
where the factor 0.958 is the inverse of the slope 1.044; the units of RH and T are the same as in (Equation (9)), and the unit of Va/Sa is 10−8 m. For example, the value 1.0 is used for Va/Sa in (Equation (15)) when Va/Sa = 10 nm. This parameterization (γ(N2O5)dry) is valid for the observed RH range (20%–56%) and temperature above 282 K which are the conditions encountered in the present study. It is highly desirable to test its applicability in other regions/periods with low humidity.

4. Concluding Remark

This work presents new observational insights into N2O5 uptake on sand dust and urban aerosols under low-humidity conditions. The results reveal a dependence of γ(N2O5) on aerosol properties that differs from those obtained in previous investigations under humid conditions and suggest the important role of the aerosol volume to area ratio (i.e., aerosol diameter). The proposed new parameterization can be used in air quality models to improve simulations of the nighttime fate of NOx and formation of nitrate aerosol in dry and dusty seasons. More investigation is needed to reappraise the controlling factors in N2O5 uptake in dry environments.

Supplementary Materials

The following are available online at https://www.mdpi.com/2073-4433/10/4/204/s1.

Author Contributions

Conceptualization, T.W. and M.X.; formal analysis, M.X.; funding acquisition, T.W.; investigation, M.X., W.W., Z.W., Y.L., C.Y., Y.Z. (Yuechong Zhang), Y.Z. (Yujie Zhang), F.B., and X.C.; methodology, M.X., T.W., J.G., and Hong Li; project administration, J.G., H.L. and T.W.; resources, J.G., H.L., and T.W.; writing—original draft, M.X. and T.W.; writing—review and editing, M.X., W.W., Z.W., J.G., H.L., Y.L., C.Y., Y.Z. (Yuechong Zhang), P.W., Y.Z. (Yujie Zhang), F.B., X.C., and T.W.

Funding

This study was supported by the National Natural Science Foundation of China (91544213) and the Research Grants Council of Hong Kong Special Administrative Region, China (C5022-14G).

Acknowledgments

The authors acknowledge technical support from Steven C.N. Poon and Hui Li and logistics support from Xin Zhang.

Conflicts of Interest

The authors declare that they have no conflict of interest.

Data Availability

To request the data described in this study, please contact the corresponding author ([email protected]).

References

  1. Seinfeld, J.H.; Pandis, S.N. Atmospheric Chemistry and Physics: From Air Pollution to Climate Change; John Wiley & Sons: Hoboken, NJ, USA, 2016. [Google Scholar]
  2. Chang, W.L.; Bhave, P.V.; Brown, S.S.; Riemer, N.; Stutz, J.; Dabdub, D. Heterogeneous atmospheric chemistry, ambient measurements, and model calculations of N2O5: A review. Aerosol Sci. Technol. 2011, 45, 665–695. [Google Scholar] [CrossRef]
  3. Brown, S.S.; Stark, H.; Ryerson, T.B.; Williams, E.J.; Nicks, D.K.; Trainer, M.; Fehsenfeld, F.C.; Ravishankara, A. Nitrogen oxides in the nocturnal boundary layer: Simultaneous in situ measurements of NO3, N2O5, NO2, NO, and O3. J. Geophys. Res. Atmos. 2003, 108. [Google Scholar] [CrossRef]
  4. Brown, S.S.; Stutz, J. Nighttime radical observations and chemistry. Chem. Soc. Rev. 2012, 41, 6405–6447. [Google Scholar] [CrossRef]
  5. Atkinson, R.; Arey, J. Atmospheric degradation of volatile organic compounds. Chem. Rev. 2003, 103, 4605–4638. [Google Scholar] [CrossRef]
  6. Mentel, T.F.; Bleilebens, D.; Wahner, A. A study of nighttime nitrogen oxide oxidation in a large reaction chamber—The fate of NO2, N2O5, HNO3, and O3 at different humidities. Atmos. Environ. 1996, 30, 4007–4020. [Google Scholar] [CrossRef]
  7. Finlayson-Pitts, B.; Ezell, M.; Pitts, J. Formation of chemically active chlorine compounds by reactions of atmospheric NaCl particles with gaseous N2O5 and ClONO2. Nature 1989, 337, 241–244. [Google Scholar] [CrossRef]
  8. Brown, S.; Dibb, J.E.; Stark, H.; Aldener, M.; Vozella, M.; Whitlow, S.; Williams, E.; Lerner, B.M.; Jakoubek, R.; Middlebrook, A. Nighttime removal of NOx in the summer marine boundary layer. Geophys. Res. Lett. 2004, 31. [Google Scholar] [CrossRef]
  9. Behnke, W.; George, C.; Scheer, V.; Zetzsch, C. Production and decay of ClNO2 from the reaction of gaseous N2O5 with NaCl solution: Bulk and aerosol experiments. J. Geophys. Res. Atmos. 1997, 102, 3795–3804. [Google Scholar] [CrossRef]
  10. McDuffie, E.E.; Fibiger, D.L.; Dubé, W.P.; Lopez-Hilfiker, F.; Lee, B.H.; Thornton, J.A.; Shah, V.; Jaeglé, L.; Guo, H.; Weber, R.J. Heterogeneous N2O5 uptake during winter: Aircraft measurements during the 2015 WINTER campaign and critical evaluation of current parameterizations. J. Geophys. Res. Atmos. 2018, 123, 4345–4372. [Google Scholar] [CrossRef]
  11. Tham, Y.J.; Wang, Z.; Li, Q.; Wang, W.; Wang, X.; Lu, K.; Ma, N.; Yan, C.; Kecorius, S.; Wiedensohler, A. Heterogeneous N2O5 uptake coefficient and production yield of ClNO2 in polluted northern China: Roles of aerosol water content and chemical composition. Atmos. Chem. Phys. 2018, 18, 13155–13171. [Google Scholar] [CrossRef]
  12. Kane, S.M.; Caloz, F.; Leu, M.-T. Heterogeneous uptake of gaseous N2O5 by (NH4) 2SO4, NH4HSO4, and H2SO4 aerosols. J. Phys. Chem. A 2001, 105, 6465–6470. [Google Scholar] [CrossRef]
  13. Hallquist, M.; Stewart, D.J.; Stephenson, S.K.; Cox, R.A. Hydrolysis of N2O5 on sub-micron sulfate aerosols. Phys. Chem. Chem. Phys. 2003, 5, 3453–3463. [Google Scholar] [CrossRef]
  14. Bertram, T.; Thornton, J. Toward a general parameterization of N2O5 reactivity on aqueous particles: The competing effects of particle liquid water, nitrate and chloride. Atmos. Chem. Phys. 2009, 9, 8351–8363. [Google Scholar] [CrossRef]
  15. Roberts, J.M.; Osthoff, H.D.; Brown, S.S.; Ravishankara, A.; Coffman, D.; Quinn, P.; Bates, T. Laboratory studies of products of N2O5 uptake on Cl containing substrates. Geophys. Res. Lett. 2009, 36. [Google Scholar] [CrossRef]
  16. Anttila, T.; Kiendler-Scharr, A.; Tillmann, R.; Mentel, T.F. On the reactive uptake of gaseous compounds by organic-coated aqueous aerosols: Theoretical analysis and application to the heterogeneous hydrolysis of N2O5. J. Phys. Chem. A 2006, 110, 10435–10443. [Google Scholar] [CrossRef]
  17. Escorcia, E.N.; Sjostedt, S.J.; Abbatt, J.P. Kinetics of N2O5 Hydrolysis on Secondary Organic Aerosol and Mixed Ammonium Bisulfate− Secondary Organic Aerosol Particles. J. Phys. Chem. A 2010, 114, 13113–13121. [Google Scholar] [CrossRef] [PubMed]
  18. Mogili, P.K.; Kleiber, P.D.; Young, M.A.; Grassian, V.H. N2O5 hydrolysis on the components of mineral dust and sea salt aerosol: Comparison study in an environmental aerosol reaction chamber. Atmos. Environ. 2006, 40, 7401–7408. [Google Scholar] [CrossRef]
  19. Tang, M.; Telford, P.; Pope, F.; Rkiouak, L.; Abraham, N.; Archibald, A.; Braesicke, P.; Pyle, J.; McGregor, J.; Watson, I. Heterogeneous reaction of N2O5 with airborne TiO2 particles and its implication for stratospheric particle injection. Atmos. Chem. Phys. 2014, 14, 6035–6048. [Google Scholar] [CrossRef]
  20. Karagulian, F.; Santschi, C.; Rossi, M. The heterogeneous chemical kinetics of N2O5 on CaCO3 and other atmospheric mineral dust surrogates. Atmos. Chem. Phys. 2006, 6, 1373–1388. [Google Scholar] [CrossRef]
  21. Wagner, C.; Hanisch, F.; Holmes, N.; Coninck, H.d.; Schuster, G.; Crowley, J. The interaction of N2O5 with mineral dust: Aerosol flow tube and Knudsen reactor studies. Atmos. Chem. Phys. 2008, 8, 91–109. [Google Scholar] [CrossRef]
  22. Wagner, C.; Schuster, G.; Crowley, J. An aerosol flow tube study of the interaction of N2O5 with calcite, Arizona dust and quartz. Atmos. Environ. 2009, 43, 5001–5008. [Google Scholar] [CrossRef]
  23. Seisel, S.; Börensen, C.; Vogt, R.; Zellner, R. Kinetics and mechanism of the uptake of N2O5 on mineral dust at 298 K. Atmos. Chem. Phys. 2005, 5, 3423–3432. [Google Scholar] [CrossRef]
  24. Tang, M.; Thieser, J.; Schuster, G.; Crowley, J. Kinetics and mechanism of the heterogeneous reaction of N2O5 with mineral dust particles. Phys. Chem. Chem. Phys. 2012, 14, 8551–8561. [Google Scholar] [CrossRef] [PubMed]
  25. Evans, M.; Jacob, D.J. Impact of new laboratory studies of N2O5 hydrolysis on global model budgets of tropospheric nitrogen oxides, ozone, and OH. Geophys. Res. Lett. 2005, 32. [Google Scholar] [CrossRef]
  26. Davis, J.M.; Bhave, P.V.; Foley, K.M. Parameterization of N2O5 reaction probabilities on the surface of particles containing ammonium, sulfate, and nitrate. Atmos. Chem. Phys. 2008, 8, 5295–5311. [Google Scholar] [CrossRef]
  27. Brown, S.; Ryerson, T.; Wollny, A.; Brock, C.; Peltier, R.; Sullivan, A.; Weber, R.; Dube, W.; Trainer, M.; Meagher, J. Variability in nocturnal nitrogen oxide processing and its role in regional air quality. Science 2006, 311, 67–70. [Google Scholar] [CrossRef] [PubMed]
  28. Bertram, T.H.; Thornton, J.A.; Riedel, T.P.; Middlebrook, A.M.; Bahreini, R.; Bates, T.S.; Quinn, P.K.; Coffman, D.J. Direct observations of N2O5 reactivity on ambient aerosol particles. Geophys. Res. Lett. 2009, 36. [Google Scholar] [CrossRef]
  29. Phillips, G.J.; Thieser, J.; Tang, M.; Sobanski, N.; Schuster, G.; Fachinger, J.; Drewnick, F.; Borrmann, S.; Bingemer, H.; Lelieveld, J. Estimating N2O5 uptake coefficients using ambient measurements of NO3, N2O5, ClNO2 and particle-phase nitrate. Atmos. Chem. Phys. 2016, 16, 13231–13249. [Google Scholar] [CrossRef]
  30. Wagner, N.; Riedel, T.; Young, C.; Bahreini, R.; Brock, C.; Dubé, W.; Kim, S.; Middlebrook, A.; Öztürk, F.; Roberts, J. N2O5 uptake coefficients and nocturnal NO2 removal rates determined from ambient wintertime measurements. J. Geophys. Res. Atmos. 2013, 118, 9331–9350. [Google Scholar] [CrossRef]
  31. Morgan, W.; Ouyang, B.; Allan, J.; Aruffo, E.; Di Carlo, P.; Kennedy, O.; Lowe, D.; Flynn, M.; Rosenberg, P.; Williams, P. Influence of aerosol chemical composition on N2O5 uptake: Airborne regional measurements in northwestern Europe. Atmos. Chem. Phys. 2015, 15, 973–990. [Google Scholar] [CrossRef]
  32. Wang, Z.; Wang, W.; Tham, Y.J.; Li, Q.; Wang, H.; Wen, L.; Wang, X.; Wang, T. Fast heterogeneous N2O5 uptake and ClNO2 production in power plant plumes observed in the nocturnal residual layer over the North China Plain. Atmos. Chem. Phys. 2017, 17, 12361–12378. [Google Scholar] [CrossRef]
  33. Riedel, T.; Bertram, T.; Ryder, O.; Liu, S.; Day, D.; Russell, L.; Gaston, C.; Prather, K.; Thornton, J. Direct N2O5 reactivity measurements at a polluted coastal site. Atmos. Chem. Phys. 2012, 12, 2959–2968. [Google Scholar] [CrossRef]
  34. Wang, T.; Nie, W.; Gao, J.; Xue, L.K.; Gao, X.M.; Wang, X.F.; Qiu, J.; Poon, C.N.; Meinardi, S.; Blake, D.; et al. Air quality during the 2008 Beijing Olympics: Secondary pollutants and regional impact. Atmos. Chem. Phys. 2010, 10, 7603–7615. [Google Scholar] [CrossRef]
  35. Gao, J.; Zhang, Y.; Zhang, M.; Zhang, J.; Wang, S.; Tao, J.; Wang, H.; Luo, D.; Chai, F.; Ren, C. Photochemical properties and source of pollutants during continuous pollution episodes in Beijing, October, 2011. J. Environ. Sci. 2014, 26, 44–53. [Google Scholar] [CrossRef]
  36. Sun, Y.; Zhuang, G.; Wang, Y.; Zhao, X.; Li, J.; Wang, Z.; An, Z. Chemical composition of dust storms in Beijing and implications for the mixing of mineral aerosol with pollution aerosol on the pathway. J. Geophys. Res. Atmos. 2005, 110. [Google Scholar] [CrossRef] [Green Version]
  37. Wang, T.; Tham, Y.J.; Xue, L.; Li, Q.; Zha, Q.; Wang, Z.; Poon, S.C.; Dubé, W.P.; Blake, D.R.; Louie, P.K. Observations of nitryl chloride and modeling its source and effect on ozone in the planetary boundary layer of southern China. J. Geophys. Res. Atmos. 2016, 121, 2476–2489. [Google Scholar] [CrossRef]
  38. Tham, Y.J.; Wang, Z.; Li, Q.; Yun, H.; Wang, W.; Wang, X.; Xue, L.; Lu, K.; Ma, N.; Bohn, B.; et al. Significant concentrations of nitryl chloride sustained in the morning: Investigations of the causes and impacts on ozone production in a polluted region of northern China. Atmos. Chem. Phys. 2016, 16, 14959–14977. [Google Scholar] [CrossRef]
  39. Yun, H.; Wang, W.; Wang, T.; Xia, M.; Yu, C.; Wang, Z.; Poon, S.C.N.; Yue, D.; Zhou, Y. Nitrate formation from heterogeneous uptake of dinitrogen pentoxide during a severe winter haze in southern China. Atmos. Chem. Phys. 2018, 2018, 23. [Google Scholar] [CrossRef]
  40. Jongejan, P.; Bai, Y.; Veltkamp, A.; Wye, G.; Slaninaa, J. An automated field instrument for the determination of acidic gases in air. Int. J. Environ. Anal. Chem. 1997, 66, 241–251. [Google Scholar] [CrossRef]
  41. Rumsey, I.; Cowen, K.; Walker, J.; Kelly, T.; Hanft, E.; Mishoe, K.; Rogers, C.; Proost, R.; Beachley, G.; Lear, G. An assessment of the performance of the Monitor for AeRosols and GAses in ambient air (MARGA): A semi-continuous method for soluble compounds. Atmos. Chem. Phys. 2014, 14, 5639–5658. [Google Scholar] [CrossRef]
  42. Zhang, H.; Li, H.; Zhang, Q.; Zhang, Y.; Zhang, W.; Wang, X.; Bi, F.; Chai, F.; Gao, J.; Meng, L. Atmospheric Volatile Organic Compounds in a Typical Urban Area of Beijing: Pollution Characterization, Health Risk Assessment and Source Apportionment. Atmosphere 2017, 8, 61. [Google Scholar] [CrossRef]
  43. Gao, J.; Wang, T.; Zhou, X.; Wu, W.; Wang, W. Measurement of aerosol number size distributions in the Yangtze River delta in China: Formation and growth of particles under polluted conditions. Atmos. Environ. 2009, 43, 829–836. [Google Scholar] [CrossRef]
  44. Wang, X.; Wang, H.; Xue, L.; Wang, T.; Wang, L.; Gu, R.; Wang, W.; Tham, Y.J.; Wang, Z.; Yang, L.; et al. Observations of N2O5 and ClNO2 at a polluted urban surface site in North China: High N2O5 uptake coefficients and low ClNO2 product yields. Atmos. Environ. 2017, 156, 125–134. [Google Scholar] [CrossRef]
  45. Lewis, E.R. An examination of Köhler theory resulting in an accurate expression for the equilibrium radius ratio of a hygroscopic aerosol particle valid up to and including relative humidity 100%. J. Geophys. Res. Atmos. 2008, 113. [Google Scholar] [CrossRef] [Green Version]
  46. Kanaya, Y.; Cao, R.; Akimoto, H.; Fukuda, M.; Komazaki, Y.; Yokouchi, Y.; Koike, M.; Tanimoto, H.; Takegawa, N.; Kondo, Y. Urban photochemistry in central Tokyo: 1. Observed and modeled OH and HO2 radical concentrations during the winter and summer of 2004. J. Geophys. Res. Atmos. 2007, 112. [Google Scholar] [CrossRef]
  47. McLaren, R.; Wojtal, P.; Majonis, D.; McCourt, J.; Halla, J.; Brook, J. NO3 radical measurements in a polluted marine environment: Links to ozone formation. Atmos. Chem. Phys. 2010, 10, 4187–4206. [Google Scholar] [CrossRef]
  48. Wahner, A.; Mentel, T.F.; Sohn, M. Gas-phase reaction of N2O5 with water vapor: Importance of heterogeneous hydrolysis of N2O5 and surface desorption of HNO3 in a large Teflon chamber. Geophys. Res. Lett. 1998, 25, 2169–2172. [Google Scholar] [CrossRef]
  49. Wexler, A.S. Atmospheric aerosol models for systems including the ions H+, NH4+, Na+, SO42−, NO3, Cl, Br, and H2O. J. Geophys. Res. 2002, 107. [Google Scholar] [CrossRef]
  50. Riemer, N.; Vogel, H.; Vogel, B.; Anttila, T.; Kiendler-Scharr, A.; Mentel, T. Relative importance of organic coatings for the heterogeneous hydrolysis of N2O5 during summer in Europe. J. Geophys. Res. Atmos. 2009, 114. [Google Scholar] [CrossRef]
  51. Draxler, R.R.; Hess, G. An overview of the HYSPLIT_4 modelling system for trajectories. Aust. Meteorol. Mag. 1998, 47, 295–308. [Google Scholar]
  52. Osthoff, H.D.; Roberts, J.M.; Ravishankara, A.R.; Williams, E.J.; Lerner, B.M.; Sommariva, R.; Bates, T.S.; Coffman, D.; Quinn, P.K.; Dibb, J.E.; et al. High levels of nitryl chloride in the polluted subtropical marine boundary layer. Nat. Geosci. 2008, 1, 324–328. [Google Scholar] [CrossRef]
  53. Thornton, J.A.; Kercher, J.P.; Riedel, T.P.; Wagner, N.L.; Cozic, J.; Holloway, J.S.; Dube, W.P.; Wolfe, G.M.; Quinn, P.K.; Middlebrook, A.M.; et al. A large atomic chlorine source inferred from mid-continental reactive nitrogen chemistry. Nature 2010, 464, 271–274. [Google Scholar] [CrossRef]
  54. Mielke, L.H.; Furgeson, A.; Osthoff, H.D. Observation of ClNO2 in a mid-continental urban environment. Environ. Sci. Technol. 2011, 45, 8889–8896. [Google Scholar] [CrossRef]
  55. Wang, H.; Lu, K.; Chen, X.; Zhu, Q.; Chen, Q.; Guo, S.; Jiang, M.; Li, X.; Shang, D.; Tan, Z. High N2O5 Concentrations Observed in Urban Beijing: Implications of a Large Nitrate Formation Pathway. Environ. Sci. Technol. Lett. 2017, 4, 416–420. [Google Scholar] [CrossRef]
  56. Breton, M.L.; Hallquist, Å.M.; Pathak, R.K.; Simpson, D.; Wang, Y.; Johansson, J.; Zheng, J.; Yang, Y.; Shang, D.; Wang, H. Chlorine oxidation of VOCs at a semi-rural site in Beijing: Significant chlorine liberation from ClNO2 and subsequent gas-and particle-phase Cl–VOC production. Atmos. Chem. Phys. 2018, 18, 13013–13030. [Google Scholar] [CrossRef]
  57. Wang, H.; Lu, K.; Guo, S.; Wu, Z.; Shang, D.; Tan, Z.; Wang, Y.; Breton, M.L.; Lou, S.; Tang, M. Efficient N2O5 uptake and NO3 oxidation in the outflow of urban Beijing. Atmos. Chem. Phys. 2018, 18, 9705–9721. [Google Scholar] [CrossRef]
  58. Zhou, W.; Zhao, J.; Ouyang, B.; Mehra, A.; Xu, W.; Wang, Y.; Bannan, T.J.; Worrall, S.D.; Priestley, M.; Bacak, A. Production of N2O5 and ClNO2 in summer in urban Beijing, China. Atmos. Chem. Phys. 2018, 18, 11581–11597. [Google Scholar] [CrossRef]
  59. Brown, S.S.; Dubé, W.P.; Fuchs, H.; Ryerson, T.B.; Wollny, A.G.; Brock, C.A.; Bahreini, R.; Middlebrook, A.M.; Neuman, J.A.; Atlas, E. Reactive uptake coefficients for N2O5 determined from aircraft measurements during the Second Texas Air Quality Study: Comparison to current model parameterizations. J. Geophys. Res. Atmos. 2009, 114. [Google Scholar] [CrossRef]
  60. Stone, D.; Evans, M.; Walker, H.; Ingham, T.; Vaughan, S.; Ouyang, B.; Kennedy, O.; McLeod, M.; Jones, R.; Hopkins, J. Radical chemistry at night: Comparisons between observed and modelled HOx, NO3 and N2O5 during the RONOCO project. Atmos. Chem. Phys. 2014, 14, 1299–1321. [Google Scholar] [CrossRef]
  61. Tang, M.; Thieser, J.; Schuster, G.; Crowley, J. Uptake of NO3 and N2O5 to Saharan dust, ambient urban aerosol and soot: A relative rate study. Atmos. Chem. Phys. 2010, 10, 2965–2974. [Google Scholar] [CrossRef]
  62. McDuffie, E.E.; Fibiger, D.L.; Dubé, W.P.; Lopez Hilfiker, F.; Lee, B.H.; Jaeglé, L.; Guo, H.; Weber, R.J.; Reeves, J.M.; Weinheimer, A.J. ClNO2 yields from aircraft measurements during the 2015 WINTER campaign and critical evaluation of the current parameterization. J. Geophys. Res. Atmos. 2018, 123, 12994–13015. [Google Scholar]
  63. Tang, M.; Cziczo, D.J.; Grassian, V.H. Interactions of water with mineral dust aerosol: Water adsorption, hygroscopicity, cloud condensation, and ice nucleation. Chem. Rev. 2016, 116, 4205–4259. [Google Scholar] [CrossRef]
  64. Tang, I.N. On the equilibrium partial pressures of nitric acid and ammonia in the atmosphere. Atmos. Environ. (1967) 1980, 14, 819–828. [Google Scholar] [CrossRef]
Figure 1. (a) A regional view of the position of Beijing on the North China Plain. (b) Location of the sampling site, CRAES, in Beijing, and major roads (blue line). The red star denotes the center of Beijing. (c) Wind rose plot during the observation period. (The map is from Google Earth).
Atmosphere 10 00204 g001
Figure 2. Time series of N2O5, ClNO2, related species, and meteorological parameters from 24th April to 31st May 2017. The sampling period in orange denotes a heavy sand storm event. Data gaps are caused by technical issues with the instruments or calibration.
Atmosphere 10 00204 g002
Figure 3. Time series of N2O5, ClNO2, and related species in a heavy sand storm event on the night of 3rd and 4th May. Also shown is the 5-min average γ(N2O5) (see Section 3.3).
Atmosphere 10 00204 g003
Figure 4. (a) N2O5 lifetime and (b) N2O5 loss rate coefficients in selected N2O5-rich or ClNO2-rich air masses. The upper and bottom whiskers show the 10% and 90% percentiles. The upper, middle, and bottom lines in the boxes denote the 75%, median, and 25% percentiles, respectively. The squares show the average values. Orange denotes light dust cases and heavy sand storm events, while blue represents urban air masses. The selected time periods were 20:00~04:00 local time (LT) for each night. For example, 30th Apr denoted 30th Apr 20:00 LT~1st May 04:00 LT. Exceptions were the night of 3rd May where 04:30~06:30 LT on 4th May was selected, and 4th May where 01:00~05:30 LT on 5th May was selected.
Atmosphere 10 00204 g004
Figure 5. The relationship of parameterizations of γ(N2O5) to observed γ(N2O5) in urban air masses. Error bars of the observed γ(N2O5) represents the standard deviation of the 12 γ(N2O5) values obtained within one hour. Error bars of the parameterized γ(N2O5) denote propagated uncertainty.
Atmosphere 10 00204 g005
Figure 6. Dependence of γ(N2O5) on several parameters in urban air masses: (a) Va/Sa; (b) aerosol water content ([H2O]); (c) molar ratio of aerosol chloride to nitrate in the aqueous phase ([Cl]/[NO3]); (d) ratio of NOx to NOy (NOx/NOy). The error bars of γ(N2O5) have the same meaning as in Figure 5.
Atmosphere 10 00204 g006
Figure 7. Scatter plot of γ(N2O5)EJVa/Sa and the observed γ(N2O5).
Atmosphere 10 00204 g007
Table 1. Field-derived N2O5 uptake coefficient (average ± standard deviation) and ClNO2 production yield estimated for the selected periods. The time periods are all local time (LT). Since only one φ(ClNO2) value was derived for each time period, no standard deviation was obtained for φ(ClNO2).
CategoryPeriodsγ(N2O5)φ(ClNO2)Notes
FromTo
Urban air masses16th May 23:0017th May 04:000.022 ± 0.0050.065
17th May 21:0018th May 01:000.013 ± 0.0060.048
18th May 21:0019th May 04:000.030 ± 0.0090.055 (21:26~22:41)ClNO2 yield changed
0.117 (01:06~03:31)
20th May 21:0021st May 04:000.032 ± 0.0070.082
22nd May 0:0022nd May 04:000.035 ± 0.0100.312
27th May 20:0028th May 04:000.042 ± 0.0080.084 (20:01~21:36)ClNO2 yield changed
0.319 (01:36~03:01)
28th May 20:0028th May 23:000.023 ± 0.0070.142
Heavy sand storm events4th May 04:004th May 06:000.019 ± 0.0120.677Sand storm arrived
4th May 23:005th May 05:000.044 ± 0.0020.129Sand storm continued

