1. Introduction
Air pollution harms human health and lives, and it also has various indirect implications for society and the economy by, for example, undermining a country’s economic growth potential through a reduction of people’s work hours and a loss of agricultural productivity [
1,
2]. In places of heavily polluted air in Asia, a loss of tourism revenue may also be significant. The United Nations’ Sustainable Development Goals (SDGs), the international policy goals effective from 2015 until 2030, recognize air pollution as a global problem that needs to be addressed with explicit quantified targets. Air pollution is explicitly mentioned in the SDGs’ Target 3.9 (“By 2030, substantially reduce the number of deaths and illnesses from hazardous chemicals and air, water and soil pollution and contamination”) and Target 11.6 (“By 2030, reduce the adverse per capita environmental impact of cities, including by paying special attention to air quality and municipal and other waste management”).
Two of the most important air pollutants are ozone and particulate matter (PM). They cause a number of problems such as adverse effects on human health, forest degradation and acidification of ecosystems. These pollutants are recognized as key pollutants with high-priority for the control in a number of international frameworks, such as the Acid Deposition Monitoring Network in East Asia (EANET), the ASEAN Agreement on Transboundary Haze Pollution and the Task Force on Hemispheric Transport of Air Pollution (TF HTAP) under the Convention on Long-range Transboundary Air Pollution (CLRTAP).
Of these, PM is a complex mixture of small particles and liquid droplets. It is composed of a number of components, including acidic compounds of nitrates and sulfates, which are formed in the atmosphere from chemical reactions, organic substances (both released directly from emission sources and formed in the atmosphere), metals and dust particles. The sizes of particles are an important factor of their associated adverse health effects. Fine particulate matter (PM
2.5), the particles that are of 2.5 micrometers in diameter or smaller, can be emitted from combustion sources, such as diesel engines and biomass burning, or formed in the atmosphere from chemical reactions of SO
2, NO
x and VOCs. PM
2.5 can penetrate deeply into the lung, irritate and corrode the alveolar wall, and subsequently impair lung function. Consequently, PM
2.5 has a potential risk for human health, especially premature mortality under long-term exposure. It is estimated that the number of PM
2.5-induced average annual premature deaths in South and Southeast Asia from 1999 to 2014 was 1,447,000 [
3]. By considering three future cases of policy success; reference; and policy failure, a study [
4] estimates the annual premature mortality rates due to the effects of both ozone and PM
2.5 in East Asia to be 451,000; 649,000; and 1,035,000 for the year of 2020, respectively.
The Bangkok Metropolitan Region (BMR), the center of the population and economic activities of Thailand, has experienced rapid economic growth in recent years, and alongside, has faced a serious problem of air pollution. PM
2.5 has become a concern for the region recently partly reflecting the pollutant’s increasing international recognition, and it has led to the introduction of the PM
2.5 air quality standard in 2010 in the country. Monitoring results by the national agency of environmental regulation (the Pollution Control Department or PCD) show that annual average PM
2.5 concentrations in 2017 were 42 µg/m
3 in Bangkok, 30 µg/m
3 in Khon Kaen, 53 µg/m
3 in Saraburi and 57 µg/m
3 in Chiang Mai [
5]. Although the annual levels in these major cities in Thailand have not been significantly changed since 2012, the annual PM
2.5 concentrations persistently exceed the national air quality standard levels of 25 µg/m
3.
The PM
2.5 problem in BMR has many similarities to that in many other areas of the world, but it also has some particularities for the region. Along with the emissions from the common sources of PM
2.5 such as the traffic and industrial activities, BMR experiences the intensive emissions from crop residue field burning, i.e., rice straw, during the harvesting periods [
6,
7]. Besides, the air pollution problem in BMR has some distinctive features associated with its tropical monsoon climate with a dry and a rainy season in a year, and this leads to a large difference in concentration levels between these seasons. The dry season with the prevalent northeast monsoon has more stagnant air, less rain hence less wet removal of air pollution, more emissions from open burning, and consequently, the levels of air pollutants including PM
2.5 are much higher than those in the wet season. Prior to our study, there were several studies focusing on the PM pollution in BMR with the detail PM compositions for source apportionment studies ([
8,
9,
10]; [
11] and references therein). However, the previous studies were mainly based on intermittent PM sampling, two to three times of 24-hour sampling per week and mainly focusing on selected months to represent the wet and dry seasons. The information on PM
2.5 levels and comprehensive compositional data based on a continuous record for an entire year has not been reported in any previous study.
To fill this research gap, the Japan International Cooperation Agency (JICA), jointly with the Asian Institute of Technology (AIT) and the Asia Center for Air Pollution Research (ACAP), conducted a research project with key activities including: (i) continuous monitoring of PM
2.5 and its compositions, (ii) updating and refining the emission inventory database, and (iii) conducting case studies of PM policies in selected Asia-Pacific countries that could be contrasted with the BMR case. The continuous monitoring was performed through a weekly sampling using the filter pack samplers (one sample was collected over seven days of a week) and subsequent analysis of PM
2.5 mass and compositions of water soluble ions, elements, and elemental carbon (EC)/organic carbon (OC). Because deposition processes are important to determine the lifetime of PM and atmospheric burden on the ground, the rain-water chemical compositions were analyzed to determine the wet acid deposition, while the dry deposition was determined by the inferential method [
12]. The monitoring was done in two locations of BMR, a suburban site (in the AIT campus) and a city center site (the Pollution Control Department) from September 2015 to March 2017.
This paper gives a general overview of our findings of the project research activities and discusses the findings in the policy contexts and implications. Details of our scientific results on the PM compositions and source apportionment will be reported in a forthcoming paper (Kim Oanh et al., in preparation) while the acid deposition will be presented in Huo et al. (in preparation). Our monitoring data confirm the previous studies in that the levels of PM2.5 in the region are high and potential of posing significant health risks, and that transportation and biomass burning are two major sources of the pollutant in BMR. Given the general trend of further economic growth for Thailand, it is possible that air pollution will exacerbate in the near future. In BMR, where a set of conventional regulatory instruments on air quality management are already in place, a solution for the air pollution problem should lie in a combination of air quality regulation and other policies, such as traffic management, energy, and agricultural policies.
The remaining part of the paper is organized as follows. In
Section 2, we summarize the existing policy framework for air pollution control in Thailand.
Section 3 discusses the basic characteristics of PM pollution in BMR by overviewing the obtained data from our monitoring activity.
Section 4 provides a discussion on policy implications for controlling the PM
2.5 problem, and
Section 5 concludes.
2. Policy Actions against PM Pollution in Thailand
The government of Thailand has long recognized the problem of air pollution, and the country has already implemented a range of air quality and emission standards largely comparable with those of other major countries [
13].
The legal basis of environmental quality standards in the country is the Enhancement and Conservation of National Environmental Quality Act established in 1992. The law is enforced by the Pollution Control Department (PCD), the primary national agency of environmental regulation under the Ministry of Natural Resources and Environment. The national ambient air quality standards (NAAQS), which were based on the law and first issued in 1995, are reviewed and modified by the National Environment Board, whose chair is the Prime Minister and whose members include several other ministers from national agencies such as the Ministry of Industry, the Ministry of Natural Resources and Environment, the Ministry of Energy, and the Ministry of Interior.
The Thai NAAQS have been set for major air pollutants [
13]. Originally, the standards were established for carbon monoxide, nitrogen dioxide, sulfur dioxide, lead, PM
10 (particulate matter of 10 micrometers or less in diameter) and TSP (total suspended particles). Later the regulation has been extended to PM
2.5 and it has been effectively promulgated since March 2010. The NAAQS for volatile organic compounds (VOCs) have also been made effective since 2007. The current Thai national air quality standards for the criteria air pollutants are shown in
Table A1 of the
Appendix A.
Monitoring of ambient air quality in Thailand has been conducted since 1983 by the PCD. At present, the ambient air quality monitoring network consists of above 60 continuous fixed ambient air quality monitoring stations that are spreading over the whole country [
5]. The Bangkok city alone has in total 12 continuous automatic monitoring stations operated by PCD (as of 2018). There are nine mobile stations operated by PCD. These stations are used to monitor air quality close to sources and to respond to area-specific pollution complaints and research purposes. The stations record hourly data of SO
2, NO
2, CO, O
3, PM
10, and meteorology parameters. PM
2.5 monitoring has been initiated in the Samut Sakon province (1 station) since 2013 and two stations in Bangkok since 2014. The PM
2.5 monitoring network has been expanding fast. As of 2016, PM
2.5 monitoring has been installed in 33 stations throughout the country and at present most of the stations provide hourly PM
2.5 data (
http://air4thai.pcd.go.th/webV2/history/). However, only the hourly mass of PM
2.5 is recorded using the online method, e.g., using the Beta attenuation, and there is no compositional data produced by the PCD network. In addition to the PCD monitors, several international collaboration projects reported PM
2.5 mass and composition for source apportionment studies, for example [
8,
14,
15]. The map showing the location of monitoring stations in this study and several PCD network stations is presented in
Figure A1,
Appendix A. Based on the degree of non-compliance with the NAASQs, local governments determine and implement actions plans for pollution control. For example, to address pollution of the Greater Bangkok region, the Bangkok Air Quality and Noise Management Action Plan has been established with the involvement of PCD, the Bangkok Metropolitan Administration, five Provinces (Nontaburi, Pathumthani, Samutprakarn, Samutsakorn and Nakhonpratom) and relevant national agencies such the Land Transport Department, the Royal Thai Police, the Highways Department and the Department of City Planning. The Plan serves as a framework for the national agencies to take countermeasures against problems associated with air pollution.
Thailand also has a set of emission standards for mobile and point sources. Control of mobile source emissions is managed by the PCD. The regulatory body has adopted the Euro emission standards for automobiles since 1998. New light-duty vehicles in Thailand have been obligated to conform with the Euro 4 emissions standards since 2012. These regulations on mobile sources are complemented with public campaigns for the use of public transportation and of transportation based not on petroleum, but on alternative fuels, such as natural gas and electricity. Meanwhile, PCD also issued a standard in 2018 on the emissions of small passenger cars that have been modified to use natural gas, which have become a large contributor to air pollution.
Regulation of emissions from point sources are managed by different national ministries depending on the source type, i.e., the Ministry of Industry oversees the emissions from industry and refineries, while the Ministry of Natural Resources and Environment regulates emissions from power plants. The government has recently introduced regulation for VOCs, for example, is a mandate for the installment of vapor collector for oil distribution depots, oil road tankers, and service stations which also help to reduce the precursors of secondary organic aerosol (a component of PM2.5) in the country.
A major contributor to air pollution in Thailand is the biomass burning including forest fires and open burning of crop residues, both of them are associated with human activities. For air pollution from biomass burning, the Thai government has made the National Master Plan for Open Burning Control (agreed in 2003) and the National Fire and Haze Control Plan of Action (agreed in 2013), which correspond to the regional framework, the ASEAN Agreement on Trans-boundary Haze Pollution that was signed in 2002. The master plans specify control measures for the burning of forest and agricultural residues. The plan has a target of the burning of no more than 48,000 ha/year of forest area by 2030 and zero burning for crop residues throughout the country. For example, in 2017, the Thai government imposed the policy to mitigate the haze problem by banning burning in Northern Thailand during the period from 20 February to 17 April that reduced the number of hotspots and PM10 measured in March in the Chiangrai province (Kunphan, 2017, AIT master’s thesis). Additionally, in cases of severe haze and smoke incidents, the provincial governor can issue a ban on open burning under the framework of the Public Disaster Prevention and Mitigation Act.
As the most recent development, Bangkok met serious episodes of PM2.5 air pollution in January 2019. In response to the emergency, the National Environment Board was called and deliberated the plan to implement the Euro 5 emission standards in the next five years and also lower the daily ambient air quality standard of PM2.5 concentrations from 50 µg/m3 to 35 µg/m3 for the next three to five years and then to 25 µg/m3 (the WHO guideline level) in next 10 to 20 years.
3. Monitoring Results of PM and Acid Deposition in BMR
We conducted continuous measurements of PM2.5, its component species, and acid deposition in BMR to obtain representative pollution characteristics of the region. Two sampling sites were rigorously selected mainly to represent the urban and sub-urban areas of Bangkok. One is located at the rooftop of the Pollution Control Department (PCD), Bangkok (urban, city center) and the other is at the rooftop of the ambient laboratory of AIT (sub-urban). The rooftop of PCD building is located at 13.8° (N) and 100.5° (E) that is situated 64 meters high above the ground. The building is mainly surrounded by houses, commercial places, and institutions within a radius of 5 km. It is approximately located 0.75 km away from the main road (Paholyothin Rd), which has heavy traffic congestion during rush hours. A sky train line is located above this road. The AIT site is in Pathumthani, at 14.1° (N) and 100.6° (E), and 6 meters above the ground. This university site is surrounded by many canals, rice paddies, and other crops fields, as well as some small and medium industries. A mixed industrial estate is located about 8 km to the North (Navanakhon Industrial Estate) and the other was about 6 km to the South (Thai industry). AIT is located approximately 0.5 km away from the main road (Paholyothin Rd) and is about 40 km from the Bangkok center. It is situated at the upwind of the Bangkok city during the dry season. The monitoring activities were conducted simultaneously at these two sites during the period from September 2015 to March 2017, that yielded a total of 78 weekly samples at each site. A weekly sample was collected over a week period, from Monday to Monday of next week.
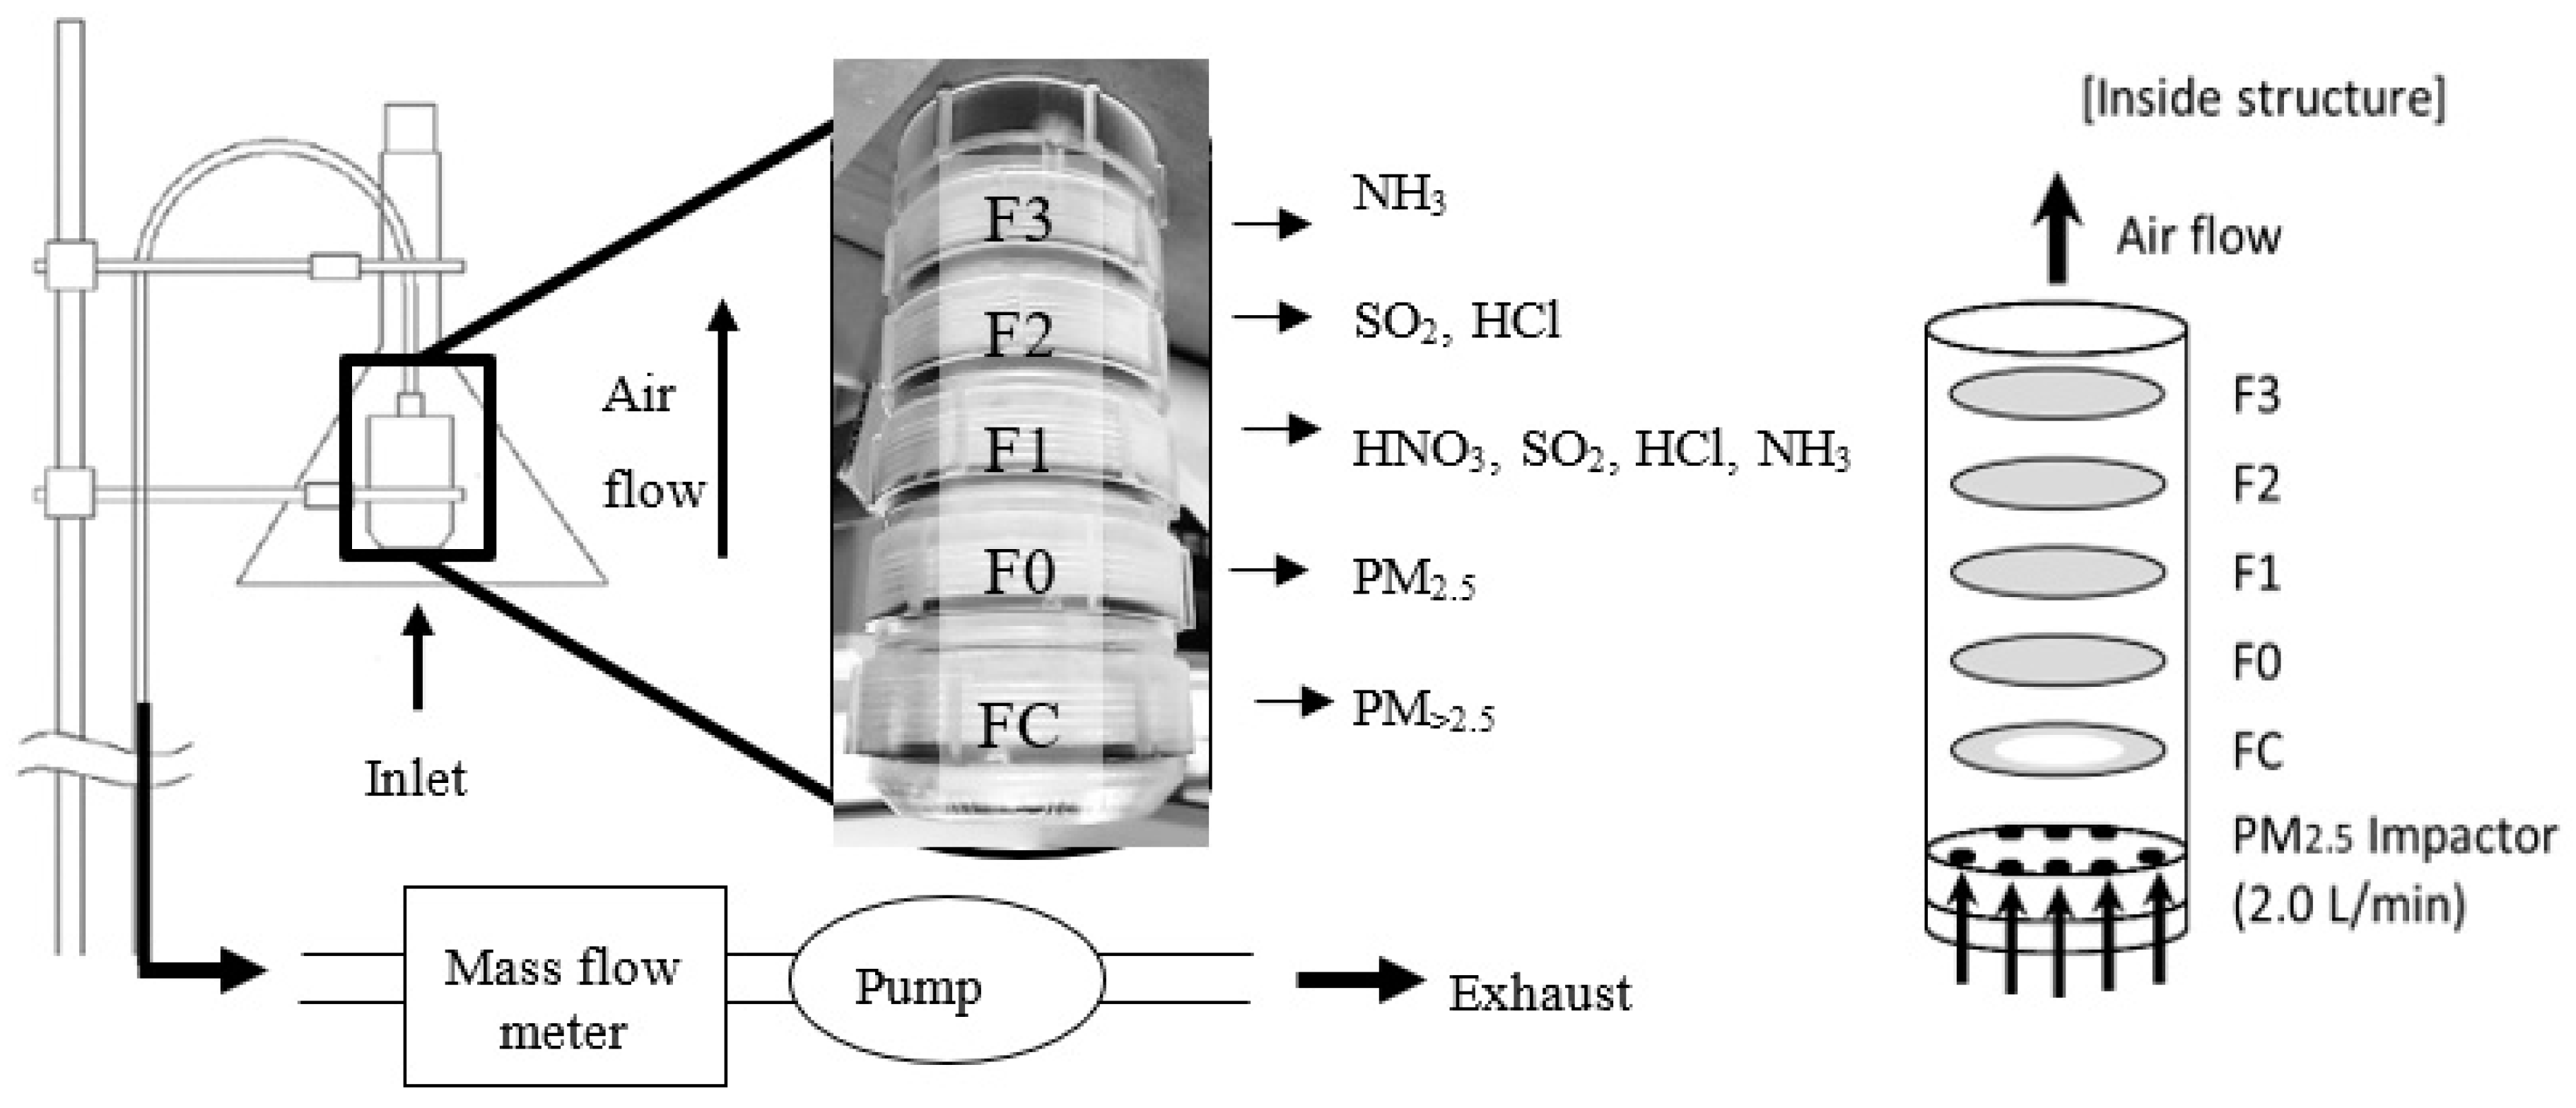
One five-stage and one two-stage filter pack air sampler were deployed at each site to collect weekly ambient air samples for PM mass and composition analyses, as well as the acidic gases for dry deposition analysis. A wet deposition sampler was also deployed at each site to collect the rain samples for subsequent chemical characterization. The five-stage filter pack collected air samples on two types of filters on the first and second stages: a quartz filter for the coarse PM (PM with size > 2.5 µm, FC) and a Teflon filter for the fine PM (PM
2.5, F0) which were used for mass and ionic composition analyses (see
Figure A2,
Appendix A for the schematic diagram). A PM
2.5 impactor with 50% cut-off aerodynamic diameter of 2.5 μm at the flow rate of 2.0 L/min was used to retain only fine particle (PM
2.5) on the F0 stage. The remaining 3 stages collected the gases (SO
2, HCl, HNO
3, and NH
3) on the impregnated filters. To collect additional PM samples for other analysis, a 2-stage filter pack with a PM
2.5 impactor was used in parallel which collected coarse and fine PM on quartz filters for subsequent EC/OC analysis using the Thermal Optical Reflectance (TOR) method. The sampling pumping rate was controlled at 2.0 L/min continuously over a one-week sampling period [
12] using a mass flow controller. More detail description of the filter pack samplers is given in the Technical Manual of EANET [
16]. The PM mass was quantified using a microbalance while water soluble ions (SO
42−, NO
3−, C
l−, NH
4+, Na
+, K
+, Ca
2+, Mg
2+) were analyzed by ion chromatography. Selected key elements were also analyzed by ICP-MS. The sampling and analyses were done strictly following QA/QC to ensure required data quality [
12]. Details of our methodology are described in Kim Oanh et al. (in preparation) and Huo et al. (in preparation).
3.1. Levels of PM in BMR
Figure 1 shows the monthly PM
2.5 mass concentrations calculated from our weekly sampling results as well as the data at PCD operated stations (AIT master’s theses by Tanatat 2018; Mahawong 2017; Saensud 2016). For comparison, the figure also shows the monthly levels calculated from available hourly data of the PCD PM
2.5 network in BMR for the same period. It is shown that the levels of PM
2.5 at AIT and PCD had similar seasonal variation patterns, higher in the dry season and lower in the wet season. The total PM
2.5 mass concentrations measured at the two stations were comparable. The levels measured at our PCD station (64 m above the ground level) were in the same range of those measured at a Thai government network station (59T-GPRU) located in the same area, at about 250 m away from the PCD station but at the ground level. The period average PM
2.5 mass measured at the height of 64 m (20.4 µg/m
3) was only slightly lower than that the level measured at the ground (21.3 µg/m
3). In term of mass concentration thus the PM
2.5 pollution was quite similar between the ground-based and 64 m-high monitoring stations. However, no compositional data were available at 59-T station to provide necessary insights into contributing source factors hence calls for further research.
The PM
2.5 levels were also quite similar between the urban center and the suburban sites. The annual levels calculated from the project data for 2016 (January–December) was 20.6 µg/m
3 at PCD and 22.5 µg/m
3 at AIT, which were still below the NAAQS of 25 µg/m
3. However, the seasonal averages (
Table 1) show that the levels in the dry season are significantly higher, 29.0 µg/mm
3 at PCD and 32.6 µg/m
3 at AIT, compared to the wet season levels of 14.7 µg/m
3 at PCD and 15.2 µg/m
3 at AIT, and this suggests a high risk of exposure during the dry season. The ratio of PM
2.5 to SPM (PM
2.5 + PM
>2.5) was also quite uniform across the sites and was higher in the dry season, 0.42–0.43, despite higher levels of the coarse fraction (PM
>2.5) observed in this season.
3.2. Source Contributions of PM
The source contributions to PM pollution in BMR was determined using two approaches: the receptor modeling and emission inventory (EI). The receptor modeling approach for PM
2.5 basically includes a range of multivariate analysis methods that use ambient air measurements of PM
2.5 mass and compositions to infer the source types and source contributions to the measured PM
2.5 at a receptor site [
17,
18]. Several types of receptor models are available which are commonly used to solve particulate air quality problems, and each has strengths and limitations [
17]. In this paper, we analyzed the weekly monitoring data of PM
2.5 (mass and composition) at two sites to identify the key sources (using reconstructed mass) and estimate their quantitative contributions (using Chemical Mass Balance receptor modeling) to the ambient PM
2.5 mass.
Emission inventory by definition is a comprehensive list of all emission sources and the amount of the target pollutants released from these sources from the study area during a specified period, e.g., one year [
16]. We used the emission inventory (EI) approach to estimate the total annual loads of PM
2.5, PM
10, organic carbon (OC) aerosol, black carbon (BC) aerosol, NO
x, SO
x, CO, NH
3, and non-methane VOC (NMVOC) to the air from the key sources in the BMR domain. Note that the receptor modeling approach is based on the PM mass and compositions measured at a site (receptor) hence can account for the primary and secondary (formed in the atmosphere from precursors) originated from inside of the domain as well as those transported from outside of the domain to the measurement site. The EI approach, however, can only account for the primary pollutants, particles and PM precursors such as VOC, NO
x and SO
x, that are released from the sources located inside the inventory domain, and no secondary PM can be accounted for nor those from outside of the domain. Nevertheless, the EI tool is useful in identifying key local sources to focus the emission control efforts.
3.2.1. Receptor Modeling Results
As mentioned above, to apply receptor models, comprehensive PM compositional data are required. In this study, the weekly filter samples were analyzed for the water soluble ions, elemental carbon (EC) and OC, and selected elements. To preliminarily identify the contributing source factors of PM in each site, the reconstructed mass was done [
19], which showed the major mass groups of organic matter (suggesting the OC emissions from fossil fuel and biomass combustion, as well as the secondary organic aerosol formed in the atmosphere from VOC precursors), soot (element/black carbon, suggesting the primary PM from diesel and biomass combustion), secondary inorganic aerosol (SIA: ammonium sulfates and nitrates formed from precursors of NH
3, SO
x and NO
x), sea salt (indicating sea spray) and crustal elements (PM with geological origin: soil and construction dust). The remaining elements include also markers of combustion which may be linked to the industrial sources). Lack of the detail composition data of coarse fraction (PM
>2.5) prevented from gaining insights to the contributing sources of this PM fraction. This paper therefore only focuses on the receptor modeling results for the fine PM (PM
2.5).
The receptor model of Chemical Mass Balance (CMB) version 8.2 [
17] was used with the source profiles specific for Bangkok and other Southeast Asian cities compiled in [
20]. The receptor modeling results were evaluated using the current knowledge on the local sources and potential long-range transport (air mass trajectory) of air pollution to the two sites. The results of CMB modeling for PM
2.5 at both sites are presented in
Table 2 for the wet and dry season separately. The key contributing sources to the PM
2.5 at two sites were traffic and biomass burning, sharing from 23% to 41% each. Both had almost the same relative contributions to PM
2.5 during wet season at each site (in %) but during the dry-season biomass burning had significantly higher relative contribution especially at AIT, the suburb site. As mentioned above, the most significant biomass open burning in the study area is the rice straw field burning, therefore, AIT surrounded by the rice paddy field should be expected to have more influence from this source. Regional and transboundary transport of biomass burning smoke would bring the emissions from the outside BMR to the sites as well. For example, the secondary inorganic aerosol is formed from precursors of NO
x, SO
x and ammonia emitted from the sources inside the domain as well as the sources located from the outside of the domain through the regional and transboundary transport. Sources of the precursors are discussed in the emission inventory results below. Note that our results on the key source contributions to PM
2.5 in BMR (traffic, biomass and secondary inorganic aerosol) agreed with those reported in early studies by [
8,
10,
20] for BMR.
The HYSPLIT model was run online (
http://ready.arl.noaa.gov/HYSPLIT.php). The three day-backward trajectories for the sampling weeks when relatively high and low PM levels were observed in the wet and dry period, respectively, were calculated. The trajectories started from the sampling site coordinates, 1000 m above the ground level, at 0:00 UTC (UK) or +7GMT for Thailand. Meteorological input data were taken from the Global Data Assimilation System (GDAS) provided in the website with data resolution of 1° (~100 km). The weeks with the highest PM
2.5 levels measured at each site either in dry or wet season were commonly associated with the long continental pathways of airmass through Southeast Asian countries (Vietnam, Cambodia, and Laos) and in some cases circulating over Northern Thailand before entering BMR. Longer periods of air mass traveling, i.e., five- or seven-day backward trajectories showed the air mass originating from southern India or southern China traveling past Southeast Asia before arriving at the sites. This also suggests that there was a possibility of the long-range transport pollutants affecting PM levels measured at the BMR sites. The weeks with low concentrations were those having the marine pathways of air mass entering the sites from the Gulf of Thailand or from Amanda Sea. As a way of examples, the three day-backward trajectories for every day of the week with the highest and lowest PM
2.5 levels measured at the PCD site are presented in
Figure A3,
Appendix A.
3.2.2. Emission Inventory Results
The available emission inventory (EI) for PM air quality simulation in BMR was updated to the base year of 2016. The EI domain included the Bangkok city and surrounding provinces within coordinates of 13°27′32.4″–14°05′27.6″ N and 101°05′31.2″–100°09′43.2″ E. The on-road traffic emission was updated using the driving pattern and emission factors generated from the International Vehicle Emission (IVE) model (Buadee, 2017, AIT master’s thesis). The biogenic emission was estimated using the Global Biosphere Emissions and Interactions System (GLOBEIS) model with an updated land use map. GLOBEIS model required gridded land-use data of BMR and gridded meteorological parameters (i.e., temperature and solar radiation) generated by WRF model. Industrial emission of 2013 was provided by Dr. Narisara Thongboonchoo (King Mongkut’s Institute of Technology Ladkrabang, personal communication). The crop residue field open burning emission was calculated using the method presented in [
21,
22]. The information for activity data of crop production was retrieved from the Thailand Office of Agricultural Economics. Other sources were also updated by using the activity data for the year of 2016, such as for residential combustion, fuel stations and livestock (Ha Chi 2018, AIT master’s thesis). Emission factors (EFs) for the above-mentioned sources were obtained from the compiled values, relevant for Asian countries, by the Atmospheric Brown Cloud Emission Inventory Manual (ABC EIM) [
16]. The emission inventory results are presented in
Table 3 for each air pollutant. The shares of emission sources to primary PM
2.5 and other species including the potential PM precursors (NO
x, SO
2, NMVOC, NH
3) are presented in
Figure 2. The results show that primary PM
2.5 in BMR was emitted from three main sources, e.g., on-road mobile which accounted for 59% of the total PM
2.5 emission, biomass open burning (20%), and industry (19%). Emissions of other species listed in the figure were also mainly contributed from these sources, e.g., 70% of NO
x, 48% of CO, and 22% of NMVOC were from on-road traffic while 29% of CO and 4% of NMVOC were from biomass open burning. Note that street cooking emissions may be significant in Bangkok but were not included in this study.
It is therefore clear that the on-road mobile source is the key contributor to the PM2.5 (primary, especially BC) pollution in BMR. In addition, this source category also contributes largely to the emissions of PM precursors. Meanwhile, the industry is the major contributor to SO2 emission which is a key precursor to secondary sulfate particles formed in the atmosphere. Biomass open burning is the key contributor to CO and also a significant source of PM (especially OC particles, second to the on-road mobile source) and NH3 that is the precursor of secondary ammonium (sulfates and nitrates) particles formed in the atmosphere. Note that the key source of NMVOC in BMR is the biogenic emission that comes from plants and soil while the key source of NH3 is from the livestock (Ha Chi, 2018).
Figure 3 provides more insights into mobile road emissions. The large pick-up fleet, (more than 1 mil vehicles as of 2016) with a high portion still using diesel, had the highest share of PM
2.5 emission followed by the truck fleet. The pick-up fleet was also the major contributor to NOx, followed by other diesel-powered fleets of truck and bus. The key contributors to NMVOC were the large gasoline-powered fleets of private cars (about 2.6 mil vehicles) and motorcycles (about 1.8 mil vehicles), but the diesel-fueled fleets also contributed significantly. Note that non-road diesel powered mobile sources such as the boat, construction and agricultural machinery may contribute significantly to the PM pollution in BMR but these are not yet included in the current study.
3.3. Levels of Acid Deposition and Potential Risk in BMR
Figure 4 shows monthly variations of pH at PCD and AIT sites in order to discuss acidity of rainwater. Ranges of monthly pH values at PCD and AIT from September 2015 to February 2017 were 4.59–7.16 and 4.69–7.03, respectively. Approximately 40% at PCD and 20% at AIT of rain samples were acidic (pH ≤ 5.6). The average pH values at PCD and AIT sites in the wet period was 5.59 ± 0.73 (average ± standard deviation) and 5.77 ± 0.62, respectively, and the average pH values in the dry period were 4.91 ± 0.82 and 5.18 ± 0.79, respectively. The pH values were lower in the dry period, and this trend was similar to that observed in Bangkok and Pathumthani EANET sites [
23]. Further results of rainwater components and the relationship with PM components will be reported in our forthcoming paper (Huo et al., in preparation).
The total deposition amounts at the PCD and AIT sites were estimated by the sum of dry deposition and wet deposition fluxes. Higher total deposition amounts of sulfur and nitrogen compounds were observed in the wet period (e.g., 140 kgS/km2/month and 375 kgN/km2/month at the AIT site in July 2016). The wet deposition was dominant during the wet period, which showed that wet deposition played an important role in removing sulfur and nitrogen species from the atmosphere. The total deposition of sulfur compounds during September 2015–February 2016 (over 18 months) at PCD and AIT sites were 837 and 821 kgS/km2, respectively, while the total nitrogen compounds were 3132 and 3043 kgN/km2, respectively (Mettasitthikorn, 2017, AIT master’s thesis).
The critical loads of sulfur and nitrogen in Thailand were compiled by the previous studies [
24,
25]. These are the highest load sulfur and nitrogen deposition that will not cause chemical changes leading to long-term harmful effects on ecological systems. The sulfur deposition at AIT in 2016 was 586 kgS/km
2/yr that was lower than the critical load (3000–5000 kgS/km
2/yr). Likewise, the nitrogen deposition was 2235 kgN/km
2/yr that was also lower than the critical load (6090–9030 kgN/km
2/yr) as presented in
Table 4 [
16]. Thus, in 2016 the total annual deposition of sulfur and nitrogen compounds were estimated to be lower than the critical load values, and this implies that the soil in Pathumthani province still has buffering capacity to neutralize the current acid deposition rate. However, the adverse effects such as oversaturation of acidic species in soil and leaching of metallic components from the soil may occur if the emissions of SO
2, NO
x, and precursors of PM are not controlled in the near future.
4. Discussions and Policy Implications
Our scientific results of BMR measurements and data analysis confirm the general picture of air pollution in the area identified by earlier research and monitoring efforts: the levels of PM2.5 are generally alarming, failing the benchmark levels of the WHO guidelines. Observational data also reveal more precise characteristics of the problem, such as the diversity of pollution emission sources composed of traffic, biomass burning and those emitting precursors of the secondary particles.
Apart from these general features, the data from our study are not yet sufficient for quantitative appraisals of policy options in terms of PM2.5 control in BMR. Thus, a first policy implication of our study is that a comprehensive assessment that integrates scientific source apportionment and modeling analysis of policy scenarios will need to be made for quantitative evaluation of policy options for the PM problem in BMR.
The basic implication of our scientific findings is that emission reduction should be focused on the two key sources contributing to PM in BMR of traffic and biomass open burning. The emission reduction for vehicles can be achieved by the means of the implementation of progressive stringent engine standards for vehicles and fuel technologies and by applying an age limit for vehicles, etc. Also, the air quality management system should be improved with more stations for PM
2.5 monitoring in both urban and sub-urban areas, continuously updating the emission inventory, and application of modeling tools. Thailand has not adopted a few policies measures of air pollution control that have been widely adopted by other countries [
26]. One type of policy measures that has not been tried and could be implemented in Thailand is economic policy instruments such as congestion charging and low emission zone, the schemes to obligate either all vehicles or high-emission vehicles to pay some charge in order to enter into designated areas of a city.
The PM
2.5 problem in BMR is a challenging issue because, on one hand, the country’s further expected rapid economic growth in the next decades will likely raise the air pollutant emissions, and on the other hand, its stringency and completeness of air quality regulatory system are already largely comparable with international levels, as discussed in
Section 2. Indeed, the PM air pollution problem has not been fully resolved even in higher income countries with very tight regulation (e.g., [
2]), and Thailand may be disadvantaged relative to these high-income temperate countries because of its tropical climatic conditions with relatively large potential for secondary formation of PM. This means that different approaches, which could be outside the conventional realm of air quality regulation, are also needed to tackle the air pollution problem in BMR. In particular, policies for air pollution control should be more integrated with other types of national policies, such as energy, urban and agricultural policies. Effective pollution control would require a holistic approach combining a range of measures, including those affecting people’s incentives on their behavior and those involving a transformation of an economic system.
The linkage between air pollution control and energy policy would be particularly important, as energy consumption is the most important contributor to pollution emissions. A notable feature of the Thai energy consumption trends is that the country has been slow in improvement (reduction) in the energy intensity, which is the amount of energy use per unit of gross domestic product, over the recent years (
Figure 5). In other words, the country has not been making significant progress on energy efficiency of its economy, which may result in too high pollution emissions relative to its economic performance. This is in contrast with some other Southeast-Asian countries such as Malaysia, Indonesia, and the Philippines, and also with China, as well as high-income economies such as Japan and Germany, all of which exhibit a declining trend of energy intensity in recent years. Since Thailand, an emerging economy, still expects high economic growth rates in the near future, the country should seriously aim to decouple the growth of its economy and the growth of its energy use.
As for energy policy, Thailand already has a set of long-term plans on various aspects of energy use, such as the Energy Efficiency Development Plan (EEDP) and the Alternative Energy Development Plan (AEDP). These plans are parts of an overarching document of energy policy called the Thailand Integrated Energy Blueprint (TIEB) 2015–36, which has been made under the National Energy Policy 2008. In these long-term plans, the government sets a target to reduce energy intensity by 25% in 2030 relative that in 2005, or equivalent to a reduction of final energy consumption by 20% in 2030, and also a renewable energy target of 30% of total final energy consumption by 2036. These energy targets link to Thailand’s climate change commitment under the Paris Climate Agreement, the Nationally Determined Contributions (NDCs), determining to reduce carbon emissions from its energy, industrial, agricultural and waste sectors by 20–25% from the business as usual scenario by 2030.
These targets should certainly be a step in the right direction, but given the rapidly changing landscape of energy technologies these days, the targets may quickly become obsolete and too low relative to the latest states of technologies. The government should make more frequent reviews and adjustments of energy efficiency standards and renewable targets to reflect the latest developments of energy technologies. As an example, IRENA [
27] estimates that the potential for renewable power production in Thailand is likely to be greater than its current national target of renewable power. Thailand could pursue the utilization of renewable energies more aggressively than the extent mandated by the national target. In fact, reduction of emissions is not the only benefit brought about by the use of renewable energy. As Thailand depends on imports of fossil fuels, it is good for energy security for the country as well.
A related area of technology that is developing rapidly and has implications for air quality is the technology of electric vehicles (EVs). Although a wide adoption of EVs itself may not reduce the total energy consumption or the total emissions for a country, it could have direct effects on mitigating air pollution in urban centers and also generally increase flexibility for the operation of renewable power generation. Costs of EVs have been reduced substantially recently, and this trend is likely to continue, but a wide adoption of EVs will not occur without the development of charging infrastructure, which is in turn dependent on the number of EV users (i.e., the presence of network externality). Therefore, some public support mechanism for EVs could be economically justifiable. Along with some demonstration of establishing free power charging stations in Bangkok, Thailand has already introduced a system of tax deduction for the purchase of low-emission vehicles recently (in the year 2016), but it may also expand public support by directly subsidizing its purchase, a policy implemented by some other countries.
For reducing energy intensity, another relevant factor are the reforms of fossil fuel subsidies, which are often implemented to reduce fuel costs for low-income households, for which fuel purchases constitute a large proportion of household consumption. Although policies of some wealth redistribution from high-income to low-income households could be justifiable in a general sense, a subsidy specifically addressed to fuel consumption would function as an adverse incentive for fossil fuel consumption for the country. Thailand has already made some reforms on the subsidies [
28], but it should implement further reforms of fossil fuel subsidies, such as removal of tax exemption for diesel fuel, to reduce adverse incentives for the use of fossil fuel.
Also, it is important to note that the energy consumption on a national scale could be affected by not only specific measures with direct association with fuel consumption, such as construction of public transportation systems, but also by broader transformations such as a change in settlement patterns of cities. For example, it is known that an increase of urban density is often associated with less CO
2 emissions [
29]. In the context of BMR, efforts could be taken to promote mixed use of land as business and residential areas, which could reduce people’s commuting needs. Additionally, policy on vehicle age limits could be effective for controlling energy consumption, since old vehicles have been associated with high fuel consumption compared with new vehicles [
30].
Apart from industrial and traffic emissions from fossil fuel use, a substantial proportion of PM
2.5 in BMR likely comes from biomass burning, and thus its control, especially that of the burning of rice residues, could have a significant effect on the reduction of PMs in the region. Significance and possibilities of improved management of open burning in the context of Thailand are discussed elsewhere (e.g., [
7,
31]). Potential measures include alternative management of rice residues, which utilizes the agricultural waste either for mulching or as biofuel, and strict enforcement of existing regulations on burning in certain areas and time periods. A less discussed aspect of such alternative management methods in the context of air pollution control is farmers’ incentives for introducing such practices. In Thailand, a significant proportion of farmers engage in farming on leased farmlands, and such a system of land tenancy does not give incentives for new investment in alternative farming practices both on the parts of tenant farmers and landowners. Also, official registration of farmlands, although relatively well-conducted by regional standards, is not complete, See, for example, USAID’s Landlinks website (
https://land-links.org/country-profile/thailand/), and this means that farmers’ rights on financial returns from farming activities may not always be protected. This becomes another disincentive for an introduction of new residue management practices. Legal systems and policies should aim to clarify financial rights for tenant farmers and landowners in terms of the returns from residue management to promote the practices of non-open burning alternatives for residue management. In fact, increase of farming income, as a result of either clarification of farmers’ right or other measures, could generally work as a way to promote alternative residue management, because a current hindrance for non-burning residue management is the general aging trends of Thai farmers as a result of unwillingness of younger generations to take farming jobs. Old farmers may not be inclined to bear additional physical labor of transport of agricultural residues from farmlands to elsewhere, etc., which is necessary for alternative crop residue management ([
27] p. 28). As for another measure to encourage alternative residue management, some public price guarantee mechanism, similar to a feed-in-tariff scheme to support renewable energies implemented by many countries, could also be introduced for the sales of residues as fuel, in order to shield farmers from the generally volatile price of energy in the context of reduction of open burning.

 ,
, 


