A Comparative Study of Stack Emissions from Straight-Line and Zigzag Brick Kilns in Nepal


 ,
,
Abstract
:1. Introduction
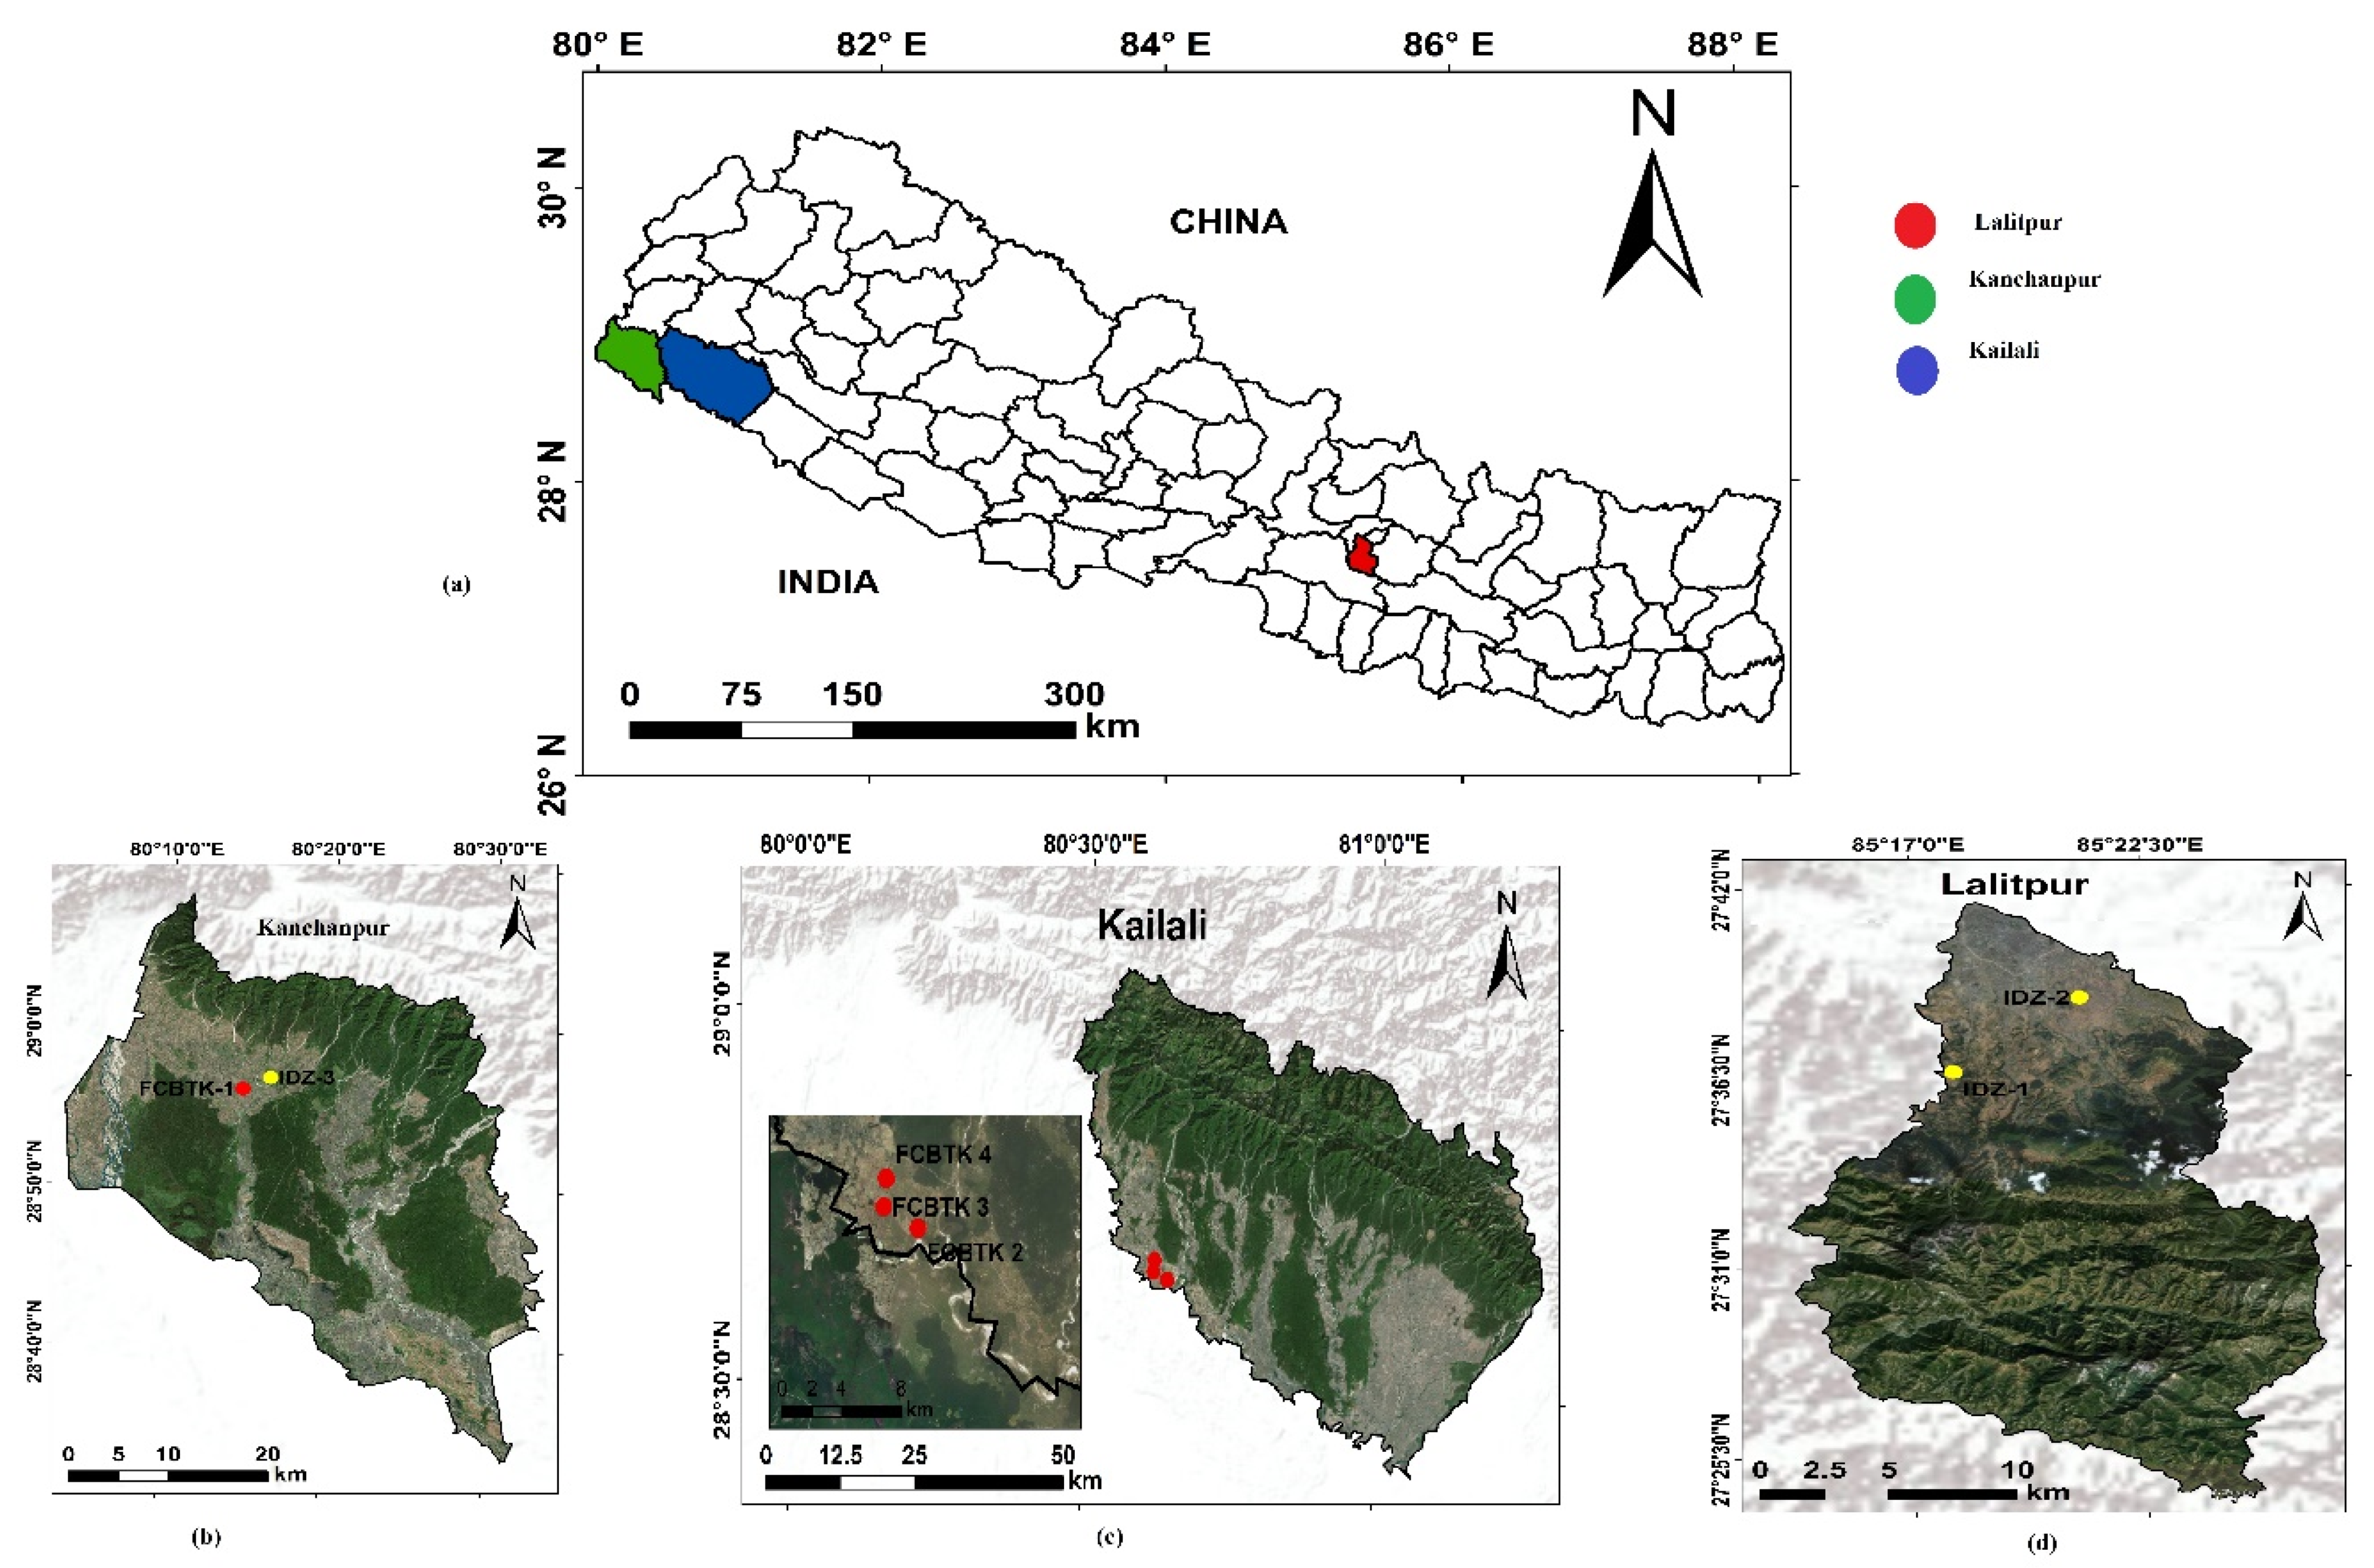
2. Site Description
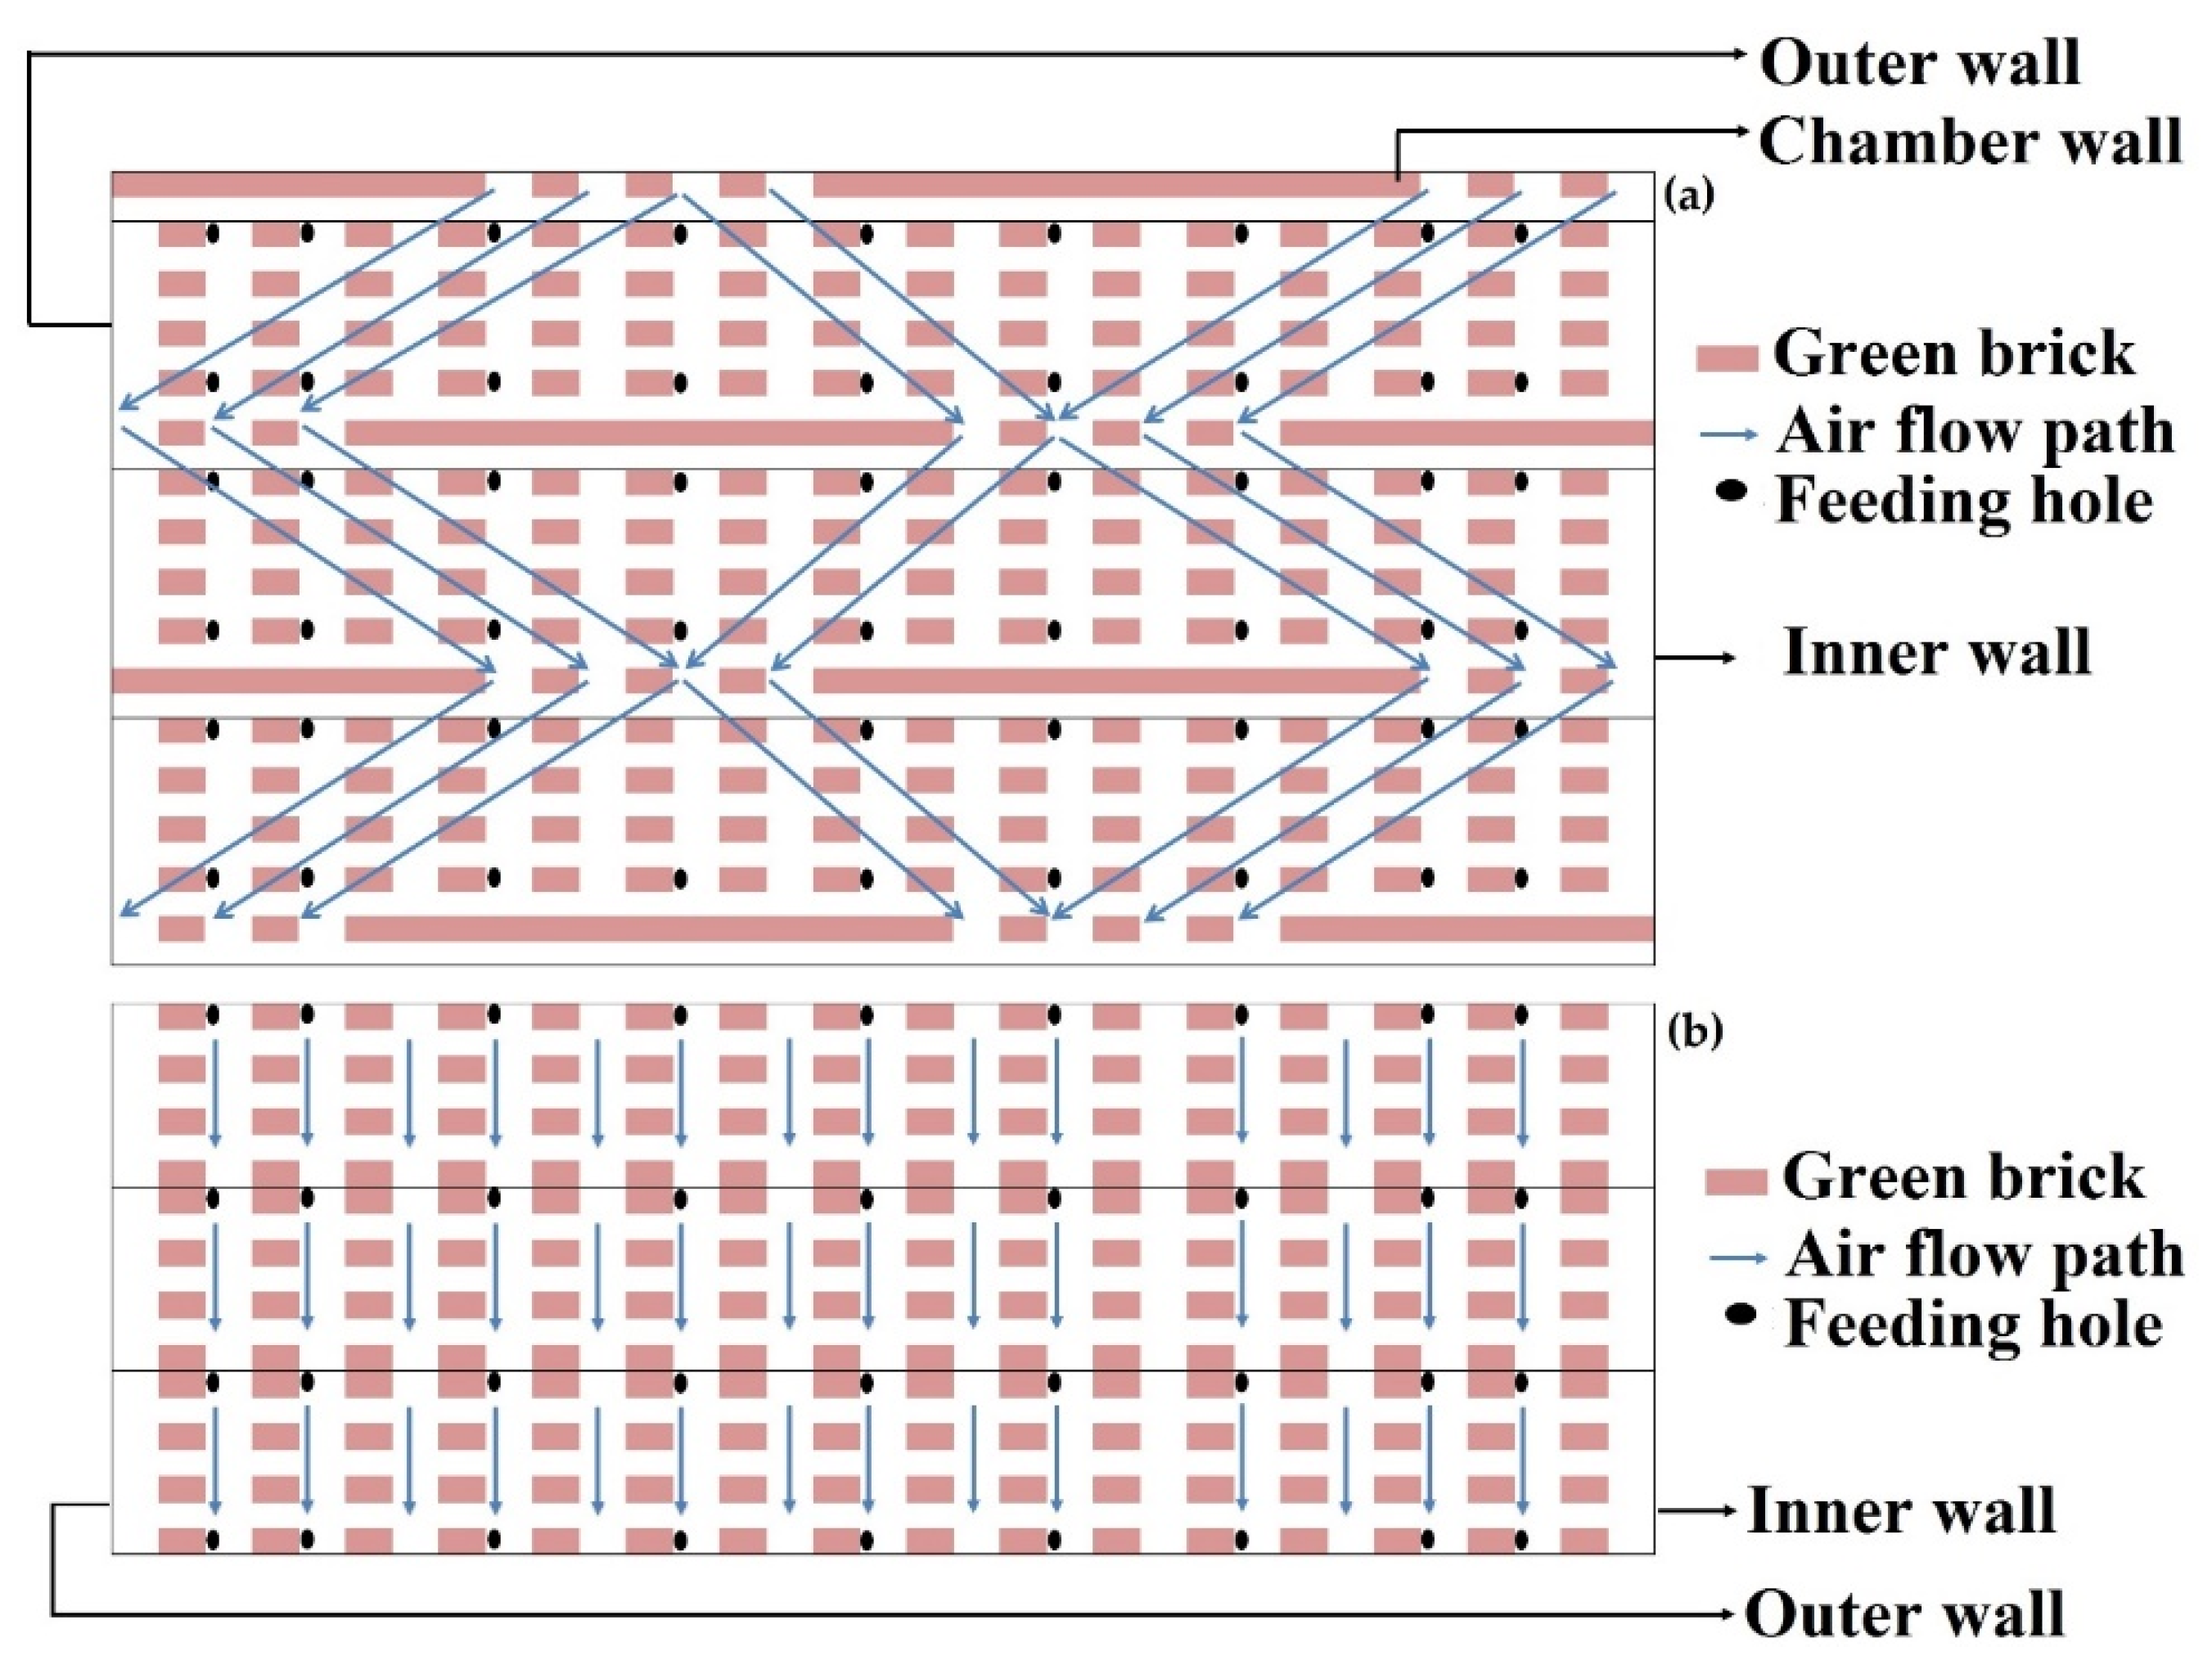
3. General Description of the Brick Kilns
4. Past Research in the South Asian Region and Elsewhere
5. Materials and Methods
5.1. Stack Sampling
5.2. Instrumentation
5.3. Fuel Analysis
5.4. Emission Factor per Kilogram of Fuel Used (g/kg Fuel/Fuel Mixture)
5.5. Emission Factor per Kilogram of Brick Manufactured (g/kg Brick)
6. Results and Discussion
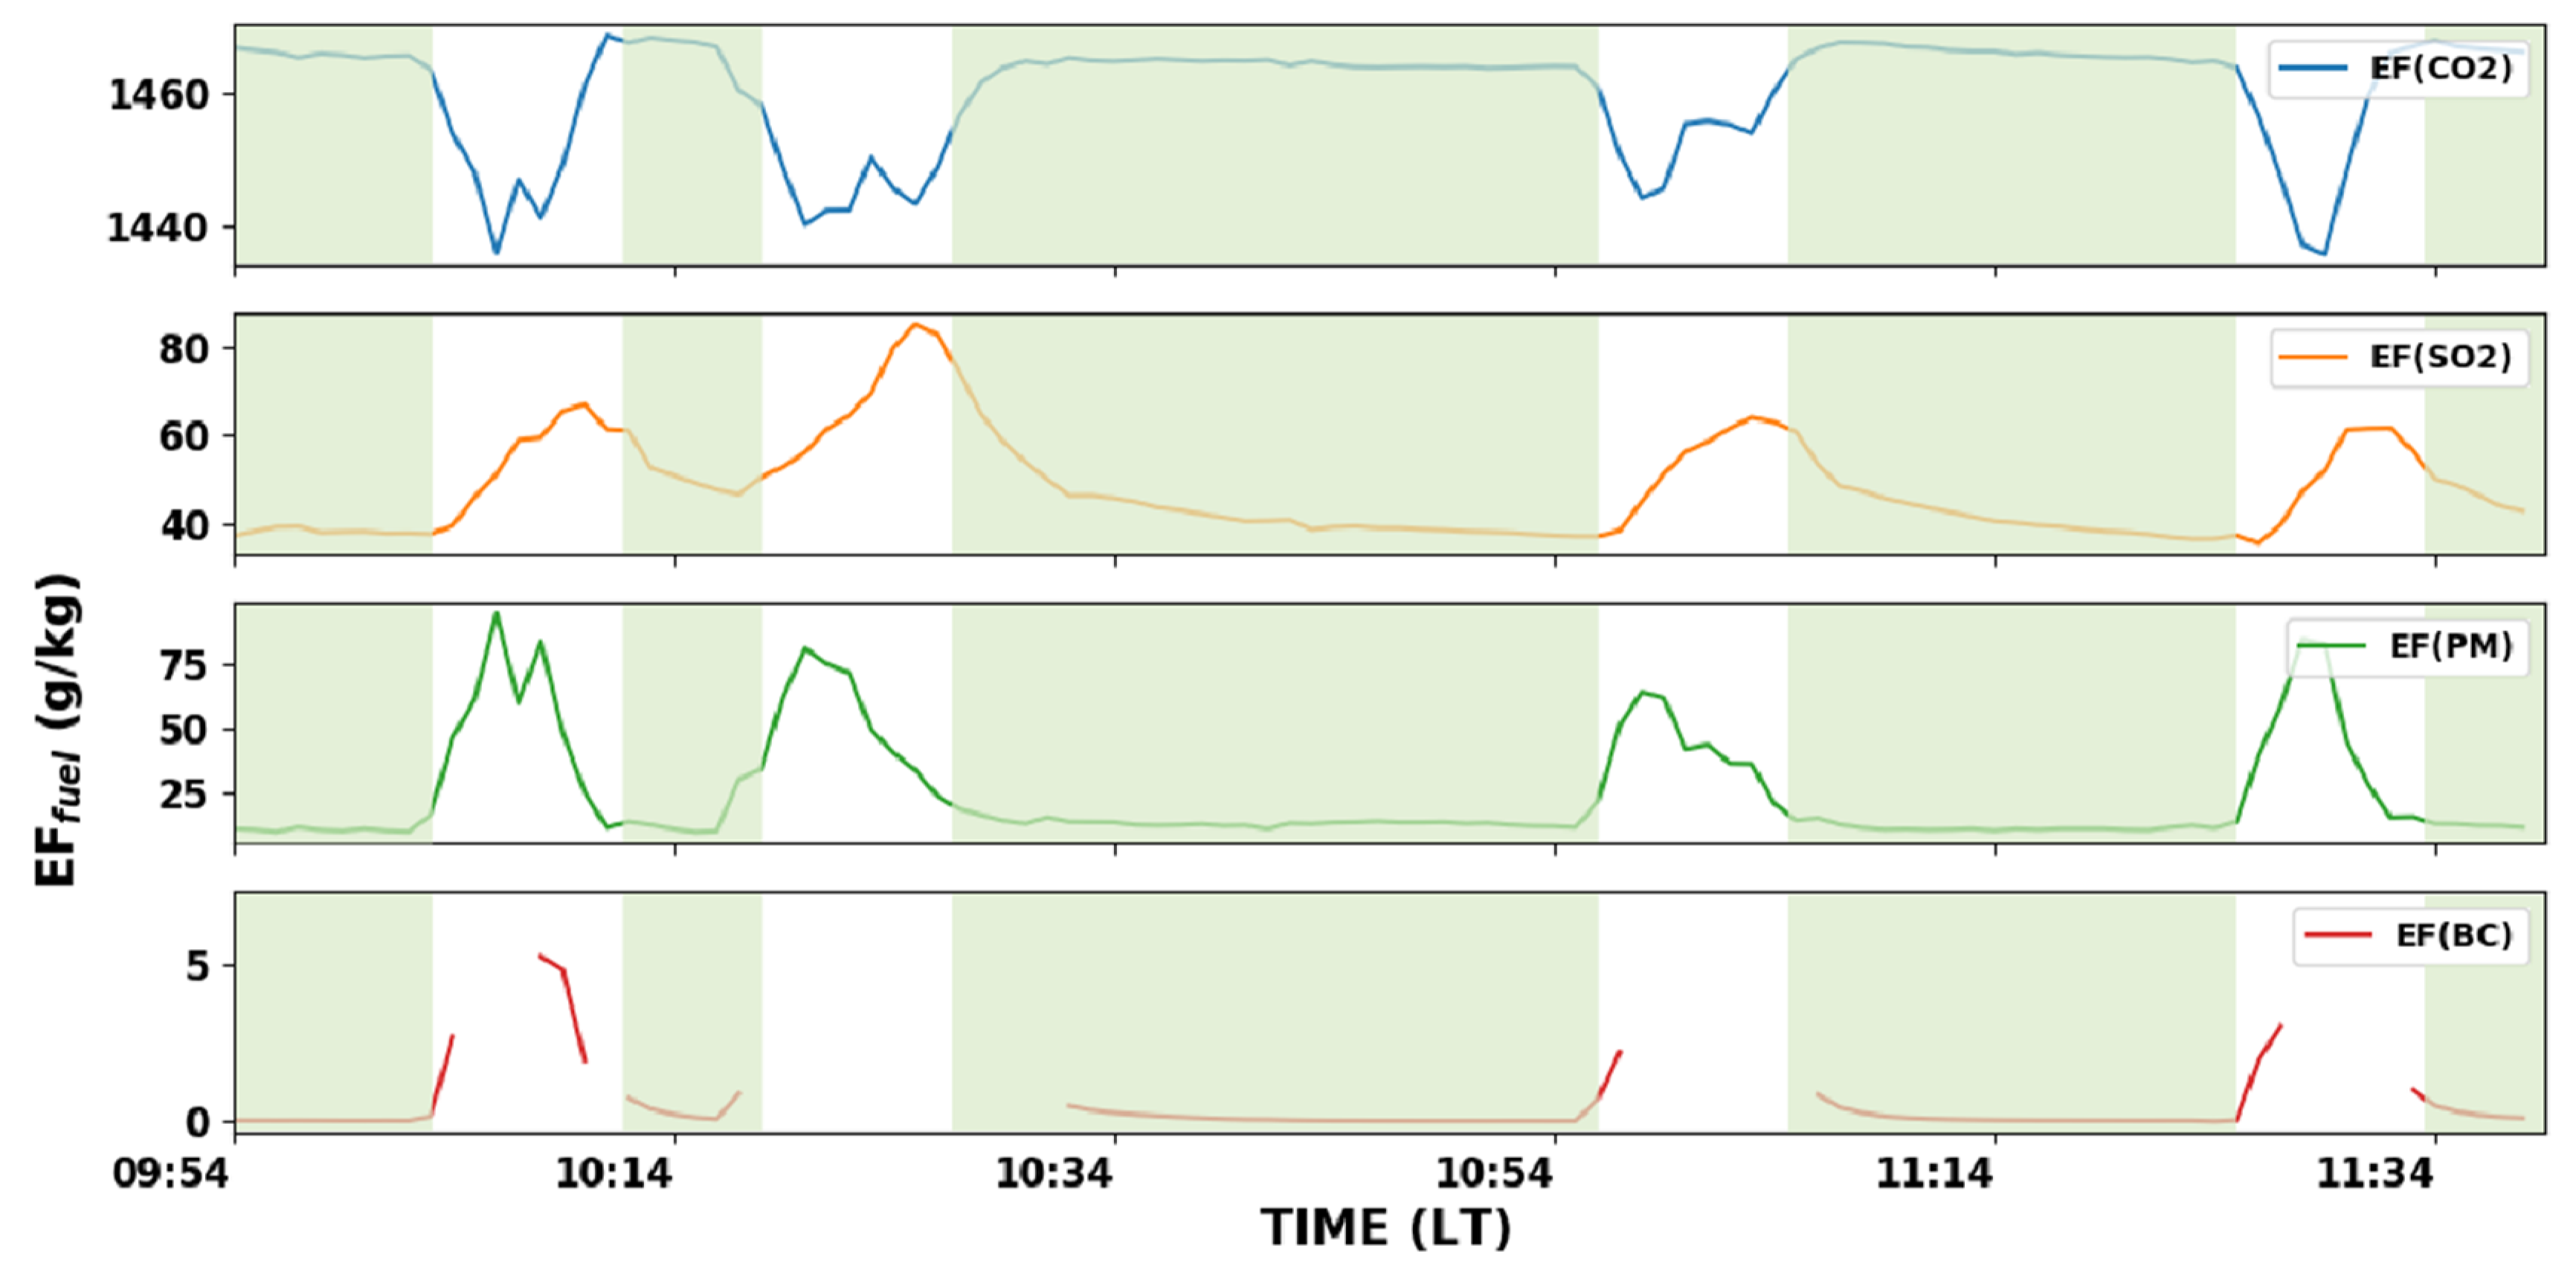
6.1. Real-Time Variability of CO2, SO2, BC, and PM2.5

| Kin Type | Country | Study Year | Kilns | n | Fuels | CO2 | SO2 | PM2.5 | BC | References |
|---|---|---|---|---|---|---|---|---|---|---|
| Traditional | Nepal | 2017 | FCBTKs | 4 | Coal, rice husk, briquette | 46175 | 735 | 303 | 55.5 | Present study |
| India | 2011 | FCBTKs | 3 | Coal, tires, wood logs | 35500 | 321 | 94 | 80.0 | [25] | |
| Bangladesh | 2017–2018 | FCBTKs | 10 | Coal and biomass | 5254 | 578 | 141 | 16.6 | [18] | |
| Vietnam | 2007 | Traditional-improved | 2 | Coal | - | 81 | 114 | - | [27] | |
| Improved | Nepal | 2017 | IDZKs | 3 | Coal, rice husk, sawdust | 35639 | 371 | 148 | 21.7 | Present study |
| Bangladesh | 2017–2018 | IDZKs | 6 | Coal | 6995 | 332 | 128 | 11.8 | [18] | |
| Hoffman | 2 | Coal | 2350 | 316 | 109 | 8.9 | ||||
| India | 2011 | IDZKs | 2 | Coal | 36500 | 143 | - | 19.0 | [25] | |
| DDK | 1 | Eucalyptus twigs and leaves | 86500 | 0.0047 | 331 | 98.0 | ||||
| VSBKs | 2 | Coal | - | 522 | 71 | 1.2 | ||||
| South Africa | 2018 | Model kiln | 13 | Coal | 9220 | 29 | - | - | [26] |
6.2. Fuel-Based Emission Factors (EFfuel)
6.2.1. Fuel-Based CO2 Emission Factor
| Pollutants | CO2 | SO2 | PM2.5 | BC | ||||||||
|---|---|---|---|---|---|---|---|---|---|---|---|---|
| Kiln | EFfuel | Min | Max | EFfuel | Min | Max | EFfuel | Min | Max | EFfuel | Min | Max |
| FCBTK 1 | 1466 ± 5 | 1447 | 1472 | 49 ± 12 | 4.8 | 87.6 | 7.4 ± 6.7 | 2.4 | 29.0 | 0.7 ± 1.5 | 0.002 | 7.1 |
| FCBTK 2 | 1793 ± 53 | 1527 | 1826 | 32 ± 23 | 15.3 | 315 | 3.6 ± 2.5 | 1.1 | 15.3 | 0.5 ± 0.8 | 0.01 | 2.8 |
| FCBTK 3 | 1630 ± 14 | 1566 | 1646 | 5 ± 7 | 0.6 | 32.3 | 1.3 ± 2.0 | 0.1 | 9.0 | 0.4 ± 0.7 | 0.00004 | 2.3 |
| FCBTK 4 | 1641 ± 9 | 1616 | 1652 | 3 ± 2 | 0.4 | 17.2 | 3.1 ± 3.4 | 0.02 | 31.8 | 0.7 ± 0.7 | 0.002 | 3.9 |
| Average | 1633 ± 134 | 22 ± 22 | 3.8 ± 2.6 | 0.6 ± 0.2 | ||||||||
| IDZK 1 | 2093 ± 11 | 2064 | 2120 | 49 ± 10 | 2.5 | 75.5 | 4.0 ± 0.8 | 2.1 | 9.3 | 0.6 ± 0.5 | 0.021 | 2.0 |
| IDZK 2 | 2135 ± 6 | 2109 | 2147 | 13 ± 4 | 0.01 | 20.5 | 2.5 ± 0.6 | 1.4 | 5.1 | 0.3 ± 0.4 | 0.01 | 2.0 |
| IDZK 3 | 1715 ± 8 | 1677 | 1727 | 10 ± 7 | 2.5 | 107.6 | 2.9 ± 2.5 | 0.5 | 36.4 | 0.3 ± 0.3 | 0.002 | 1.3 |
| Average | 1981 ± 232 | 24 ± 22 | 3.1 ± 1 | 0.4 ± 0.2 | ||||||||
| Kiln Type | Country | Study Year | Kilns | n | Fuels | CO2 | SO2 | PM2.5 | BC | References |
|---|---|---|---|---|---|---|---|---|---|---|
| Traditional | Nepal | 2017 | FCBTKs | 4 | Coal, rice husk, briquette | 1633 | 22 | 3.8 | 0.6 | Present study |
| Nepal | 2015 | Clamp Kiln | 1 | Coal, hardwood | 2102 | 13 | 10.7 | 0.02 | [14,15] | |
| India | 2011 | FCBTKs | 3 | Coal, tires, wood logs | 2182 | 10.5 | 3.03 | 2.4 | [25] | |
| India | 2011–2012 | FCBTKs | 3 | Coal and wood | - | - | 1.7–4.4 | 1.8–3.7 | [17] | |
| India | 2015 | FCBTKs | 10 | Coal | - | 13.03 | 19.8 | - | [28] | |
| Bangladesh | 2017–2018 | FCBTKs | 10 | Coal and biomass | - | 26.7 | 6.1 | 0.4 | [18] | |
| Mexico | 2007 | Batch-Style | 2 | Biofuel including crop waste | 1736–1787 | - | 1.2–2.0 | 0.6–1.5 | [29] | |
| Mexico | 2013 | Traditional-Fixed | 1 | Sawdust, wood, diesel | 1668 | 0.1 | 1.3 | 0.5 | [13] | |
| Mexico | 2013 | Traditional-Campaign | 1 | Biomass | 1526 | 0.3 | 4.6 | 0.3 | [13] | |
| Improved | Nepal | 2017 | IDZKs | 3 | Coal, rice husk, sawdust | 1981 | 24 | 3.1 | 0.4 | Present study |
| Nepal | 2015 | IDZK | 1 | Coal and bagasse | 2620 | 12.7 | 15.1 | 0.1 | [14,15] | |
| Bangladesh | 2017–2018 | IDZKs | 6 | Coal | - | 18.5 | 5.9 | 0.3 | [18] | |
| Bangladesh | 2017–2018 | Hoffman | 2 | Coal | - | 33.7 | 4.7 | 0.3 | [18] | |
| India | 2011 | IDZKs | 2 | Coal | 2017 | 3.9 | 2.7 | 0.8 | [25] | |
| India | 2011–2012 | IDZKs | 3 | Coal | - | - | 0.60–1.20 | 0.07–0.5 | [17] | |
| India | 2011–2012 | VSBK | 1 | Coal | - | - | 1.3 | 0.1 | [17] | |
| India | 2011–2012 | DDK | 1 | Wood | - | 3 | 1.1 | [17] | ||
| Vietnam | 2011–2012 | TK | 1 | Coal | - | - | 1.6 | 0.01 | [17] | |
| Vietnam | 2011–2012 | VSBK | 1 | Coal | - | - | 1.3 | 0.01 | [17] | |
| Mexico | 2013 | MK2 | 1 | Biomass | 1582 | 1 | 1.9 | 0.2 | [13] | |
| China | 2013 | Hoffman | 18 | Coal | 1940 | 2.2 | 0.6 | 0.002 | [30] | |
| China | 2014 | Hoffman | 10 | Coal | 1920 | 2 | 2.7 | 0.06 | [30] |
6.2.2. Fuel-Based SO2 Emission Factor
6.2.3. Fuel-Based PM2.5 Emission Factors
6.2.4. Fuel-Based BC Emission Factors
6.3. Production-Based Emission Factors of CO2, SO2, PM2.5, and BC
| Pollutants | CO2 | SO2 | PM2.5 | BC | ||||||||
|---|---|---|---|---|---|---|---|---|---|---|---|---|
| Kiln | EFkgbrick | Min | Max | EFkgbrick | Min | Max | EFkgbrick | Min | Max | EFkgbrick | Min | Max |
| FCBTK 1 | 79 ± 0.3 | 77.5 | 78.9 | 2.6 ± 0.6 | 0.3 | 4.7 | 0.4 ± 0.3 | 0.1 | 1.6 | 0.04 ± 0.08 | 0.0001 | 0.4 |
| FCBTK 2 | 91 ± 2.7 | 77.6 | 92.8 | 1.6 ± 1.2 | 0.8 | 16.0 | 0.2 ± 0.1 | 0.06 | 0.8 | 0.03 ± 0.04 | 0.001 | 0.1 |
| FCBTK 3 | 118 ± 1.0 | 113.2 | 119.0 | 0.4 ± 0.5 | 0.04 | 2.3 | 0.1 ± 0.2 | 0.01 | 0.6 | 0.03 ± 0.05 | 0.000002 | 0.2 |
| FCBTK 4 | 96 ± 0.5 | 94.7 | 96.8 | 0.2 ± 0.1 | 0.03 | 1.0 | 0.2 ± 0.2 | 0.001 | 1.9 | 0.04 ± 0.04 | 0.0001 | 0.23 |
| Average | 96 ± 16 | 1.2 ±1. 2 | 0.2 ± 0.1 | 0.03 ± 0.01 | ||||||||
| IDZK 1 | 60 ± 0.3 | 59.6 | 61.2 | 1.4 ± 0.3 | 0.1 | 2.2 | 0.1 ± 0.02 | 0.06 | 0.3 | 0.02 ± 0.01 | 0.001 | 0.1 |
| IDZK 2 | 94 ± 0.3 | 92.4 | 94.1 | 0.6 ± 0.2 | 0.0005 | 1.0 | 0.1 ± 0.03 | 0.1 | 0.2 | 0.01 ± 0.02 | 0.001 | 0.1 |
| IDZK 3 | 93 ± 0.5 | 91.1 | 93.9 | 0.6 ± 0.4 | 0.1 | 5.8 | 0.2 ± 0.1 | 0.03 | 2.0 | 0.01 ± 0.01 | 0.0001 | 0.1 |
| Average | 82 ± 19 | 0.9 ± 0.5 | 0.1 ± 0.0 | 0.01 ± 0.00 | ||||||||
| Kiln Type | Country | Study Year | Kilns | n | Fuels | CO2 | SO2 | PM2.5 | BC | References |
|---|---|---|---|---|---|---|---|---|---|---|
| Traditional | Nepal | 2017 | FCBTKs | 4 | Coal, rice husk, briquette | 96 | 1.2 | 0.2 | 0.03 | Present study |
| India | 2011 | FCBTKs | 3 | Coal, tires, wood logs | 115 | 0.7 | 0.2 | 0.1 | [25] | |
| 2011–2012 | FCBTKs | 3 | Coal and wood | - | - | 0.08–0.3 | 0.09–0.3 | [17] | ||
| 2011 | FCBTKs | 5 | Coal and others | 179 | 0.5 | 0.9 | - | [8] | ||
| Bangladesh | 2017–2018 | FCBTKs | 10 | Coal and biomass | - | 1.8 | 0.4 | 0.03 | [18] | |
| Bangladesh | 2010 | FCBTKs | - | Coal and biomass | 173 | 1.5 | 2.3 | 0.9 | [31] | |
| Vietnam | 2007 | Traditional-improved | 2 | Coal | - | 1.5 | 0.5 | - | [27] | |
| Improved | Nepal | 2017 | IDZKs | 3 | Coal, rice husk, sawdust | 82 | 0.9 | 0.1 | 0.01 | Present study |
| Bangladesh | 2017–2018 | IDZKs | 6 | Coal | - | 1.1 | 0.4 | 0.02 | [18] | |
| 2017–2018 | Hoffman | 2 | Coal | - | 1.8 | 0.3 | 0.01 | |||
| India | 2011 | IDZKs | 2 | Coal | 103 | 0.3 | 0.1 | 0.04 | [25] | |
| 2011 | IDZKs | 3 | Coal | 96 | 0.2 | 0.2 | - | [8] | ||
| 2011 | VSBK | 1 | Coal | 118 | 0.1 | 0.1 | - | |||
| 2011–2012 | IDZKs | 3 | Coal | - | - | 0.03–0.05 | 0.02–0.004 | [17] | ||
| 2011–2012 | VSBK | 1 | Coal | - | - | 0.05 | 0.002 | |||
| 2011–2012 | DDK | 1 | Wood | - | 0.5 | 0.2 | ||||
| Vietnam | 2011–2012 | TK | 1 | Coal | - | - | 0.2 | 0.001 | ||
| 2011–2012 | VSBK | 1 | Coal | - | - | 0.1 | 0.001 |
7. Conclusions
Author Contributions
Acknowledgments
Conflicts of Interest
References
- Kim, B.M.; Park, J.-S.; Kim, S.-W.; Kim, H.; Jeon, H.; Cho, C.; Kim, J.-H.; Hong, S.; Rupakheti, M.; Panday, A.K.; et al. Source apportionment of PM10 mass and particulate carbon in the Kathmandu Valley, Nepal. Atmos. Environ. 2015, 123, 190–199. [Google Scholar] [CrossRef]
- Schmidt, C.W. Modernizing Artisanal Brick Kilns: A Global Need. Environ. Health Perspect. 2013, 121, 242–249. [Google Scholar] [CrossRef] [PubMed]
- Mues, A.; Lauer, A.; Lupascu, A.; Rupakheti, M.; Kuik, F.; Lawrence, M.G. WRF and WRF-Chem v3.5.1 simulations of meteorology and black carbon concentrations in the Kathmandu Valley. Geosci. Model Dev. 2018, 11, 2067–2091. [Google Scholar] [CrossRef]
- Zhong, M.; Saikawa, E.; Avramov, A.; Chen, C.; Sun, B.; Ye, W.; Keene, W.C.; Yokelson, R.J.; Jayarathne, T.; Stone, E.A.; et al. Nepal Ambient Monitoring and Source Testing Experiment (NAMaSTE): Emissions of particulate matter and sulfur dioxide from vehicles and brick kilns and their impacts on air quality in the Kathmandu Valley, Nepal. Atmos. Chem. Phys. Discuss. 2018, 1–34. [Google Scholar] [CrossRef]
- Shaikh, S.; Nafees, A.A.; Khetpal, V.; Jamali, A.A.; Arain, A.M.; Yousuf, A. Respiratory symptoms and illnesses among brick kiln workers: A cross sectional study from rural districts of Pakistan. BMC Public Health 2012, 12, 999. [Google Scholar] [CrossRef] [PubMed]
- Manandhar, U.M.; Dangol, S.B. Study on Evaluating Energy Conservation Potential of Brick Production in SAARC Countries; A Report on Nepal; SAARC Energy Centre: Islamabad, Pakistan, 2013. [Google Scholar]
- Brick Sector in Nepal National Policy Framework Prepared by MinErgy in Collaboration. 2017. Available online: http://www.ccacoalition.org/en/resources/brick-sector-nepal-national-policy-framework (accessed on 21 December 2018).
- Rajarathnam, U.; Athalye, V.; Ragavan, S.; Maithel, S.; Lalchandani, D.; Kumar, S.; Baum, E.; Weyant, C.; Bond, T. Assessment of air pollutant emissions from brick kilns. Atmos. Environ. 2014, 98, 549–553. [Google Scholar] [CrossRef]
- Asian Development Bank. Nepal Energy Sector Assessment, Strategy, and Roadmap; Asian Development Bank: Manila, Philippines, 2017; Volume 17. [Google Scholar]
- Sarkar, C.; Sinha, V.; Sinha, B.; Panday, A.K.; Rupakheti, M.; Lawrence, M.G. Source apportionment of NMVOCs in the Kathmandu Valley during the SusKat-ABC international field campaign using positive matrix factorization. Atmos. Chem. Phys. 2017, 17, 8129–8156. [Google Scholar] [CrossRef]
- Lopez, A.; Lyoda, N.; Segal, R.; Tsai, T. Evaluating the Brick Industry in South Asia. 2012. Available online: https://rmi.org/wp-content/uploads/2017/04/Pathways-to-Efficiency-in-the-South-Asia-Brickmaking-Industry-Carbon-War-Room_0.pdf (accessed on 21 December 2018).
- Maharjan, S.; Technology Research and Development Centre, Federation of Nepal Brick Industries, Kathmandu, Nepal. Personal communication, 2017.
- Zavala, M.; Molina, L.T.; Maiz, P.; Monsivais, I.; Chow, J.C.; Watson, J.G.; Munguia, J.L.; Cardenas, B.; Fortner, E.C.; Herndon, S.C.; et al. Black Carbon, Organic Carbon, and Co-Pollutants Emissions and Energy Efficiency from Artisanal Brick Production in Mexico. Atmos. Chem. Phys. Discuss. 2017, 1–28. [Google Scholar] [CrossRef]
- Stockwell, C.E.; Christian, T.J.; Goetz, J.D.; Jayarathne, T.; Bhave, P.V.; Praveen, P.S.; Adhikari, S.; Maharjan, R.; DeCarlo, P.F.; Stone, E.A.; et al. Nepal Ambient Monitoring and Source Testing Experiment (NAMaSTE): Emissions of trace gases and light-absorbing carbon from wood and dung cooking fires, garbage and crop residue burning, brick kilns, and other sources. Atmos. Chem. Phys. 2016, 16, 11043–11081. [Google Scholar] [CrossRef]
- Jayarathne, T.; Stockwell, C.E.; Bhave, P.V.; Praveen, P.S.; Rathnayake, C.M.; Islam, M.R.; Panday, A.K.; Adhikari, S.; Maharjan, R.; Goetz, J.D.; et al. Nepal Ambient Monitoring and Source Testing Experiment (NAMaSTE): Emissions of particulate matter from wood- and dung-fueled cooking fires, garbage and crop residue burning, brick kilns, and other sources. Atmos. Chem. Phys. 2018, 18, 2259–2286. [Google Scholar] [CrossRef]
- Panday, A.K.; Prinn, R.G. Diurnal cycle of air pollution in the Kathmandu Valley, Nepal: Observations. J. Geophys. Res. 2009, 114, D09305. [Google Scholar] [CrossRef]
- Weyant, C.; Athalye, V.; Ragavan, S.; Rajarathnam, U.; Lalchandani, D.; Maithel, S.; Baum, E.; Bond, T.C. Emissions from South Asian Brick Production. Environ. Sci. Technol. 2014, 48, 6477–6483. [Google Scholar] [CrossRef] [PubMed]
- Haque, M.I.; Nahar, K.; Kabir, M.H.; Salam, A. Particulate black carbon and gaseous emission from brick kilns in Greater Dhaka region, Bangladesh. Air Qual. Atmos. Heal. 2018, 1–11. [Google Scholar] [CrossRef]
- Thompson, R.; Weyant, C.; Bond, T.; Baum, E. Brick Kiln Emissions Sampling Protocol: Dilution Sampling for Climate-Relevant Particle Emissions; Climate & Clean Air Coalition: Paris, France, 2016; pp. 1–36. Available online: http://www.ccacoalition.org/sites/default/files/resources/Brick_Kiln_Emissions_Sampling_Procedure_v11.pdf (accessed on 21 December 2018).
- Engineering, M.A. Ratnoze2 User Guide. 2016. Available online: http://www.mtnaireng.com/Ratnoze1_User_Guide_v8.pdf (accessed on 21 December 2018).
- Adhikari, S.; Mahapatra, P.S.; Sapkota, V.; Puppala, S.P. Characterizing Emissions from Agricultural Diesel Pumps in the Terai Region of Nepal. Atmosphere 2019, 10, 56. [Google Scholar] [CrossRef]
- Morvay, Z.K.; Gvozdenac, D.D. Applied Industrial Energy and Environmental Management; John Wiley & Sons, Inc.: Hoboken, NJ, USA, 2008; ISBN 9780470697429. [Google Scholar]
- Ismaila, A.; Abdullahi, I.; Garba, N.N. Investigation on bioass briquettes as energy source in relation to their calorific values and measurement of their total carbon and elemental contents for efficient biofuel utilization. Appl. Sci. Res. 2013, 4, 303–309. [Google Scholar]
- Srinath, S.; Reddy, G.V. Combustion and Emission Characteristics of Rice husk in a Rectangular Fluidized Bed Combustor. In Proceedings of the 2nd International Conference on Environmental Science and Technology, Singapore, 26–28 Februagy 2011; Volume 6, pp. 343–346. [Google Scholar]
- Maithel, S.; Lalchandani, D.; Malhotra, G.; Bhanware, P.; Rajarathnam, U.; Ragavan, S.; Athalye, V.; KR, B.; Reddy, S.; Bond, T.; et al. Monitoring of Brick Kilns Strategies for Cleaner Brick Production in India; Shakti Sustainable Energy Foundation: Delhi, India, 2012. [Google Scholar]
- Akinshipe, O.; Kornelius, G. Quantification of atmospheric emissions and energy metrics from simulated clamp kiln technology in the clay brick industry. Environ. Pollut. 2018, 236, 580–590. [Google Scholar] [CrossRef] [PubMed]
- Le, H.A.; Oanh, N.T.K. Integrated assessment of brick kiln emission impacts on air quality. Environ. Monit. Assess. 2010, 171, 381–394. [Google Scholar] [CrossRef] [PubMed]
- Suresh, R.; Kumar, S.; Mahtta, R.; Sharma, S. Emission factors for continuous fixed chimney Bull Trench Brick Kiln (FCBTK) in India. Int. J. Adv. Eng. Manag. Sci. Infogain Publ. 2016, 2, 662–670. [Google Scholar] [CrossRef]
- Christian, T.J.; Yokelson, R.J.; Cárdenas, B.; Molina, L.T.; Engling, G.; Hsu, S.C. Trace gas and particle emissions from domestic and industrial biofuel use and garbage burning in central Mexico. Atmos. Chem. Phys. 2010, 10, 565–584. [Google Scholar] [CrossRef]
- Chen, Y.; Du, W.; Zhuo, S.; Liu, W.; Liu, Y.; Shen, G.; Wu, S.; Li, J.; Zhou, B.; Wang, G.; et al. Stack and fugitive emissions of major air pollutants from typical brick kilns in China. Environ. Pollut. 2017, 224, 421–429. [Google Scholar] [CrossRef] [PubMed]
- Guttikunda, S.K.; Begum, B.A.; Wadud, Z. Particulate pollution from brick kiln clusters in the Greater Dhaka region, Bangladesh. Air Qual. Atmos. Heal. 2013, 6, 357–365. [Google Scholar] [CrossRef]


| Kilns | Location | Total Bricks Produced per Day | Weight per Brick (kg) | Total Fuel Consumption per Day (kg) | Fuel Used | Carbon Content (%) | Sulfur (%) | Gross Calorific Value (MJ/kg) | SEC (MJ/kg) |
|---|---|---|---|---|---|---|---|---|---|
| FCBTK1 | Sundarpur, Kanchanpur | 30,000 | 2.49 | 4000 | Coal (90%), rice husk (10%) | 40.68 | 4.6 | 21.86 | 1.17 |
| FCBTK2 | Jugada gaun, Kailali | 34,000 | 2.42 | 5680 | Coal and sawdust (70%), rice husk (30%) | 50.54 | 2.21 | 20.46 | 1.04 |
| FCBTK3 | Ghuiya ghat, Kailali | 35,000 | 2.57 | 6504 | Briquette (100%) | 45.21 | 0.01 | 16.46 | 1.19 |
| FCBTK4 | Jugada gaun, Kailali | 31,000 | 2.25 | 4064 | Coal (40%), rice husk (60%) | 45.44 | 1.35 | 16.90 | 0.99 |
| IDZK1 | Bungmati, Lalitpur | 84,000 | 1.9 | 4652 | Coal (100%) | 59.02 | 3.14 | 20.77 | 0.60 |
| IDZK2 | Imadol, Lalitpur | 60,000 | 1.7 | 4500 | Coal (100%) | 59.02 | 3.14 | 20.77 | 0.91 |
| IDZK3 | Sankarpur, Kanchanpur | 62,000 | 2.21 | 7040 | Rice husk (25%), Coal and rice husk (32%), coal (43%) | 47.49 | 2.86 | 19.50 | 1.06 |
| Pollutants | CO2 | SO2 | PM2.5 | BC |
|---|---|---|---|---|
| Kiln | mg m−3 | mg m−3 | mg m−3 | mg m−3 |
| FCBTK 1 | 48,104 ± 12,101 | 1636 ± 791 | 522 ± 63 | 63 ± 150 |
| FCBTK 2 | 48,756 ± 18,541 | 1012 ± 1103 | 245 ± 15 | 51 ± 74 |
| FCBTK 3 | 36,038 ± 22,626 | 198 ± 420 | 171 ± 30 | 35 ± 79 |
| FCBTK 4 | 51,800 ± 20,022 | 94 ± 86 | 274 ± 40 | 73 ± 76 |
| Average | 46,175 ± 6947 | 735 ± 728 | 303 ± 152 | 55.5 ± 16.4 |
| IDZK 1 | 31,803 ± 8711 | 717 ± 237 | 207 ± 41 | 39 ± 30 |
| IDZK 2 | 37,235 ± 19,981 | 192 ± 74 | 85 ± 8 | 9 ± 13 |
| IDZK 3 | 37,878 ± 15,714 | 205 ± 80 | 152 ± 25 | 17 ± 20 |
| Average | 35,639 ± 3337 | 371 ± 299 | 148 ± 61 | 21.7 ± 15.5 |
© 2019 by the authors. Licensee MDPI, Basel, Switzerland. This article is an open access article distributed under the terms and conditions of the Creative Commons Attribution (CC BY) license (http://creativecommons.org/licenses/by/4.0/).
Share and Cite
Nepal, S.; Mahapatra, P.S.; Adhikari, S.; Shrestha, S.; Sharma, P.; Shrestha, K.L.; Pradhan, B.B.; Puppala, S.P. A Comparative Study of Stack Emissions from Straight-Line and Zigzag Brick Kilns in Nepal. Atmosphere 2019, 10, 107. https://doi.org/10.3390/atmos10030107
Nepal S, Mahapatra PS, Adhikari S, Shrestha S, Sharma P, Shrestha KL, Pradhan BB, Puppala SP. A Comparative Study of Stack Emissions from Straight-Line and Zigzag Brick Kilns in Nepal. Atmosphere. 2019; 10(3):107. https://doi.org/10.3390/atmos10030107
Chicago/Turabian StyleNepal, Sangeet, Parth Sarathi Mahapatra, Sagar Adhikari, Sujan Shrestha, Prakash Sharma, Kundan Lal Shrestha, Bidya Banmali Pradhan, and Siva Praveen Puppala. 2019. "A Comparative Study of Stack Emissions from Straight-Line and Zigzag Brick Kilns in Nepal" Atmosphere 10, no. 3: 107. https://doi.org/10.3390/atmos10030107