The coalescent simulations of the IAA model are designed to determine systematically how parameters such as population divergence time, the timing and rate of admixture, and the magnitude of a founder event influence the structure and depth of gene trees that can be sampled from a genome. We do not explicitly model mutational processes and, therefore, do not deal directly with haplotype sequence data. Instead, we characterize two specific properties of gene trees that have important consequences for the patterns haplotype sequence diversity that may be sampled from a single population. Often investigators who wish to address questions of hybridization and gene flow will obtain sequence data from two or more populations to look for shared mutations or reciprocal monophyly in the resulting gene trees. However, we consider only the ability to detect hybridization and introgression using a single population sample. The rationale for this approach is that it does not rely on specific assumptions about which populations may actually be exchanging genes, or even whether a second population still exists.
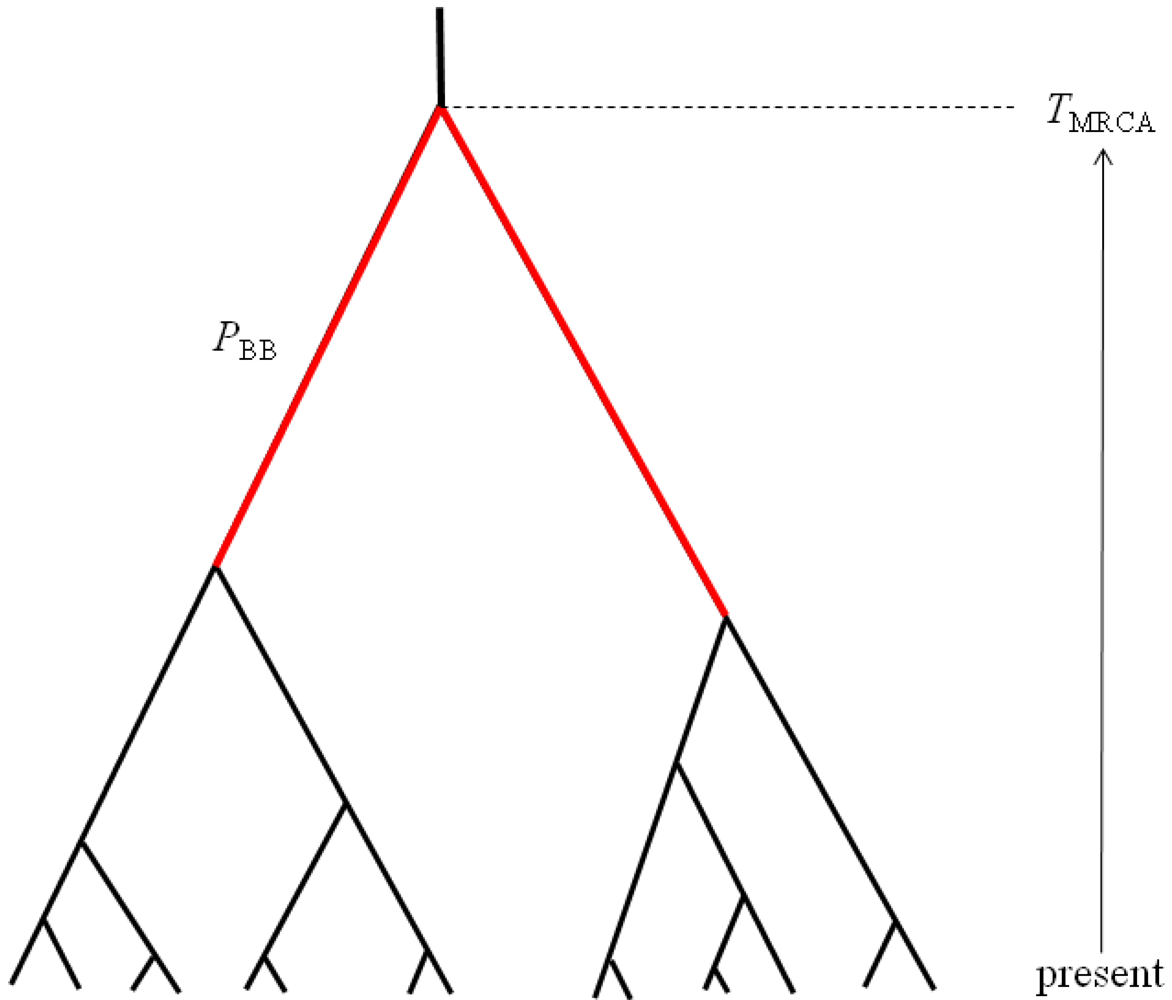
The first property of sampled gene trees that we consider is summarized by the statistic
PBB, which can be defined as the proportion of the total gene tree branch length that is occupied by the two basal branches (
Figure 2). Mutations occurring along these two basal branches serve as the basis for a statistical test for detecting hybridization from single population samples [
16]. The second gene tree property of interest is the
TMRCA, which is proportional to maximum number of sequence differences among a sample of haplotypes (
Figure 2). These two properties are chosen to be complementary summaries of the gene trees that are expected to arise under the IAA model. We examine the statistical behavior of these two properties under a range of parameterizations of the IAA model by varying divergence time, admixture time, the magnitude of a putative founder event, and the rate at which admixture occurs. Lastly, entire chromosomes are simulated to estimate the length of introgressed genomic regions. Although the sampled model parameters and summary statistics are necessarily limited in scope, the results provide significant insight into the behavior of models of secondary contact and what patterns investigators might expect to find in their sequence diversity datasets.
2.1. Isolation and Admixture Model
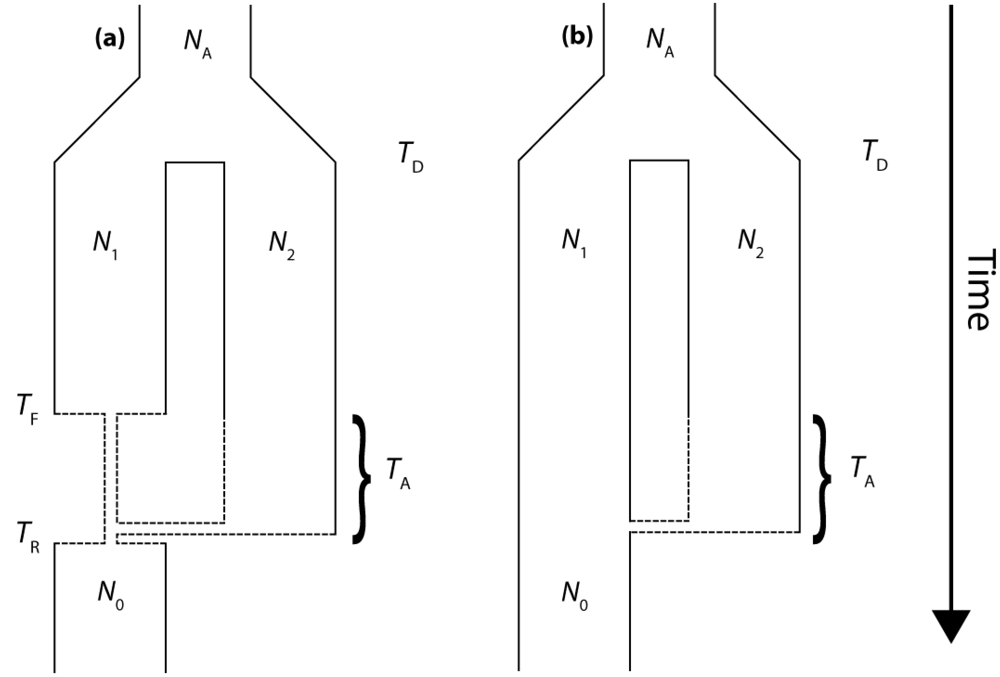
The molecular signature of genetic introgression due to secondary contact that we consider here is a partitioning of the ancestral lineages of a single population gene tree into two highly divergent clusters. Looking backwards in time, this corresponds to the free coalescence of genes sampled from a population, until the time of admixture, TA. Then at time TA, the remaining ancestral lineages are partitioned into two ancestral populations and the two clusters of lineages are no longer exchangeable, until the original population divergence time TD (furthermore, it is assumed that TD >> TA). The loss of exchangeability and the difference between TD and TA is expected to result in elongated basal branches for resulting gene trees. If no admixture occurs, the gene tree will conform to the expectations from a single, panmictic population, and TD and TA will have no effect on the gene tree. If admixture occurs (and, hence, imposes the loss of exchangeability during the ancestral process), both the relative length of the two basal branches (PBB) and the depth of the gene tree (TMRCA) are expected to increase, compared to a model for which the rate of admixture is zero.
To assess the relative contribution of each IAA parameter to variation in
PBB and
TMRCA, we perform a one-way analyses of variance (ANOVA,
Table 2). Furthermore, to assess how parameters of the IAA model affect the distribution of gene trees across the genome, the effective number of independent gene trees (
Ge) is also calculated (
Table 3). The
r2 values resulting from these analyses determine the proportion of total variation in a summary statistic that can be explained by varying each parameter individually, as well as by the interaction of parameters. Lastly, the residuals for each analysis reflect the stochastic nature of the underlying coalescence process. The average
TMRCA (Figure 3) and
PBB (
Figure 4) vary substantially across all of the simulated parameterizations of the IAA model. Most notably,
TMRCA and
PBB are primarily influenced by the time of divergence (
TD). This result is not necessarily surprising since basal branches are longest when the time of isolation (the difference in
TD and
TA) is greatest. In our simulations, this difference is primarily determined by the value of
TD. The other major contributor to variation in
TMRCA and
PBB is the proportion of admixture (
c).
Table 2.
Analysis of variance for IAA model parameters for constant size population (α = 1), mild founder event (α = 0.1), and strong founder event (α = 0.01). See Table 1 for detailed explanation of parameters).
Table 2.
Analysis of variance for IAA model parameters for constant size population (α = 1), mild founder event (α = 0.1), and strong founder event (α = 0.01). See Table 1 for detailed explanation of parameters).
| | α = 1 | α = 0.1 | α = 0.01 |
|---|
| Parameter | PBB | TMRCA | PBB | TMRCA | PBB | TMRCA |
|---|
| TA | 0.0221 | 0.0114 | 0.5734 | 0.1679 | 0.7425 | 0.6332 |
| TD | 0.6154 | 0.5556 | 0.1142 | 0.2828 | 0.0074 | 0.0148 |
| c | 0.2026 | 0.2077 | 0.1137 | 0.3492 | 0.0065 | 0.0073 |
| TA × TD | 0.0008 | 0.0020 | 0.0041 | 0.0098 | 0.0110 | 0.0227 |
| TA × c | 0.0233 | 0.0081 | 0.0306 | 0.0100 | 0.0060 | 0.0068 |
| TD × c | 0.0103 | 0.0341 | 0.0262 | 0.0683 | 0.0010 | 0.0018 |
| TA × TD × c | 0.0039 | 0.0018 | 0.0012 | 0.0019 | 0.0008 | 0.0015 |
| Residuals a | 0.1216 | 0.1793 | 0.1367 | 0.1101 | 0.2249 | 0.3118 |
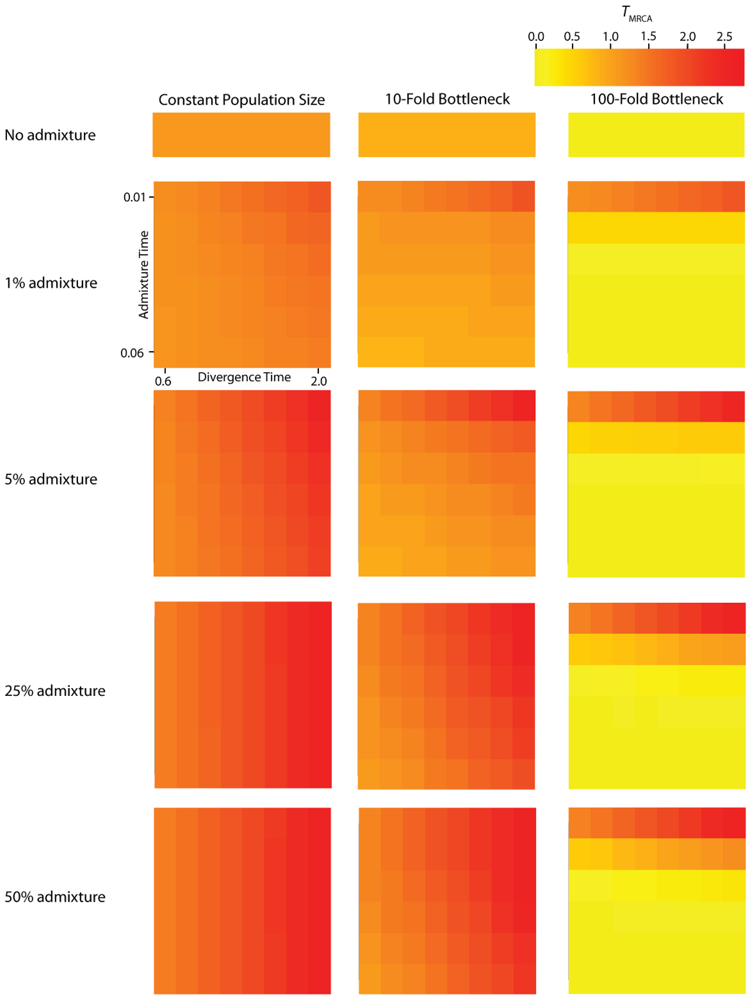
Figure 3.
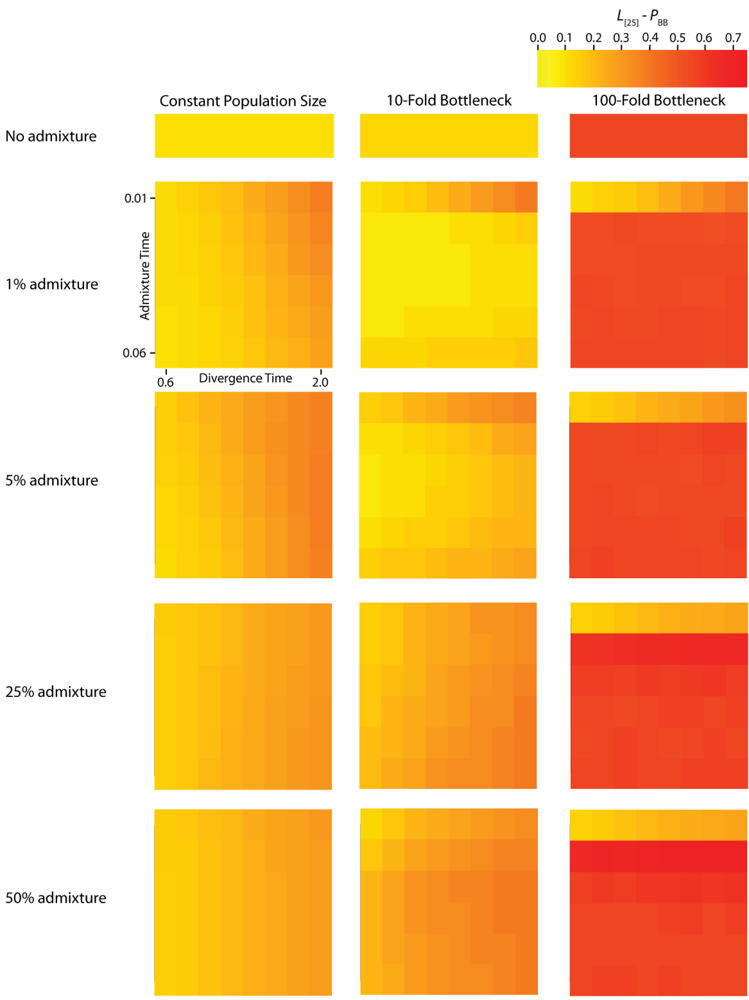
Simulated values for the proportion of total gene tree length that occurs in the two basal branches, or PBB. Each column corresponds to a different magnitude of founder event in the colonizing population. Each row represents differing levels of admixture between the colonizing and endemic populations. Finally, within each panel, squares correspond to different combinations of population divergence time and admixture time in the IAA model.
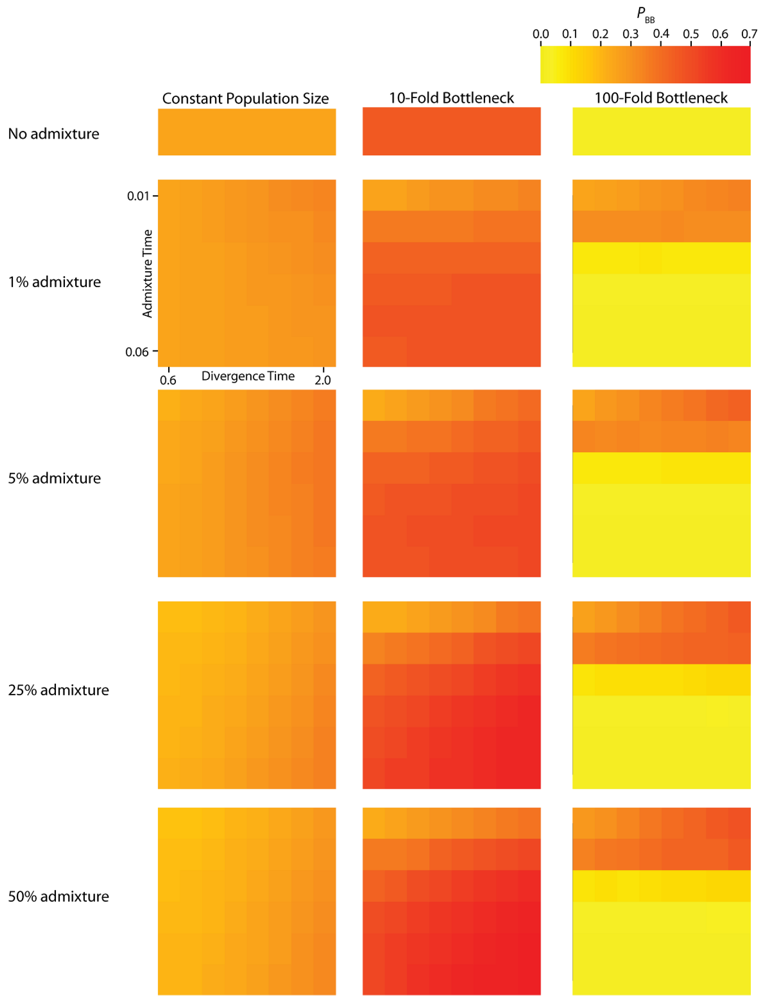
Figure 4.
Simulated values for the height of genes trees, or TMRCA. Each column corresponds to a different magnitude of founder event in the colonizing population. Each row represents differing levels of admixture between the colonizing and endemic populations. Finally, within each panel, squares correspond to different combinations of population divergence time and admixture time in the IAA model.
We consider three different implementations of the IAA model: 1) constant size of the colonizing population, 2) a 10-fold founder event, and 3) a 100-fold founder event in the colonizing population. In the case of constant population size, the TD parameter exerts the greatest influence on gene trees, as summarized by both PBB and TMRCA. For example, TD explains ~62% of the variation in PBB and ~56% of the variation in TMRCA. This result is expected because the proportion of the gene tree occupied by the basal branches is primarily constrained by the time of divergence. Similarly, the depth of a gene tree is directly influenced by the TD parameter, which governs the exchangeability of lineages. Admixture proportion also exerts a strong influence on the sampling distribution of gene trees. The admixture parameter, c, explains ~20% of the variation in PBB and ~21% of the variation in TMRCA. The admixture rate is influential because it governs the partitioning of the ancestral lineages into the two ancestral populations. A larger admixture rate will more evenly allocate the lineages and, thus, decrease PBB. This same allocation process causes more ancestral lineages to survive until time TD, thereby having the effect of increasing the TMRCA. Finally, ~12% of the variation in PBB and ~18% of the variation in TMRCA is attributable to stochasticity inherent in the coalescent process.
Table 3.
Analysis of variance for the effective number of gene trees (
Ge) for constant size population (α = 1), mild founder event (α = 0.1), and strong founder event (α = 0.01). See
Table 1 for a detailed description of the IAA model parameters.
Table 3.
Analysis of variance for the effective number of gene trees (Ge) for constant size population (α = 1), mild founder event (α = 0.1), and strong founder event (α = 0.01). See Table 1 for a detailed description of the IAA model parameters.
| Parameter | α = 1 | α = 0.1 | α = 0.01 |
|---|
| TA | 0.0181 | 0.8889 | 0.4604 |
| TD | 0.3975 | 0.0351 | 0.0013 |
| c | 0.4708 | 0.0129 | 0.0000 |
| TA × TD | 0.0000 | 0.0220 | 0.0027 |
| TA × c | 0.0019 | 0.0006 | 0.0001 |
| TD × c | 0.0000 | 0.0025 | 0.0000 |
| TA × TD × c | 0.0016 | 0.0005 | 0.0001 |
| Residuals a | 0.1100 | 0.0375 | 0.5354 |
2.2. The Effect of a Founder Event
Across all simulations, the parameter that has the largest influence on both
PBB and
TMRCA is the magnitude of the founder event (α). When the founder event is extreme (α = 0.01), both the mean and variance of
PBB and
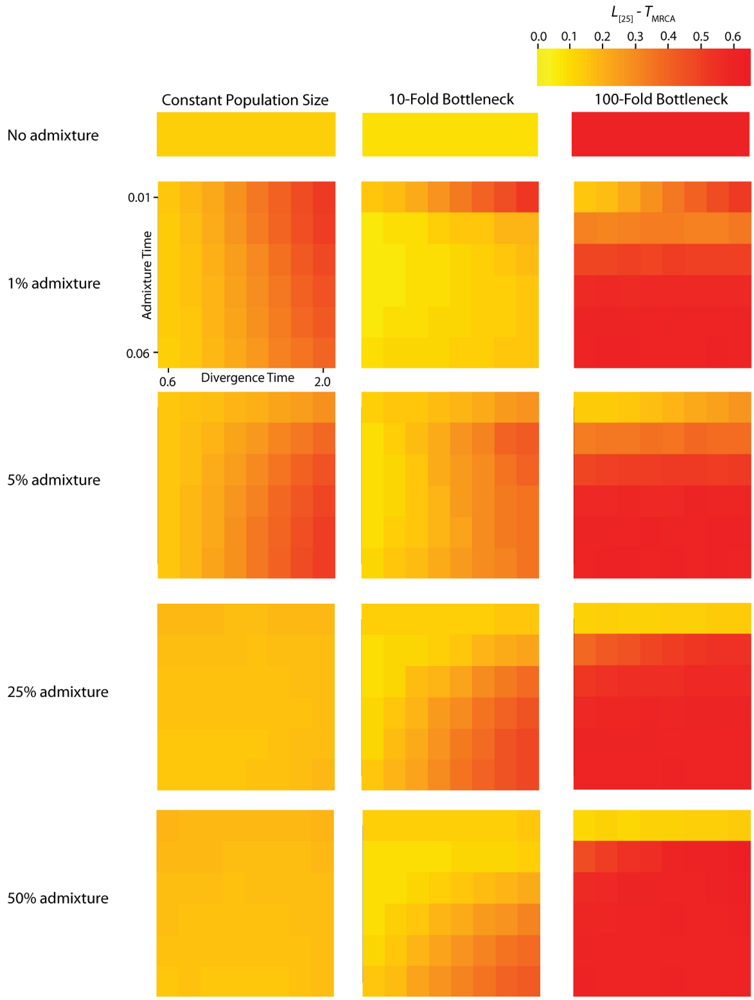
TMRCA are substantially decreased. A strong founder event reduces the variance of the genomic distribution of gene trees and leads to an increased level of spatial autocorrelation at lag 25 trees (
L [
25]). Interestingly, a milder founder event has the opposite effect, whereupon both the mean and variance of
PBB and
TMRCA are increased relative to the constant population size case. Likewise, for both measures,
L [
25] is decreased relative to a constant population size, indicating a higher variance in these values across a chromosome. One exception to this pattern occurs when admixture is very recent (
TA is close to
TR), in which case the ancestral process converges to the constant population size case.
PBB is maximized under demographic scenarios for which each population coalesces to a single ancestor during, or shortly before, the founder event (
e.g., the earliest possible time when one lineage remains in each of the two populations). Under an extreme founder event, often all coalescent events occur prior to admixture (resulting in an exceedingly recent
TMRCA). In these cases, no introgressed gene regions would be detectable in the sample, despite the occurrence of historical admixture. Under a mild founder event, the opposite appears true: a smaller number of ancestral lineages remaining at time
TA are partitioned into the two populations, thereby maximizing
PBB and
TMRCA.
The introduction of a mild founder event also substantially alters the relative effects of other demographic parameters. When α = 0.1, variation in TA has the greatest influence on gene trees, accounting for ~57% of the variation in PBB and ~17% of the variation in TMRCA. The actual rate of admixture accounts for ~11% of the variation in PBB and ~35% of the variation in TMRCA. The interaction of these two parameters lies at the heart of detecting introgression. Because the power to detect admixture using genetic data relies upon ancestral lineages descending from at least two historically allopatric populations, the two most important factors are (1) how many ancestral lineages remain at the time of the admixture events and (2) the probability that a lineage is moved to the other population. A strong founder event usually results in only a single ancestral lineage persisting until the time of the admixture event. In this case, it does not matter if that single ancestral lineage changes resident populations, it will have no effect on the gene tree. However, the most reliable way to generate a signal of introgression is when only two ancestral lineages remain at the time of the admixture event and one changes residence, while the other does not. In this case, PBB is maximized, and this scenario is most easily generated under a mild founder event implementation of the IAA model.
2.3. The Size of Introgressed Haplotypes
A single simulated dataset comprises a variable number of gene trees (
G). The number of gene trees is exponentially distributed with mean
nρ/2, where
n is the number of sampled chromosomes and
ρ = 4
Nr and
r is the rate of crossing-over per generation between the ends of the simulated chromosome. The expected number of gene trees for a particular IAA model parameterization is measured by calculating the mean number of gene trees generated per replicate across all replicates. However, adjacent gene trees, which differ by a single recombination event, can have highly correlated topologies [
20] and therefore may not differ with respect to
PBB and
TMRCA. It is noteworthy that any given recombination event has the potential to either eliminate an introgression event from the previous gene tree or add an introgression event to a gene tree that previously did not have any. The average autocorrelation coefficient for both
PBB and
TMRCA at varying lag values contains information about the average length of introgressed haplotypes. The calculation of
L [
25] autocorrelation of
PBB (
Figure 5) and
TMRCA (
Figure 6) provides a measure of the relationship of gene trees across a chromosome. However, the level of autocorrelation can also be influenced by a reduction in the variance of the summary statistics. When values of
PBB or
TMRCA are constrained due to demographic parameters,
L [
25] increases.
Figure 5.
Simulated autocorrelation coefficients for PBB at a lag of 25 gene trees. Each column corresponds to a different magnitude of founder event in the colonizing population. Each row represents differing levels of admixture between the colonizing and endemic populations. Finally, within each panel, squares correspond to different combinations of population divergence time and admixture time in the IAA model.
Figure 6.
Simulated autocorrelation coefficients for TMRCA at a lag of 25 gene trees. Each column corresponds to a different magnitude of founder event in the colonizing population. Each row represents differing levels of admixture between the colonizing and endemic populations. Finally, within each panel, squares correspond to different combinations of population divergence time and admixture time in the IAA model.
The effective number of gene trees (
Ge) is the number of effectively independent gene trees that can be sampled from a chromosome and this quantity can be directly estimated from the first-order autocorrelation coefficient (eq. (4)). It should also be noted that we do not explicitly consider the physical distance between gene trees arrayed along chromosomes, but instead only the linear arrangement of gene trees along chromosomes. The ANOVA results for these data (
Table 2) indicate that most of the variation in
Ge is due to variation in the population size during a founder event. In all of the simulations, recombination was modeled along a hypothetical chromosome (or chromosome segment) containing 10
6 loci. The actual number of gene trees reported,
G, is substantially less than 10
6, because adjacent loci that do not experience a recombination event between them have identical gene trees (data not shown). Consequently, variation in the total number of gene trees between constant and founder event populations is due to the effect varying α has on the effective population size over time and total coalescent time in the simulations.
For the IAA simulations that model a constant effective population size,
Ge is primarily influenced by the
c parameter (~47% of the variation). In a constant-sized population, moderate to high levels of admixture (
c = {0.25, 0.5}) decreases the autocorrelation between adjacent gene trees (
Figure 5) and consequently increases
Ge. The time of divergence (
TD) also affects the autocorrelation— deeper divergence leads to greater autocorrelation (
Figure 5)— and is responsible for an additional ~40% of the constant population variation in
Ge. The stochasticity of the coalescent explains an additional 11% of the variation. Under a mild founder event scenario, only variation in the time of admixture (
TA) has significant predictive power on the number of genomic regions, accounting for ~89% of the variation in the number of effective number of gene trees. Similarly, under an extreme founder event,
Ge is strongly influenced by the time of admixture (~46%). Interestingly, in extreme founder events, variation in the coalescent process is responsible for the majority of the variation in
Ge (~54%), indicating that demographic parameters (such as
TA,
TD and
c) have little predictive power for determining the number of effective number of gene trees under instances of extreme founder events.

