Article

Assessing Nitrogen Use Efficiency and Nitrogen Loss in a Forage-Based System Using a Modeling Approach

Council for Agricultural Research and Economics – Research Centre for the Soil-Plant System (CREA-RPS), Via della Navicella 2-4, Roma 00184, Italy
*
Author to whom correspondence should be addressed.
Agronomy 2016, 6(2), 23; https://doi.org/10.3390/agronomy6020023
Submission received: 29 January 2016 / Revised: 1 April 2016 / Accepted: 8 April 2016 / Published: 12 April 2016

Abstract

:
In intensive agriculture, N supply often exceeds crop requirements, even in nitrate vulnerable zones (NVZ). In farmland, the N surplus gives rise to NO3 leaching and consequent groundwater pollution. The present study aimed at proposing measures to reduce N leaching and hence improve N efficiency in a buffalo livestock farm located in the NVZ of Latina plain (Central Italy). The farm was cultivated with forage crops in a double annual crop rotation: Italian ryegrass (Lolium multiflorum Lam.) in winter and silage corn (Zea mays L.) in summer. Mineral and organic fertilizers were supplied to both crops. The annual N budget and soil solution NO3-N concentrations were evaluated using a modeling approach. The performance of the WinEPIC model in simulating the response of the NO3-N concentration in percolation to the N application rate was assessed and validated by field measurements of the NO3-N concentration in the soil solution. Three scenarios were proposed to identify the best practice to minimize the environmental impact of N application without significant yield loss. Also, recommendations of best practices in N fertilization and animal manure spreading were given. This study thus provides useful preliminary information for decision-making in agriculture/environmental policies.

1. Introduction

In the majority of European Member States, the agricultural sector contributes over 50% of the total nitrate (NO3) leaching to surface and groundwater [1]. NO3 leaching from agricultural soils is a complex process closely related to local environmental factors such as soil characteristics and climatic variables [2,3], and to farm management practices in intensive agriculture. Here, inappropriate application of manure, fertilizer, and sewage sludge [4], or irrigation and planting patterns [5], are liable to affect nitrate leaching in both livestock and arable farms [6], as well as leading to erosion and surface runoff. As in Knudsen et al. [7] and in Kros et al. [8], the proportion of soil N loss ranged between 30% and 60%, mainly leached below the root zone. NO3 leaching and groundwater pollution are significant public concerns worldwide [9] and are often linked to livestock farms [10,11]. As reported in Colombo et al. [12], more than 85% of the European agricultural land exceeds the threshold limit of NO3 levels (25 mg·L−1) due to N leaching, and approximately 22% of the groundwater collected in these areas overtakes the maximum admissible NO3 concentration (50 mg·L−1) recommended by the World Health Organization for drinking water [13,14]. Managing this pollution is challenging because it profoundly affects the nitrogen (N) cycle [15] and has strong environmental impact due to its direct influence on drinking water, eutrophication and its indirect contribution to atmospheric emissions with ammonia or nitrogen oxides [5,16,17].
Thus, in the last decades the European Union (EU) has implemented political strategies aiming at reducing and controlling NO3 contamination of groundwater caused by N losses from agricultural land [12,18]. Among these, the Nitrates Directive [19] aims to reduce water contamination caused by NO3. It legally restricts farm manure application to 170 kg N ha−1 [20], addressing farmers to get them to comply with the water quality protection measures. The directive also promotes the management action programs imposed in nitrate vulnerable zones (NVZs) [3,21] and it is strictly linked to other EU policies focused on air and water quality, climate change and agriculture. NO3 pollution is a relevant issue for intensive livestock farms where liquid and solid manure as organic effluents are used [22,23,24,25]. NO3 leaching is particularly serious in Mediterranean semi-arid countries [23,26], where substantial N losses by leaching were found to occur during the rainy period in winter and after irrigation practice in summer. To date, the relationships between soil NO3 accumulation and groundwater NO3 concentrations in agricultural soils are still not entirely understood [1]. Over the last decade, numerical models linked to N cycling in soil water and plants have received increasing attention as useful tools to predict the risk of NO3-N contamination in surface and groundwater and to define environmentally and economically suitable agricultural systems [27,28,29,30,31]. Models, when properly validated, provide a fast and cost-effective way of estimating NO3-N leaching under different agricultural management practices. Another frequently used approach to quantify N use efficiency at various scales is the N balance [32,33,34,35], widely recognized as a powerful tool employed by policy-makers for raising farmers’ awareness of their current management practices [20,34] and to support sustainable farming planning [17,36] at field [37], farm-gate [38] or territorial scale [39].
In an intensive buffalo livestock farm located in the NVZ of Latina plain (Central Italy) cultivated with forage crops in a double annual crop rotation—Italian ryegrass (Lolium multiflorum Lam.) in winter and silage corn (Zea mays L.) in summer—a study was carried out addressing the following issues: (1) monitoring of NO3 concentrations in the soil solution, (2) evaluation of the EPIC model against the data in terms of its ability to simulate the process of NO3-N leaching loss in field conditions, and (3) proposal of alternative fertilizing management strategies as possible measures to reduce N leaching and to improve the N use efficiency in the Mediterranean conditions.

2. Materials and Methods

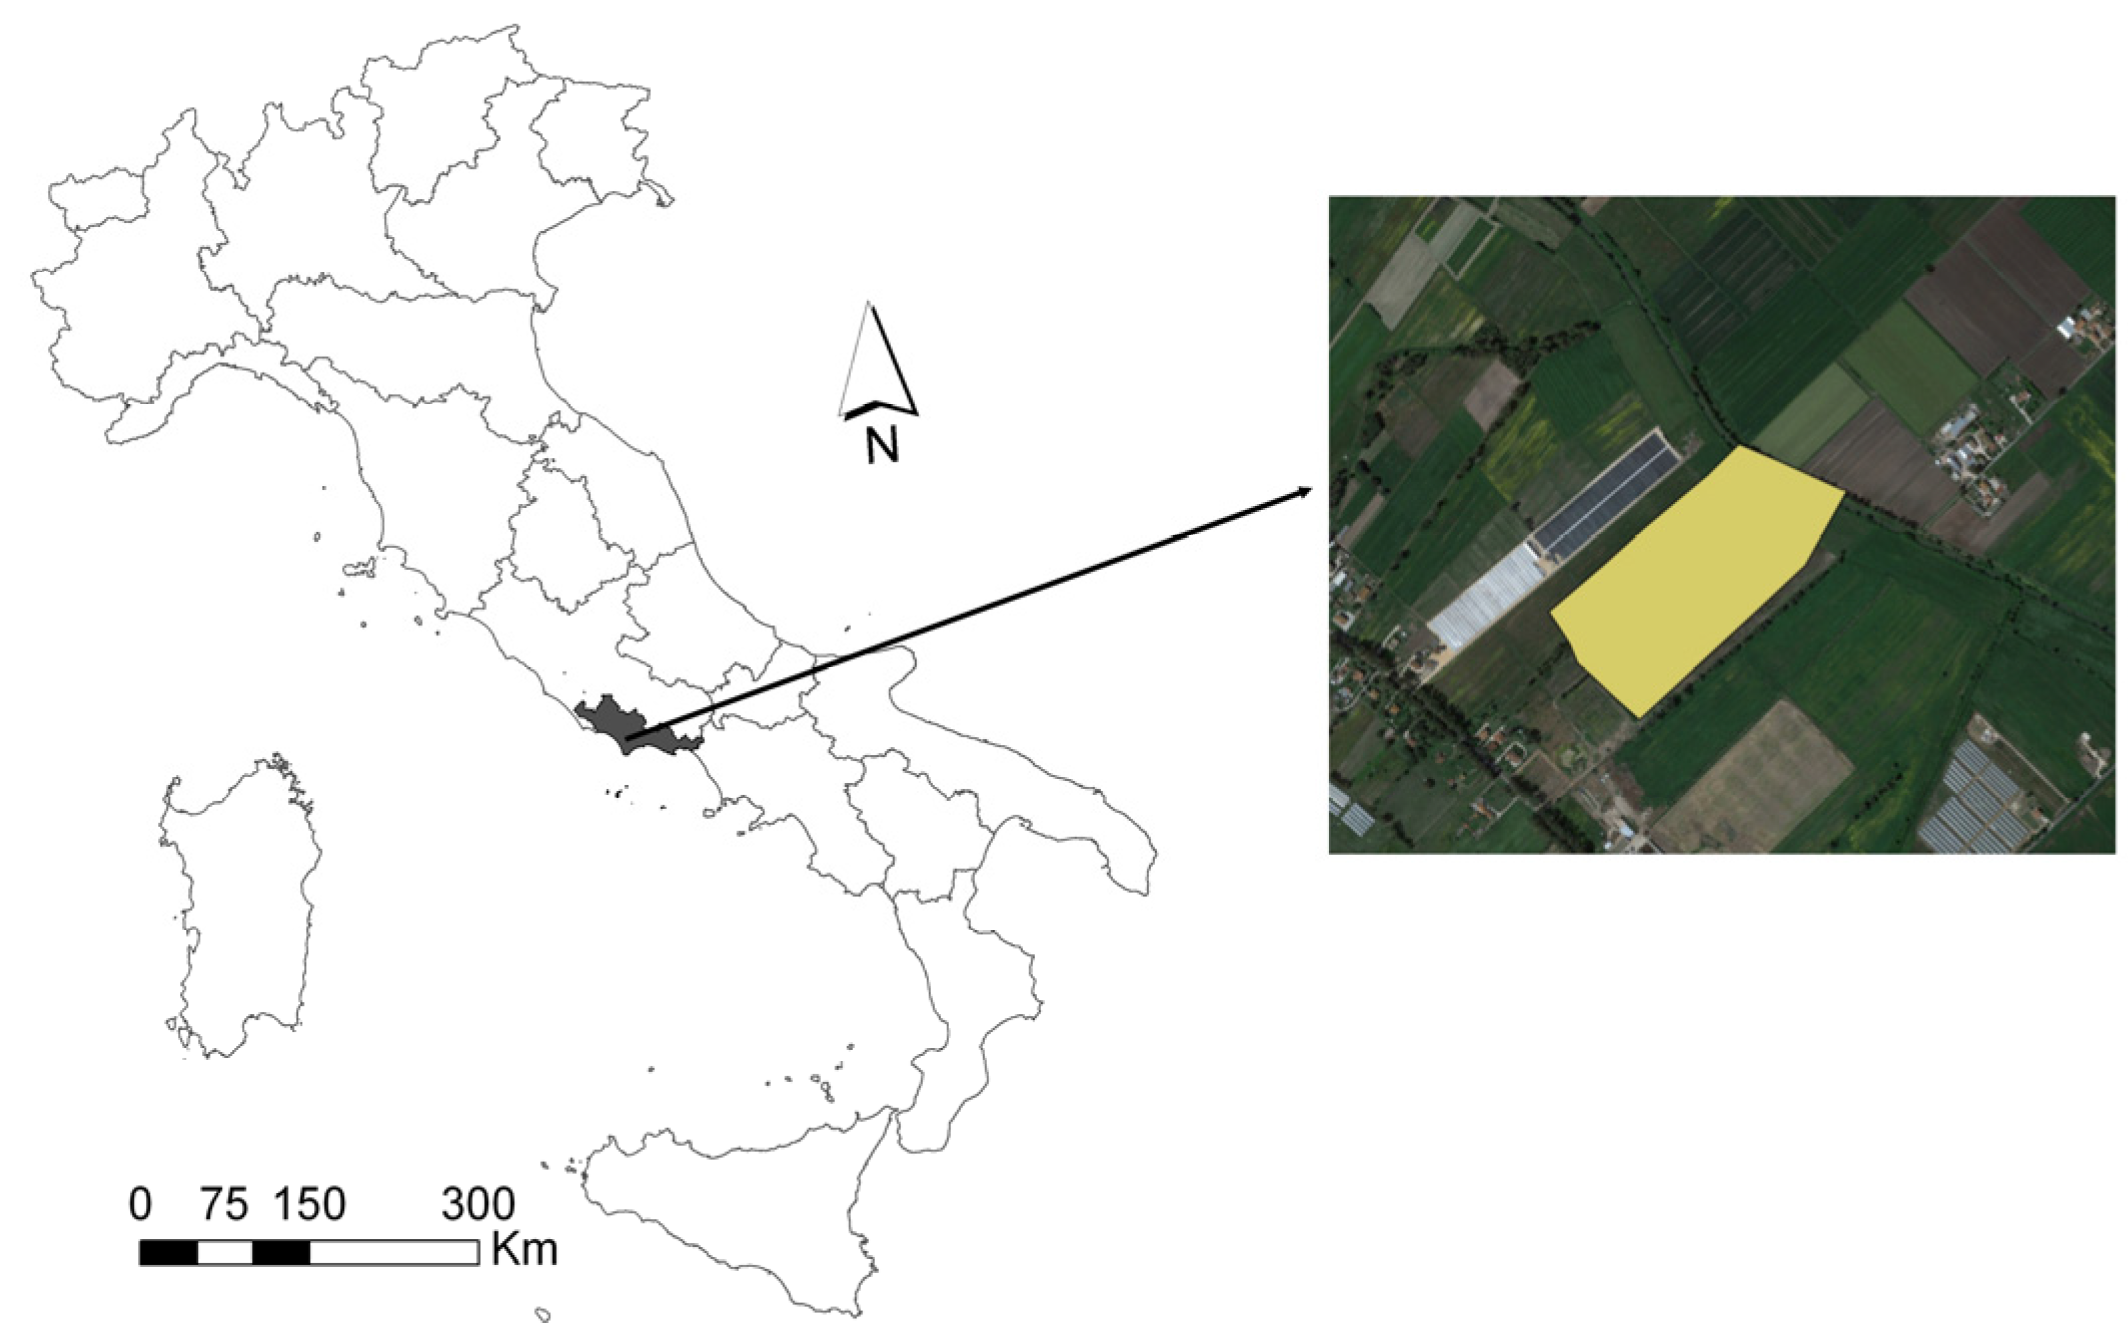
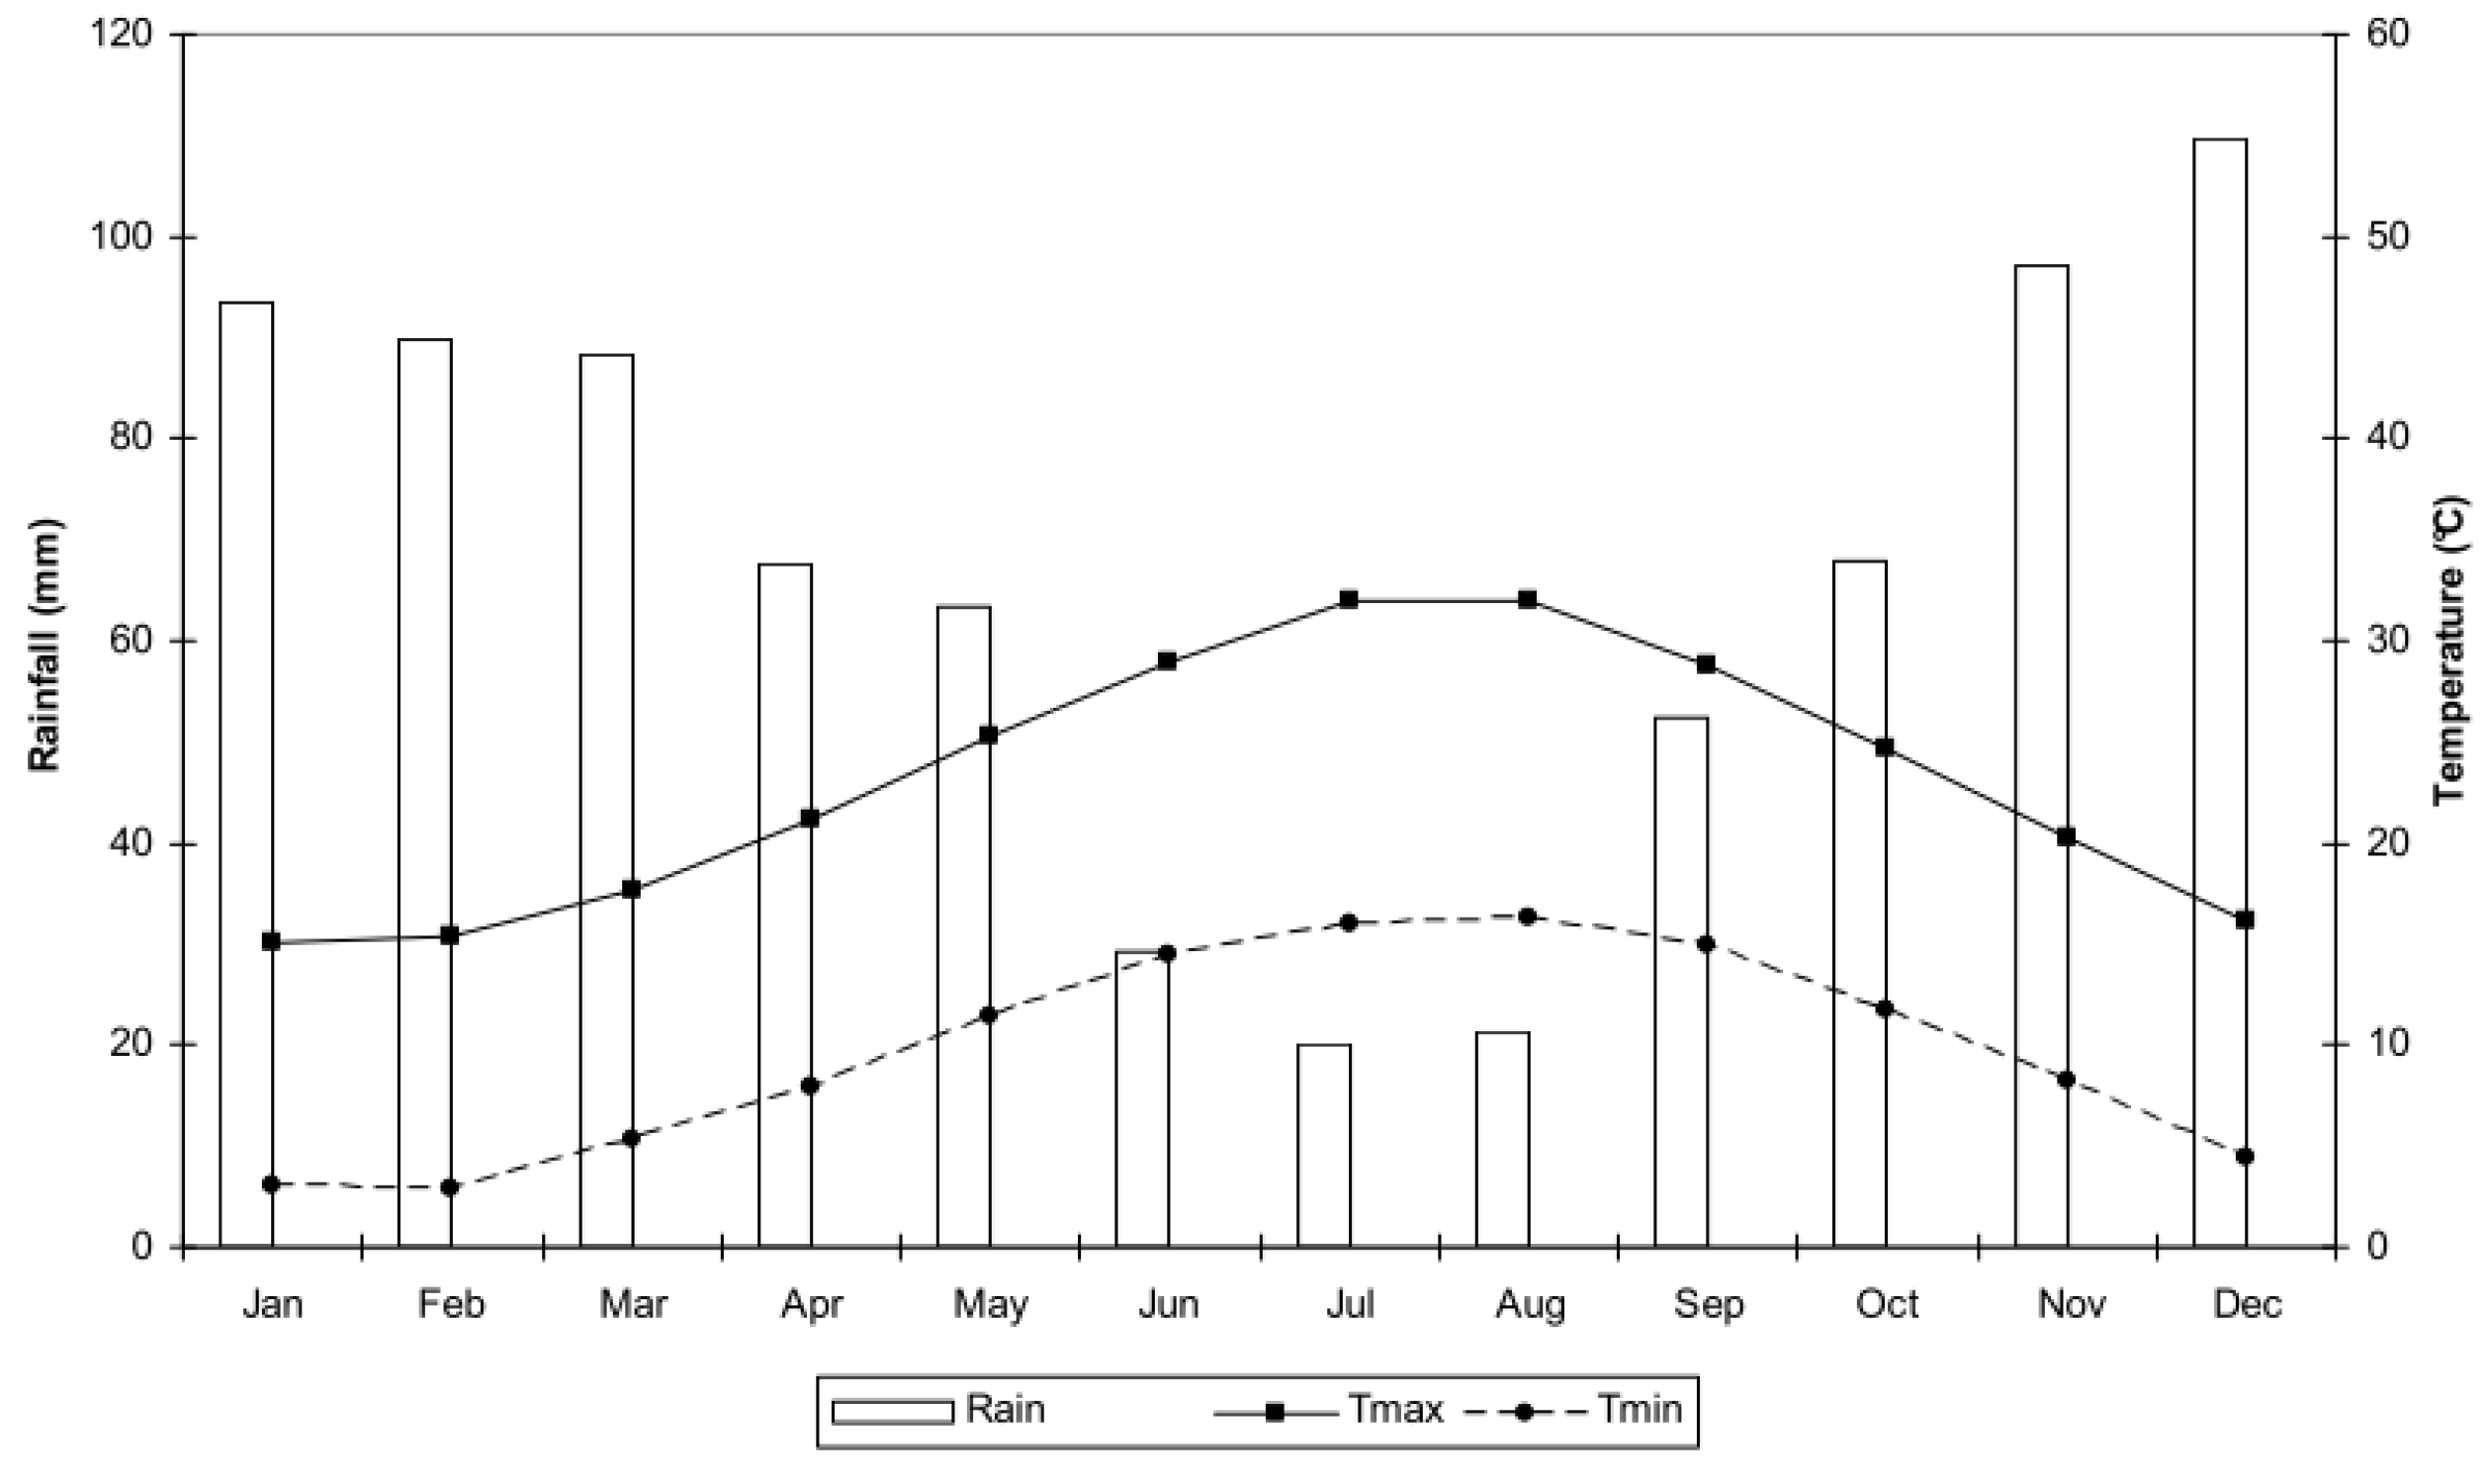
2.1. Site Description and Data Collection

In the framework of a local research project (Nitrate Vulnerability of Latium Region—VULNRELA), a monitoring study about NO3 percolation was performed in a private buffalo livestock farm located in Sabaudia, Latina Province plain, Central Italy. The farm, covering an area of about 17 hectares, is located in a coastal plain with mean altitude of 9 m a.s.l., drained in the 1930s from wetlands. Outcropping lithologies are mixed yellow sands, tuffs and lacustrine clays, and a multi-level aquifer system is present; the plain is included in a NVZ for the presence of intensive agriculture and livestock farming (Figure 1).
The mean temperatures during winter and summer are 10.5 and 20.5 °C, respectively, the mean annual rainfall is about 800 mm, and the rainy season—with about 60% of the total annual rainfall occurring—is November–March. Temperate winter and dry summer are typical of the Mediterranean climate (Figure 2). For the purposes of the research, time series of climatic data (2004–2015) were acquired from a weather station managed by ARSIAL (Regional Agency for Extension Services of Latium), about 7 km from the experimental site, which provided records of rainfall, relative humidity, air temperatures, wind speed and solar radiation.
N fertilization in the study area often exceeds the limit of 170 kg·ha−1 fixed for NVZs by the EU, and gross irrigation supplies can reach a total of 600 mm for each summer cultivation cycle. The frequent and large use of fertilizers, and the intensive irrigation combined with a shallow groundwater table create a favorable environment for the leaching of nutrients to subsoil layers and groundwater.
The soil of the experimental site, classified as Vertic Stagnosols [40], was analyzed for physical, hydrological, and chemical properties according to the standard methods [41,42]. In Table 1, the main soil physical and chemical characteristics are reported.
At present in the farm there are 430 heads of buffalo. The monitored field is cultivated with forage crops in a double crop annual rotation: Italian ryegrass (Lolium multiflorum Lam.) grown from October to May and silage corn (Zea mays L.) grown from June to September (Table 2). Organic fertilizers are provided by livestock as buffalo slurry and manure and are applied in combination with Nitrophoska® (12% N) prior to sowing each crop. Urea 46% is provided as a top dressing. Considering an average N content of the liquid and solid manure of 1.96 g kg−1 [43], the amount of organic N applied yearly to the field is about 157 kg·ha−1. During the silage corn cycle (dry season), sprinkler irrigation is provided weekly at an average rate of 50 mm. All the information was provided by the farmer.
The monitored field was equipped with three micro-lysimeters, made up by a PVC pipe with a porous ceramic cup at one end. These were inserted in the soil to collect soil solution down to 30, 60 and 90 cm depths, respectively. By means of a vacuum pump, a depression is created inside the lysimeters, establishing a pressure gradient from soil to the inner lysimeter that allows the soil solution to enter the pipe through the porous ceramic cup. Samples of this solution were collected every about two weeks during a two-year period, between November 2013 and November 2015, transferred in plastic vials and stored at −18 °C to prevent any N transformation before analysis.
At a later stage these samples were defrosted and analyzed for NO3-N concentration by means of a spectrophotometer with an automatic procedure: nitrates are reduced into nitrites that form a colored complex read at 550 nm. Due to technical problems occurred during summer 2015, the measurements are considered as reliable until May 2015, and hence later measurements were not reported.

2.2. Nitrogen Balance and Nitrogen Use Efficiency (NUE) Calculation

A simplified N balance in the soil-plant system was computed following the approach proposed by Constantin et al. [44], Pieri et al. [45], and Di Bene et al. [46]. The method accounts for the input and output components, calculated as the difference between the N entering and leaving the soil. The balance is an indicator of either surplus (when input > output), indicating N accumulation in the soil, or deficit (when output > input), showing a net N depletion from the soil; the result is expressed as kg N ha−1 year−1. To consider the N surplus as an indicator of possible N leaching is a simplification; however, the available measured data did not allow us to take into account the other components of N loss.
The N balance was calculated as follows:
N balance = A + F + R - U
where N balance refers to total N variation; A is N from atmospheric deposition; F is N applied as mineral and organic fertilizers; R is N input from organic sources (plant roots); U is the N amount taken up by the total above-ground crop biomass.
A was estimated by multiplying the average N concentration in dry and wet atmospheric depositions for the yearly rainfall amount. According to Grignani et al. [33] and Pieri et al. [45], the N concentration in dry and wet atmospheric depositions was, on average, 2 mg·L−1 for Central Italy. F was calculated by multiplying the amount of fertilizers applied for their respective N concentrations (Table 2). R was estimated as 15% of the total above-ground biomass of each crop [47]. U was calculated by multiplying the total above-ground biomass of each crop by its N concentration (Table 2).
In order to assess the nitrogen use efficiency (NUE) of the Italian ryegrass-silage corn rotation, the partial nutrient balance proposed by Dobermann et al. [48] was used:
N U E ( % ) = T o t a l   o u t p u t T o t a l   i n p u t 100
This is the simplest form of NUE: a value close to 1 suggests that soil fertility will be sustained at a steady state, while values well below 1 suggest avoidable nutrient losses. Also values >1 must be regarded as unsustainable, because more nutrients are removed with the harvested crop than applied by fertilizer and/or manure. This is a simplification of a complex process, since nutrient removal by erosion, leaching and gaseous emissions are not considered. Nevertheless, this index provides qualitative information about the N available to the crops and the environmental impact in terms of N surplus. The obtained NUE allows farmers to make comparisons among crops in the same environment and time, and to decide which crop or which form of agronomic management is advisable.

2.3. Model Simulation

Data about soil, weather and agronomic management were used as input for the EPIC model—WinEPIC0509 version 1.0, a field-scale agroecosystem model that simulates crop production as a function of weather, soil conditions, and production practices employed (e.g., tillage types, tillage frequency, crop rotations). EPIC was designed, in principle, to explore the impacts of soil erosion on crop productivity [49], and evolved with continued refinements to approach carbon and nutrient cycling via submodels; also, additional capacity was introduced to predict water quality and the response of crops to atmospheric CO2 [50]. EPIC and the models which have evolved from it have been applied extensively to a variety of soils and cropping systems worldwide [51].
EPIC’s nutrient cycling sub-routine tracks soil N movement through five organic C/N pools and two inorganic pools. The five organic C/N pools consist of two surface litter pools—metabolic and structural litter—and three subsurface pools—microbial biomass, an active soil humus pool (called ‘‘slow’’ humus) and a stable (or ‘‘passive’’) soil humus pool. The inorganic N pools are NO3 and NH4+. N moves into the organic pools through plant residues, roots, green manures or fertilizers, and out of the organic pools through sediment losses or through mineralization to the inorganic ammonium pool, which also receives inputs from ammonium fertilizers. The ammonium pool increases based on mineralization and fertilizer inputs, and decreases via nitrification losses to the NO3 pool or volatilization into the atmosphere as NH3.
The NO3 pool in EPIC represents the pool of N that is available for plant uptake. N enters this pool through precipitation deposition, fertilization and nitrification, and exits through runoff, subsurface flow, leaching, denitrification and plant uptake [52]. A thorough description of the functions underlying the various transformation processes in the organic C/N cycle can be found in Izaurralde et al. [53].
In the considered farm, the N cycle was modeled for the same period in which climatic data are available (2004–2015), assuming no changes of agronomic management. In order to compare the modeled NO3 concentration in soil solution for the whole soil profile to the NO3 concentration measured into the lysimeters, only the period from November 1 2013 to September 30 2015 was reported as a result. In WinEPIC outputs, the NO3 concentration is given as the daily concentration in stored water along the soil profile, while we measured the soil solution concentration at three different depths at specific sampling dates (every about two weeks). Rather than comparing these two types of data, we considered it more appropriate to compare their trends, in order to assess whether predicted (modeled) NO3 concentrations were consistent with measured NO3 concentrations, especially when the critical (highest) NO3 concentrations in soil solution occurred. Therefore, at each sampling date the measured cumulative concentration was put in relation to the sum of the WinEPIC daily values of a two-week period preceding the same dates.
In order to evaluate the efficiency of a change in the N fertilization rate, the WinEPIC model was used to carry out a scenario analysis for the 2004–2015 period. The current N fertilizing management was used as a baseline (S0) for simulating three alternative scenarios with different fertilization rates. The first scenario (S1) was run with a reduced N supply considering the high N fertilization in the baseline; in the other scenarios (S2 and S3) we assumed that the mineral fertilization supplies more readily available N, in comparison with the organic fertilization, when applied during the rainy season or an irrigation period, thus increasing the amount of N leaching. Scenarios are defined as follows:
  • S0: Baseline;
  • S1: 50% reduction of both organic and mineral fertilization rates, maintaining the same application dates;
  • S2: omission of the mineral fertilization in Italian ryegrass cycle only;
  • S3: elimination of the mineral fertilization on both Italian ryegrass and silage corn cycles.
These could represent possible options for farmers for more sustainable fertilizing management, mitigating the N leaching risk.

3. Results and Discussion

3.1. Nitrogen Balance and Nitrogen Use Efficiency

The N balance was obtained as the difference between the mean annual N inputs and the mean annual N outputs. It was calculated separately for each crop and then summed up for the entire cropping system, as rotational crops can take advantage of previous applications of fertilizers and residual plant inputs (Table 3).
The average annual N balance was equal to 224 kg·ha−1 with the Italian ryegrass management contributing 65% to this amount. This N surplus is mainly due to the high N application of manure and mineral fertilizations that largely exceeded N removals by plant uptake, and it is the maximum amount allowed by the Nitrates Directive (see Table 2). The NUE index value for the whole crop rotation indicates that, yearly, the above-ground biomass crop absorbed only 49% of the total amount of N, originating from A (atmospheric deposition), F (mineral and organic fertilizers), R (plant root additions). Likewise, Bassanino et al. [34] and Demurtas et al. [31] obtained NUE values ranging between 47% and 50% in similar climatic and agronomic conditions with cattle livestock. In particular, for the considered cropping system, the Italian ryegrass had a much lower efficiency than silage corn in converting N input into crop N biomass. The N surplus may constitute an indicator for the agricultural pressure on the environment and of N loss, which is driven mainly by the N fertilization rate and the soil’s physical, chemical and microbiological properties. The N given to the soil as NH4+ can be quickly converted to NO3 by the nitrifying microorganisms. This anion is not absorbed by the soil, and thus is easily released into the soil liquid phase, possibly moving to the leaching water flow. Sandy soils are particularly sensitive to the leaching of nitrate to groundwater due to their higher permeability.

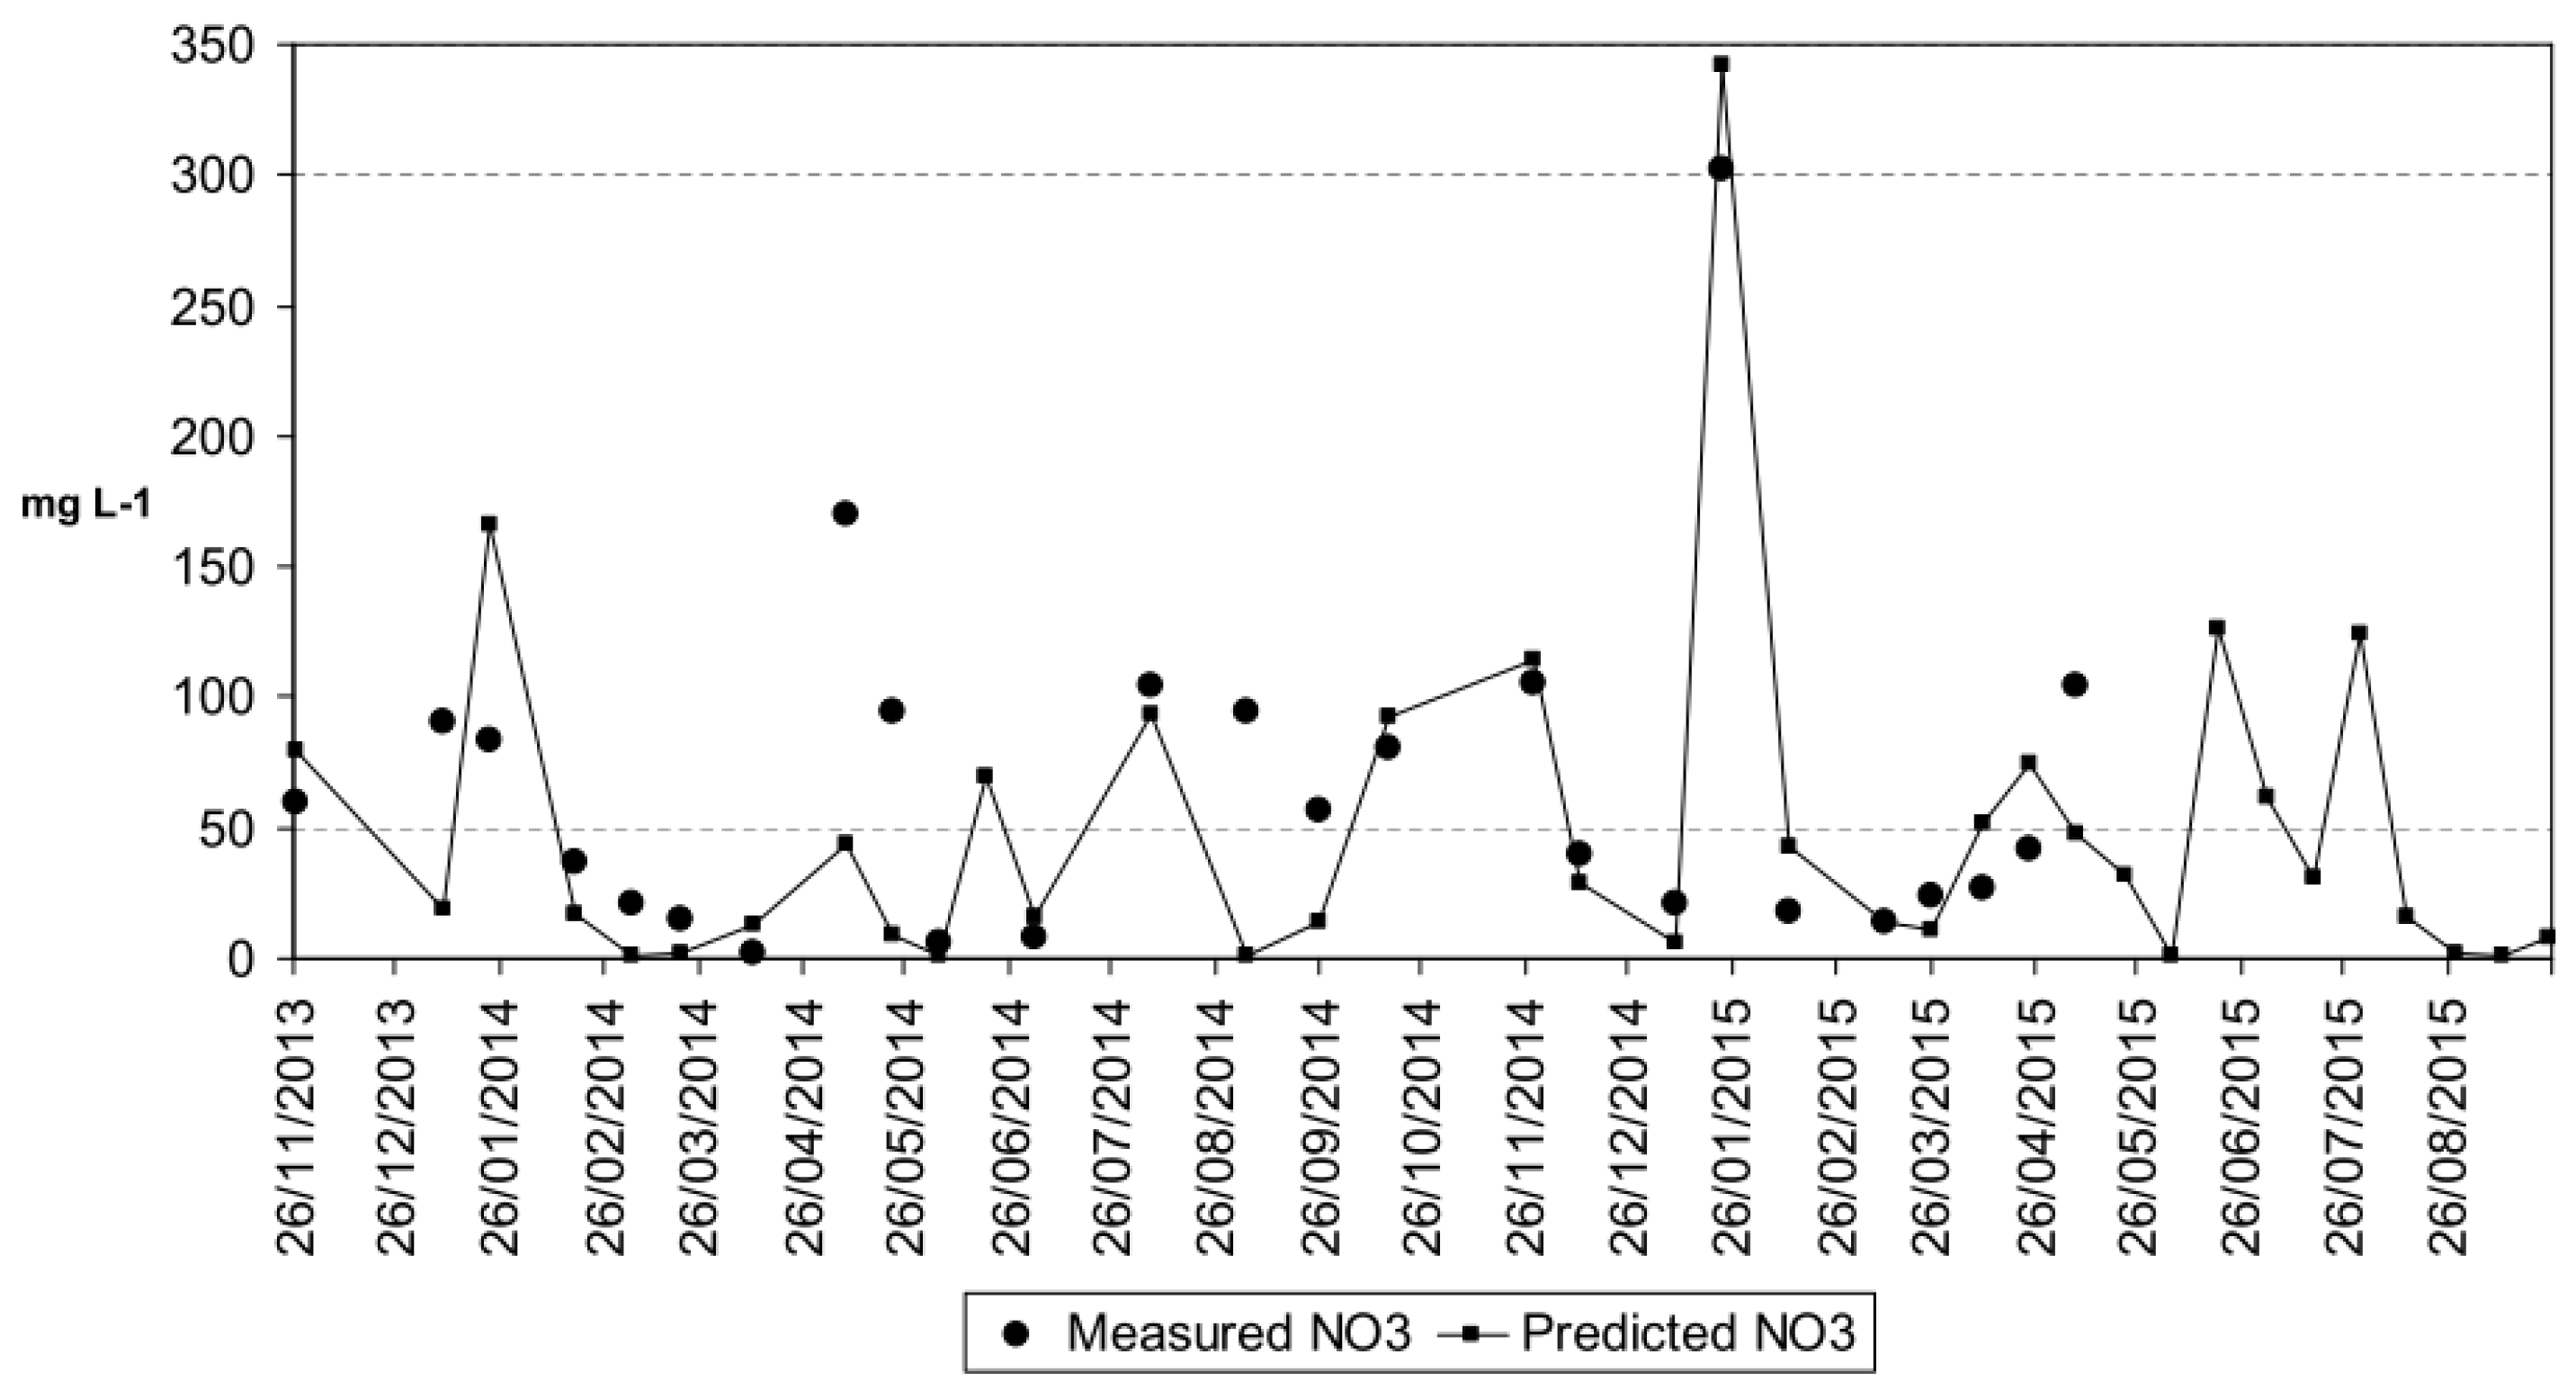
3.2. Nitrogen Leaching and WinEPIC Simulation

Based on the field data, WinEPIC model was used to simulate the soil N cycle. Among the various components of this cycle, we focused on the average total soluble N and on the NO3 concentration in the soil profile, parameters somewhat involved in the evaluation of groundwater pollution risk for NVZ.
Average total soluble N in the soil profile estimated by EPIC is 198 kg·ha−1, which represents 88% of the N surplus obtained by the calculated balance. This fraction is consistent with the observations by Schröder et al. [54] in The Netherlands: on average the potentially leachable N in sandy soils is 73%, rising up to 90% in arable lands as reported also in Roelsma et al. [30].
Figure 3 shows the results of the WinEPIC simulation of the NO3 concentration in soil water for two complete annual crop cycles, together with the values of measured NO3 concentration in the lysimeters; during the second corn crop no samples were considered.
Based on a visual inspection, except for the initial values of the period, the WinEPIC model was able to successfully simulate the NO3 concentration in the soil profile. The initial values were not well represented, probably because the model was still stabilizing. During the considered period, the observed NO3 concentration was higher than 50 mg·L−1 in 48% of the measured data, and ranged from 2 to 302 mg·L−1 with an average of 66 mg·L−1. WinEPIC gives modeled values ranging from 1 to 342 mg·L−1 with an average of 53 mg·L−1, representing the high variability of measured data well. Higher values observed during winter were in conjunction with Italian ryegrass fertilization operations and/or high rainfall events, while those observed during summer were related to fertilizer application and irrigation on silage corn. In intensive agriculture and livestock areas, in particular where sandy soils are prevalent, excess of irrigation and fertilization may lead to pollution of groundwater. Similar findings in adjacent areas with intensive buffalo breeding were obtained by Infascelli et al. [55].
Obviously, evaluating the model performance taking into account only NO3 concentrations is not sufficient for the assessment of its predictive power [29]. Further simulation results such as the other N cycle components and the soil water cycle in relation to the N cycle should be considered [31].

3.3. Fertilizer Management Scenarios

From measured results we identified as critical aspects on NO3 leaching the fertilizing practices adopted, and thus three different scenarios with different fertilizing strategies were simulated for the 2004–2015 period by WinEPIC, assuming current field conditions and management as the baseline (S0). In Table 4, average values (over the 12-yr period) for forage annual yield, total soluble N in the soil profile and N leaching rate, as given by WinEpic, are reported.
The proposed scenarios allowed us to predict the effect of alternative N fertilization management in terms of its environmental (soluble N and N leaching rate) and agronomic (forage yield) performance. In the 12 yrs simulation, forage yield for the three alternative scenarios did not substantially differ from the baseline value: the predicted reduction, less than 5%, can be considered as negligible. We speculate this is likely due to the soil organic N buffer capacity.
In regards to the N cycle, the choice of the most sustainable scenario should be based on other considerations. Reducing both mineral and organic fertilization by 50% (S1), a decrease of 40% in the average total soluble N was obtained, but only a decrease of 22% in the average annual N leaching rate was obtained. The NUE is increased up to 82% for both crops. Eliminating only the mineral fertilization on Italian ryegrass (S2), the amount of total soluble N is reduced even by 60%, and the leaching rate is reduced by 33%. The NUE is 65% for the whole crop rotation, due to the increase of N efficiency in the Italian ryegrass cycle, while in silage corn the N efficiency was the same as the baseline. Finally, eliminating the mineral fertilization (S3), the average total soluble N declined by 51% while the average annual N leaching rate was reduced by 80%. The NUE is higher than in the other scenarios (89%). However, in this last scenario, the silage corn plants might suffer an N deficit during growth stage.
Based on these considerations, the N mineral fertilization on Italian ryegrass could be eliminated, thus consistently reducing the N leaching rate and increasing the NUE with respect to the baseline, without considerable yield loss. This is consistent with the findings of Demurtas et al. [31] in similar climatic conditions, with the same crop rotation and similar management (cattle slurry and mineral fertilization). Zavattaro et al. [56] highlighted that in intensively corn-based cropping systems in northern Italy, the total supply of fertilizer could be reduced to minimize leaching and other potential losses. Morari and Giupponi [57] reported that reduced fertilization was highly effective in reducing the N impact on groundwater quality compared to high-input management. On the whole, considering the current situation and management of intensive agriculture and livestock areas, optimizing fertilization would result in a reduction of N leaching loss and represent a means of control for non-point source pollution.

4. Conclusions

In a farm located in Sabaudia, Latina Province plain, Central Italy, the monitoring results of NO3 concentration in soil solution exceeded the maximum allowable NO3 concentration (50 mg·L−1), following fertilizer application and irrigation or abundant rainfall. Data simulated by the WinEPIC model were reliable since the predicted data were consistent with the measured data. Thus, WinEPIC has the potential to predict the fate of N added to soil in relation to soluble N leaching loss below the soil profile using parameters derived from field observations.
Three alternative scenarios with different fertilizing rates were developed, all of them showing a beneficial effect on N loss reduction and an improvement in the NUE, without any substantial decrease in both Italian ryegrass and silage corn biomass yields. Hence, the model can be used to predict the effect of fertilizing practices on N balance, soil N loss and crop biomass yield in NVZs.
The results of this paper suggest a possible improvement of current fertilizing practices of the area, which might be useful in formulating management strategies for intensive cropped catchment to reduce diffuse pollution from agriculture.
Further field-testing using data from other soils, crops and management is needed to extend the model’s application to the whole catchment.

Acknowledgments

This research was supported by Regional Agency for Extension Services of Latium (ARSIAL) which financed the Nitrate Vulnerability of Latium Region (VULNRELA) project. A particular thanks to Claudio di Giovannantonio, Mario Brancaleone and Maurizio Casalati for their technical effort in finding the experimental farm, gathering the management and irrigation scheduling data and giving all the required logistic support.

Conflicts of Interest

The authors declare no conflict of interest.

References

  1. D’Haene, K.; Salomez, J.; De Neve, S.; De Waele, J.; Hofman, G. Environmental performance of nitrogen fertiliser limits imposed by the EU nitrates directive. Agr. Ecosyst. Environ. 2014, 192, 67–79. [Google Scholar] [CrossRef]
  2. Sánchez Pérez, J.M.; Antigüedad, I.; Arrate, I.; García-Linares, C.; Morell, I. The influence of nitrogen leaching through unsaturated soil on groundwater pollution in an agricultural area of the Basque country. Sci. Total Environ. 2003, 317, 173–187. [Google Scholar] [CrossRef]
  3. Arauzo, M.; Valladolid, M. Drainage and N-leaching in alluvial soils under agricultural land uses: implications for the implementation of the EU Nitrates Directive. Agric. Ecosyst. Environ. 2013, 179, 94–107. [Google Scholar] [CrossRef]
  4. Shepherd, M.A.; Chambers, B. Managing nitrogen on the farm: The devil is in the detail. J. Sci. Food Agric. 2007, 87, 558–568. [Google Scholar] [CrossRef]
  5. Plaza-Bonilla, D.; Nolot, J.M.; Raffaillac, D.; Justes, E. Cover crops mitigate nitrate leaching in cropping systems including grain legumes: Field evidence and model simulations. Agric. Ecosyst. Environ. 2015, 212, 1–12. [Google Scholar] [CrossRef]
  6. Quinton, J.N.; Govers, G.; van Oost, K.; Bardgett, R.D. The impact of agricultural soil erosion on biogeochemical cycling. Nat. Geosci. 2010, 3, 311–314. [Google Scholar] [CrossRef] [Green Version]
  7. Knudsen, M.T.; Kristensen, I.S.; Berntsen, J.; Petersen, B.M.; Kristensen, E.S. Estimated N leaching losses for organic and conventional farming in Denmark. J. Agric. Sci. 2006, 144, 135–149. [Google Scholar]
  8. Kros, J.; Frumau, K.F.A.; Hensen, A.; de Vries, W. Integrated analysis of the effects of agricultural management on nitrogen fluxes at landscape scale. Environ. Pollut. 2011, 159, 3171–3182. [Google Scholar] [CrossRef] [PubMed]
  9. Poudel, D.D.; Horwath, W.R.; Mitchell, J.P.; Temple, S.R. Impacts of cropping systems on soil nitrogen storage and loss. Agri. Syst. 2001, 68, 253–268. [Google Scholar] [CrossRef]
  10. Destouni, G.; Darracq, A. Nutrient cycling and N2O emissions in a changing climate: the subsurface water system role. Environ. Res. Lett. 2009, 4, 035008. [Google Scholar] [CrossRef]
  11. Milne, A.E.; Haskard, K.A.; Webster, C.P.; Truan, I.A.; Goulding, K.W.T.; Lark, R.M. Wavelet analysis of the correlations between soil properties and potential nitrous oxide emission at farm and landscape scales. Eur. J. Soil Sci. 2011, 62, 467–478. [Google Scholar] [CrossRef]
  12. Colombo, C.; Palumbo, G.; Sellitto, V.M.; Di Iorio, E.; Castrignanò, A.; Stelluti, M. The effects of land use and landscape on soil nitrate availability in Southern Italy (Molise region). Geoderma 2015, 239–240, 1–12. [Google Scholar] [CrossRef]
  13. Laegreid, M.; Bøckman, O.C.; Kaarstad, O. Agriculture, Fertilizers and the Environment; CABI Publishing: Porsgrunn, Norway, 1999. [Google Scholar]
  14. Velthof, G.L.; Oudendag, D.; Witzke, H.P.; Asman, W.A.H.; Klimont, Z.; Oenema, O. Integrated assessment of nitrogen emissions from agriculture in EU-27 using MITERRA-Europe. J. Environ. Qual. 2009, 38, 402–417. [Google Scholar] [CrossRef] [PubMed]
  15. Bouwman, A.F.; Beusen, A.H.W.; Billen, G. Human alteration of the global nitrogen and phosphorus soil balances for the period 1970–2050. Global Biogeochem. Cy. 2009, 23, GB0A04. [Google Scholar] [CrossRef]
  16. Bouwman, A.F.; Beusen, A.H.W.; Griffioen, J.; Van Groenigen, J.W.; Hefting, M.M.; Oenema, O.; van Puijenbroek, P.J.T.M.; Seitzinger, S.; Slomp, C.P.; Stehfest, E. Global trends and uncertainties in terrestrial denitrification and N2O emissions. Philos. Trans. Royal Soc. B-Biol. Sci. 2013, 368, 20130112. [Google Scholar] [CrossRef]
  17. Gibbons, J.M.; Williamson, J.C.; Prysor Williams, A.; Withers, P.J.A.; Hockley, N.; Harris, I.M.; Hughes, J.W.; Taylor, R.L.; Jones, D.L.; Healey, J.R. Sustainable nutrient management at field, farm and regional level: Soil testing, nutrient budgets and the trade-off between lime application and greenhouse gas emissions. Agric. Ecosys. Environ. 2014, 188, 48–56. [Google Scholar] [CrossRef]
  18. Eichler, F.; Schulz, D. The nitrogen reduction program in the Federal Republic of Germany. Environ. Pollut. 1998, 102, 609–617. [Google Scholar] [CrossRef]
  19. Council of the European Communities Council Directive 91/676/EEC of 12 December 1991 concerning the protection of waters against pollution caused by nitrates from agricultural sources. Available online: http://eur-lex.europa.eu/legal-content/EN/TXT/?uri=CELEX%3A31991L0676 (accessed on 11 April 2016).
  20. Oenema, O.; Kros, H.; de Vries, W. Approaches and uncertainties in nutrient budgets: implications for nutrient management and environmental policies. Eur. J. Agron. 2003, 20, 3–16. [Google Scholar] [CrossRef]
  21. Gardner, K.K.; Vogel, R.M. Predicting ground water nitrate concentration from land use. Ground Water 2005, 43, 1–10. [Google Scholar] [CrossRef] [PubMed] [Green Version]
  22. Giola, P.; Basso, B.; Pruneddu, G.; Giunta, F.; Jones, J.W. Impact of manure and slurry applications on soil nitrate in a maize-triticale rotation: field study and long term simulation analysis. Eur. J. Agron. 2012, 38, 43–53. [Google Scholar] [CrossRef]
  23. Daudén, A.; Quílez, D.; Vera, M.V. Pig slurry application and irrigation effects on nitrate leaching in Mediterranean soil lysimeters. J. Environ. Qual. 2004, 33, 2290–2295. [Google Scholar] [CrossRef] [PubMed]
  24. Chambers, B.J.; Smith, K.A.; Pain, B.F. Strategies to encourage better use of nitrogen in animal manures. Soil Use Manage. 2000, 16, 157–166. [Google Scholar] [CrossRef]
  25. Trindade, H.; Coutinho, J.; van Beusichem, M.L.; Scholefield, D.; Moreira, N. Nitrate leaching from sandy loam soil under a double-cropping forage system estimate from suction-probe measurements. Plant Soil 1997, 195, 247–256. [Google Scholar] [CrossRef]
  26. Trindade, H.; Coutinho, J.; Jarvis, S.; Moreira, N. Effects of different rates and timing of application of nitrogen as slurry and mineral fertilizer on yield of herbage and nitrate-leaching potential of a maize/Italian ryegrass cropping system in north-west Portugal. Grass Forage Sci. 2009, 64, 2–11. [Google Scholar] [CrossRef]
  27. Li, C.; Farahbakhshazad, N.; Jaynes, D.B.; Dinnes, D.L.; Salas, W.; McLaughlin, D. Modeling nitrate leaching with a biogeochemical model modified based on observations in a row-crop field in Iowa. Ecol. Model. 2006, 196, 116–130. [Google Scholar] [CrossRef]
  28. Xu, L.; Niu, H.; Xu, J.; Wang, X. Nitrate-Nitrogen Leaching and Modeling in Intensive Agriculture Farmland in China. Sci. World J. 2013. Available online: http://dx.doi.org/10.1155/2013/353086 (accessed on 29 January 2016). [Google Scholar]
  29. Groenendijk, P.; Heinen, M.; Klammler, G.; Fank, J.; Kupfersberger, H.; Pisinaras, V.; Gemitzi, A.; Peña-Haro, S.; García-Prats, A.; Pulido-Velazquez, M.; et al. Performance assessment of nitrate leaching models for highly vulnerable soils used in low-input farming based on lysimeter data. Sci. Total Environ. 2014, 499, 463–480. [Google Scholar] [CrossRef] [PubMed]
  30. Roelsma, J.; Hendriks, R.F.A. Comparative study of nitrate leaching models on a regional scale. Sci. Total Environ. 2014, 499, 481–496. [Google Scholar] [CrossRef] [PubMed]
  31. Demurtas, C.E.; Seddaiu, G.; Ledda, L.; Cappaia, C.; Doro, L.; Carletti, A.; Roggero, P.P. Replacing organic with mineral N fertilization does not reduce nitrate leaching in double crop forage systems under Mediterranean conditions. Agric. Ecosys. Environ. 2016, 219, 83–92. [Google Scholar] [CrossRef]
  32. Koelsch, R. Evaluating livestock system environmental performance with whole-farm nutrient balance. J. Environ. Quality 2005, 34, 149–155. [Google Scholar]
  33. Grignani, C.; Zavattaro, L.; Sacco, D.; Monaco, S. Production, nitrogen and carbon balance of maize-based forage systems. Eur. J. Agron. 2007, 26, 442–453. [Google Scholar] [CrossRef]
  34. Bassanino, M.; Grignani, C.; Sacco, D.; Allisiardi, E. Nitrogen balances at the crop and farm-gate scale in livestock farms in Italy. Agric. Ecosys. Environ. 2007, 122, 282–294. [Google Scholar] [CrossRef]
  35. Cherry, K.A.; Shepherd, M.; Withers, P.J.A.; Mooney, S.J. Assessing the effectiveness of actions to mitigate nutrient loss from agriculture: A review of methods. Sci. Total Environ. 2008, 406, 1–23. [Google Scholar] [CrossRef] [PubMed]
  36. Goulding, K. Nitrate leaching from arable and horticultural land. Soil Use Manage. 2000, 16, 145–151. [Google Scholar] [CrossRef]
  37. Sieling, K.; Kage, H. N balance as an indicator of N leaching in an oilseed rape - winter wheat-winter barley rotation. Agric. Ecosys. Environ. 2006, 115, 261–269. [Google Scholar] [CrossRef]
  38. Grignani, C.; Bassanino, M.; Allisiardi, E.; Sacco, D. Nitrogen balances at the crop and at the farm-gate scale in NW Italy stocking farms. In Proceedings of the 14th N-Workshop “N management in agro-systems in relation to the Water Framework Directive”, Wageningen, The Netherlands, 24–26 October 2005.
  39. Sacco, D.; Bassanino, M.; Grignani, C. Developing a regional agronomic information system for estimating nutrient balances at a larger scale. Eur. J. Agron. 2003, 20, 199–210. [Google Scholar] [CrossRef]
  40. IUSS Working Group WRB. World Reference Base for Soil Resources 2014 International Soil Classification System for Naming Soils and Creating Legends for Soil Maps; World soil resources reports No. 103; Food and Agriculture Organization of the United Nations: Rome, Italy, 2014. [Google Scholar]
  41. SSSA (Soil Science Society of America). Book Series no. 5. Methods of Soil Analysis. Part 1. Physical and Mineralogical Methods; SSSA Publisher: Madison, WI, USA, 1986. [Google Scholar]
  42. SSSA (Soil Science Society of America). Book Series no. 5. Methods of Soil Analysis. Part 3. Chemical Methods; SSSA Publisher: Madison, WI, USA, 1996. [Google Scholar]
  43. Faugno, S.; Pindozzi, S.; Infascelli, R.; Okello, C.; Ripa, M.N.; Boccia, L. Assessment of nitrogen content in buffalo manure and land application costs. J. Agric. Engin. 2012, 43, 86–92. [Google Scholar]
  44. Constantin, J.; Mary, B.; Laurent, F.; Aubrion, G.; Fontaine, A.; Kerveillant, P.; Beaudoin, N. Effects of catch crops, no till and reduced nitrogen fertilization on nitrogen leaching and balance in three long-term experiments. Agric. Ecosys. Environ. 2010, 135, 268–278. [Google Scholar] [CrossRef]
  45. Pieri, L.; Ventura, F.; Vignudelli, M.; Rossi, P. Nitrogen balance in a hilly semi-agricultural watershed in Northern Italy. Ita. J. Agron. 2011, 6, 67–75. [Google Scholar] [CrossRef]
  46. Di Bene, C.; Tavarini, S.; Mazzoncini, M.; Angelini, L.G. Changes in soil chemical parameters and organic matter balance after 13 years of ramie [Boehmeria nivea (L.) Gaud.] cultivation in the Mediterranean region. Eur. J. Agron. 2011, 35, 154–163. [Google Scholar] [CrossRef]
  47. Masoni, A.; Pampana, S. Fertilizzazione azotata dei Cereali Autunno-vernini. 2003. Available online: http://www.irri.it/docs/fertilizzazioneazotata.pdf (accessed on 7 March 2016) . (in Italian).
  48. Dobermann, A. Nutrient use efficiency-Measurement and management. In Fertilizer Best Management Practices; IFA International Workshop on Fertilizer Best Management Practices (FBMPs): Brussels, Belgium, 2007; pp. 1–28. [Google Scholar]
  49. Williams, J.R.; Dyke, P.T.; Jones, C.A. EPIC: A model for assessing the effects of erosion on soil productivity. In Analysis of Ecological Systems: State-of-the-Art in Ecological Modeling; Lauenroth, W.K., Skogerboe, G.V., Flug, M., Eds.; Elsevier Scientific Publishing Company: Amsterdam, The Netherlands, 1983; pp. 553–572. [Google Scholar]
  50. Gassman, P.W.; Williams, J.R.; Benson, V.W.; Izaurralde, R.C.; Hauck, L.; Jones, C.A.; Atwood, J.D.; Kiniry, J.; Flowers, J.D. Historical development and applications of the EPIC and APEX models. In Working Paper 05-WP 397 Center for Agricultural and Rural Development; Iowa State University: Ames, IA, USA, 2005. [Google Scholar]
  51. He, X.; Izaurralde, R.C.; Vanotti, M.B.; Williams, J.R.; Thomson, A.M. Simulating long-term and residual effects of nitrogen fertilization on corn yields, soil carbon sequestration, and soil nitrogen dynamics. J. Environ. Qual. 2006, 35, 1608–1619. [Google Scholar] [CrossRef] [PubMed]
  52. David, M.B.; Del Grosso, S.J.; Hu, X.; Marshall, E.P.; McIsaac, G.F.; Parton, W.J.; Tonitto, C.; Youssef, M.A. Modeling denitrification in a tile-drained, corn and soybean agroecosystem of Illinois, USA. Biogeochemistry 2009, 93, 7–30. [Google Scholar] [CrossRef]
  53. Izaurralde, R.C.; Williams, J.R.; McGill, W.B.; Rosenberg, N.J.; Jakas, M.C.Q. Simulating soil C dynamics with EPIC: Model description and testing against long-term data. Ecol. Model. 2006, 192, 362–384. [Google Scholar]
  54. Schröder, J.J.; Aarts, H.F.M.; van Middelkoop, J.C.; Schils, R.L.M.; Velthof, G.L.; Fraters, B.; Willems, W.J. Permissible manure and fertilizer use in dairy farming systems on sandy soils in The Netherlands to comply with the Nitrates Directive target. Eur. J. Agron. 2007, 27, 102–114. [Google Scholar] [CrossRef]
  55. Infascelli, R.; Pelorosso, R.; Boccia, L. Spatial assessment of animal manure spreading and groundwater nitrate pollution. Geospatial Health 2009, 4, 27–38. [Google Scholar] [CrossRef] [PubMed]
  56. Zavattaro, L.; Monaco, S.; Sacco, D.; Grignani, C. Options to reduce N loss from maize in intensive cropping systems in Northern Italy. Agric. Ecosys. Environ. 2010, 135, 268–278. [Google Scholar] [CrossRef]
  57. Morari, F.; Giupponi, C. Effects of four cultivation systems for maize on nitrogen leaching 2. Model simulation. Eur. J. Agron. 1997, 6, 113–123. [Google Scholar] [CrossRef]
Figure 1. Location of the study area in Latina Province (Central Italy). The yellow area outlines the experimental field.
Agronomy 06 00023 g001
Figure 2. Monthly mean maximum and minimum temperature, and monthly total rainfall in Sabaudia area, Latina Province (Central Italy).
Agronomy 06 00023 g002
Figure 3. Dynamics of the NO3 concentration (mg·L−1) in the soil solution measured and predicted by WinEPIC model during the Italian Ryegrass-silage corn rotation (2013–2015).
Agronomy 06 00023 g003
Table 1. Main soil physical and chemical characteristics at the water buffalo livestock farm in Sabaudia Municipality (Latina Province Plain).
Properties *First layer (0–50)Second layer (50–65)Third layer (65–110)Fourth layer (110–200)
Texture (USDA method)Sandy LoamSandy LoamSandy Clay LoamSandy Clay Loam
Bulk density (T m−3)1.491.511.351.36
Wilting point (m3 m−3)14.016.323.221.8
Field capacity (m3 m−3)35.631.939.838.5
pH7.07.57.68.7
E.C. (dS m−1)0.640.200.370.51
C.E.C. (cmol(+) kg−1)15.78.920.217.6
Organic Matter (%)2.160.580.340.24
Total N (g kg−1)1.30.40.30.2
CaCO3 (%)0.00.00.00.2
P (ppm)80733
* E.C.: electrical conductivity; C.E.C.: Cation exchange capacity; Total N: total nitrogen; CaCO3: total calcium carbonate; P: total phosphorus.
Table 2. Agronomic management of Italian ryegrass (Lolim multiflorum L.) and silage corn (Zea mays L.) at the intensive buffalo livestock farm in Sabaudia.
CropOperationPeriodRateNigroten
Italian ryegrass
PlowingFirst half of October
Fertilizer applicationSecond half of October300 kg·ha−1 (mineral) a36 kg·ha−1
40,000 kg·ha−1 (organic) b78 kg·ha−1
SeedingEnd of October80 kg·ha−1 seeds
Fertilizer applicationSecond half of January180 kg·ha−1 (mineral) c83 kg·ha−1
HarvestFirst decade of May8 Mg·ha−1 (as dry weight) d80 kg·ha−1
Silage corn
PlowingEnd of May
Fertilizer applicationFirst half of June300 kg·ha−1 (mineral) a36 kg·ha−1
40,000 kg·ha−1 (organic) b78 kg·ha−1
SeedingMiddle June75,000 seeds ha−1
IrrigationWeekly, from seeding to50 mm each
Fertilizer applicationMiddle July200 kg·ha−1 (mineral) c92 kg·ha−1
HarvestFirst decade of September15 Mg·ha−1 (as dry weight) d150 kg·ha−1
a NPK 12-12-17; b Slurry and manure (N 1960 mg·L−1); c Urea 46%; d Nitrogen concentration in the plant tissues was assumed to be 1% according to Grignani et al. [33].
Table 3. Mean annual nitrogen balance (kg·ha−1) of Italian ryegrass (Lolium multiflorum Lam.) and silage corn (Zea mays L.) rotation, calculated as the difference of input−output, and nitrogen use efficiency (NUE) evaluation.
N balance *RyegrassSilage maizeWhole rotation
Input:
A161616
F197206404
R122335
Total input225245470
Output:
U80150230
Balance: input − output14595224
NUE (%)366149
* N balance: total N variation; F: N applied as mineral and organic fertilizers; R: N input by organic addition (plant roots); U: N amount taken up by the above-ground crop biomass; A: N from atmospheric deposition, estimated by multiplying the N concentration for the yearly rainfall amounts.
Table 4. Predicted forage average annual yields, total soluble nitrogen and nitrogen leaching rate, in different scenarios.
ScenarioItalian ryegrass yield (Mg d.w. ha−1)Silage corn yieldAverage annual total soluble N (kg·ha−1)Average annual N leaching rate (kg day−1 ha−1)
S0: Baseline9.311.01984
S1: 50% of total N fertilization9.010.71183
S2: No mineral N fertilization for Italian ryegrass9.110.9803
S3: Only organic N9.010.5961

