Article

Estimation of Nitrogen Concentration in Walnut Canopies in Southern Xinjiang Based on UAV Multispectral Images

1
College of Life Sciences and Technology, Tarim University, Alar 843300, China
2
State Key Laboratory Breeding Base for the Protection and Utilization of Biological Resources in Tarim Basin Co-Funded by Xinjiang Corps and the Ministry of Science and Technology, Tarim University, Alar 843300, China
3
The National and Local Joint Engineering Laboratory of High Efficiency and Superior-Quality Cultivation and Fruit Deep Processing Technology of Characteristic Fruit Trees in South Xinjiang, Tarim University, Alar 843300, China
4
College of Horticulture and Forestry, Tarim University, Alar 843300, China
5
Xinjiang Production and Construction Crops Oasis Eco-Agriculture Key Laboratory, Agricultural College of Shihezi University, Shihezi 832003, China
6
Yunnan Academy of Forestry and Grassland, Kunming 650000, China
7
Horticulture College, Xinjiang Agricultural University, Urumqi 830000, China
*
Authors to whom correspondence should be addressed.
Agronomy 2023, 13(6), 1604; https://doi.org/10.3390/agronomy13061604
Submission received: 2 May 2023 / Revised: 27 May 2023 / Accepted: 12 June 2023 / Published: 13 June 2023
(This article belongs to the Special Issue Precision Operation Technology and Intelligent Equipment in Farmland)

Abstract

:
Nitrogen is one of the most important nutrients affecting the growth and fruit quality of walnut trees. Rapid and accurate monitoring of nitrogen concentration in the walnut canopy can provide a digital basis for its nutritional diagnosis and precision fertilization. Consequently, the main purpose of this study was to use Unmanned Aerial Vehicle (UAV) remote sensing technology to monitor the nitrogen concentration of walnut canopies. In this study, UAV multispectral images of the canopies of nine walnut orchards with different management levels in Wensu County, South Xinjiang, China, were collected during the fast-growing (20 May), sclerotization (25 June), and near-maturity (27 August) periods of walnut fruit, and canopy nitrogen concentration data for 180 individual plants were collected during the same periods. The validity of the information extracted via the outline canopy and simulated canopy methods was compared. The accuracy of nitrogen concentration inversion for three modeling methods, partial least squares regression (PLSR), support vector machine (SVM), and random forest (RF), was analyzed; the effects of different combinations of variables on model accuracy were compared; and the spatial distribution of the nitrogen concentration in the walnut canopy was numerically mapped using the optimal model. The results showed that the accuracy of the model created using the single plant information extracted from the outlined canopy was better than that of the simulated canopy method, but the simulated canopy method was more efficient in extracting effective information from the single plant canopy than the outlined canopy. The simulated canopy method overcame the difficulty of mismatching the spectral information of individual plants extracted, by outlining the canopy in the original image for nitrogen distribution mapping with the spectral information of image elements in the original resolution image. The prediction accuracy of the RF model was better than that of the SVM and PLSR models; the prediction accuracy of the model using a combination of waveband texture information and vegetation index texture information was better than that of the single-source model. The coefficients of determination (R2) values of the RF prediction model built using the band texture information extracted via the simulated canopy method with the vegetation index texture information were in the range of 0.61–0.84, the root mean square error (RMSE) values were in the range of 0.27–0.43 g kg−1, and the relative analysis error (RPD) values were in the range of 1.58–2.20. This study shows that it is feasible to monitor the nitrogen concentration of walnut tree canopies using UAV multispectral remote sensing. This study provides a theoretical basis and methodological reference for the rapid monitoring of nutrients in fruit trees in southern Xinjiang.

1. Introduction

Walnuts (Juglans regia L.) are a woody oilseed crop [1]. They are grown on a large scale in 48 countries worldwide [2]. China’s walnut planting area accounts for more than 40% of the global planting area [3], and its output accounts for 48% of the world‘s total output [4]. Xinjiang is an important planting area for walnuts in China, and its production ranks first in the country. Nitrogen affects plant photosynthesis and total primary productivity [5,6,7] and is a key element in the growth and development of fruit trees [8]. Walnuts are significantly dependent on nitrogen in all organs during growth [9], and nitrogen deficiency not only affects the walnut canopy structure and leaf color but can also lead to a decrease in fruit yield and quality [10]. However, excessive nitrogen application can increase linoleic acid levels in the fruit, leading to a decrease in lipid oxidative stability in walnuts [11], and can disrupt the nutritional balance of the plant [12]. Therefore, the real-time monitoring of the nitrogen concentration in the walnut canopy is an effective way to optimize the nitrogen fertilizer supply [13], which is conducive to the improvement of the fruit commodity and nitrogen use efficiency. The traditional method of crop canopy nitrogen monitoring requires destructive sampling, which is time-consuming, labor-intensive, costly, and not environmentally friendly. It is also unsuitable for the dynamic monitoring of crop growth, although the method has high measurement accuracy. With the continuous development of remote sensing technology, providing an effective method for estimation of the biophysical and biochemical factors of crops [14,15,16], crop growth can be monitored rapidly and non-destructively by sensing the spectral reflectance characteristics of the crop canopy [17,18]. Therefore, crop remote sensing has become an important research component in the field of precision agriculture. Satellite remote sensing can be used to monitor the crop nitrogen status over large areas [19,20,21], but factors such as spatial resolution, weather, and revisit cycles limit the ability of satellite remote sensing to obtain effective data on critical crop fertility periods [22]. Ground-based remote sensing has high accuracy in estimating crop nitrogen [23,24] but is not efficient in conducting large-area crop monitoring and is not suitable for canopy information monitoring in tall tree orchards.
Unmanned Aerial Vehicle (UAV) remote sensing has the advantages of being mobile, flexible, and less affected by weather, and has been widely used in the remote sensing monitoring of crops [25]. In recent years, UAVs with multispectral sensors have achieved satisfactory monitoring results in annual field crops for nitrogen [26,27], yield [28,29,30], biomass [31,32,33], leaf area index [34], chlorophyll [35], and other indicators. For example, in perennial fruit trees, Prado Osco et al. [36] used vegetation indices extracted from UAV multispectral images combined with machine learning to predict the canopy nitrogen concentration of citrus trees. Noguera et al. [37] segmented the olive tree canopy in UAV multispectral images and extracted spectral information to develop predictive models for nitrogen, phosphorus, and potassium in the olive tree canopy. In addition, Perry et al. [18] used UAV multispectral images to predict the canopy nitrogen concentration of red-blush pears.
Precise fertilization according to the growth of fruit trees is an important way to ensure high yields and the quality of fruit trees. In actual production, fruit farmers usually ignore the difference in nutrient demand between trees and use a unified amount of fertilizer for fertilization, which often leads to insufficient or excessive fertilization, limiting the improvement of planting efficiency [37]. The use of UAV remote sensing to dynamically monitor the nitrogen concentration of a single canopy of fruit trees to guide variable nitrogen application in orchards can minimize the differences in the nitrogen status among individual fruit trees and can improve fruit merchantability and nitrogen fertilizer utilization [36,37]. However, the use of UAV multispectral images to monitor the growth of fruit trees requires the extraction of individual canopy information from the original image. The irregular canopy shape of fruit trees and the mutual masking between canopy layers pose challenges to the effective extraction of spectral information within an individual canopy. The monitoring of nitrogen via UAV multispectral remote sensing images is mostly applied to one-year-old field crops with a continuous canopy [38]. So far, there have been no reports on the inversion of walnut canopy nitrogen via UAV multispectral remote sensing in the monitoring of fruit tree canopy nitrogen. The best modeling method and input factors for the inversion of the nitrogen concentration in walnut canopies remain to be studied.
The general objective of this study was to establish a method for the UAV remote sensing monitoring of the walnut canopy nitrogen concentration. Specific objectives included the following: (1) developing an effective method for extracting individual canopy information from spatially continuous images of walnut tree canopies; (2) screening a set of monitoring factors suitable for UAV remote sensing of the nitrogen concentration in walnut tree canopies; and (3) developing a modeling method for the high-precision inversion of the nitrogen concentration in walnut tree canopies.

2. Materials and Methods

2.1. Overview of the Study Area

The study area is located in Wensu County, Aksu Region, Xinjiang Uygur Autonomous Region, China (40°52′–42°15′ N, 79°28′–81°30′ E). It is 117 km wide from east to west and 158 km long from north to south, with a total area of 1.42 × 10⁴ km2. The terrain is high in the north and low in the south, with sufficient light and dry air, and Wensu County has a typical continental climate. The average annual temperature is 10.10 °C, the extreme maximum temperature is 40.9 °C, and the extreme minimum temperature is −27.4 °C. The average annual total solar radiation is 140 kcal cm−2, the average annual sunshine duration is 2747.7 h, and the average annual frost-free period is 185 days. The average annual precipitation is 65.4 mm, the maximum annual precipitation is 123.4 mm, the minimum annual precipitation is 25.5 mm, and the average annual evaporation is 1883.6 mm. The soil texture is mainly sandy loam, which is weakly alkaline, with an organic matter concentration between 0.24% and 1.62% [39]. From the forestry station of Wensu County, we learned that in 2020, the total area of walnut planted in Wensu County was 5.33 × 10⁴ ha. Wensu County is a high-quality walnut-producing area in China and is reputed to be “the hometown of walnuts in China.”

2.2. Selection of the Test Site

In this study, based on the average yield of walnuts for three consecutive years from 2018 to 2020, nine walnut orchards managed by different growers were selected as experimental sites in Wensu County (A: 41°20′25.10″ N, 80°13′10.54″ E; B: 41°20′19.51″ N, 80°13′12.97″ E; C: 41°20′12.06″ N, 80°12′52.76″ E; D: 41°20′0.36″ N, 80°13′1.74″ E; E: 41°19′53.48″ N, 80°13′3.24″ E; F: 41°19′44.42″ N, 80°13′1.96″ E; G: 41°19′38.16″ N, 80°12′59.91″ E; H: 41°19′34.57″ N, 80°12′59.12″ E; I: 41°19′31.74″ N, 80°12′58.29″ E). The area of each orchard was between 1 and 2 ha. The main cultivar was Xinwen ‘185‘, and the pollination trees were Xinxin 2, both of which were in walnut orchards planted in 2002. The planting density of the walnut trees was 5 m × 6 m. The distribution of the plots is shown in Figure 1. The yields of plots A, B, and C were in the range of 2250–2700 kg ha−1 (low-yielding orchards); the yields of plots D, E, and F were in the range of 3000–3450 kg ha−1 (orchards with moderate yield); and the yields of plots G, H, and I were in the range of 4200–4500 kg ha−1 (high-yielding orchards). In each orchard, 20 walnut trees were selected for fixed-point sampling, and 180 walnut tree trunks were located using the same RTK system (Qianxun Spatial Intelligence Inc., Huzhou, China). In 2021, UAV multispectral image data and walnut canopy leaf samples were collected during the fast-growth period (20 May), sclerotization period (25 June), and near-maturity period (27 August) of walnut fruit.

2.3. Data Acquisition

2.3.1. Collection of Walnut Canopy Leaf Samples and Determination of the Nitrogen Concentration

A total of 180 marked walnut trees were used as individual samples for the canopy leaf samples. The healthy middle leaves of the current year branches in the upper part of the canopy of the sample plants were collected according to the four directions of south, east, north, and west, and 10 leaves were collected in each direction, respectively. The 40 leaves collected from a single plant were mixed into one sample. A total of 180 canopy leaf samples were obtained for each fruit development period. Walnut canopy leaves were collected synchronously on the day when the UAV acquired multispectral images (see Table 1 for details). The samples were labeled, put into a preservation box, and quickly transported to the laboratory. After decontamination and cleaning, the fresh leaf samples were first put into a constant temperature blower oven at 105 °C to kill the enzymes for 30 min. Then, the temperature was reduced to 80 °C to dry the samples to a constant weight. The dried leaf samples were crushed and passed through a 60-mesh sieve to ensure the uniformity of the samples. The nitrogen concentration was determined using the Kjeldahl method, and three replicates were set for each sample. The average value was used as the nitrogen concentration of a single canopy.

2.3.2. UAV Multispectral Data Acquisition

We used DJI’s (Shenzhen, China) Phantom 4 multispectral UAV for image acquisition. The UAV uses an RTK centimeter-level positioning system that integrates six cameras and contains five single bands (R, G, B, NIR, RedEdge) and a visible-light panchromatic band, and each camera has 2 million effective pixels. In this study, two DJI’s Phantom 4 UAVs were used to collect walnut canopy spectral information simultaneously. UAV No. 1 collected plots A, B, C, and D, respectively, and the flight time for collecting walnut canopy spectral information on a single day was about 50 min. When UAV No. 2 collected spectral information, it collected plots E and F at the same time, and plots G, H, and I at the same time, and the flight time was about 35 min. The total flight time for a single day is within 60 min due to the simultaneous data collection by 2 drones. The flight height of the UAV is 70 m, and the corresponding ground sample distance (GSD) is 0.04 m × 0.04 m. The gimbal pitch angle is −90°, and the heading overlap rate and collateral overlap rate are both 80%. UAVs use global shutters when collecting spectral information. The flight speed is 10 m/s. To calibrate the reflectance, the whiteboard was photographed at the beginning and end of each flight., and the RTK system was used to mark 9 ground control points for geometric correction. The original images collected by the UAV were spliced band-by-band using Pix4 Dmapper software (version 4.5). The stitched images were whiteboard-corrected using pre-set whiteboard images and then geometrically corrected using ground control points, thus ensuring the chromatographic accuracy and geographic precision of the stitched images. In this study, the original multispectral image data collected by a single daily flight to 9 study plots had a digitized footprint of 35.3 Gb, excluding vegetation index calculation. A total of 105.9 G multispectral image data were collected in three experiments in 2021.

2.4. Processing of UAV Remote Sensing Images

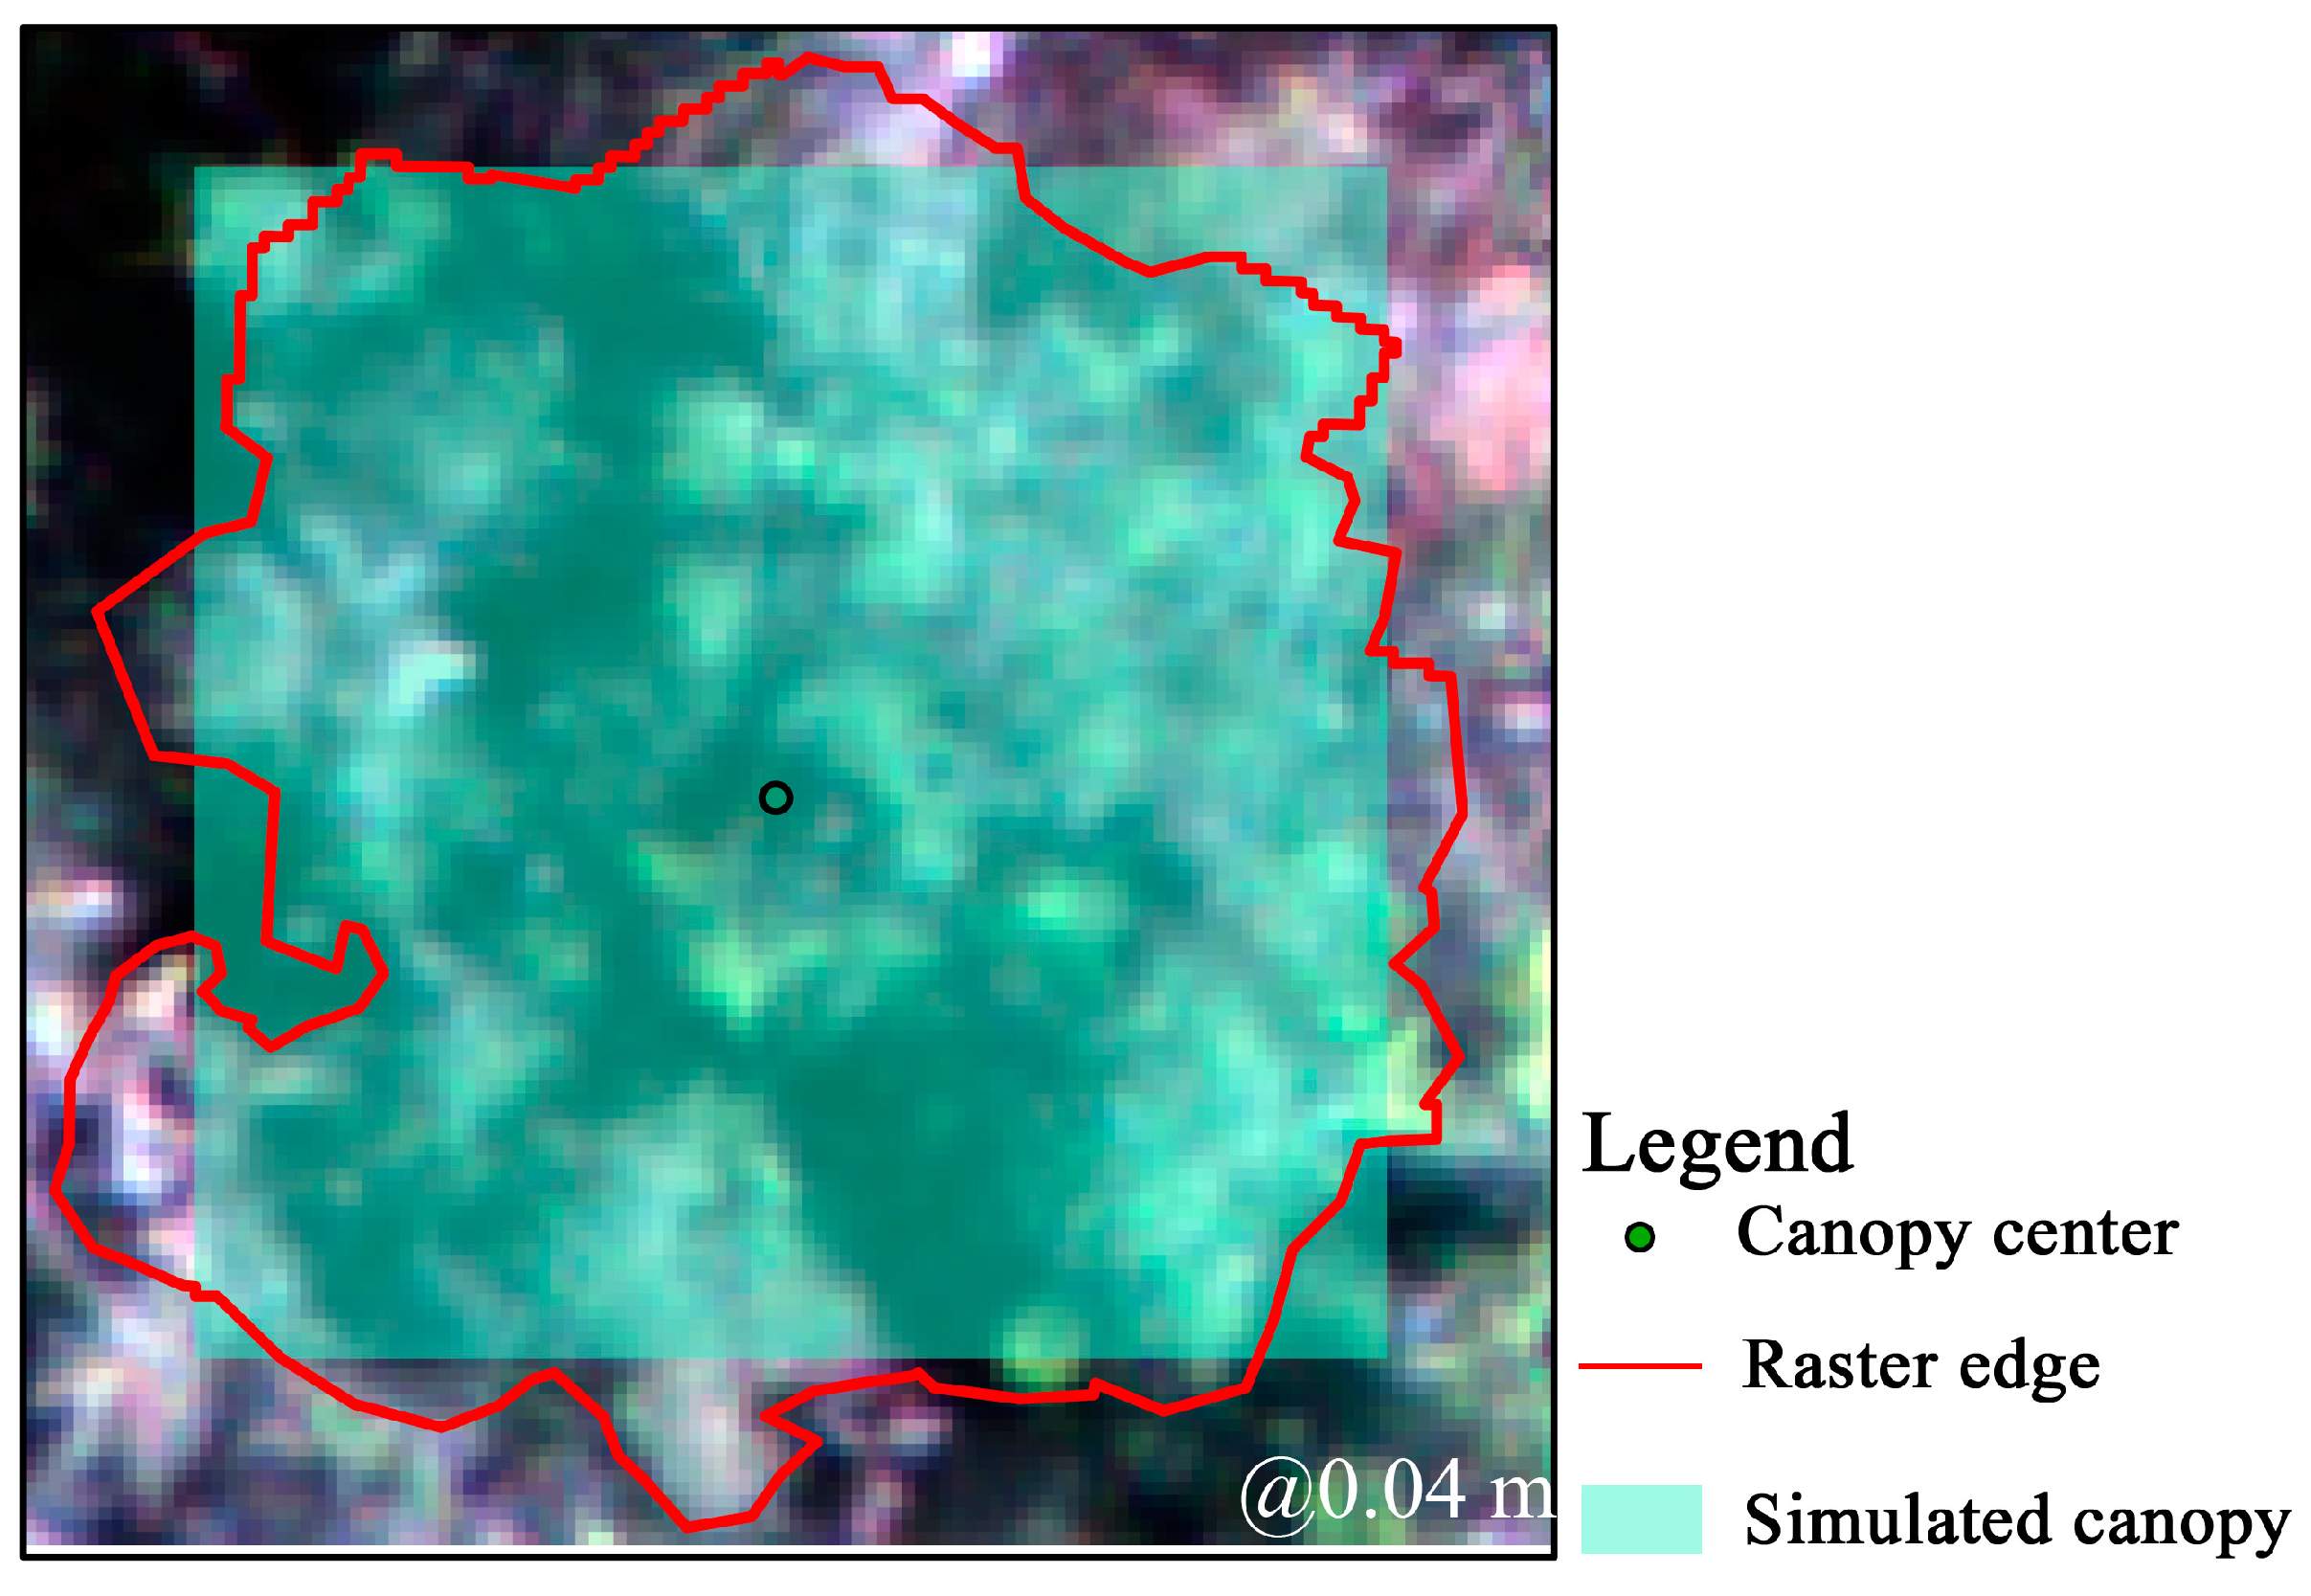
2.4.1. Manual Confirmation of the Canopy Boundaries of the Walnut Trees

The walnut trees at the test site were all planted in 2002, with large canopies and relatively stable changes in canopy size during the observation period. Because the size of the trunk coordinates pixel of a sampled individual plant in the original resolution image was 0.04 m × 0.04 m, the spectral information of the pixel could not represent the spectral information of the entire walnut individual plant canopy. In this study, the region of interest (ROI) was established by manually confirming the canopy boundary of 180 walnut plants in the remote sensing images of the fruit sclerotization period. The canopy spectral information of three fruit development periods was extracted by manually confirming the ROI. The 12 first-order texture data (count, sum, mean, median, standard deviation, maximum, minimum, range, oligarch, mode, variability, variance) of the original band and vegetation index of all pixels in the manually confirmed ROI were determined, and assigned to the ROI for sensitive factor screening and model establishment. The above work was carried out using the open-source software QGIS (version 3.14).

2.4.2. Simulated Canopy Method

Based on the average number of manually confirmed ROI image elements, a rectangle with a fixed edge length was specified in the original resolution image, and the center of the rectangle was taken as the image element of the main trunk coordinates of an individual sampled plant to simulate the canopy area of this plant for the extraction of the spectral information of the canopy of the walnut trees. We counted the number of image elements of 180 ROIs outlined in the original resolution image during the sclerotization period and obtained the average number of image elements of the walnut canopy as 8980. The spectral information within the ROI of the simulated canopy was extracted by taking the image elements of the sampled single trunk coordinates as the center of the rectangle, and the 12 first-order texture data of the original bands and vegetation indices of all image elements within the rectangle were determined and assigned to the rectangle of the simulated canopy for sensitive factor screening and model building. The above work was performed in the open-source software QGIS (version 3.14).

2.5. Sensitive Factor Screening

In the original resolution image, the band information was extracted from the pixels of the manually confirmed ROI, and the simulated canopy ROI and 10 vegetation-related indices were calculated, as shown in Table 2. The 12 first-order texture statistical values of the original bands and vegetation indices were analyzed by correlating them with the nitrogen concentration of the walnut canopies, and the indicators with highly significant correlations (p ≤ 0.001) were selected as input factors for model building after collinearity was removed.

2.6. Modeling Method and Model Evaluation Index

The collected canopy nitrogen concentration data were sorted from lowest to highest, and 180 samples from each fruit development period were divided into 120 modeling samples and 60 testing samples using the equally spaced sampling method. The modeling samples were used for model training and establishment, and the test samples were used to evaluate the accuracy of the established model.
Three methods, partial least squares regression (PLSR), support vector machine (SVM), and random forest (RF), were selected for model building. PLSR [48] is a classical linear regression method. In a large number of studies, the PLSR method is mostly used as a ‘baseline’ method. While constructing the model, this method fully accounts for the collinearity between spectral information sources and can explain the spectral signal well. In addition, it has relatively stable modeling and testing accuracy. SVM is a traditional machine learning algorithm based on statistical learning theory, with good generalization ability and the property of handling high-dimensional data, often showing its unique advantages in nonlinear problems [49]. Random forest (RF) [50] refers to a classifier that uses multiple decision trees to train and predict samples and can be used for regression or classification problems. This technology has been proven to be robust to relevant predictors (e.g., spectral bands or different VIs) and can provide variable interaction detection, nonlinear relationship detection, missing value processing, and local effect modeling.
The evaluation indices of the model include coefficients of determination (R2), root-mean-squared error (RMSE), and relative analysis error (RPD) to verify the accuracy of the model. R2 indicates the degree of fit between the predicted value and the measured value; the larger the value of R2, the better the model prediction result. RMSE indicates the degree of deviation between the measured value and the predicted value of the sample; the smaller the value of RMSE, the closer the predicted value is to the measured value. RPD is the ratio of the standard deviation to the root-mean-squared error, which indicates the prediction ability of the model. When RPD ≤ 1.0, the model has no prediction ability; when 1.0 < RPD ≤ 1.4, the model can distinguish between high and low values; when 1.4 < RPD ≤ 2.0, the model has the general predictive ability; when RPD > 2.0, the model has the good predictive ability for the study object [51].
R 2 = i = 1 n y ^ i y ¯ i 2 i = 1 n y i y ¯ i 2
R M S E = i = 1 n y ^ i y i 2 n
R P D = S D y i R M S E
where  y ^  is the predicted value;  y ¯  is the average of the measured values;  y i  is the measured values, and  n  is the number of samples.

3. Results

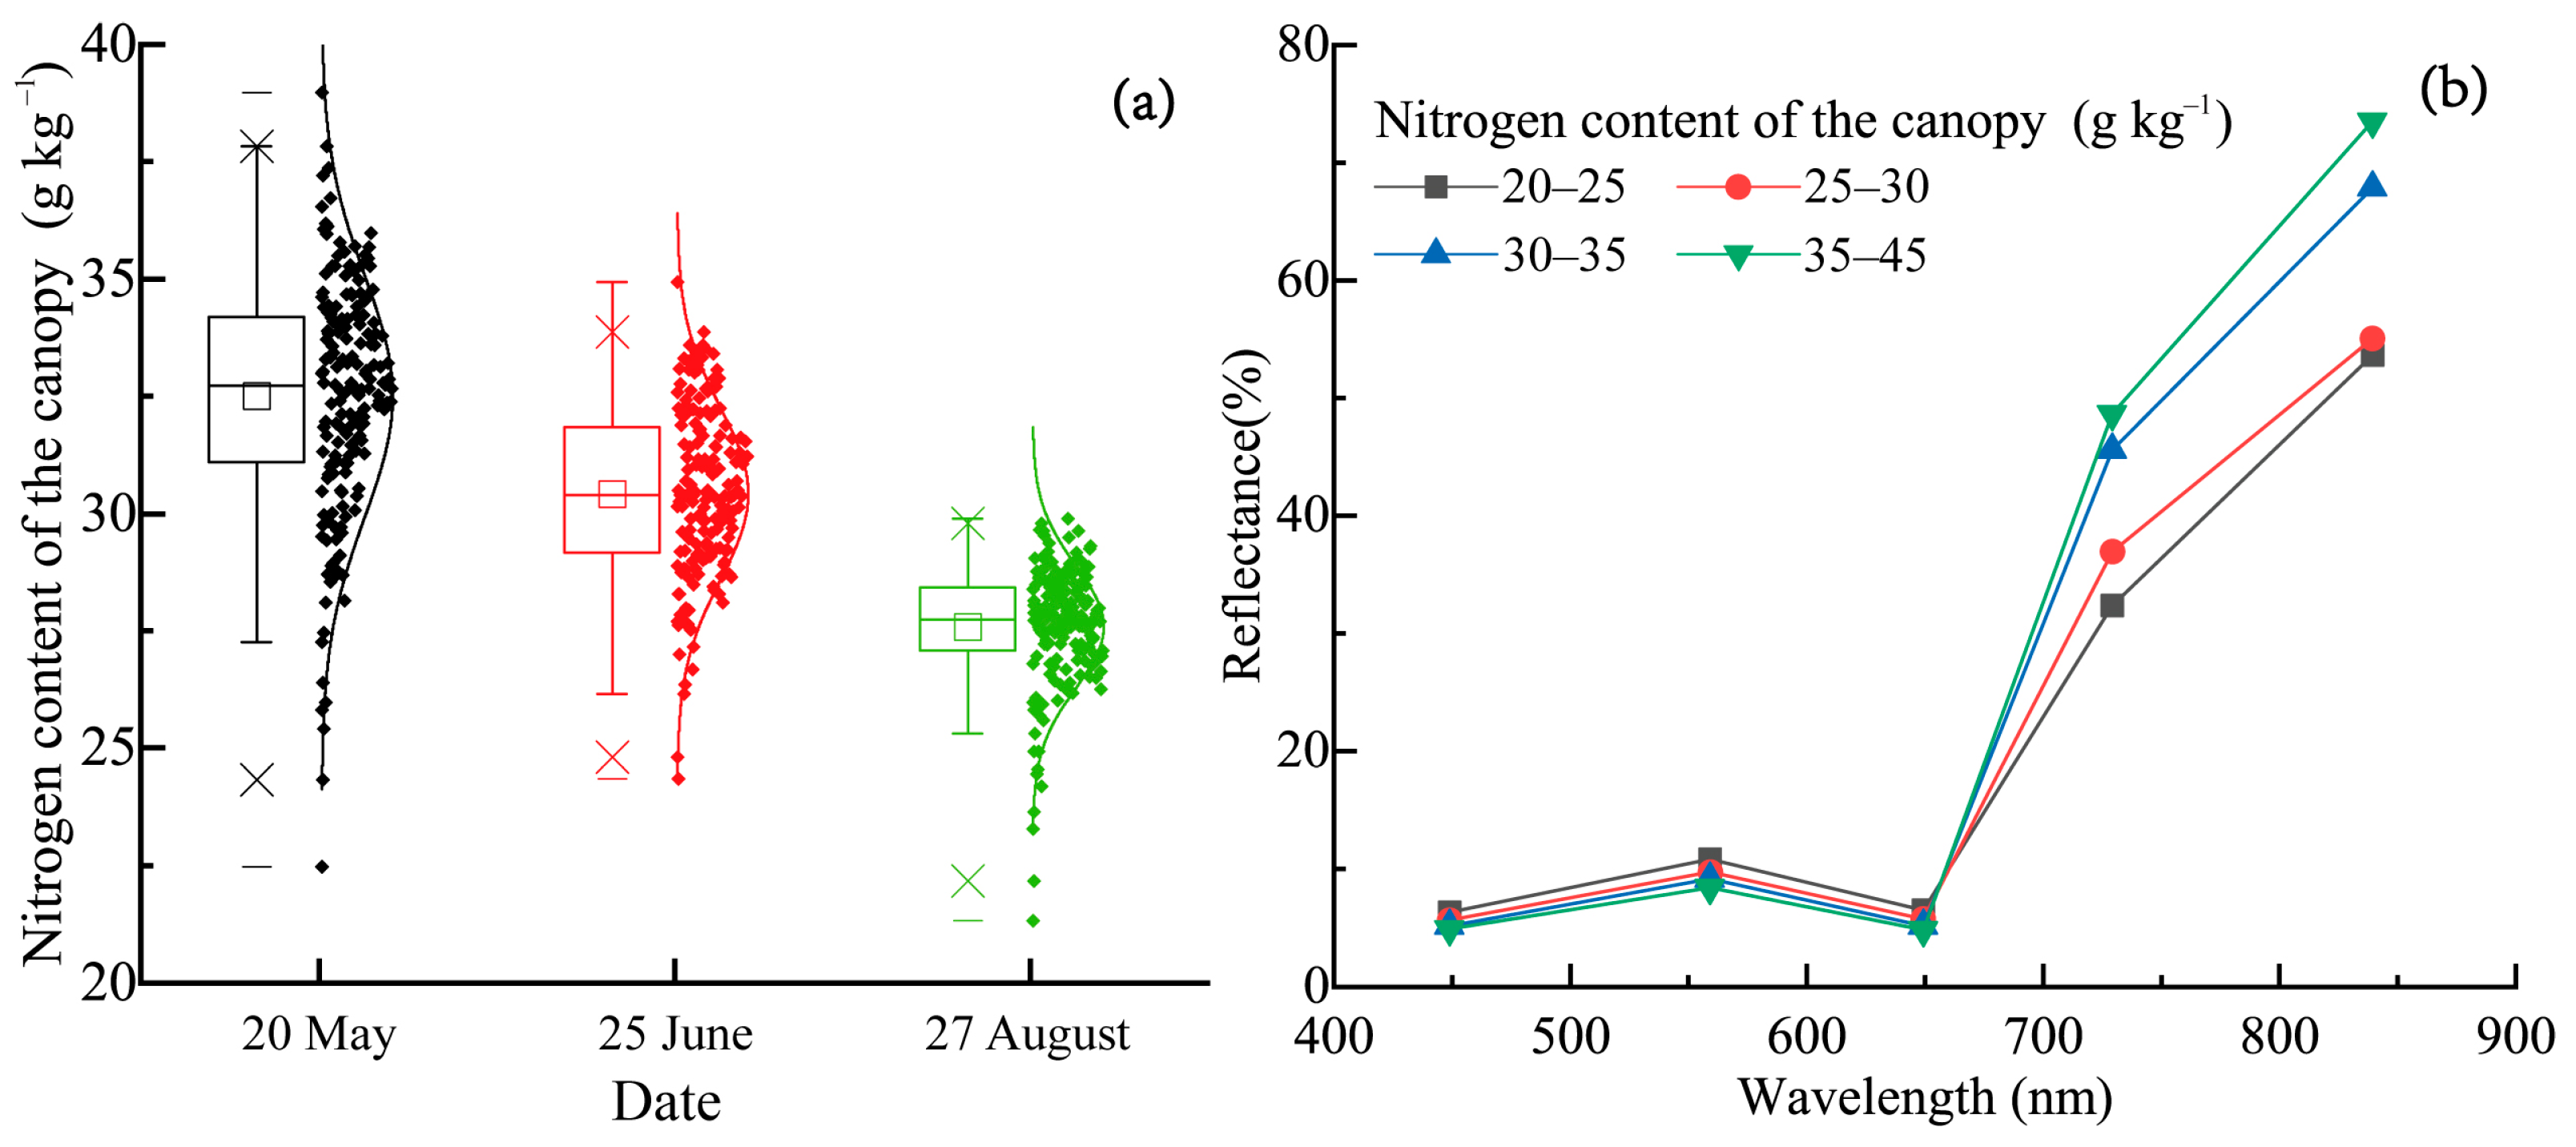
3.1. Variation in the Nitrogen Concentration of the Walnut Canopy and the Analysis of Spectral Characteristics

The variation in the canopy nitrogen concentration of walnut trees at different developmental periods is shown in Table 3. During the observation period, the maximum value of the canopy nitrogen, 38.98 g kg−1, appeared in the rapid growth period of the walnut fruit; the minimum value, 21.33 g kg−1, appeared in the near-mature period. As shown in Figure 2a, it can be seen that the canopy reflectance of different N concentrations has strong absorption in the visible band, and the blue and red light bands have lower reflectance compared to the green light band. In Figure 2b, it can be seen that different canopy nitrogen concentrations had strong absorption in the visible band, and the blue and red light bands had lower reflectance compared to the green light band. There was a significant increase in spectral reflectance from the red band to the NIR band as the wavelength increased. The difference in the reflectance of the canopy with different nitrogen concentrations was greater in the NIR band than in the visible band. In the visible band, the difference in canopy reflectance for different nitrogen concentrations was not obvious, and relatively speaking, the difference was greater in the green band than in the blue and red bands. In the NIR band, the difference in the canopy reflectance of the different nitrogen concentrations was greater than in the red-edge band.

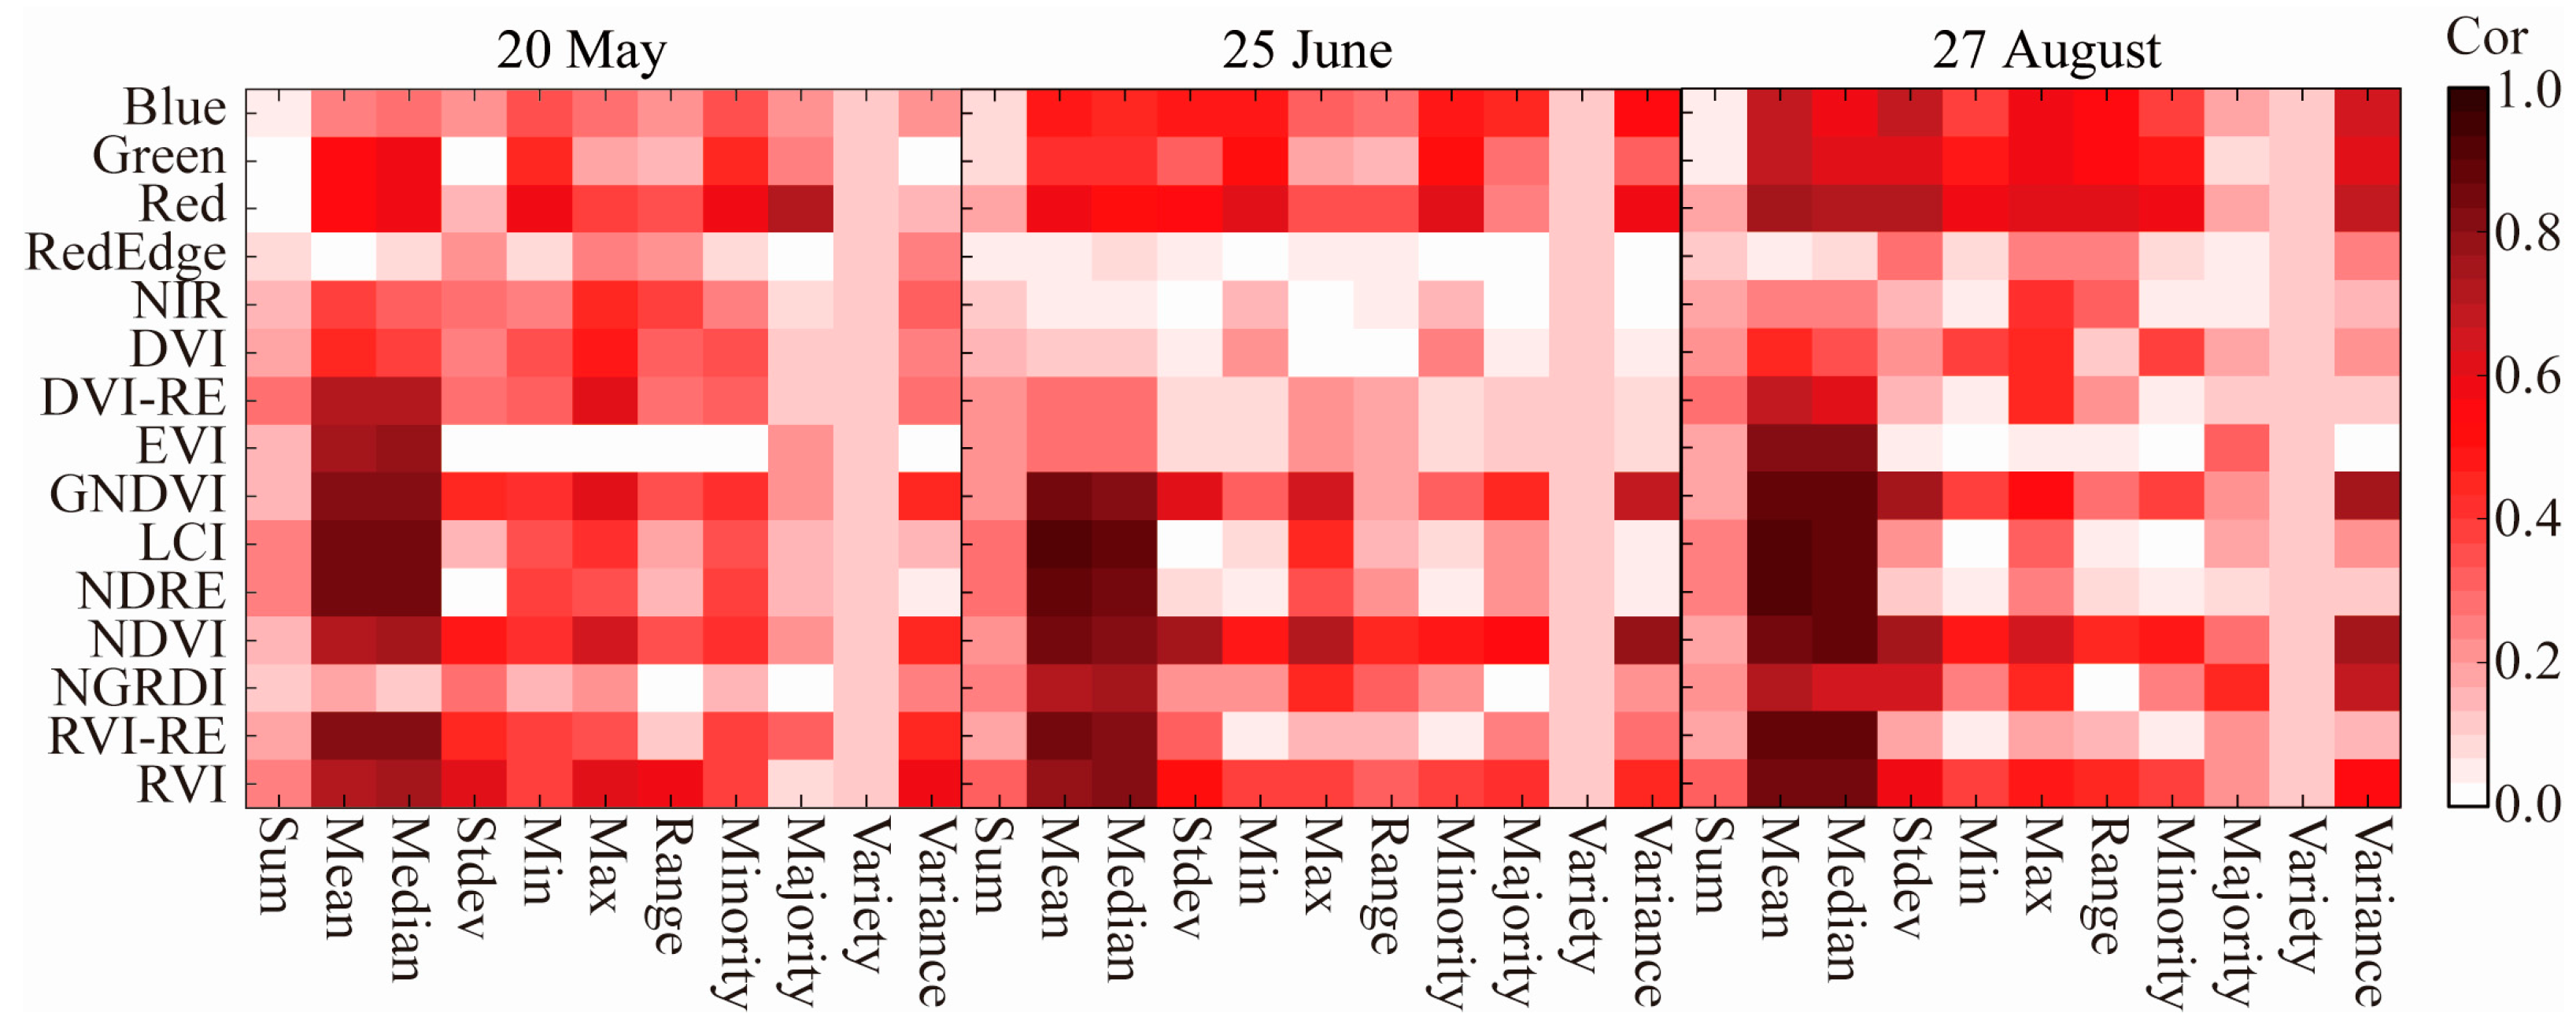
3.2. Screening of Nitrogen Sensitive Factors in Walnut Tree Canopies

3.2.1. Correlation Analysis of Manually Confirmed ROI-Extracted Spectral Information with the Nitrogen Concentration of the Walnut Canopy

In the original resolution images, the original bands within the manually confirmed ROI during the observation period were extracted, and ten vegetation indices were calculated. The twelve texture statistics of the original bands and vegetation indices were determined and correlated with the canopy nitrogen for analysis, and the results are shown in Figure 3. The indicators that were highly significantly correlated (p ≤ 0.001) with the walnut canopy nitrogen concentration in the original band texture statistics and vegetation index texture statistics were removed from the collinearity and used as input parameters for the nitrogen inversion model corresponding to the walnut fruit development period. The seven texture statistics of the original band and the mean and median values of GNDVI, LCI, NDRE, and RVI-RE were selected as input factors for the model during the fast-growing period. The eight texture statistics of the original band and the mean and median values of GNDVI, LCI, NDRE, NDVI, and RVI-RE were selected as input factors for the model during the sclerotization period. The nineteen texture statistics of the original band and the mean and median values of EVI, GNDVI, LCI, NDRE, NDVI, RVI-RE, and RVI were selected as input factors for the model during the near-maturity period.

3.2.2. Correlation Analysis between Simulated Canopy ROI Extraction Information and the Nitrogen Concentration of the Walnut Canopy

The spectral information was extracted within the simulated canopy ROI and correlated with the canopy nitrogen concentration of walnut trees at different fruit development periods, and the results are shown in Figure 4. The texture statistics of the vegetation index correlated better with the canopy nitrogen concentration of the walnut trees than the band texture statistics, and the mean and median of the texture statistics of the vegetation index for the three fruit development periods correlated better with the canopy nitrogen concentration of the walnut trees than the other texture statistics of the vegetation index. The original band texture statistics and vegetation index texture statistics were used as input parameters for the inverse model of the nitrogen concentration of the walnut tree canopy during the corresponding walnut fruit development period after the removal of the collinearity of the indicators that were highly significantly correlated with the canopy nitrogen concentration (p ≤ 0.001). During the fast-growing period of the fruit, seven statistical texture values from the band, as well as the mean and median GNDVI, LCI, NDRE, and RVI-RE, were selected as input parameters for the model. The seven factors from the band texture statistics, as well as the mean and median GNDVI, LCI, NDRE, and RVI-RE values, were selected as the input parameters of the model during the fruit sclerotization period. The nineteen factors of the original band texture statistics and the mean and median GNDVI, LCI, NDRE, NDVI, RVI-RE, and RVI were selected as input factors for the model during the near-maturity period.

3.3. Model Construction and Verification

3.3.1. Manual Confirmation of the Inverse Modeling of the Sensitive Factors of Spectral Information Extracted within the ROI and the Nitrogen Concentration of the Walnut Canopy

The 180 ROIs that were manually confirmed at the fruit sclerotization period were used to extract the canopy spectral information of individual plants sampled at three fruit development periods. The selected sensitive factors were used as model input parameters, and PLSR, SVM, and RF were used to establish the model with the canopy nitrogen concentration of the walnut trees at the corresponding fruit development period. The results are shown in Table 4. The inverse models of the nitrogen concentration of the canopy of the walnut trees developed by the three modeling approaches during the three critical developmental periods of the walnut fruit had some predictive ability. In the same fruit growth period, the screened original band texture statistics and vegetation index texture statistics were used as input parameters for building the three models; these were lower than the model prediction accuracy of both as input parameters, and the model prediction accuracy of the canopy nitrogen concentration of the walnut trees built by RF was better than that of SVM and PLSR. In the three development periods of the walnut fruit, the selected original band texture statistics and vegetation index texture statistics were used as input parameters at the same time. The canopy nitrogen inversion model for walnut trees using RF produced values of 0.85 for R2, 0.30 g kg−1 for RMSE, and 2.55 for RPD during the fast-growing period. R2 at the walnut fruit sclerotization period was 0.84, RMSE was 0.21 g kg−1, and RPD was 2.07. R2 at the near-maturity period was 0.92, RMSE was 0.30 g kg−1, and RPD was 3.22.

3.3.2. Establishment of an Inversion Model between the Sensitive Factors of Extracted Spectral Information in the Simulated Canopy ROI and the Nitrogen Concentration of the Walnut Canopy

The sensitive factors of the walnut canopy information extracted from the simulated canopy ROI at different development periods of the walnut fruit were used as input parameters for the input model. The model was established using PLSR, SVM, and RF with the nitrogen concentration of the walnut canopy at the corresponding fruit development period. The results are shown in Table 5. All three modeling approaches had the ability to predict the canopy nitrogen concentration of the walnut trees at different developmental periods of the walnut fruit. In the same modeling approach, the model prediction accuracy was better than that of the model built from a single information source due to the use of both the post-screening band texture statistics and the vegetation index texture statistics as model input parameters. The prediction accuracy of the model built using RF was better than that of PLSR and SVM due to the use of both post-screening band texture statistics and vegetation index texture statistics as model input parameters during the three periods of fruit development. For the inversion model of the nitrogen concentration of the canopy of the walnut trees developed using RF during the and 2.55 for RPD at the fast-growing period, the relevant values were R2 of 0.61, RMSE of 0.48 g kg−1, and RPD of 1.58. The R2, RMSE, and RPD values of the nitrogen concentration inversion model established using RF during the sclerotization period of the walnut fruit were 0.74, 0.27 g kg−1, and 1.93, respectively. The R2 of the inverse model of the nitrogen concentration of the canopy of walnut trees developed using RF at a near-maturity period was 0.84, RMSE was 0.43 g kg−1, and RPD was 2.20.

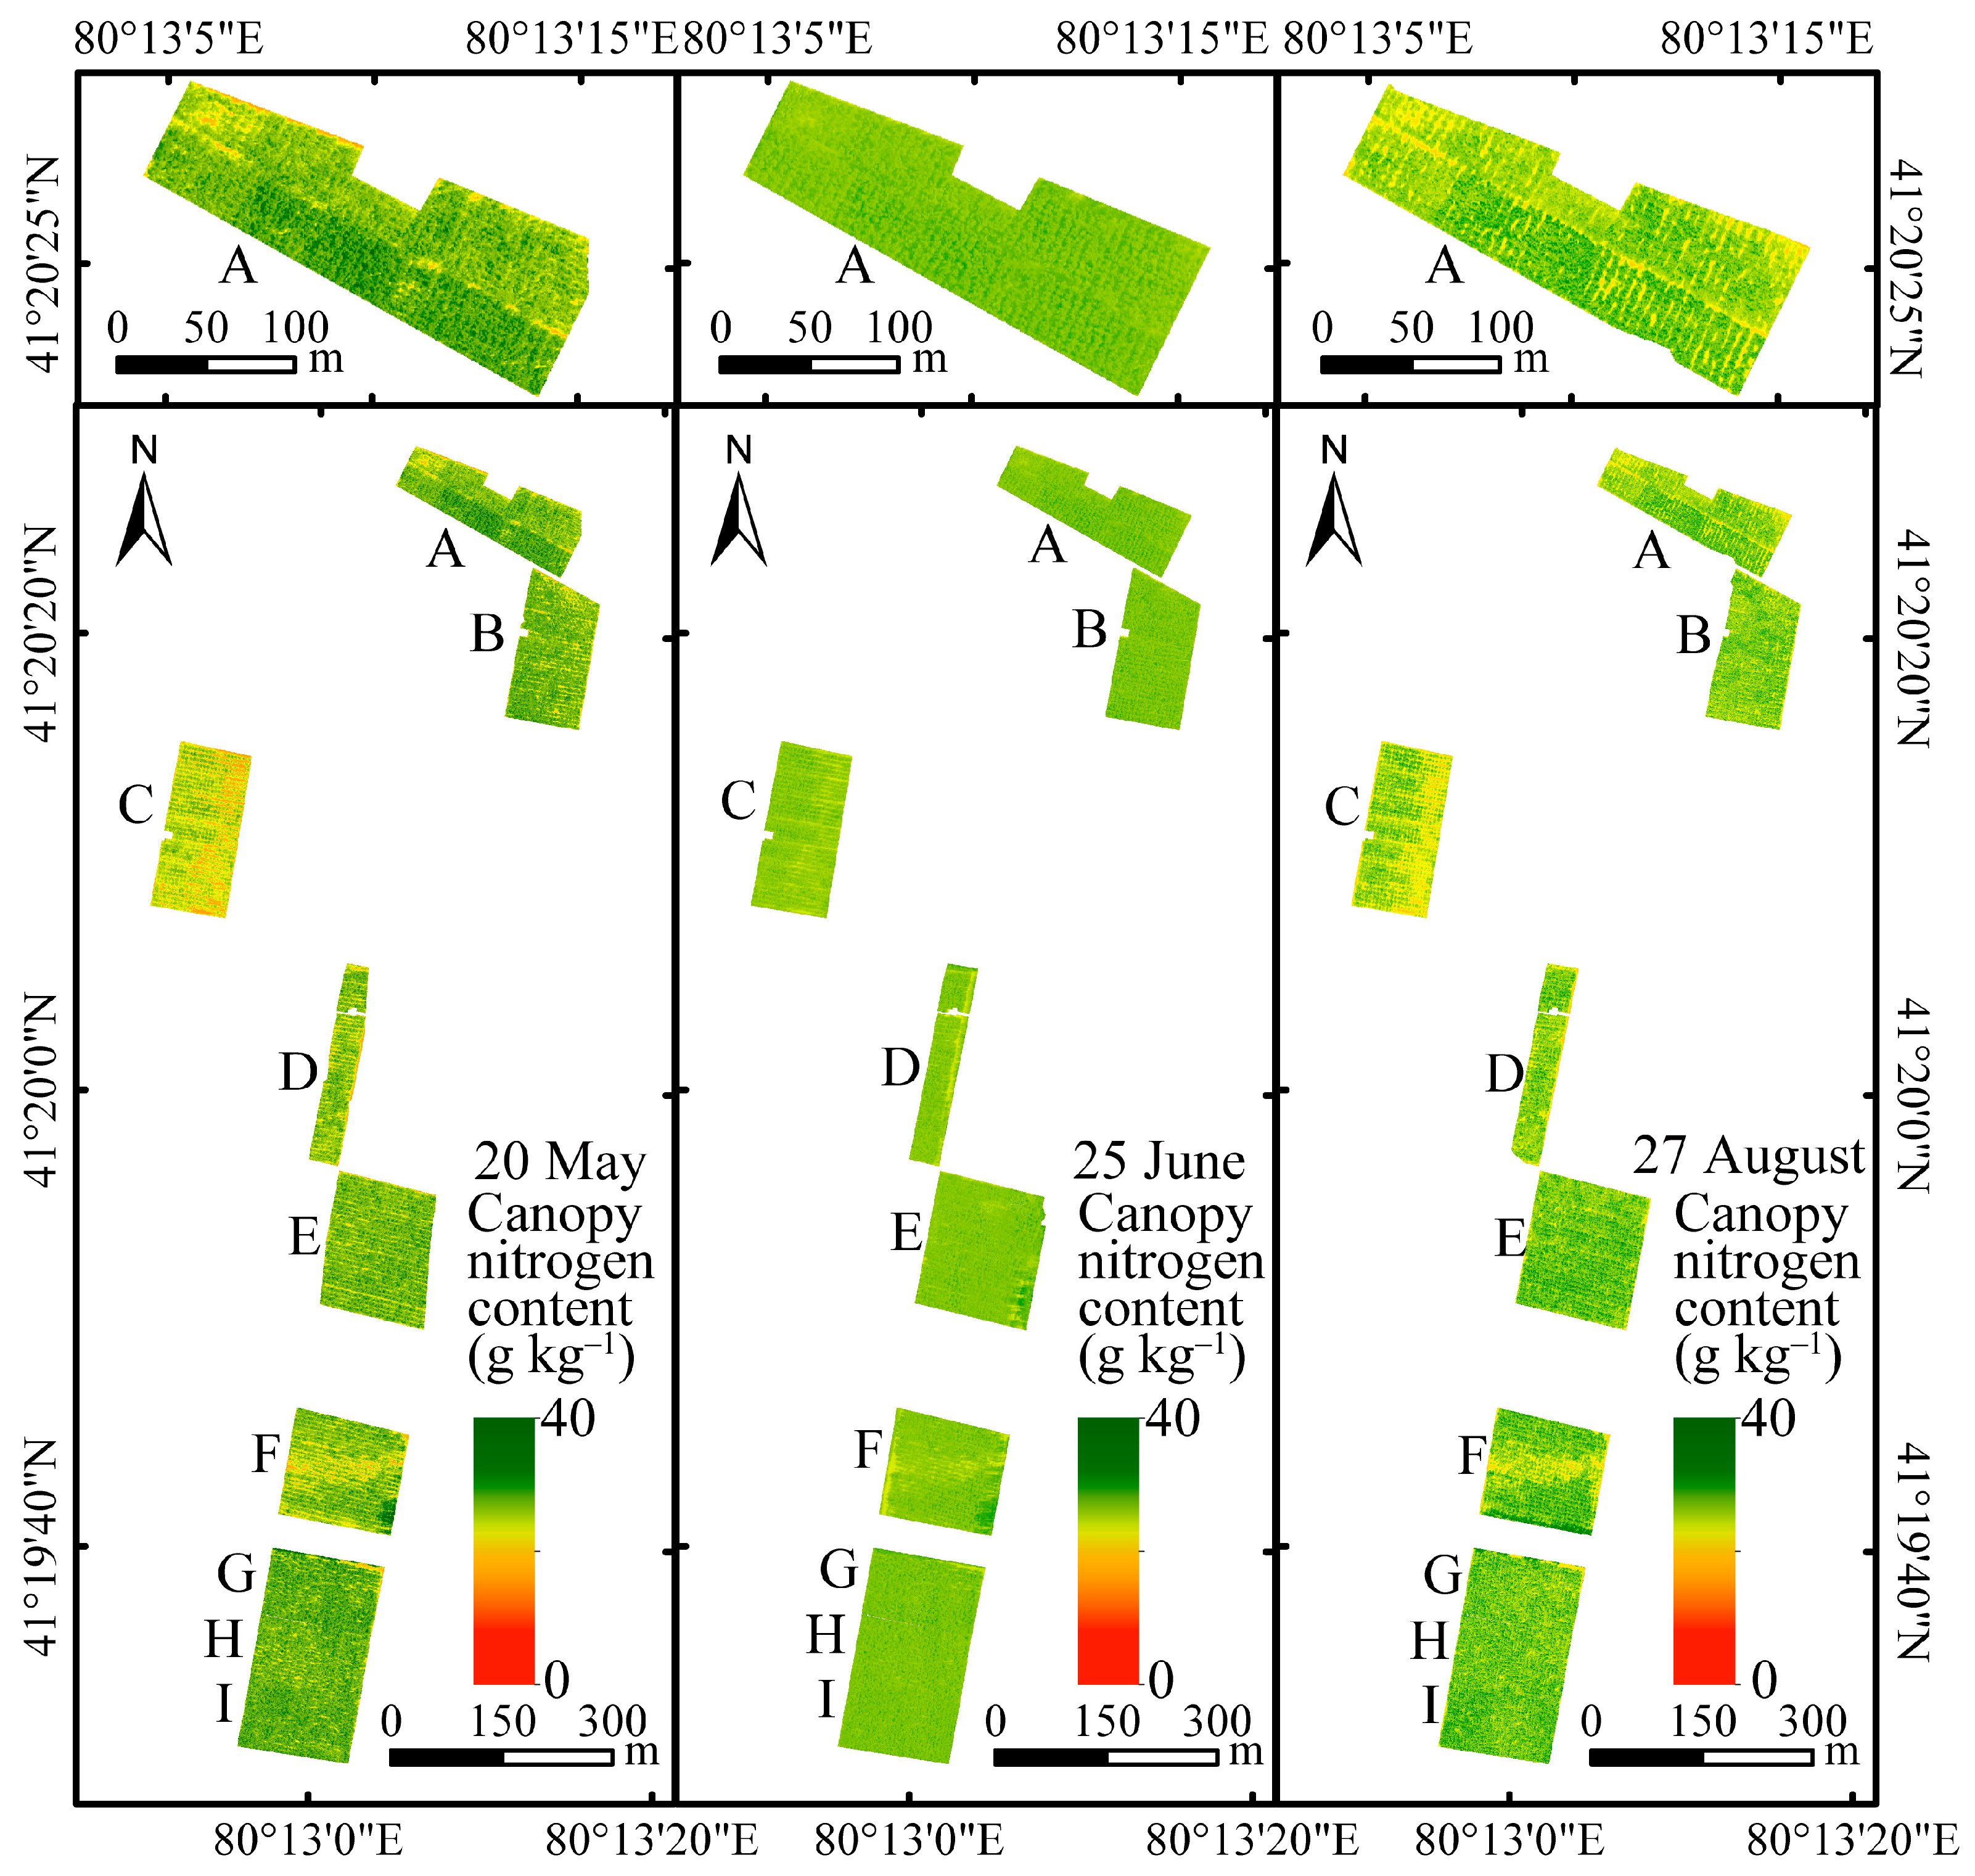
3.4. Characterization of Nitrogen Distribution in Walnut Tree Canopies Based on the Simulated Canopy Method

The prediction accuracy of the inverse model developed by manually confirming the spectral information extracted within the ROI with the nitrogen concentration of the walnut canopy was superior to that of the simulated canopy method. However, the manually confirmed canopy spectral information extracted using the ROI has the problem of mismatching with the spectral information of image elements of the original resolution image, and nitrogen spatial distribution mapping of the original resolution image cannot be performed. The sensitivity factor of the canopy spectral information extracted via the simulated canopy method was used as the model input parameter, and the established model had some predictive ability for the canopy nitrogen concentration of the walnut trees. It also overcame the difficulty of manually confirming the spectral information of a single plant extracted via the ROI in the original image that did not match the spectral information of image elements. In this study, a canopy spectral information sensitivity factor extracted from a simulated canopy ROI was used as a model input parameter to establish an RF prediction model for the spatial inversion of the canopy nitrogen distribution for three key developmental periods of walnut fruit at the test site. As shown in Figure 5, the nitrogen concentration varied among plots during the same fruit development period; uneven distribution of nitrogen in the walnut canopy was present in all individual plots, and all plots showed a trend of gradually decreasing nitrogen concentration as fruit development progressed. In the observation area, orchard A showed a higher nitrogen concentration in the walnut canopy in the middle of the plot than at the eastern and western ends, and at the individual walnut-tree scale, the plot showed a higher nitrogen concentration in the middle of the canopy than in the marginal parts. The canopy information of single walnut plants was extracted from the UAV multispectral images, and orchard canopy nitrogen distribution mapping was performed using the simulated canopy method, which can be used to monitor the canopy nitrogen distribution status of walnut trees in orchards.

4. Discussion

UAV remote sensing has the advantages of being mobile, flexible, and less affected by weather [25]. It is suitable for plot-scale canopy nitrogen monitoring studies [52], and real-time monitoring of plant growth is an effective way to optimize fertilizer supply [13]. Obtaining the canopy spectral information of fruit tree monocultures in UAV remote sensing imagery first requires determining the canopy extent, and confirming the canopy extent of fruit trees manually is a common method used to obtain canopy spectral information for nitrogen estimation [36,37]. However, manual confirmation of the fruit tree canopy not only involves a heavy workload, but also presents a challenge in identifying the canopy boundaries of fruit trees in orchards with large canopies and interlocking branches. We attempted to investigate how we could quickly determine an individual plant canopy and thus increase the efficiency in the nitrogen monitoring of fruit trees.
The prediction accuracy of the nitrogen model built using the simulated canopy method to extract single-plant canopy spectral information was lower than that of the nitrogen concentration prediction model built by manually confirming the single-plant canopy spectral information extracted via the canopy ROI. The analysis in Figure 6 shows that the spectral information of the target canopy was retained to the maximum extent in the canopy area obtained by manual confirmation. The simulated canopy method was based on the average number of image elements contained in the 180 manually confirmed ROIs. A rectangle with 94 × 94 image elements was defined in the original image, and the image element of the central stem coordinate point was used as the center of the rectangle to extract the spectral information of all image elements in the rectangle. Due to the inconsistent size of the actual walnut canopy crowns in the original images and the existence of interlocking branches between neighboring fruit trees, the extraction of the spectral information within the simulated canopy will be influenced by the information of non-target canopy image elements, resulting in a lower-accuracy canopy nitrogen concentration prediction model than that established by manually confirming the canopy to extract the spectral information of a single canopy. However, the prediction model established using the simulated canopy method to extract spectral information with canopy nitrogen in the original resolution images exhibited predictive ability for all three developmental periods of the walnut fruit and can be applied for the extraction of spectral information from the canopy of a single fruit tree.
Studies on nitrogen monitoring in fruit tree canopies using UAV remote sensing platforms [53] have rarely mapped the nitrogen distribution in orchards. Nitrogen inversion mapping of original resolution images could not be performed due to the difficulty in obtaining the coordinates of sampling sites in the fruit tree canopy and the spectral information of image elements at corresponding sampling sites. The use of satellite remote sensing platforms for mapping [54,55] is mostly based on the extraction of target-point location image-element information for model building and generating distribution maps for the same resolution images. The canopy nitrogen distribution map of the walnut tree canopy was produced for the original resolution image using the simulated canopy method, in which each image element in the original image was used as the center of a rectangle with a specified side length, and the calculated nitrogen values within the rectangle were assigned to the center image element, resulting in the canopy nitrogen distribution map of the walnut trees. The nitrogen distribution map of the test site also assigned a nitrogen concentration to the image elements on the bare ground near the canopy. Due to the large canopy scale of walnut monocultures, the nitrogen information was negligible for the image elements in the non-canopy area at the edge of the canopy. The simulated canopy method results in a greater reduction in labor in terms of extracting the canopy information of single fruit trees compared to outlining the canopy, and it overcomes the difficulty of spatial scale inequality. It can also be applied to map the canopy nitrogen distribution in orchards with original-resolution images. The simulated canopy method used to extract the canopy spectral information of single fruit trees can be extended to monitor the canopy nitrogen status of other perennial fruit trees using UAV remote sensing.

5. Conclusions

In this study, the nitrogen concentration of a walnut canopy was monitored for the first time using UAV multispectral images. The simulated canopy method can effectively extract the canopy spectral information of walnut trees for walnut tree canopy nitrogen inversion while preserving the high resolution of UAV images. The accuracy of the developed canopy nitrogen prediction model was better than that of the prediction model developed via a single information source due to the use of both the original band texture statistics and vegetation index texture statistics as model input parameters at different fruit development periods. With the use of the spectral information of the walnut tree canopy extracted via the simulated canopy method and the screened sensitive factors as model input parameters, the prediction accuracy of the inverse model of the walnut tree canopy nitrogen concentration using RF at three critical fruit developmental periods was better than that of SVM and PLSR. Single plant canopy information extracted using the simulated canopy method can be used for walnut canopy nitrogen monitoring and orchard canopy nitrogen spatial distribution mapping.

Author Contributions

Conceptualization, Z.Z., C.F. and B.L.; methodology, Y.M., X.C., C.F. and Y.W.; data acquisition and curation, Y.W., Y.M., X.C. and Y.S.; writing—original draft, Y.W.; writing—review and editing, Y.W., Z.Z., C.F. and R.Z. funding acquisition, Z.Z., R.Z., B.L. and Y.W. All authors have read and agreed to the published version of the manuscript.

Funding

This study was supported by the National Key Research and Development Program of China (No. 2020YFD1000703), the Tarim University President’s Fund (No. TDZKCX202101), the Open Project of National and Local Joint Engineering Laboratory for Efficient and High-Quality Cultivation and Deep Processing Technology of Characteristic Fruit Trees in Southern Xinjiang (No. FE202002), the Tarim University Graduate Research Innovation Program (No. TDBSCX202104).

Data Availability Statement

No reported data.

Conflicts of Interest

The authors declare that the research was conducted in the absence of any commercial or financial relationships that could be construed as a potential conflict of interest.

References

  1. Zhang, R.; Zhu, A.; Wang, X.; Yu, J.; Zhang, H.; Gao, J.; Cheng, Y.; Deng, X. Development of Juglans regia SSR markers by data mining of the EST database. Plant Mol. Biol. Rep. 2010, 28, 646–653. [Google Scholar] [CrossRef]
  2. Shah, U.N.; Mir, J.I.; Ahmed, N.; Zaid, A.; Jan, S.; Fazili, K.M.; Wani, S.H. Bio-techniques for improvement of qualitative and quantitative traits in walnut (Juglans regia). Adv. Hortic. Sci. 2018, 32, 113–136. [Google Scholar]
  3. Wambulwa, M.C.; Fan, P.Z.; Milne, R.; Wu, Z.Y.; Luo, Y.H.; Wang, Y.H.; Liu, J. Genetic analysis of walnut cultivars from southwest China: Implications for germplasm improvement. Plant Divers 2022, 44, 530–541. [Google Scholar] [CrossRef] [PubMed]
  4. Zhang, Y.G.; Kan, H.; Chen, S.X.; Thakur, K.; Wang, S.; Zhang, J.G.; Shang, Y.F.; Wei, Z.J. Comparison of phenolic compounds extracted from Diaphragma juglandis fructus, walnut pellicle, and flowers of Juglans regia using methanol, ultrasonic wave, and enzyme assisted-extraction. Food Chem. 2020, 321, 126672. [Google Scholar] [CrossRef] [PubMed]
  5. Reich, P.B. Key canopy traits drive forest productivity. Proc. Royal Soc. B 2012, 279, 2128–2134. [Google Scholar] [CrossRef] [Green Version]
  6. Kergoat, L.; Lafont, S.; Arneth, A.; Le Dantec, V.; Saugier, B. Nitrogen controls plant canopy light-use efficiency in temperate and boreal ecosystems. J. Geophys. Res. Biogeosci. 2008, 113, 04017. [Google Scholar] [CrossRef] [Green Version]
  7. Novoa, R.; Loomis, R.S. Nitrogen and plant production. Plant Soil. 1981, 58, 177–204. [Google Scholar] [CrossRef]
  8. Li, W.; Zhu, X.; Yu, X.; Li, M.; Tang, X.; Zhang, J.; Xue, Y.; Zhang, C.; Jiang, Y. Inversion of Nitrogen Concentration in Apple Canopy Based on UAV Hyperspectral Images. Sensors 2022, 22, 3503. [Google Scholar] [CrossRef]
  9. Simorte, V.; Bertoni, G.; Dupraz, C.; Masson, P. Assessment of nitrogen nutrition of walnut trees using foliar analysis and chlorophyll measurements. J. Plant Nutr. 2001, 24, 1645–1660. [Google Scholar] [CrossRef]
  10. Yan, S.; Rui, Z.; Shan, G.; Pan, Z.; Lei, Z. Transcriptome Analysis of Walnut Seedling Roots Under Nitrogen Starvation and Excess Nitrogen Stress. Sci. Rep. 2022, 12, 12066. [Google Scholar]
  11. Verardo, V.; Riciputi, Y.; Sorrenti, G.; Ornaghi, P.; Marangoni, B.; Caboni, M.F. Effect of nitrogen fertilisation rates on the content of fatty acids, sterols, tocopherols and phenolic compounds, and on the oxidative stability of walnuts. LWT 2013, 50, 732–738. [Google Scholar] [CrossRef]
  12. Gunes, A.; Alpaslan, M.; Inal, A. Critical nutrient concentrations and antagonistic and synergistic relationships among the nutrients of NFT-grown young tomato plants. J. Plant Nutr. 1998, 21, 2035–2047. [Google Scholar] [CrossRef]
  13. Fitzgerald, G.; Rodriguez, D.; O’Leary, G. Measuring and predicting canopy nitrogen nutrition in wheat using a spectral index—The canopy chlorophyll content index (CCCI). Field Crops Res. 2010, 116, 318–324. [Google Scholar] [CrossRef]
  14. Khanal, S.; Kc, K.; Fulton, J.P.; Shearer, S.; Ozkan, E. Remote sensing in agriculture—Accomplishments, limitations, and opportunities. Remote Sens. 2020, 12, 3783. [Google Scholar] [CrossRef]
  15. van Maarschalkerweerd, M.; Husted, S. Recent developments in fast spectroscopy for plant mineral analysis. Front. Plant Sci. 2015, 6, 169. [Google Scholar] [CrossRef] [PubMed] [Green Version]
  16. Zhang, L.; Zhou, Z.; Zhang, G.; Meng, Y.; Chen, B.; Wang, Y. Monitoring the leaf water content and specific leaf weight of cotton (Gossypium hirsutum L.) in saline soil using leaf spectral reflectance. Eur. J. Agron. 2012, 41, 103–117. [Google Scholar] [CrossRef]
  17. Guo, P.T.; Li, M.F.; Luo, W.; Cha, Z.Z. Estimation of foliar nitrogen of rubber trees using hyperspectral reflectance with feature bands. Infrared Phys Technol. 2019, 102, 103021. [Google Scholar] [CrossRef]
  18. Perry, E.M.; Goodwin, I.; Cornwall, D. Remote sensing using canopy and leaf reflectance for estimating nitrogen status in red-blush pears. HortScience 2018, 53, 78–83. [Google Scholar] [CrossRef] [Green Version]
  19. Eitel, J.U.H.; Long, D.S.; Gessler, P.E.; Smith, A.M.S. Using in-situ measurements to evaluate the new RapidEye™ satellite series for prediction of wheat nitrogen status. Int. J. Remote Sens. 2007, 28, 4183–4190. [Google Scholar] [CrossRef]
  20. Huang, S.; Miao, Y.; Yuan, F.; Gnyp, M.L.; Yao, Y.; Cao, Q.; Bareth, G. Potential of RapidEye and WorldView-2 satellite data for improving rice nitrogen status monitoring at different growth stages. Remote Sens. 2017, 9, 227. [Google Scholar] [CrossRef] [Green Version]
  21. Fabbri, C.; Mancini, M.; dalla Marta, A.; Orlandini, S.; Napoli, M. Integrating satellite data with a Nitrogen Nutrition Curve for precision top-dress fertilization of durum wheat. Eur. J. Agron. 2020, 120, 126148. [Google Scholar] [CrossRef]
  22. Yu, R.; Zhu, X.; Bai, X.; Tian, Z.; Jiang, Y.; Yang, G. Inversion reflectance by apple tree canopy ground and unmanned aerial vehicle integrated remote sensing data. J. Plant Res. 2021, 134, 729–736. [Google Scholar] [CrossRef]
  23. Cao, C.; Wang, T.; Gao, M.; Li, Y.; Li, D.; Zhang, H. Hyperspectral inversion of nitrogen content in maize leaves based on different dimensionality reduction algorithms. Comput. Electron. Agric. 2021, 190, 106461. [Google Scholar] [CrossRef]
  24. Yao, X.; Ren, H.; Cao, Z.; Tian, Y.; Cao, W.; Zhu, Y.; Cheng, T. Detecting leaf nitrogen content in wheat with canopy hyperspectrum under different soil backgrounds. Int. J. Appl. Earth Obs. Geoinf. 2014, 32, 114–124. [Google Scholar] [CrossRef]
  25. Zhang, H.; Wang, L.; Tian, T.; Yin, J. A review of unmanned aerial vehicle low-altitude remote sensing (UAV-LARS) use in agricultural monitoring in China. Remote Sens. 2021, 13, 1221. [Google Scholar] [CrossRef]
  26. Fu, Z.; Yu, S.; Zhang, J.; Xi, H.; Gao, Y.; Lu, R.; Zheng, H.; Zhu, Y.; Cao, W.; Liu, X. Combining UAV multispectral imagery and ecological factors to estimate leaf nitrogen and grain protein content of wheat. Eur. J. Agron. 2022, 132, 126405. [Google Scholar] [CrossRef]
  27. Jiang, J.; Atkinson, P.M.; Zhang, J.; Lu, R.; Zhou, Y.; Cao, Q.; Tian, Y.; Zhu, Y.; Cao, W.; Liu, X. Combining fixed-wing UAV multispectral imagery and machine learning to diagnose winter wheat nitrogen status at the farm scale. Eur. J. Agron. 2022, 138, 126537. [Google Scholar] [CrossRef]
  28. Xu, W.; Chen, P.; Zhan, Y.; Chen, S.; Zhang, L.; Lan, Y. Cotton yield estimation model based on machine learning using time series UAV remote sensing data. Int. J. Appl. Earth Obs Geoinf. 2021, 104, 102511. [Google Scholar] [CrossRef]
  29. Feng, A.; Zhou, J.; Vories, E.D.; Sudduth, K.A.; Zhang, M. Yield estimation in cotton using UAV-based multi-sensor imagery. Biosyst. Eng. 2020, 193, 101–114. [Google Scholar] [CrossRef]
  30. da Silva, E.E.; Baio FH, R.; Teodoro LP, R.; da Silva Junior, C.A.; Borges, R.S.; Teodoro, P.E. UAV-multispectral and vegetation indices in soybean grain yield prediction based on in situ observation. Remote Sens. Appl. Soc. Environ. 2020, 18, 100318. [Google Scholar] [CrossRef]
  31. Shendryk, Y.; Sofonia, J.; Garrard, R.; Rist, Y.; Skocaj, D.; Thorburn, P. Fine-scale prediction of biomass and leaf nitrogen content in sugarcane using UAV LiDAR and multispectral imaging. Int. J. Appl. Earth Obs. Geoinf. 2020, 92, 102177. [Google Scholar] [CrossRef]
  32. Alckmin, G.T.; Lucieer, A.; Rawnsley, R.; Kooistra, L. Perennial ryegrass biomass retrieval through multispectral UAV data. Comput. Electron. Agric. 2022, 193, 106574. [Google Scholar] [CrossRef]
  33. Shao, G.; Han, W.; Zhang, H.; Wang, Y.; Zhang, L.; Niu, Y.; Zhang, Y.; Cao, P. Estimation of transpiration coefficient and aboveground biomass in maize using time-series UAV multispectral imagery. Crop Sci. 2022, 10, 1376–1385. [Google Scholar] [CrossRef]
  34. Qiao, L.; Zhao, R.; Tang, W.; An, L.; Sun, H.; Li, M.; Wang, N.; Liu, Y.; Liu, G. Estimating maize LAI by exploring deep features of vegetation index map from UAV multispectral images. Field Crops Res. 2022, 289, 108739. [Google Scholar] [CrossRef]
  35. Lang, Q.; Zhiyong, Z.; Longsheng, C.; Hong, S.; Minzan, L.; Li, L.; Junyong, M. Detection of chlorophyll content in Maize Canopy from UAV Imagery. IFAC-PapersOnLine 2019, 52, 330–335. [Google Scholar] [CrossRef]
  36. Prado Osco, L.; Marques Ramos, A.P.; Roberto Pereira, D.; Akemi Saito Moriya, É.; Nobuhiro Imai, N.; Takashi Matsubara, E.; Eduardo Creste, J. Predicting canopy nitrogen content in citrus-trees using random forest algorithm associated to spectral vegetation indices from UAV-imagery. Remote Sens. 2019, 11, 2925. [Google Scholar] [CrossRef] [Green Version]
  37. Noguera, M.; Aquino, A.; Ponce, J.M.; Cordeiro, A.; Silvestre, J.; Arias-Calderón, R.; Andújar, J.M. Nutritional status assessment of olive crops by means of the analysis and modelling of multispectral images taken with UAVs. Biosyst. Eng. 2021, 211, 1–18. [Google Scholar] [CrossRef]
  38. Chen, S.; Hu, T.; Luo, L.; He, Q.; Li, H. Rapid estimation of leaf nitrogen content in apple-trees based on canopy hyperspectral reflectance using multivariate methods. Infrared Phys. Technol. 2020, 111, 103542. [Google Scholar] [CrossRef]
  39. Rui, Z.; Qi, Z.; Chen, J.; Hong, Z.; Shan, G.; Xu, C. Effect of water and fertilizer coupling on photosynthetic characteristics and quality in walnut. J. Fruit Sci. 2015, 32, 1170–1178. [Google Scholar]
  40. Carlson, T.N.; Ripley, D.A. On the relation between NDVI, fractional vegetation cover, and leaf area index. Remote Sens. Environ. 1997, 62, 241–252. [Google Scholar] [CrossRef]
  41. Hunt, E.R.; Cavigelli, M.; Daughtry, C.S.; Mcmurtrey, J.E.; Walthall, C.L. Evaluation of digital photography from model aircraft for remote sensing of crop biomass and nitrogen status. Precis. Agric. 2005, 6, 359–378. [Google Scholar] [CrossRef]
  42. Xue, L.; Cao, W.; Luo, W.; Dai, T.; Zhu, Y. Monitoring leaf nitrogen status in rice with canopy spectral reflectance. Agron. J. 2004, 96, 135–142. [Google Scholar] [CrossRef]
  43. Gitelson, A.A.; Merzlyak, M.N. Remote estimation of chlorophyll content in higher plant leaves. Int. J. Remote Sens. 1997, 18, 2691–2697. [Google Scholar] [CrossRef]
  44. Tucker, C.J. Red and photographic infrared linear combinations for monitoring vegetation. Remote Sens. Environ. 1979, 8, 127–150. [Google Scholar] [CrossRef] [Green Version]
  45. Matsushita, B.; Yang, W.; Chen, J.; Onda, Y.; Qiu, G. Sensitivity of the enhanced vegetation index (EVI) and normalized difference vegetation index (NDVI) to topographic effects: A case study in high-density cypress forest. Sensors 2007, 7, 2636–2651. [Google Scholar] [CrossRef] [Green Version]
  46. Gitelson, A.A.; Merzlyak, M.N.; Lichtenthaler, H.K. Detection of red edge position and chlorophyll content by reflectance measurements near 700 nm. J. Plant Physiol. 1996, 148, 501–508. [Google Scholar] [CrossRef]
  47. Zebarth, B.J.; Younie, M.; Paul, J.W.; Bittman, S. Evaluation of leaf chlorophyll index for making fertilizer nitrogen recommendations for silage corn in a high fertility environment. Commun. Soil Sci. Plant Anal. 2002, 33, 665–684. [Google Scholar] [CrossRef]
  48. Wold, S.; Ruhe, A.; Wold, H.; Dunn Iii, W.J. The collinearity problem in linear regression. The partial least squares (PLS) approach to generalized inverses. SIAM J. Sci. Comput. 1984, 5, 735–743. [Google Scholar] [CrossRef] [Green Version]
  49. Morlini, I. On multicollinearity and concurvity in some nonlinear multivariate models. Stat. Method Appl.-Ger. 2006, 15, 3–26. [Google Scholar] [CrossRef]
  50. Breiman, L. Random forests. Mach. Learn. 2001, 45, 5–32. [Google Scholar] [CrossRef] [Green Version]
  51. Bai, Z.; Xie, M.; Hu, B.; Luo, D.; Wan, C.; Peng, J.; Shi, Z. Estimation of Soil Organic Carbon Using Vis-NIR Spectral Data and Spectral Feature Bands Selection in Southern Xinjiang, China. Sensors 2022, 22, 6124. [Google Scholar] [CrossRef]
  52. Zhang, Q.; Liu, Y.; Gong, C.; Chen, Y.; Yu, H. Applications of deep learning for dense scenes analysis in agriculture: A review. Sensors 2020, 20, 1520. [Google Scholar] [CrossRef] [PubMed] [Green Version]
  53. Li, M.; Zhu, X.; Li, W.; Tang, X.; Yu, X.; Jiang, Y. Retrieval of nitrogen content in apple canopy based on unmanned aerial vehicle hyperspectral images using a modified correlation coefficient method. Sustainability 2022, 14, 1992. [Google Scholar] [CrossRef]
  54. Johansen, K.; Duan, Q.; Tu, Y.H.; Searle, C.; Wu, D.; Phinn, S.; McCabe, M.F. Mapping the condition of macadamia tree crops using multi-spectral UAV and WorldView-3 imagery. ISPRS J. Photogramm. 2020, 165, 28–40. [Google Scholar] [CrossRef]
  55. Vong, C.N.; Conway, L.S.; Feng, A.; Zhou, J.; Kitchen, N.R.; Sudduth, K.A. Corn emergence uniformity estimation and mapping using UAV imagery and deep learning. Comput. Electron. Agric. 2022, 198, 107008. [Google Scholar] [CrossRef]
Figure 1. Study area: (a) The location of Xinjiang, China; (b) the location of the study site; and (c) A–I is the distribution of sampling plots and sampling points.
Agronomy 13 01604 g001
Figure 2. (a) Canopy nitrogen concentration, false color is used to distinguish nitrogen content in different growth stages; (b) The spectral response of different nitrogen concentrations.
Agronomy 13 01604 g002
Figure 3. Manually Confirmed between canopy extraction spectral information and the canopy nitrogen concentration.
Agronomy 13 01604 g003
Figure 4. Correlation analysis of canopy nitrogen with spectral information extracted by simulated canopy method.
Agronomy 13 01604 g004
Figure 5. Distribution of nitrogen concentration in the canopy of walnut trees. A-I is the test plot.
Agronomy 13 01604 g005
Figure 6. In the original image, a schematic diagram of the canopy and the simulated canopy are sketched.
Agronomy 13 01604 g006
Table 1. UAV flight dates and times.
DateFlight Time (UTC +8:00)Solar Altitude AngleFertility Period
20 May13:30–14:3061.40°–60.98°Fruit fast-growth period
25 June13:30–14:3064.01°–62.97°Fruit sclerotization period
27 August13:45–14:4551.64°–42.73°Fruit near-maturity period
Table 2. Vegetation indices and calculation formulas.
Spectral IndexCalculation FormulaSource
NDVI(NIR − Red)/(NIR + Red)[40]
NDRE(NIR − RedEdge)/(NIR + RedEdge)[41]
NGRDI(Green − Red)/(Green + Red)[42]
GNDVI(NIR − Green)/(NIR + Green)[43]
RVINIR/Red[44]
DVINIR − Red[45]
EVI2.5(NIR − Red)/(NIR + 6Red − 7.5Blue + 1)[46]
LCI(NIR − RedEdge)/(NIR + Red)[47]
DVI − RedEdgeNIR − RedEdge-
RVI − RedEdgeNIR/RedEdge-
Table 3. Statistics of the nitrogen concentration in the walnut canopy at different growth periods.
Growth Period of Walnut FruitNumber of SamplesMax
(g kg−1)
Min
(g kg−1)
Mean
(g kg−1)
SEVarianceCV
(%)
Fruit fast-growth period18038.9822.4732.482.586.597.90
Fruit sclerotization period18034.9424.3430.411.853.376.04
Fruit near-maturity period18029.8921.3327.561.301.704.72
Note: Max, Min, SE, and CV denote the maximum, minimum, standard error, and coefficient of variation of the canopy nitrogen content of walnut trees, respectively.
Table 4. The canopy was drawn to extract the sensitive factors of canopy spectral information and establish the prediction accuracy of the model.
DateTypes of VariablesPLSRSVMRRF
ValValVal
R2RMSE (g kg−1)RPDR2RMSE (g kg−1)RPDR2RMSE (g kg−1)RPD
20 MayBand0.530.531.220.650.461.350.710.431.76
SI0.590.501.150.720.421.840.820.341.89
Band + SI0.600.501.250.840.322.000.850.302.55
25 JuneBand0.740.311.790.770.251.850.770.271.39
SI0.780.251.680.790.262.150.830.212.07
Band + SI0.790.251.700.800.262.150.840.212.07
27 AugustBand0.670.971.630.690.551.740.760.511.19
SI0.720.711.840.880.342.300.900.313.08
Band + SI0.770.522.070.900.322.460.920.303.22
Note: Val indicates the validation.
Table 5. The canopy spectral information sensitive factors were extracted using the simulated canopy method to establish the prediction accuracy of the model.
DateTypes of VariablePLSRSVMRRF
ValValVal
R2RMSE (g kg−1)RPDR2RMSE (g kg−1)RPDR2RMSE (g kg−1)RPD
20 MayBand0.500.541.410.550.531.320.620.501.52
SI0.590.501.540.590.501.380.620.501.53
Band + SI0.610.481.580.620.481.430.640.481.60
25 JuneBand0.460.381.360.560.351.050.710.281.44
SI0.700.291.280.720.281.460.730.281.86
Band + SI0.730.291.260.730.271.470.740.271.93
27 AugustBand0.481.221.230.610.700.610.620.631.52
SI0.640.651.140.650.621.590.830.442.16
Band + SI0.800.431.940.830.511.100.840.432.20
Note: Val indicates the validation.
Disclaimer/Publisher’s Note: The statements, opinions and data contained in all publications are solely those of the individual author(s) and contributor(s) and not of MDPI and/or the editor(s). MDPI and/or the editor(s) disclaim responsibility for any injury to people or property resulting from any ideas, methods, instructions or products referred to in the content.

