Article

Performance of an Automatic Variable-Rate Fertilization System Subject to Different Initial Field Water Conditions and Fertilizer Doses in Paddy Fields

1
The National Key Laboratory of Water Disaster Prevention, Hohai University, Nanjing 210098, China
2
Jiangsu Province Engineering Research Center for Agriculture Soil-Water Efficient Utilization & Carbon Sequestration and Emission Reduction, Hohai University, Nanjing 211100, China
3
College of Agricultural Science and Engineering, Hohai University, Nanjing 211100, China
4
Department of Biosystems Engineering, Zhejiang University, Hangzhou 310058, China
5
Faculty of Management Engineering, Huaiyin Institute of Technology, Huai’an 223200, China
*
Author to whom correspondence should be addressed.
Agronomy 2023, 13(6), 1629; https://doi.org/10.3390/agronomy13061629
Submission received: 23 May 2023 / Revised: 8 June 2023 / Accepted: 16 June 2023 / Published: 18 June 2023
(This article belongs to the Special Issue Precision Operation Technology and Intelligent Equipment in Farmland)

Abstract

:
High-performance fertilization equipment with high uniformity is essential for the improvement of fertilizer use efficiency in paddies. The performance of these fertigation systems might be affected by the initial field conditions and fertilizer doses. In this study, the uniformity of fertilization by an automatic system (SF) was investigated; the investigation had two initial field water conditions and fertilizer doses, and manual fertilization by farmers (FF) was used as the control. After fertilization, the Christiansen uniformity coefficient (CU) in the SF paddies was higher than in the FF paddies, and the SF in the non-flooded paddies (SFN) was the highest. With time, the CU of treatments with poor fertilization uniformity was improved; it was driven by the osmotic potential of fertilizer ions, but it was far from exceeding that of the treatments originally conducted with higher CU. For the SF treatments, the fertilizer dose did not affect fertilization uniformity significantly; so, an SF can match the efficient fertilization strategies more precisely. As water-saving irrigation (WSI) is conducive to the production of non-flooded field conditions and the promotion of the efficient use of topdressing, the use of automatic fertilization systems to implement efficient fertilization management practices in WSI paddy fields is suggested.

1. Introduction

The stability of rice production is critical to global food security as rice serves as food for 3 billion people worldwide [1,2]. Fertilization is one of the most important ways to improve rice yield. High-quality fertilization management is not only conducive to ensuring high rice yields [3,4,5], but also to solving the problems associated with excessive fertilizer application rates, low fertilizer use efficiency, and the severe nonpoint source pollution caused by fertilizer loss [6,7,8,9]. In China, rice is generally fertilized with one base fertilizer followed by one or several topdressings. The basal fertilizer is a compound consisting of nitrogen, phosphorus, and potassium in granular form and is generally mixed into the soils with rotary tillage. The topdressing is mainly used for nitrogen fertilizer and is occasionally mixed with a small amount of potassium fertilizer or micronutrients according to crop demand [10,11,12]. Many studies have tried to optimize the timing, frequency, and application dose of each split in order to improve fertilizer management by properly matching the nutrient demand of rice [13,14]. Several fertilizer management practices have been tested and shown high fertilizer use efficiency, including multi-split topdressing fertilizer-N (MST) application [4,5], real-time N management (RTNM) [15,16,17], and site-specific N management (SSNM) [18,19,20]. One common feature of these practices is that the nitrogen fertilizer is applied in more splits and at a more precise reduced dose for each application. However, these management practices can rarely be fully implemented due to some limitations, such as the high implementation costs of the labor and the greater professional knowledge requirements for the decision making with regard to the timing and dose of each application [4,13,21,22]. On the other hand, the guidance given by each of the fertilizer management practices focuses on the amount per unit area, which is based on the premise that farmers can apply fertilizer evenly in rice fields. Uniform fertilizer application is the only way to guarantee that vital nutrients are equally distributed to the whole crop. Conversely, uneven application can cause irregular growth, discoloration of the crop, decreased yield, and low crop value [23]. To avoid such circumstances, farmers typically need to put down more fertilizer to meet the demands of all the crops in the field, which leads to excessive use of fertilizer, the lowering of the fertilizer use efficiency, and the increasing of the nonpoint source pollution emissions [24,25]. Therefore, fertilizer distribution on the field is of great importance [26]; appropriate fertilization equipment is necessary, especially for rice fields with split fertilizer management.
With developments in industrialization and information technology, fertilization equipment has been developed to replace the high cost and low efficiency of manual fertilization by farmers. These equipments are generally based on two platforms: unmanned aerial vehicles (UAVs) [27,28,29] and agricultural vehicles [30,31,32]. However, management practices such as MST, RTNM, and SSNM often mean more frequent fertilization times, more flexible times, and more accurate control of fertilizer doses, which undoubtedly increase the implementation difficulty and implementation cost for the two kinds of fertilization equipment mentioned above.
Recently, some studies have attempted to develop fertilization equipment which is suitable for rice fields, following the idea of fertigation systems, which are widely used in upland drip irrigation systems [33,34,35]. In particular, to improve fertilization uniformity and reduce fertilization labor costs, Wang et al. [35] developed fertigation equipment that was suitable for rice field irrigation systems; this equipment realized the real-time regulation of the fertilizer flow rate to match changes in the irrigation flow, kept fertilizer concentrations at the water outlet near the set values, and ensured that the water and fertilizer entering the field were uniformly distributed. Compared with manual fertilization, the developed system showed a significant improvement in uniformity. It requires less labor and has low cost, and it is a promising instrument to facilitate advanced fertilization management. In addition, both water-saving irrigation (WSI, alternate dry and wet) and traditional flooding irrigation coexist in different rice paddies [36,37]; therefore, the fields might be initially flooded in ponded paddies or be dry in WSI paddies. Whether the initial field water conditions (flooded or non-flooded) before fertigation in rice paddies are a factor influencing fertilizer spatial distribution uniformity is not clear.
In the current research, fertigation equipment was tested with different fertilizer doses in both flooded and non-flooded paddy fields. The objective was to evaluate the performance of the fertigation equipment in terms of field fertilizer distribution uniformity under multiple field conditions.

2. Materials and Methods

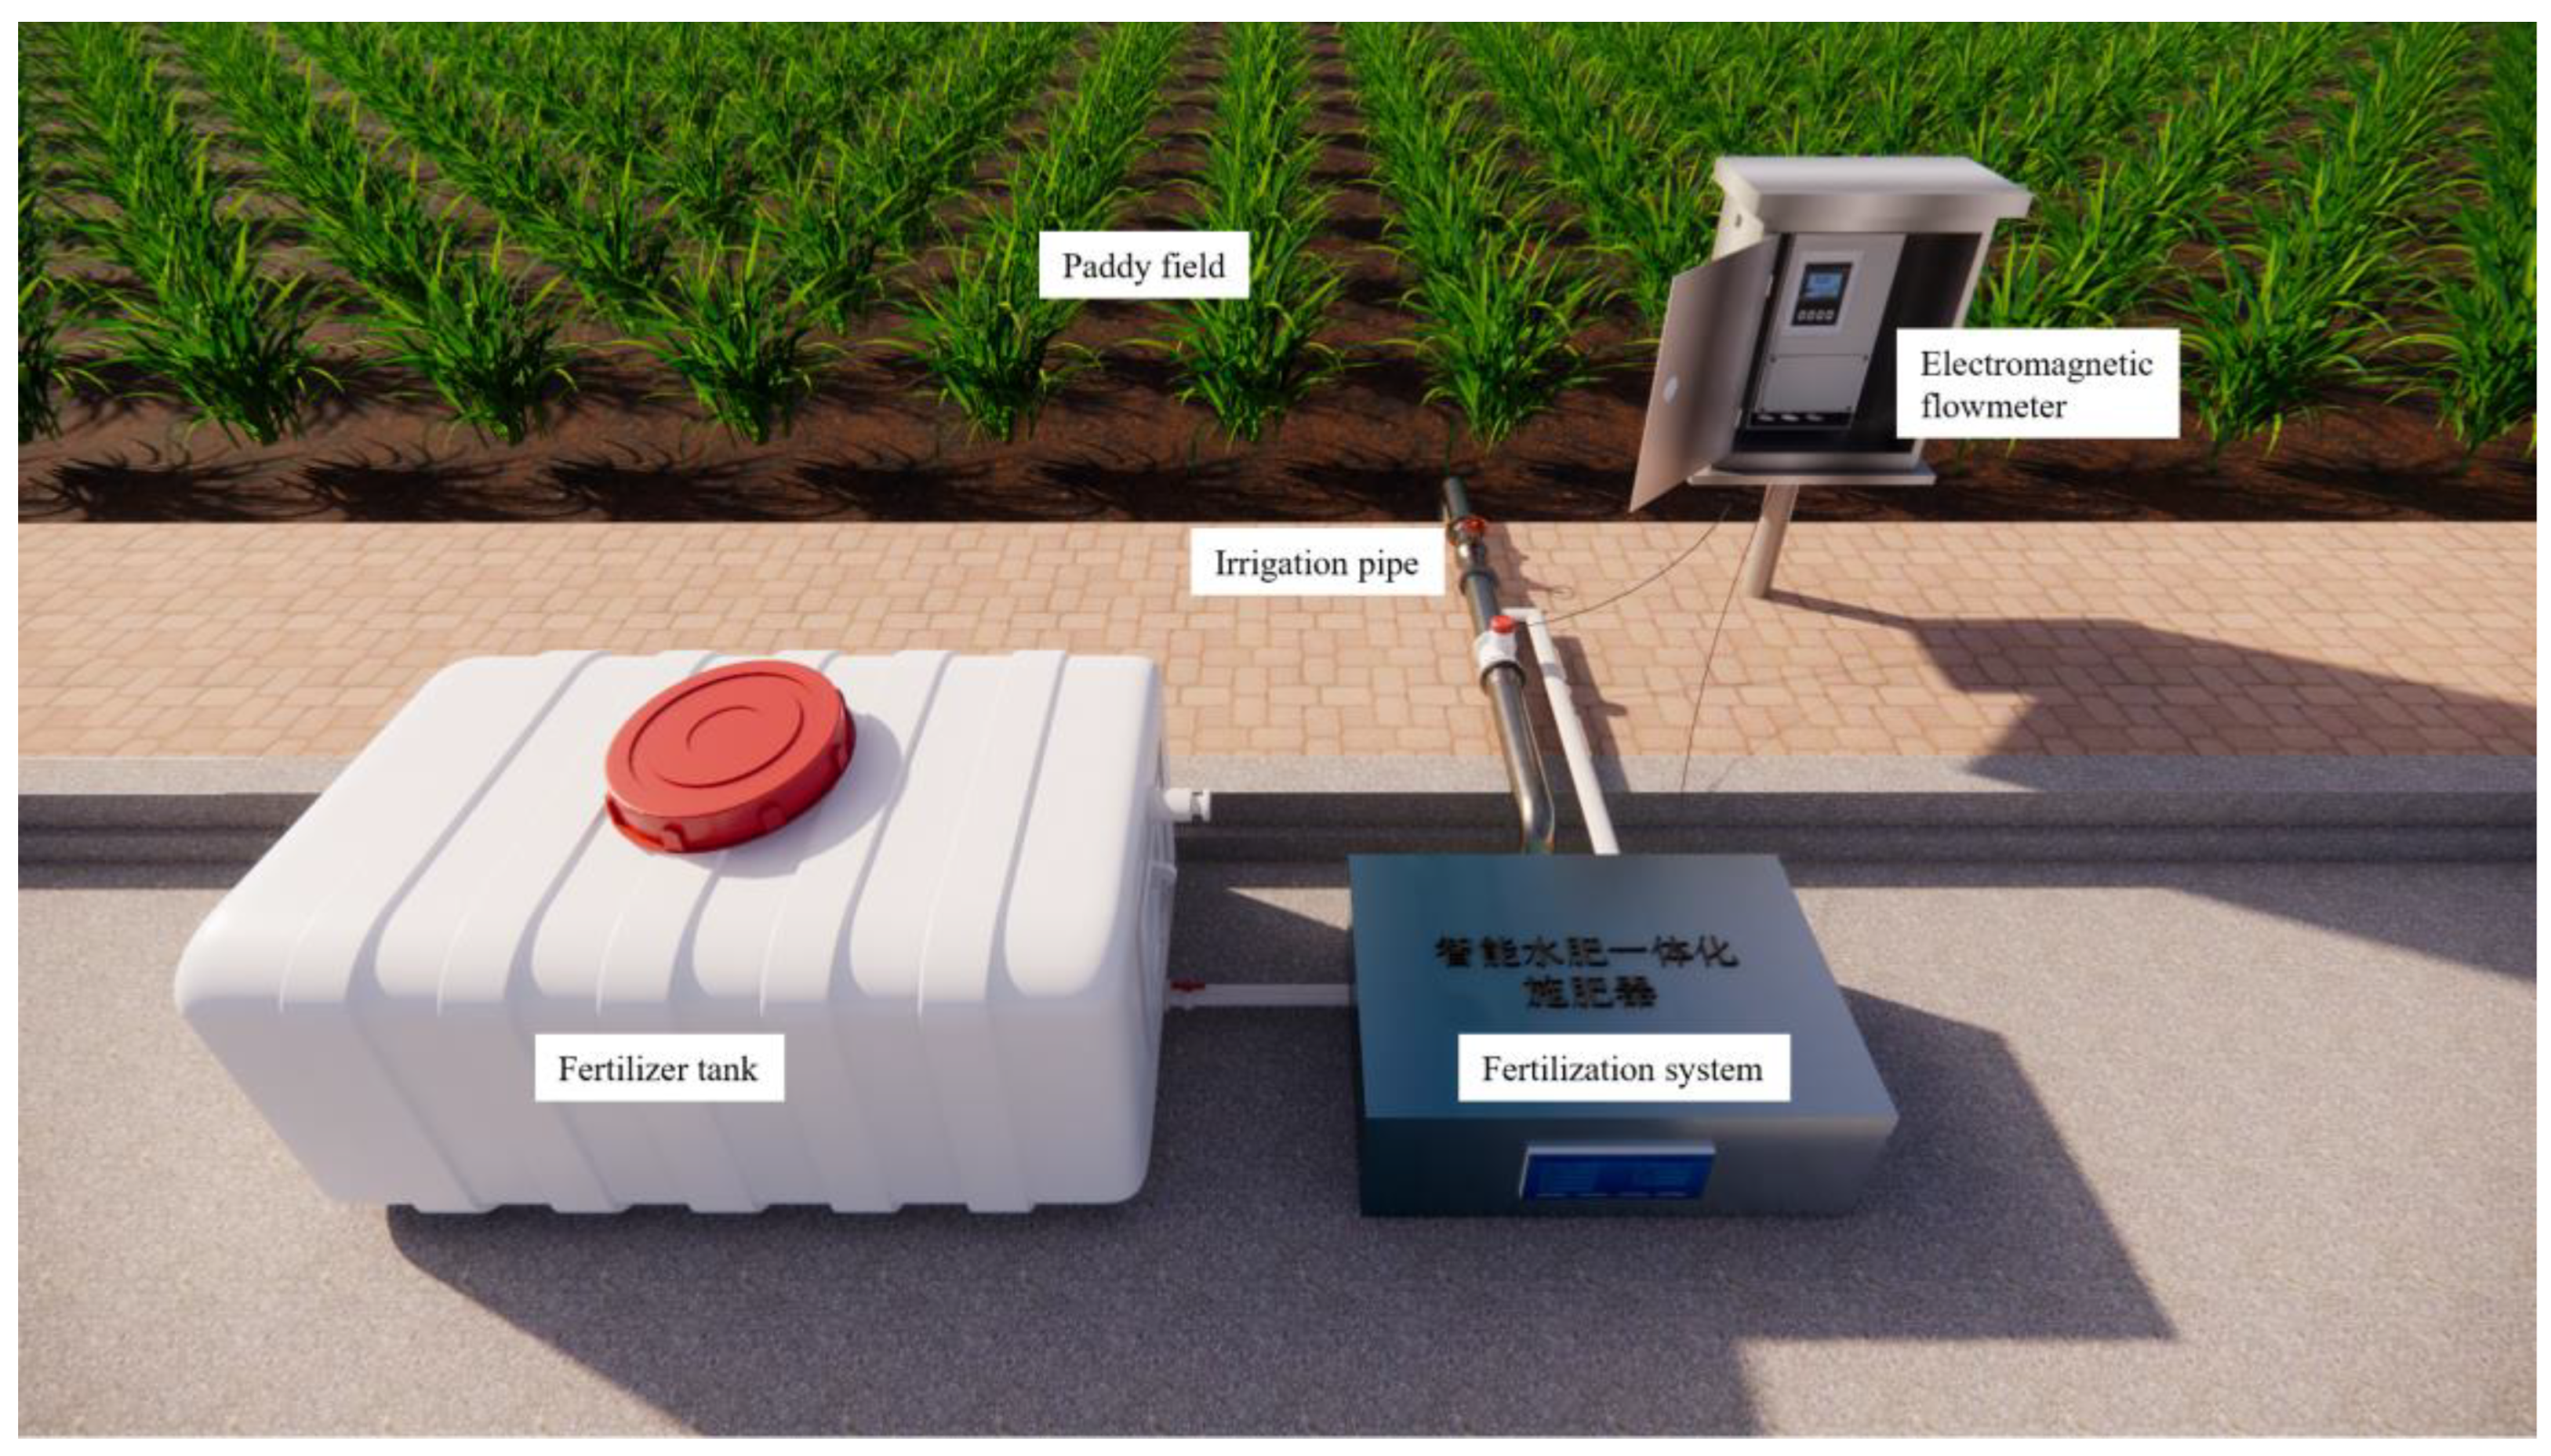
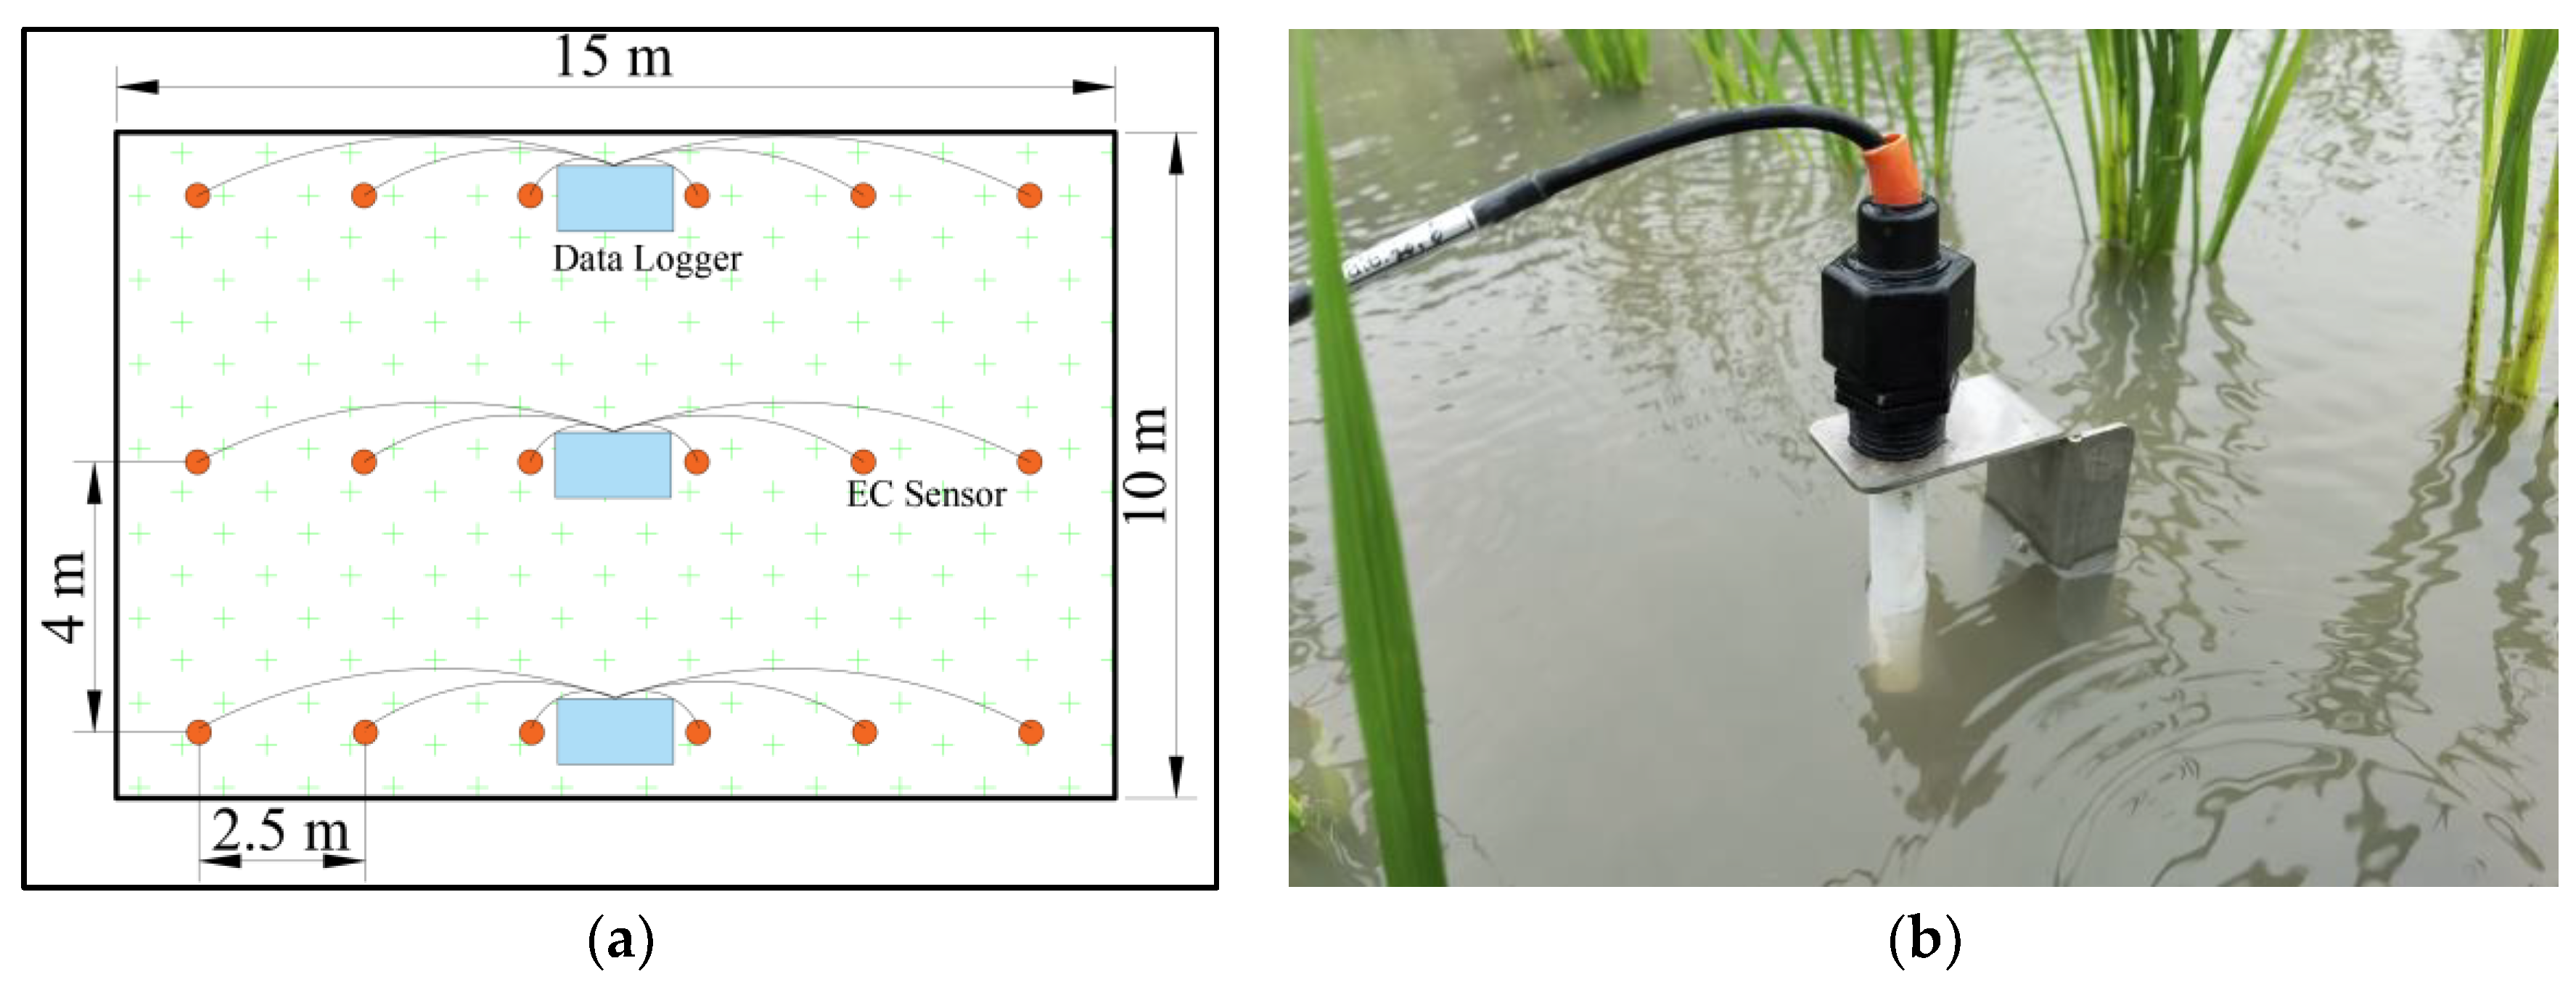
2.1. Test Site Design

The field test was conducted in 6 experimental plots (Figure 1) at the Kunshan Drainage and Irrigation Experiment station (31°15’15″ N, 120°57’43″ E). The plots corresponded to different initial field water conditions and fertilizer doses (as listed in Table 1). The size of each plot was 150 m2 (15 m length × 10 m width). The plots were flat and were surrounded by concrete walls at a depth of 1 m to avoid water exchange between adjacent plots. All the plots were irrigated separately by a low-pressure pipe irrigation system, and the real-time irrigation flow rate was measured by an electromagnetic flowmeter installed on the pipe at the inlet of each plot. The circuit and pipeline connection of the fertigation system was consistent with that of Wang et al. [35]; the diagram is shown in Figure 2.

2.2. Scenario Design

This study was conducted in mid-August during the late tillering stage after mid-season drainage in the rice fields, during which time the irrigation and topdressing of ear fertilizer was necessary. In order to provide the water in the field after fertilization with physical characteristics that could be monitored easily with regard to fertilizer concentration, ammonium bicarbonate (NH4HCO3, N content: 17%), a commonly used N fertilizer whose solution conductivity is positively correlated with concentration, was selected for this test. The fertilizer doses applied were 5.5 kg/plot (62.3 kg N/ha) and 2.0 kg/plot (22.6 kg N/ha) to reflect the practices of local farmers and multi-split topdressing fertilizer-N (MST) fertilization, respectively. For each treatment, the farmer-applied manual fertilization (FF) and automatic fertilization system (SF) were selected. The fields with FF management were irrigated to approximately 6 cm before the fertilizer was manually broadcast into the flooded water by an experienced farmer. For the fields with SF management, two fields were irrigated to approximately 2 cm, and the other two fields were not irrigated before fertigation. See Table 1 for the specific treatments.
In SF, 2.0 kg and 5.5 kg of solid ammonium bicarbonate were completely dissolved to form solutions of 22.5 l and 45.0 l, respectively, and the corresponding irrigation amount for each plot was 9 m³.

2.3. Concentration Monitoring

The electrical conductivity (EC) in the flooded water was recorded by 18 electrical conductivity sensors installed in each rice field (as shown in Figure 3). The sensors were made by Guangzhou LOGOELE Electronic Technology Co., Ltd. Guangzhou, China, and had a range of 0–4400 μs/cm and a precision of ±2% FS. Each sensor was calibrated with a series of standard conductivity solutions. The NH4HCO3 concentrations were determined according to the regression between the NH4HCO3 concentration and the EC values. This regression was set at 9 levels of NH4HCO3 concentration, namely 0.0 g/L, 0.1 g/L, 0.2 g/L, 0.3 g/L, 0.4 g/L, 0.5 g/L, 0.6 g/L, 0.7 g/L, and 0.8 g/L. The linear regression (Formula 1) between the NH4HCO3 concentration and EC was significant at the p < 0.01 level, with an R2 of 0.9993.
C a b = E C E C 0 1.5906
where E C 0 is the background electrical conductivity (μS/cm), which was measured in the irrigation water, and C a b is the concentration of ammonium bicarbonate (mg/L).
The concentration of nitrogen (N) ( C N , mg/L) in the water was calculated with the following formula:
C N = C a b × 17 % ,
where 17 % was the effective N content in the NH4HCO3 (mg/L).
In each plot, 18 sensors were placed in 3 groups at a row spacing of 4 m. For each group, 6 sensors were arranged along the length of the plot with a spacing of 2.5 m and were connected to a data logger. The layout is shown in Figure 3a. Because fertilizer redistribution occurred through the water layer for both the SF and FF treatments, the EC data were recorded every minute for more than 12 h after each fertilization event.

2.4. Data Analysis

The EC values recorded by the data logger were transferred to a computer and sorted in .xlsx format. After moving average processing [38,39] to reduce accidental error in the recorded data, the data with monitoring frequencies of 30 min were screened by using Microsoft Excel 2019. Finally, the EC values were converted into ammonium N concentrations (Formulas 1 and 2). N distribution diagrams were drawn using Surfer 18 by Golden Software, LLC., Denver, Colorado, USA. The following indicators (Table 2) were selected to evaluate the uniformity of the fertilizer distribution for each test scenario listed in Table 1.

3. Results and Discussion

3.1. Fertilizer Concentration at the End of Fertilization

Figure 4 shows the fertilizer (N) concentration distribution diagrams in the paddies of each test scenario at different times. Compared with SFN, SFF resulted in a significantly lower uniformity in fertilizer concentration distribution at the same fertilizer dose. The N-containing water (generally with an N content of 37.78–103.89 mg/L) delivered by the fertigation system could not be fully mixed with the original water (generally with an N content of 0 mg/L) in the field. The distribution pattern in SSF likely indicates that the freshly irrigated water did not fully mix with the original water in the paddy fields and that there were clear boundaries between them. The distribution pattern may mainly depend on the field microtopography and water velocity distribution as well as the irrigation. In each FFF treatment, the difference in nitrogen concentration was more obvious, and the range of N content in the water was also significantly larger than that of SFN and SFF with the same fertilizer dose.
Table 3 shows the uniformity indicators of each treatment within 12 h after fertilization. At the end of fertilization, the order of CU from high to low was SFN5.5 > SFN2.0 > SFF5.5 > SFF2.0 > FFF2.0 > FFF5.5. Combining the data in Table 2, Table 3, Table 4 and Table 5, we can see that (1) from the perspective of fertilization uniformity, SF had an overwhelming advantage over FF, regardless of the initial water conditions before the fertilization and fertilizer doses. (2) SF could achieve the best uniformity when the paddy was non-flooded before fertigation (SFN treatments), with several indicators approaching the optimal value (according to the definition, when the fertilizer distribution is infinitely close to perfect uniformity, the CU, DU, Cv, and R resolutions are infinitely close to 100%, 1, 0, and 0 mg/L), which is consistent with the results by Wang et al. [35]. (3) When the fertilizer dose was the only variable, the relative CU increase percentages of SFN5.5, SFF5.5, and FFF5.5, compared with SFN2.0, SFF2.0 and FFF2.0, were 1.87%, 0.07%, and −16.97%, respectively, which indicated that the fertilizer dose did not affect fertilization uniformity significantly; the largest difference was observed between FFF5.5 and FFF2.0; however, the occasionality of FF was inherently large.

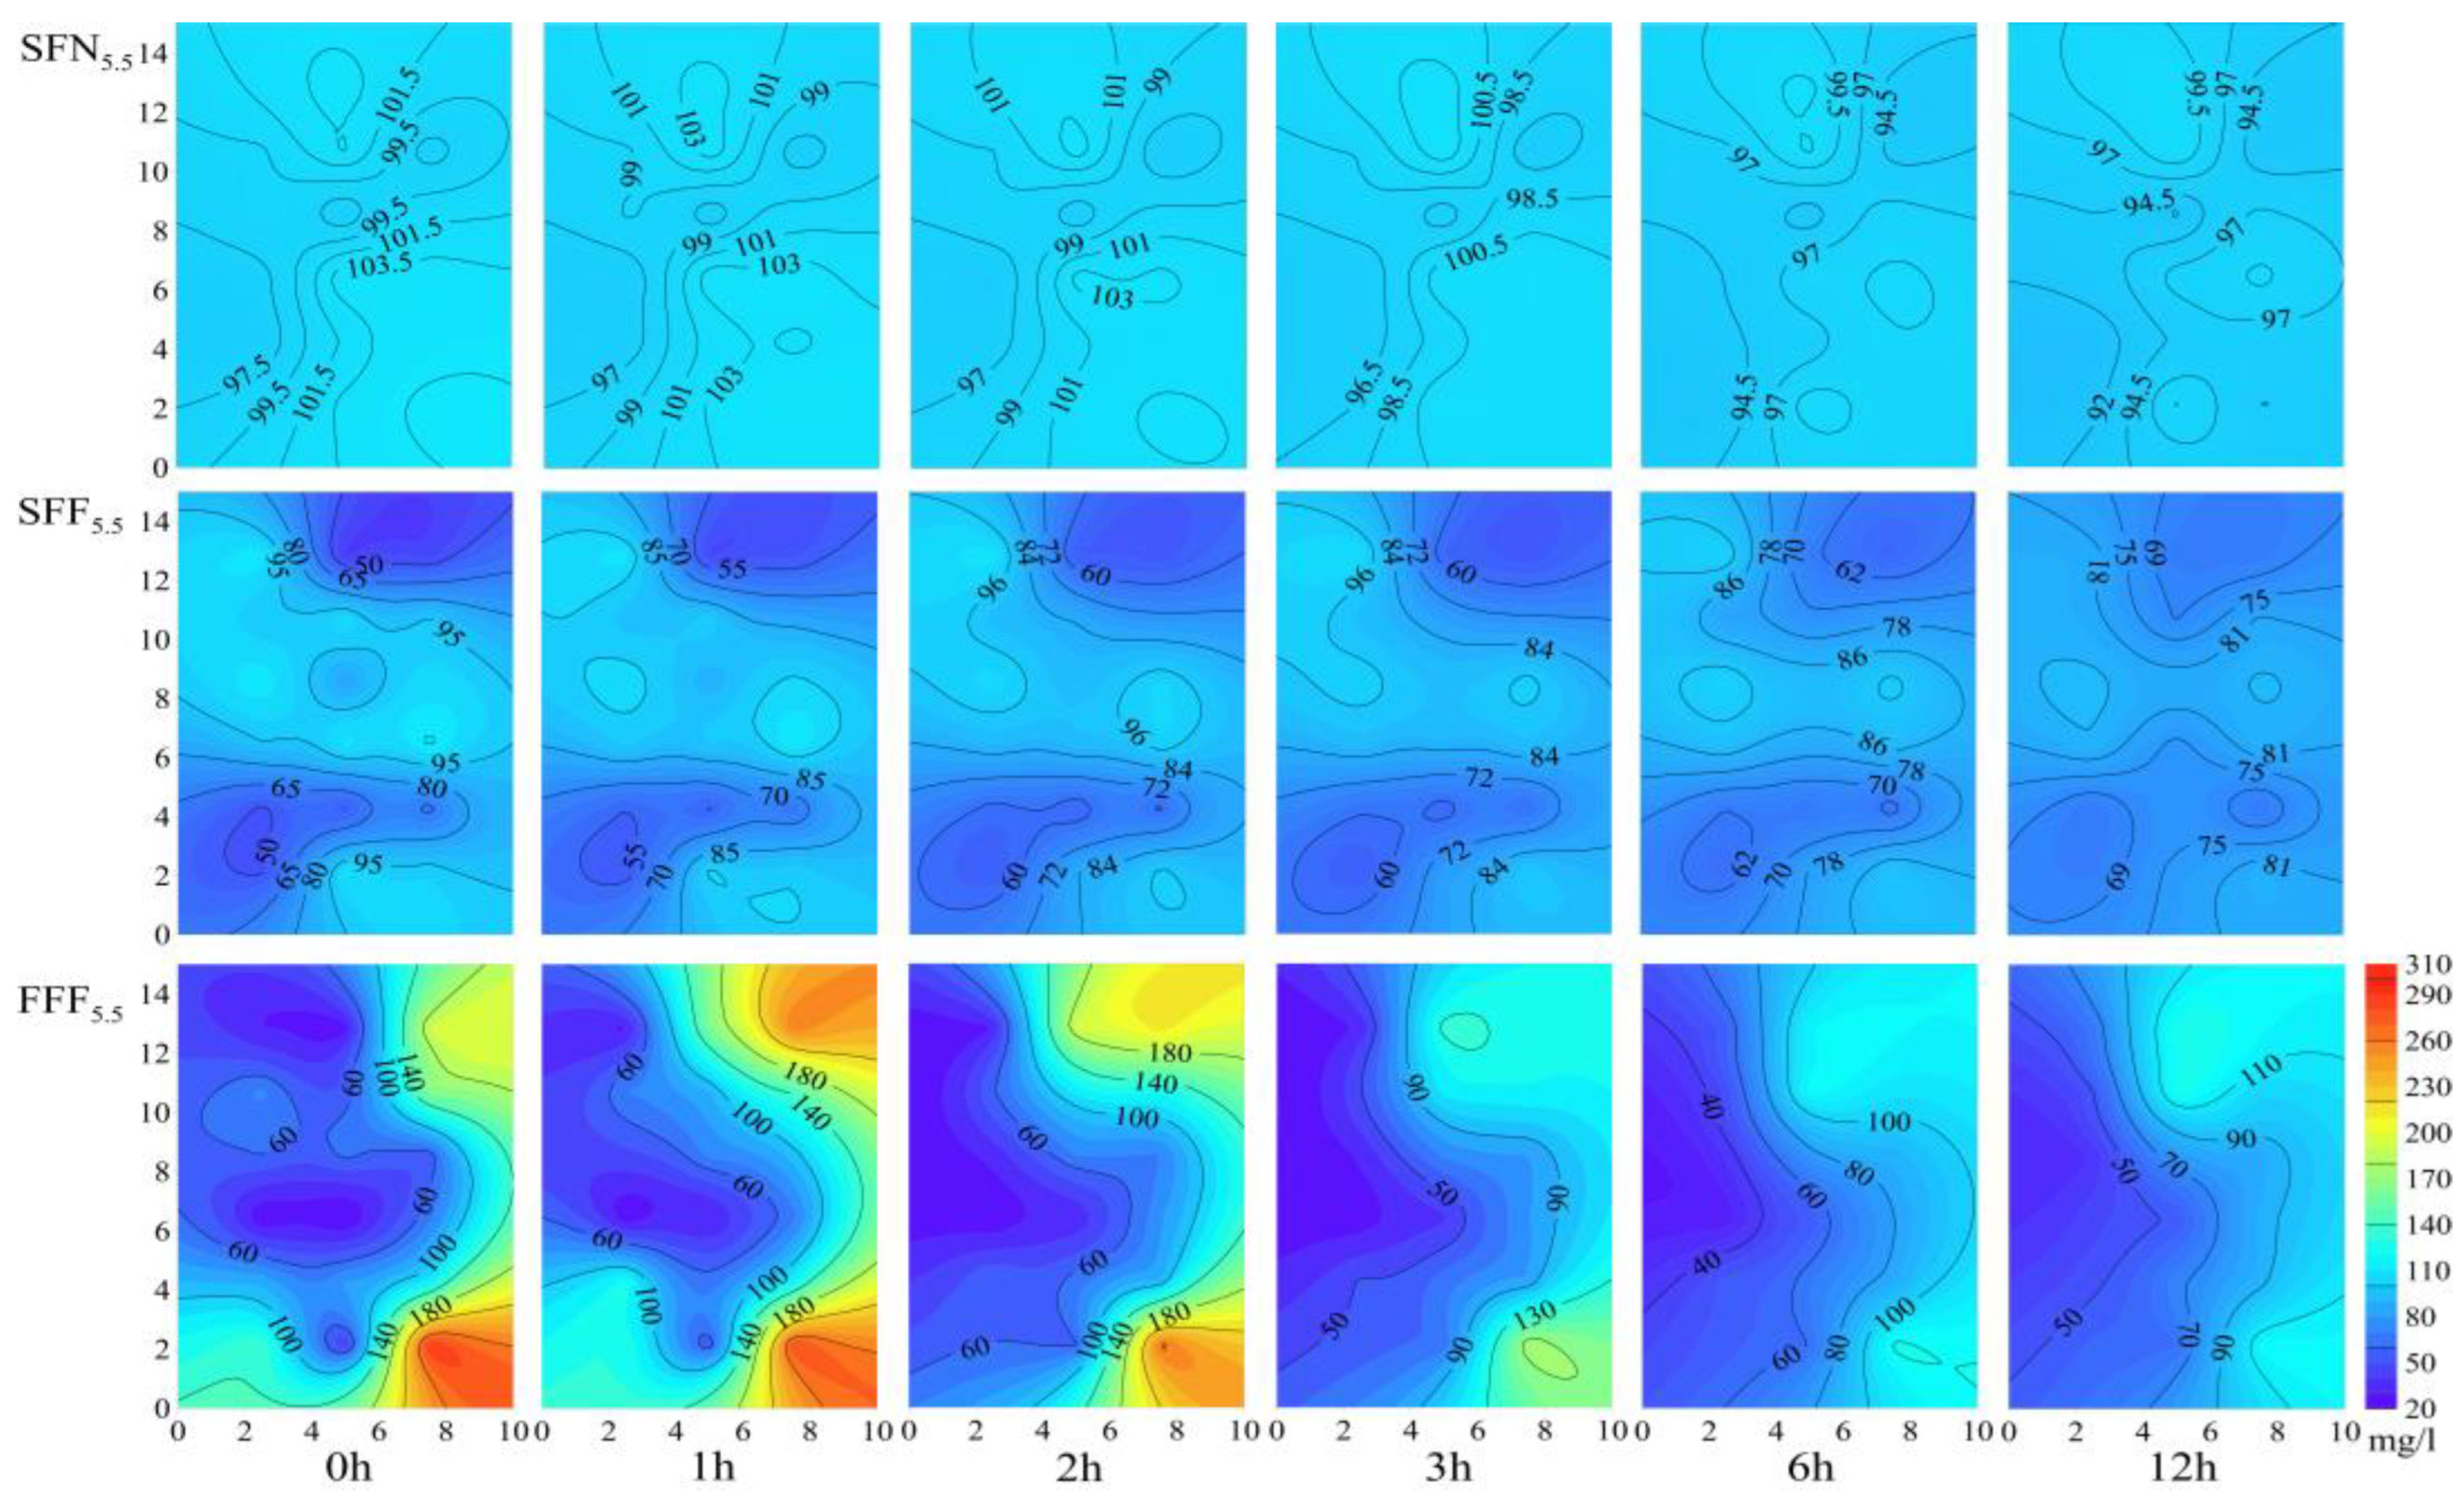
3.2. Fertilizer Concentration Distribution within 12 h

Considering that fertilizer ions (NH4+) in water diffuse from high concentration areas to low concentration areas due to osmotic potential [40,41], to improve the uniformity of fertilizer distribution we continuously observed the fertilizer concentration distribution in the field for 12 h after fertilization to verify this effect (as shown in Figure 4). Combined with Table 3, it is easy to see that the fertilizer concentration distribution of the SFN5.5 and SFN2.0 treatments remained stable over 12 h because they achieved almost optimal uniformity at the end of fertilization. The fertilizer concentration of the other four treatments was significantly improved over 12 h, as shown in Figure 5; the CU of SFF5.5 and SFF2.0 increased by 24.45% and 19.77%, respectively, and the CU of FFF5.5 and FFF2.0 increased by 66.52% and 67.16%, respectively. This means that the fertilizer concentration tended to be more uniform over a short period of time after fertilization in the treatment with poor uniformity, and for the treatments with lower initial uniformity (FFF5.5 and FFF2.0) after fertilization, the improvement was the greatest because the fertilizer ions in the water of these treatments had a higher osmotic potential gradient, i.e., the fertilizer diffused faster. However, the maximum CU values were still lower than those of the treatments with higher initial uniformity (i.e., SFN5.5 and SFN2.0), and the same conclusions would be obtained by analyzing the other uniformity indicators, namely DU, Cv, and R.

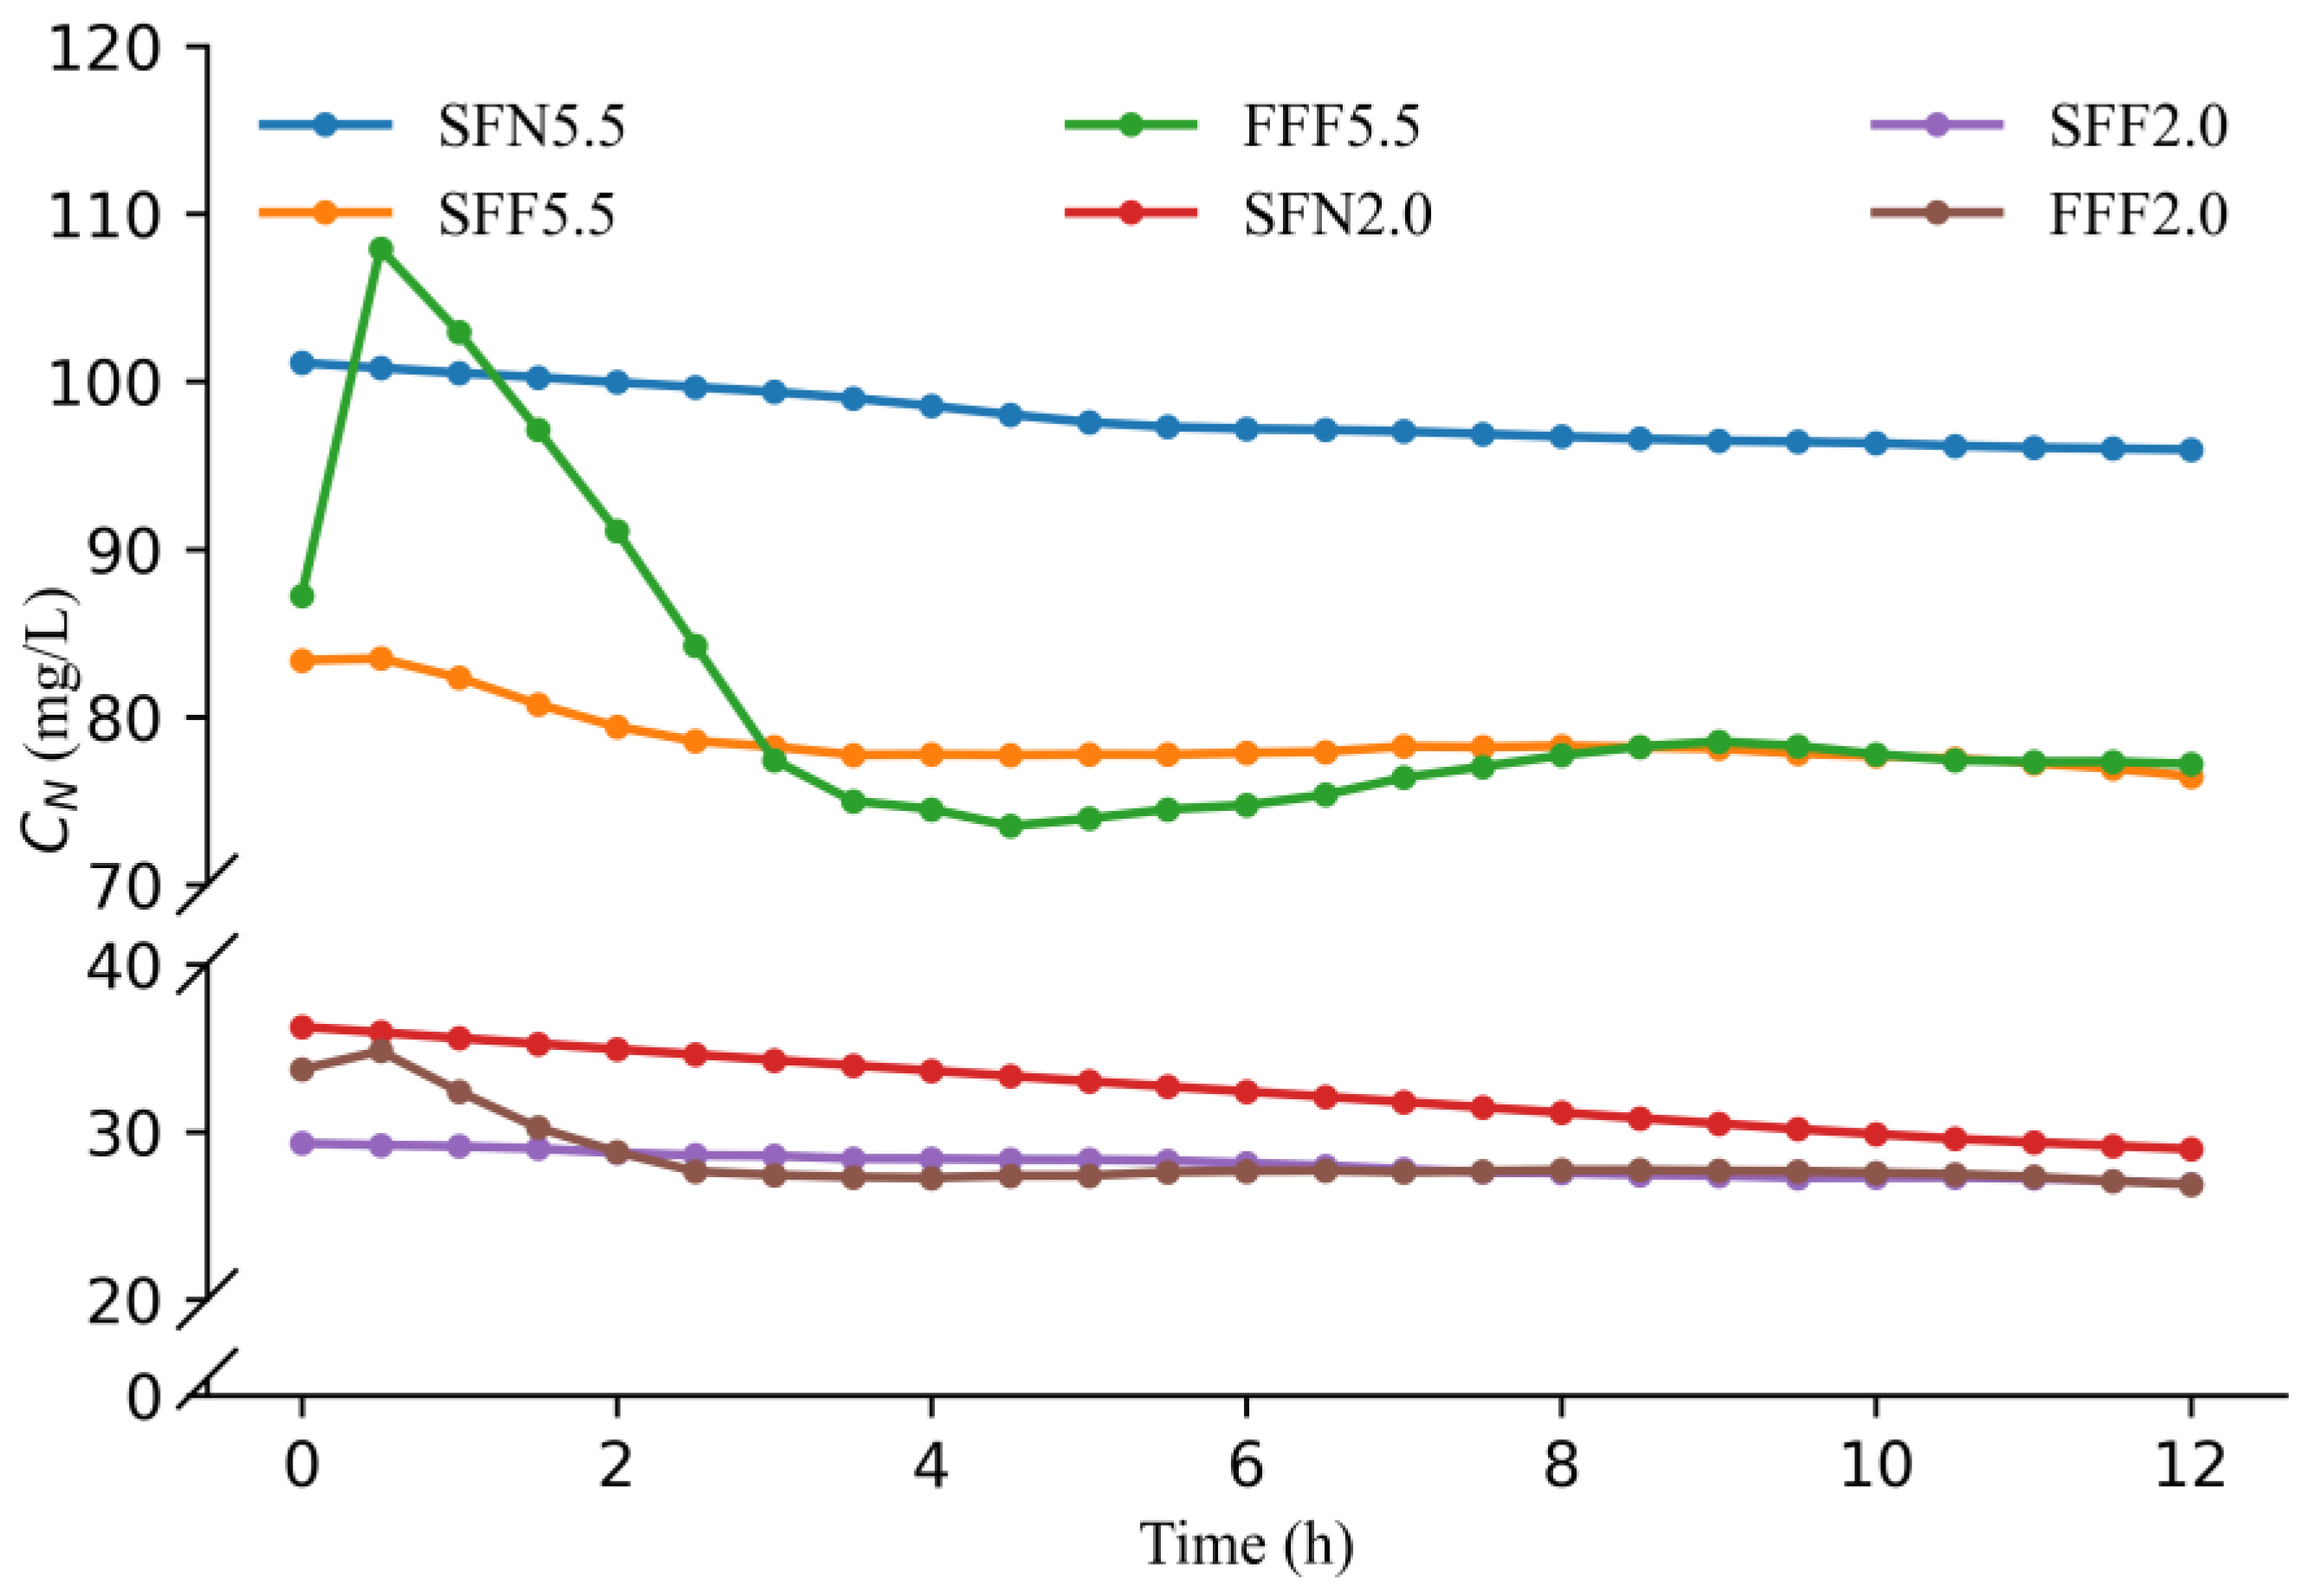
3.3. Dynamic Process of Fertilizer Concentration Changes within 12 h

Figure 6 indicates the trend in the average concentration of 18 monitoring sites in each treatment within 12 h after fertilization. The average concentration of all the SF treatments reached a maximum at the end of fertilization and decreased slowly thereafter; because the fertilizer dissolved and was mixed into the irrigation water evenly as it entered the field, the concentration was not likely to increase. For the FFF5.5 and FFF2.0 treatments, the concentration peaked half an hour after the end of fertilization and then decreased rapidly in the following 2–2.5 h. This result indicated that the granular ammonium bicarbonate that was deposited in the soil in the FF treatments dissolved and diffused vertically in approximately 2–2.5 h. During this process, the diffusion front first reached the EC sensor and traveled further. Thus, the CN increased at first and then decreased to a constant level within the first 2–3 h after fertilization in the FF treatments. With the horizontal diffusion of ammonium bicarbonate in the FF treatment, the uniformity of the ammonium bicarbonate concentration of the field water increased.
Because the fertilizer in the FF treatments was completely dissolved and diffused vertically within 3 h, this period had little effect on the nitrogen utilization of rice since the fertilizer generally remained in the field for several days. Thus, to compare the FF and SF treatments, it is more useful to evaluate the fertilizer distribution uniformity 3 h after fertilization. The uniformity observed in the FF treatment immediately after fertilization underestimated the uniformity of the fertilizer distribution in the FF treatments. Although the difference between SFN and FFF at this timepoint was not as significant as that at the end of fertilization, SFN still significantly improved the uniformity of fertilization. The CU of SFN5.5 and SFN2.0 was 66.97% and 39.75% higher than that of FFF5.5 and FFF2.0 (as shown in Table 4). Whether the consideration was the improvement of the uniformity of fertilization (0 h) or the effect on the growth of rice (>3 h), SFN showed an overwhelming advantage over other treatments. The same conclusions would be supported by the analyzing of DU, Cv, and R in Table 5, Table 6, and Table 7, respectively.

3.4. Implications and Recommendations

The results show that SF automatically controlled the fertilizer concentration at a constant value during the process of fertigation; so, the fertilizer uniformity in the field was much better than that of FF. Therefore, SF can be a better alternative for FF. As SF shows advantages over FF regardless of the fertilization doses, SF is more promising when efficient fertilization practices such as multi-split topdressing fertilizer-N (MST) application [4,5], real-time N management (RTNM) [15,16,17], and site-specific N management (SSNM) [18,19,20] are implemented. These practices have been proven to be more efficient in improving fertilizer utilization and in reducing fertilizer input and nonpoint source pollution.
The uniformity of SFN was significantly higher than that of SFF because it was difficult to mix the original nonfertilized water in the field with the fertilizer-containing water from the fertigation system; therefore, the best scenario for applying fertilizer by SF is when the field is not flooded; so, it is more promising in paddy fields under water-saving irrigation. Therefore, it is better to implement SF in non-flooded fields. The application of water-saving irrigation technology is not only conducive to the formation of non-flooded fields before fertilization, it also facilitates the efficient utilization of nitrogen fertilizer [42,43,44]. Therefore, a combination of paddy fertigation technology and water-saving irrigation technology based on the fertilization system mentioned in this study or similar ones is suggested. These can be more effective in addressing current water shortages and the urgent need to improve the fertilizer utilization rate.
Due to the limitations resulting from the number of available automatic fertilization systems and fertilization windows and the number of plots in the test site during the experiment, we did not set completely strict repetitions for each fertilization scenario; consequently, the results may easily be considered highly accidental and non-repeatable. This should be improved in the subsequent study. We considered this twice at the beginning of the research, but finally, we believed that there was a reliable repeatability for every single variable that was discussed in this paper. For example, for the initial field water condition that had the greatest influence on the uniformity of the SF treatment, two fertilization doses were applied to the flooded fields and non-flooded fields, respectively. From the results, the influence of the initial field water condition on the uniformity of fertilization was basically the same, regardless of the fertilization dose. At the same time, the uniformity of SFN5.5 and SFN2.5, SFF5.5 and SFF2.5 was highly consistent; so, it could be concluded that the fertilization dose was not a factor that interfered with the uniformity of fertilization. We can also explain this result theoretically; for distribution uniformity observation, fertilizer can be considered as an indicator of water movement and mixing; so, the dose of indicator does not interfere with the fertilization uniformity itself. Therefore, we believe that the results of this study and the principles revealed are reliable and universal; these results can also be confirmed by combining them with the results of the automatic fertilization system in our previously published paper [35]. In addition, the experimental results of this study were obtained with a single irrigation port within a 150-square-meter plot. The performance of the equipment for improving the uniformity of fertilizer distribution needs to be further verified in larger paddy fields with multiple irrigation ports.

4. Conclusions

To improve rice precision fertilizer management, this study investigated the effects of two factors, initial field water conditions (flooded, non-flooded) and fertilizer doses (5.5 kg/plot, 2.0 kg/plot), on the uniformity of fertilizer in paddy fields which were fertigated by an automatic fertilization system (SF). The uniformity of manual fertilization by farmers (FF) was given as a comparison. The main conclusions can be summarized as follows:
(1)
SFN achieved the highest uniformity with CU approaching the maximum value (100%), compared with SFF; its CU increased by 35.98% (5.5 kg/plot) and 33.58% (2.0 kg/plot). Probably because the freshly irrigated water did not fully mix with the original water in the paddy fields, they had clear boundaries between them. Compared with FF, the CU of SFN increased by 137.68% and 93.72%.
(2)
Within 12 h after fertilization, the uniformity of the FFF and SFF treatments were significantly improved with the dissolution of solid fertilizer and the diffusion of ions driven by osmotic potential, but they were still unable to transcend SFN, which maintained a high uniformity all along.
(3)
The fertilization dose did not affect the uniformity of SF significantly because fertilizer can be considered as an indicator of water flow movement and mixing during fertigation, and it does not affect anything.
(4)
An automatic fertigation system combined with a water-saving irrigation mode and efficient fertilization management is suggested for paddy fields.

Author Contributions

Conceptualization, H.W. and J.X.; data curation, H.W. and S.L.; formal analysis, H.W. and Y.L.; funding acquisition, H.W., J.X., Y.L. and Y.H.; investigation, S.L.; methodology, H.W. and S.L.; project administration, Q.J. and W.X.; resources, J.X.; software, B.C.; supervision, J.X. and Y.H.; validation, J.X.; visualization, H.L.; writing—original draft, H.W. and S.L. All authors have read and agreed to the published version of the manuscript.

Funding

This research was supported by the Zhejiang Science and Technology Plan Project (No. 2022C02014), the Postgraduate Research & Practice Innovation Program of Jiangsu Province (No. KYCX20_0495), the Fundamental Research Funds for the Central Universities (No. B200203139, No. B210205014), and the Natural Science Foundation of Jiangsu Province (No. BK20210373).

Data Availability Statement

The data presented in this study are available on request from the corresponding author.

Acknowledgments

The authors are grateful to Zhe Gu from Hohai University, for guiding the development and debugging of the equipment used in this study.

Conflicts of Interest

The authors declare no conflict of interest. The funders had no role in the design of the study; in the collection, analyses, or interpretation of data; in the writing of the manuscript; or in the decision to publish the results.

References

  1. He, A.B.; Wang, W.Q.; Jiang, G.L.; Sun, H.J.; Jiang, M.; Man, J.G.; Cui, K.H.; Huang, J.L.; Peng, S.B.; Nie, L.X. Source-sink regulation and its effects on the regeneration ability of ratoon rice. Field Crops Res. 2019, 236, 155–164. [Google Scholar] [CrossRef]
  2. Hu, L.L.; Ren, W.Z.; Tang, J.J.; Li, N.N.; Zhang, J.; Chen, X. The productivity of traditional rice-fish co-culture can be increased without increasing nitrogen loss to the environment. Agric. Ecosyst. Environ. 2013, 177, 28–34. [Google Scholar] [CrossRef]
  3. Shahi, U.P.; Singh, V.K.; Kumar, A.; Upadhyay, P.K.; Rai, P.K. Site-specific nutrient management: Impact on productivity, nutrient uptake and economics of rice-wheat system. Indian J. Agric. Sci. 2022, 92, 195–198. [Google Scholar] [CrossRef]
  4. Chen, Y.T.; Peng, J.; Wang, J.; Fu, P.H.; Hou, Y.; Zhang, C.D.; Fahad, S.; Peng, S.B.; Cui, K.H.; Nie, L.X.; et al. Crop management based on multi-split topdressing enhances grain yield and nitrogen use efficiency in irrigated rice in China. Field Crops Res. 2015, 184, 50–57. [Google Scholar] [CrossRef]
  5. Xu, J.; Liu, B.; Wang, H.; Liu, W.; Li, Y.; Dai, Y.; Lu, T. Ammonia volatilization and nitrogen leaching following top-dressing of urea from water-saving irrigated rice field: Impact of two-split surge irrigation. Paddy Water Environ. 2019, 17, 45–51. [Google Scholar] [CrossRef]
  6. Zhu, J.; Peng, H.; Ji, X.H.; Li, C.J.; Li, S.N. Effects of reduced inorganic fertilization and rice straw recovery on soil enzyme activities and bacterial community in double-rice paddy soils. Eur. J. Soil Biol. 2019, 94, 103116. [Google Scholar] [CrossRef]
  7. Rahman, K.M.A.; Zhang, D.F. Effects of Fertilizer Broadcasting on the Excessive Use of Inorganic Fertilizers and Environmental Sustainability. Sustainability 2018, 10, 759. [Google Scholar] [CrossRef] [Green Version]
  8. Hu, R.F.; Cao, J.M.; Huang, J.K.; Peng, S.B.; Huang, J.L.; Zhong, X.H.; Zou, Y.B.; Yang, J.C.; Buresh, R.J. Farmer participatory testing of standard and modified site-specific nitrogen management for irrigated rice in China. Agric. Syst. 2007, 94, 331–340. [Google Scholar] [CrossRef]
  9. Erisman, J.W.; Galloway, J.N.; Seitzinger, S.; Bleeker, A.; Dise, N.B.; Petrescu, A.M.R.; Leach, A.M.; de Vries, W. Consequences of human modification of the global nitrogen cycle. Philos. Trans. R. Soc. B-Biol. Sci. 2013, 368, 20130116. [Google Scholar] [CrossRef] [Green Version]
  10. Zhao, W.N.; Liang, H.L.; Fu, Y.; Liu, Y.B.; Yang, C.; Zhang, T.; Wang, T.Y.; Rong, L.Y.; Zhang, S.; Wu, Z.X.; et al. Effects of different fertilization modes on rice yield and quality under a rice-crab culture system. PLoS ONE 2020, 15, e0230600. [Google Scholar] [CrossRef]
  11. Wei, H.Y.; Chen, Z.F.; Xing, Z.P.; Zhou, L.; Liu, Q.Y.; Zhang, Z.Z.; Jiang, Y.; Hu, Y.J.; Zhu, J.Y.; Cui, P.Y.; et al. Effects of slow or controlled release fertilizer types and fertilization modes on yield and quality of rice. J. Integr. Agric. 2018, 17, 2222–2234. [Google Scholar] [CrossRef]
  12. MOA. Guidelines for Scientific Rice Fertilization in 2022. Available online: http://www.moa.gov.cn/xw/zxfb/202203/t20220329_6394524.htm (accessed on 9 March 2023).
  13. Gu, B.; Zhang, X.; Lam, S.K.; Yu, Y.; van Grinsven, H.J.M.; Zhang, S.; Wang, X.; Bodirsky, B.L.; Wang, S.; Duan, J.; et al. Cost-effective mitigation of nitrogen pollution from global croplands. Nature 2023, 613, 77–84. [Google Scholar] [CrossRef]
  14. Zhang, W.F.; Cao, G.X.; Li, X.L.; Zhang, H.Y.; Wang, C.; Liu, Q.Q.; Chen, X.P.; Cui, Z.L.; Shen, J.B.; Jiang, R.F.; et al. Closing yield gaps in China by empowering smallholder farmers. Nature 2016, 537, 671–674. [Google Scholar] [CrossRef] [PubMed]
  15. Huang, J.L.; He, F.; Cui, K.H.; Buresh, R.J.; Xu, B.; Gong, W.H.; Peng, S.B. Determination of optimal nitrogen rate for rice varieties using a chlorophyll meter. Field Crops Res. 2008, 105, 70–80. [Google Scholar] [CrossRef]
  16. Ghosh, M.; Swain, D.K.; Jha, M.K.; Tewari, V.K.; Bohra, A. Optimizing chlorophyll meter (SPAD) reading to allow efficient nitrogen use in rice and wheat under rice-wheat cropping system in eastern India. Plant Prod. Sci. 2020, 23, 270–285. [Google Scholar] [CrossRef] [Green Version]
  17. Islam, Z.; Bagchi, B.; Hossain, M. Adoption of leaf color chart for nitrogen use efficiency in rice: Impact assessment of a farmer-participatory experiment in West Bengal, India. Field Crops Res. 2007, 103, 70–75. [Google Scholar] [CrossRef]
  18. Pampolino, M.F.; Manguiat, I.J.; Ramanathan, S.; Gines, H.C.; Tan, P.S.; Chi, T.T.N.; Rajendran, R.; Buresh, R.J. Environmental impact and economic benefits of site-specific nutrient management (SSNM) in irrigated rice systems. Agric. Syst. 2007, 93, 1–24. [Google Scholar] [CrossRef]
  19. Liu, L.J.; Chen, T.T.; Wang, Z.Q.; Zhang, H.; Yang, J.C.; Zhang, J.H. Combination of site-specific nitrogen management and alternate wetting and drying irrigation increases grain yield and nitrogen and water use efficiency in super rice. Field Crops Res. 2013, 154, 226–235. [Google Scholar] [CrossRef]
  20. Rodriguez, D.G.P. An Assessment of the Site-Specific Nutrient Management (SSNM) Strategy for Irrigated Rice in Asia. Agric. -Basel 2020, 10, 559. [Google Scholar] [CrossRef]
  21. Sutton, M.A.; Bleeker, A.; Howard, C.M.; Erisman, J.W.; Zhang, F.S. Our Nutrient World. The Challenge to Produce More Food & Energy with Less Pollution; Centre for Ecology and Hydrology (CEH): Bailrigg, UK, 2013. [Google Scholar]
  22. Wu, Y.Y.; Xi, X.C.; Tang, X.; Luo, D.M.; Gu, B.J.; Lam, S.K.; Vitousek, P.M.; Chen, D.L. Policy distortions, farm size, and the overuse of agricultural chemicals in China. Proc. Natl. Acad. Sci. USA 2018, 115, 7010–7015. [Google Scholar] [CrossRef] [Green Version]
  23. MinTech. Factors that Affect Uniform Fertilizer Application, Even Distribution Can Directly Impact Crop Yield. Available online: https://mintech.com/factors-that-affect-uniform-fertilizer-application/ (accessed on 6 June 2023).
  24. Li, S.; Wei, Q.; Xu, J.; Wang, H.; Zhou, J. Improving Nitrogen Use Efficiency and Growth of Paddy Rice Using Controlled Fertigation. J. Irrig. Drain. 2021, 40, 79–86, (In Chinese with English abstract). [Google Scholar] [CrossRef]
  25. Dong, X.Q.; Song, J.N.; Zhang, J.K.; Kang, X.J.; Wang, J.C. Working performance and experiment on granular fertilizer spreader with cone disk. Trans. Chin. Soc. Agric. Eng. 2013, 29, 33–40, (In Chinese with English abstract). [Google Scholar]
  26. Scheufler, B. Mineral Fertilizing, Yearbook Agricultural Engineering; Max-Eyth-Stiftung: Hessen, Germany, 2010. [Google Scholar]
  27. Song, C.C.; Zang, Y.; Zhou, Z.Y.; Luo, X.W.; Zhao, L.L.; Ming, R.; Zi, L.; Zang, Y. Test and Comprehensive Evaluation for the Performance of UAV-Based Fertilizer Spreaders. IEEE Access 2020, 8, 202153–202163. [Google Scholar] [CrossRef]
  28. Abd Kharim, M.N.; Wayayok, A.; Shariff, A.R.M.; Abdullah, A.F.; Husin, E.M. Droplet deposition density of organic liquid fertilizer at low altitude UAV aerial spraying in rice cultivation. Comput. Electron. Agric. 2019, 167, 105045. [Google Scholar] [CrossRef]
  29. Song, C.; Zhou, Z.; Zang, Y.; Zhao, L.; Yang, W.; Luo, X.; Jiang, R.; Ming, R.; Zang, Y.; Zi, L.; et al. Variable-rate control system for UAV-based granular fertilizer spreader. Comput. Electron. Agric. 2021, 180, 105832. [Google Scholar] [CrossRef]
  30. Xu, T.S.; Su, N.; Wang, R.J.; Song, L.T. A Novel Variable Rate Fertilization System Based on the Android Platform. In Proceedings of the 3rd IEEE International Conference on Progress in Informatcs and Computing (IEEE PIC), Nanjing, China, 18–20 December 2015; pp. 395–398. [Google Scholar]
  31. Vakilian, K.A.; Massah, J. A farmer-assistant robot for nitrogen fertilizing management of greenhouse crops. Comput. Electron. Agric. 2017, 139, 153–163. [Google Scholar] [CrossRef]
  32. Shi, Y.; Hu, Z.; Wang, X.; Odhiambo, M.O.; Ding, W. Motion analysis and system response of fertilizer feed apparatus for paddy Variable-Rate fertilizer spreader. Comput. Electron. Agric. 2018, 153, 239–247. [Google Scholar] [CrossRef]
  33. Sharmiladevi, R.; Ravikumar, V. Simulation of nitrogen fertigation schedule for drip irrigated paddy. Agric. Water Manag. 2021, 252, 106841. [Google Scholar] [CrossRef]
  34. Li, Y.W.; Xu, J.Z.; Liu, X.Y.; Liu, B.Y.; Liu, W.X.; Jiao, X.Y.; Zhou, J.Y. Win-win for monosodium glutamate industry and paddy agriculture: Replacing chemical nitrogen with liquid organic fertilizer from wastewater mitigates reactive nitrogen losses while sustaining yields. J. Clean. Prod. 2022, 347, 131287. [Google Scholar] [CrossRef]
  35. Wang, H.; Gu, Z.; Xu, J.; Li, S.; Qi, Z.; Li, Y.; Zhou, J. Automatic variable rate fertilisation system for improved fertilisation uniformity in paddy fields. Biosyst. Eng. 2022, 219, 56–67. [Google Scholar] [CrossRef]
  36. Qi, L.; Niu, H.D.; Zhou, P.; Jia, R.J.; Gao, M. Effects of Biochar on the Net Greenhouse Gas Emissions under Continuous Flooding and Water-Saving Irrigation Conditions in Paddy Soils. Sustainability 2018, 10, 1403. [Google Scholar] [CrossRef] [Green Version]
  37. MOA. Paddy Controlled Irrigation Area Reached 30 million Mu in Heilongjiang Province. Available online: http://www.moa.gov.cn/xw/zxfb/202203/t20220329_6394524.htm (accessed on 9 March 2023).
  38. Redhyka, G.G.; Setiawan, D.; Soetraprawata, D. Embedded Sensor Fusion and Moving-average Filter for Inertial Measurement Unit (IMU) on the Microcontroller-based Stabilized Platform. In Proceedings of the International Conference on Automation, Cognitive Science, Optics, Micro Electro-Mechanical System, and Information Technology (ICACOMIT), Lipi Balai Pengembangan Instrumentasi, Bandung, Indonesia, 29–30 October 2015; pp. 72–77. [Google Scholar]
  39. Xiong, J.B.; Wang, Q.R.; Wan, J.F.; Ye, B.Y.; Xu, W.C.; Liu, J.Q. Detection of Outliers in Sensor Data Based on Adaptive Moving Average Fitting. Sens. Lett. 2013, 11, 877–882. [Google Scholar] [CrossRef]
  40. Bourg, I.C.; Richter, F.M.; Christensen, J.N.; Sposito, G. Isotopic mass dependence of metal cation diffusion coefficients in liquid water. Geochim. Et Cosmochim. Acta 2010, 74, 2249–2256. [Google Scholar] [CrossRef] [Green Version]
  41. Wanner, P.; Hunkeler, D. Isotope fractionation due to aqueous phase diffusion—What do diffusion models and experiments tell?—A review. Chemosphere 2019, 219, 1032–1043. [Google Scholar] [CrossRef] [PubMed]
  42. Xu, J.; Peng, S.; Yang, S.; Wang, W. Ammonia volatilization losses from a rice paddy with different irrigation and nitrogen managements. Agric. Water Manag. 2012, 104, 184–192. [Google Scholar] [CrossRef]
  43. Peng, S.-Z.; Yang, S.-H.; Xu, J.-Z.; Luo, Y.-F.; Hou, H.-J. Nitrogen and phosphorus leaching losses from paddy fields with different water and nitrogen managements. Paddy Water Environ. 2011, 9, 333–342. [Google Scholar] [CrossRef]
  44. Qiu, H.N.; Yang, S.H.; Jiang, Z.W.; Xu, Y.; Jiao, X.Y. Effect of Irrigation and Fertilizer Management on Rice Yield and Nitrogen Loss: A Meta-Analysis. Plants 2022, 11, 1690. [Google Scholar] [CrossRef]
Figure 1. The experimental plots.
Agronomy 13 01629 g001
Figure 2. Fertilization system and test scenario.
Agronomy 13 01629 g002
Figure 3. Conductivity sensor network layout (a) and EC sensor (b).
Agronomy 13 01629 g003
Figure 4. Field N (mg/L) concentration distribution diagrams of each test scenario at different times.
Agronomy 13 01629 g004aAgronomy 13 01629 g004b
Figure 5. Increases in CU in each treatment within the first 12 h after fertilization.
Agronomy 13 01629 g005
Figure 6. Field nitrogen concentration in plots with different treatments.
Agronomy 13 01629 g006
Table 1. Test scenarios.
AbbreviationFertilization MethodInitial Field StatusFertilizer Dosage
FFF5.5FFFlooded, ≈6.0 cm5.5 kg/plot
SFF5.5SFFlooded, ≈2.0 cm5.5 kg/plot
FFF2.0FFFlooded, ≈6.0 cm2.0 kg/plot
SFF2.0SFFlooded, ≈2.0 cm2.0 kg/plot
SFN2.0SFNon-Flooded2.0 kg/plot
SFN5.5SFNon-Flooded5.5 kg/plot
Table 2. The indicators of uniformity evaluation.
IndicatorEquationVariable
Christiansen Uniformity Coefficient (CU, %) C U = 1 i = 1 M x i x M x × 100 where x i is the i-th observation of the N concentration (mg/L); x is the mean N concentration (mg/L); M is the number of observation points, M = 18; x l q is the mean value of the smaller quarter of M observations (mg/L); C M m a x and C M m i n are the maximum and minimum N concentrations from M observations (mg/L), respectively.
Uniformity of Distribution (DU) D U = x l q x
Coefficient of Variation (Cv) C v = 1 x 1 M 1 i = 1 M x i x 2
Range (R, mg/L) R = C M m a x C M m i n
Table 3. N distribution uniformity in different test scenarios.
TreatmentTime (h)CU (%)DUCVR (mg/L)
SFN5.5097.120.960.0310.21
197.150.960.039.23
297.360.960.038.88
397.260.960.039.46
696.980.960.0310.16
1296.770.960.0412.21
SFF5.5071.420.550.3273.75
175.340.610.2866.56
277.880.670.2557.55
379.860.690.2355.31
683.480.760.1943.83
1288.890.840.1326.65
FFF5.5040.860.300.81273.36
146.500.340.71260.25
244.600.390.75242.58
358.250.450.54154.63
665.700.570.4095.08
1268.040.590.3888.46
SFN2.0095.340.920.055.57
195.420.920.055.45
295.470.920.055.81
395.520.930.055.74
695.660.930.055.49
1295.360.930.065.50
SFF2.0071.370.500.3429.26
171.730.510.3428.99
271.920.510.3428.01
372.940.530.3327.17
678.130.620.2621.77
1285.480.790.1714.21
FFF2.0049.210.270.5754.82
152.460.350.5349.46
261.340.450.4442.64
368.350.530.3733.83
678.660.680.2624.50
1282.260.720.2221.81
Table 4. Relative increase in CU among treatments at the end of fertilization (%).
CU (%)SFN5.5SFF5.5FFF5.5SFN2.0SFF2.0FFF2.0
97.1271.4240.8695.3471.3749.21
SFN5.597.120.00−26.46−57.93−1.83−26.51−49.33
SFF5.571.4235.980.00−42.7933.49−0.07−31.09
FFF5.540.86137.6874.790.00133.3274.6720.44
SFN2.095.341.87−25.09−57.140.00−25.14−48.38
SFF2.071.3736.080.07−42.7533.580.00−31.04
FFF2.049.2197.3445.12−16.9793.7245.020.00
Table 5. Relative increase in DU among treatments at the end of fertilization (%).
DUSFN5.5SFF5.5FFF5.5SFN2.0SFF2.0FFF2.0
0.960.550.300.920.500.27
SFN5.50.960.00−42.95−68.29−3.53−47.74−71.65
SFF5.50.5575.300.00−44.4169.10−8.39−50.30
FFF5.50.30215.3279.880.00204.1864.78−10.60
SFN2.00.923.66−40.86−67.120.00−45.83−70.61
SFF2.00.5091.359.16−39.3184.590.00−45.75
FFF2.00.27252.71101.2111.86240.2584.320.00
Table 6. Relative decrease in Cv among treatments at the end of fertilization (%).
CvSFN5.5SFF5.5FFF5.5SFN2.0SFF2.0FFF2.0
0.030.320.810.050.340.57
SFN5.50.030.00−848.81−2288.76−58.68−901.25−1574.32
SFF5.50.3289.460.00−151.7683.28-5.53−76.47
FFF5.50.8195.8160.280.0093.3658.0929.91
SFN2.00.0536.98−497.93−1405.360.00−530.97−955.13
SFF2.00.3490.015.24−138.5884.150.00−67.22
FFF2.00.5794.0343.33−42.6790.5240.200.00
Table 7. Absolute reduction in R among treatments at the end of fertilization (mg/L).
R (mg/L)SFN5.5SFF5.5FFF5.5SFN2.0SFF2.0FFF2.0
10.2173.75273.365.5729.2654.82
SFN5.510.210.00−63.54−263.15---
SFF5.573.7563.540.00−199.61---
FFF5.5273.36263.15199.610.00---
SFN2.05.57---0.00−23.69−49.26
SFF2.029.26---23.690.00−25.57
FFF2.054.82---49.2625.570.00
‘-’ indicates no comparison between the different fertilization doses.
Disclaimer/Publisher’s Note: The statements, opinions and data contained in all publications are solely those of the individual author(s) and contributor(s) and not of MDPI and/or the editor(s). MDPI and/or the editor(s) disclaim responsibility for any injury to people or property resulting from any ideas, methods, instructions or products referred to in the content.

