3.1. Isotherms and Thermodynamics
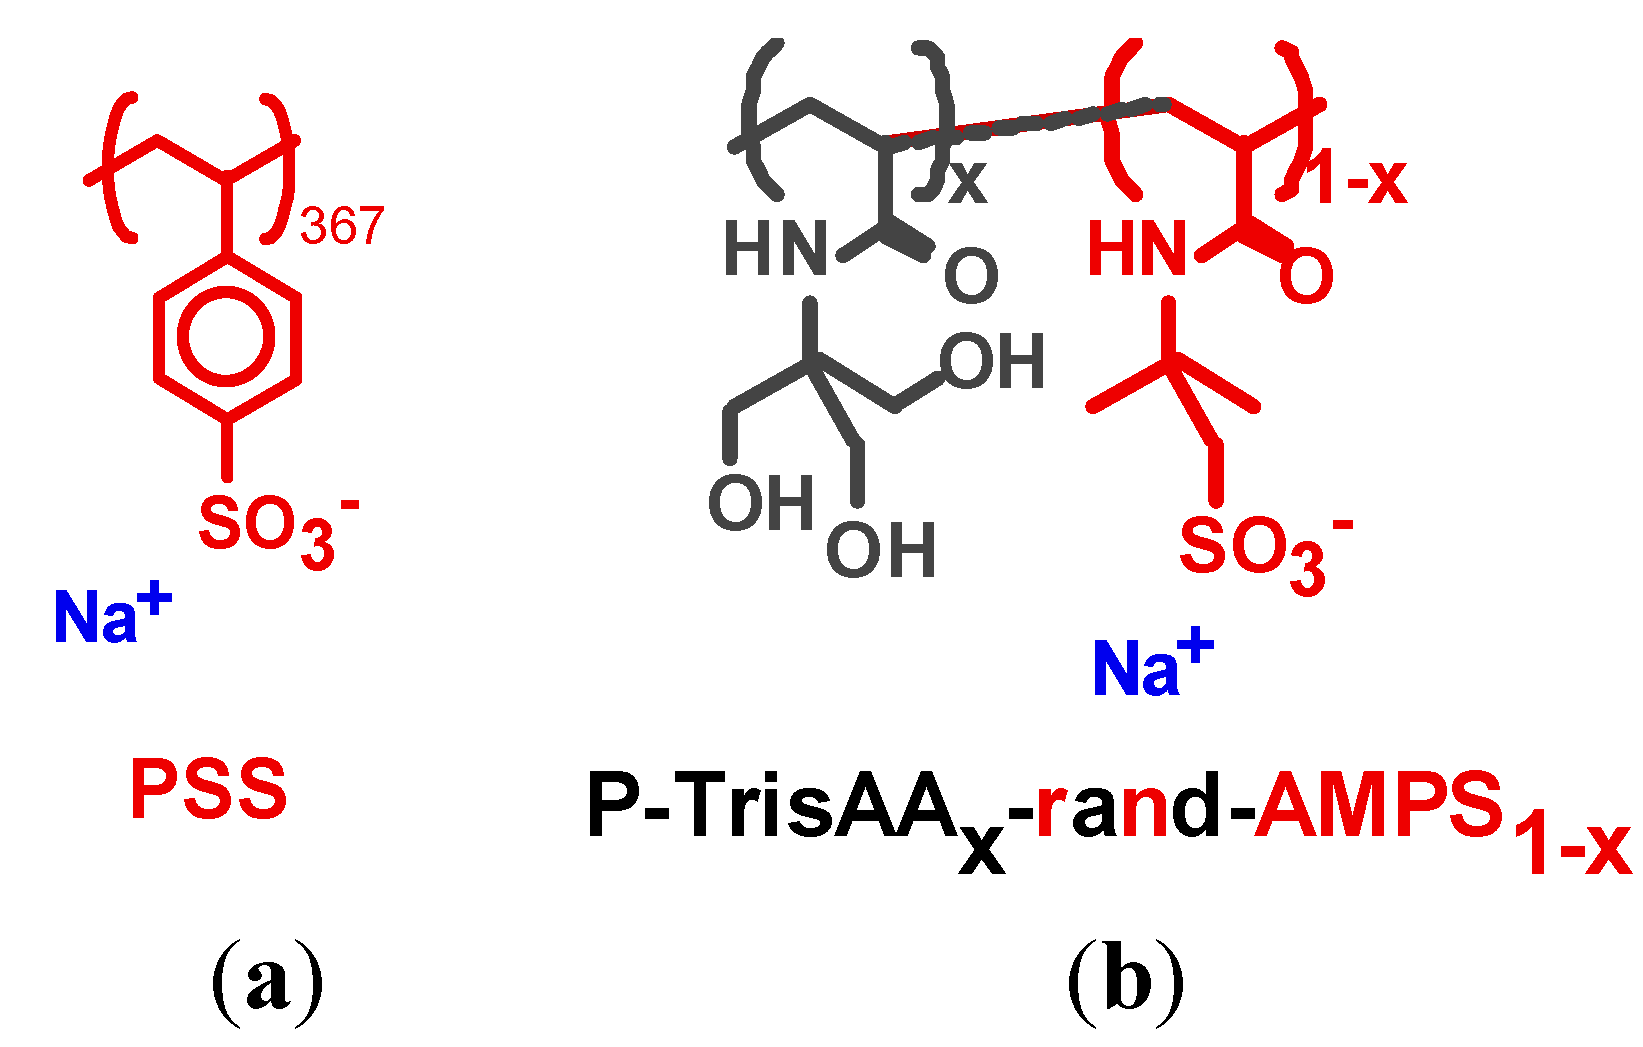
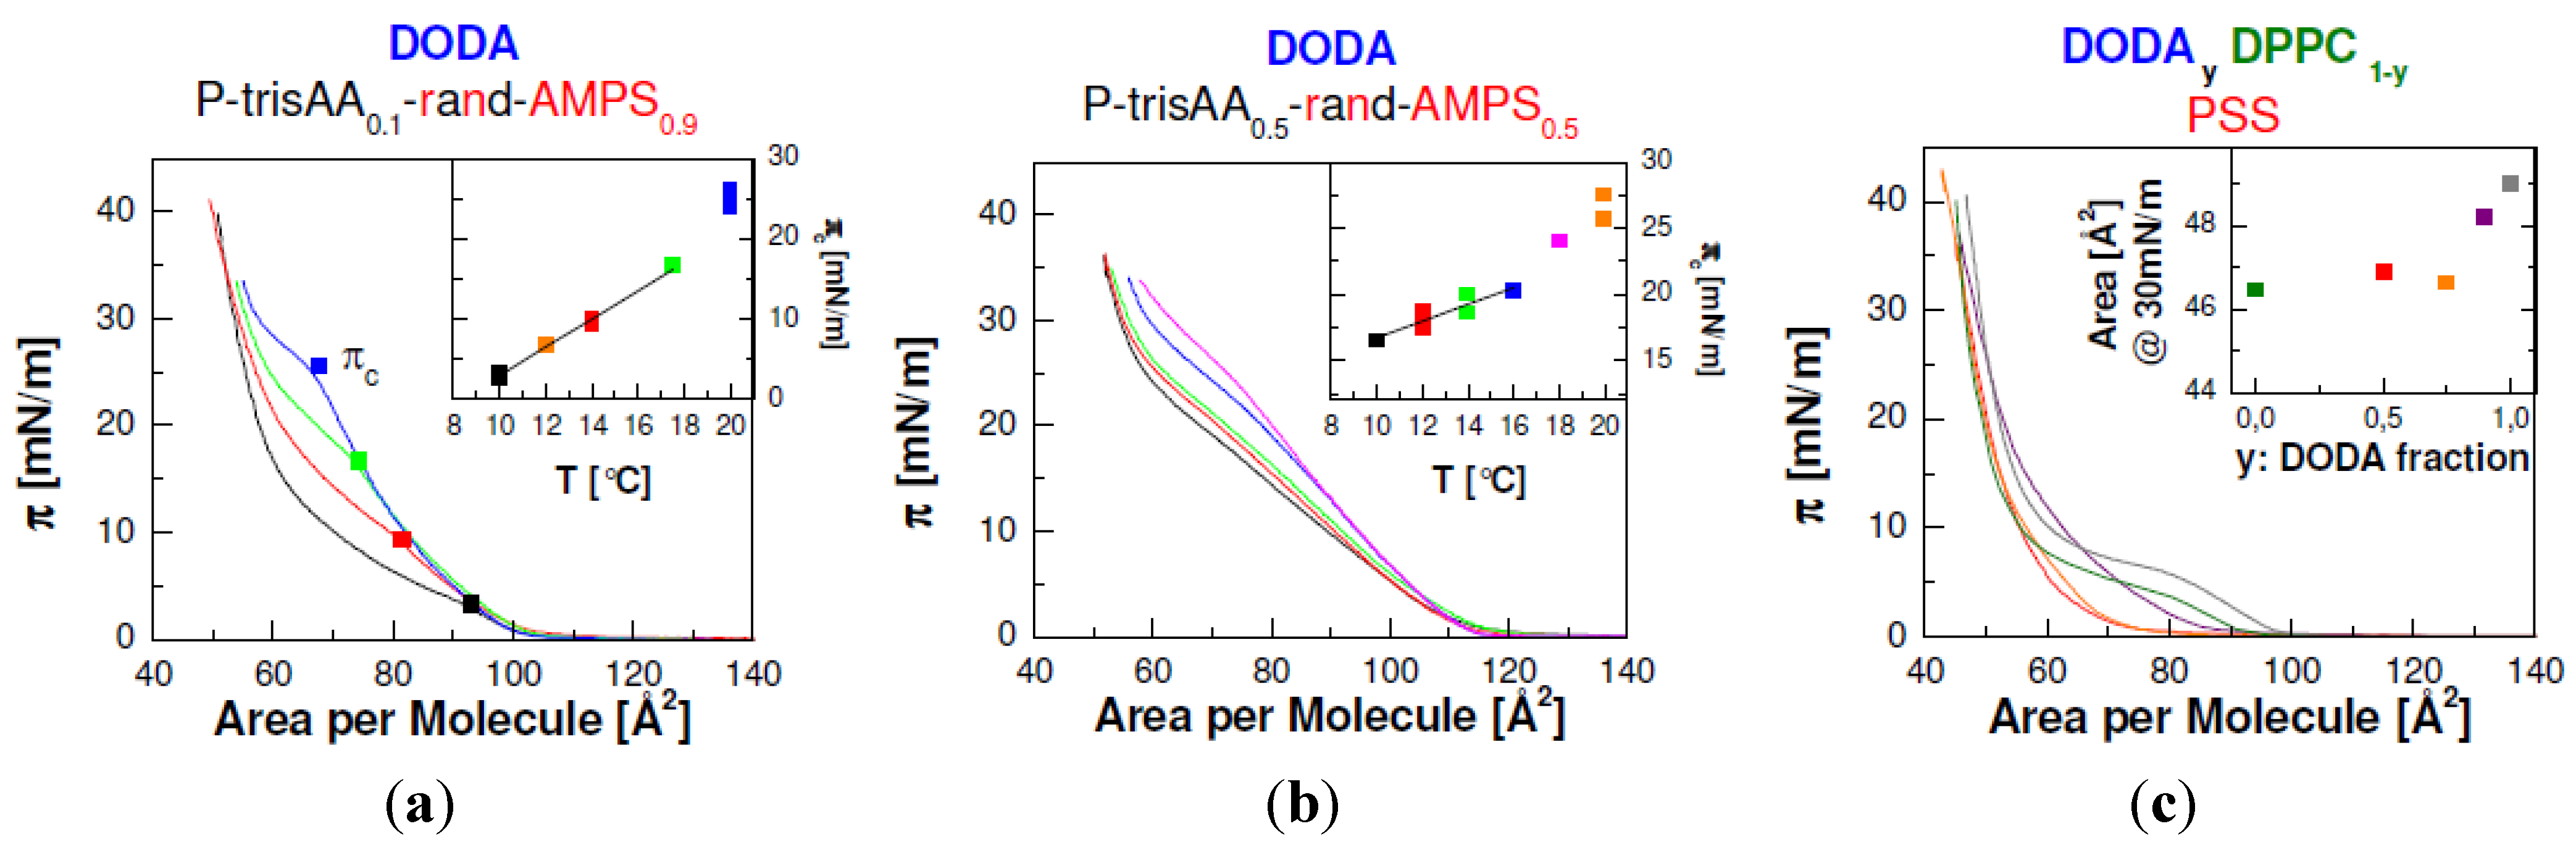
Figure 1 shows a series of π-A isotherms of lipid monolayers with adsorbed P–TrisAA
x–rand–AMPS
1−x, for
x = 0.1 and 0.5. Each isotherm has the typical shape known from fatty acid or phospholipid monolayers [
1]. The fluid phase of the lipids is marked by an increase in surface pressure π
c on monolayer compression. A break in the slope at π
c marks the onset of the LE/LC phase transition. The isotherms show the typical plateau indicative of the coexistence of lipids in the LE and LC phase. π
c is determined by fitting two straight lines to the isotherm, one at the end of the LE phase and one at the beginning of the plateau region. π
c is assigned to the intersection. At the end of the coexistence region, the lipids are in the LC phase and π increases steeply.
Figure 1.
Surface pressure—area isotherms of lipid monolayers on 0.01 mmol/L PE solution (with respect to the monomer concentration). (a,b): dioctadecyldimethylammonium (DODA) isotherms with the statistical copolymer P–TrisAAx–rand–AMPS1−x at temperatures indicated. ((a) x = 0.9; (b) x = 0.5). The surface pressure πc marks the onset of the LE/LC phase transition. The temperature dependence of πc is shown in the insets. (c) π–A isotherms of DODA/DPPC mixtures at 20 °C with PSS (Mw = 77 kDa) in the subphase. The composition of the monolayer is varied. The inset shows the average area per molecule at 30 mN/m.
For each system the temperature is varied. As expected, the phase transition pressure π
c increases on heating. However, the temperature dependence of π
c depends on the composition of the statistical copolymer: if the charged monomers AMPS form 90% of the statistical copolymer, the temperature dependence is strong (∂π
c / ∂
T = 1.76 mN/(m·K)). However, if the fraction of charged monomers is decreased to 50%, then the temperature dependence is decreased by more than a factor of two (∂π
c / ∂
T = 0.68 mN/(m·K), see
Table 1). Additionally,
Figure 1 shows the isotherms of DODA/DPPC mixtures with PSS in the subphase. If the lipid monolayer consists of either pure DODA or pure DPPC, the isotherms show a clear LE/LC phase transition. When the monolayer consists of 90% or 75% DODA, the pressure increases at 90 Å
2/molecule, suggesting some fluid lipids. However, the decrease of the transition pressure π
c is attributed to the changed head group interactions of the mixed lipid monolayer. Note that DODA, DPPC and dipamitoylphosphatidylehtanolamine (DPPE) have the same saturated alkyl tails with 16 C-atoms (note that for DODA two C-atoms of each hydrocarbon chain are attributed to the head group). DPPE shows no fluid phase at 20 °C [
1,
28]. Therefore, the in-plane attraction of the alkyl tails is strong. However, DODA and DPPC show a clear LE/LC phase transition. Therefore, one has to introduce an additional repulsion between the lipids which is attributed to the head group interaction. In the case of DODA, the liquefying effect is due to electrostatic head group repulsion [
13,
24]. For DPPC, the repulsion is due to the bulky head groups whose space requirements introduce an additional repulsive force between the lipid molecules. The head-groups of DPPC are zwitter-ionic; they do not repel each other electrostatically [
1,
29].
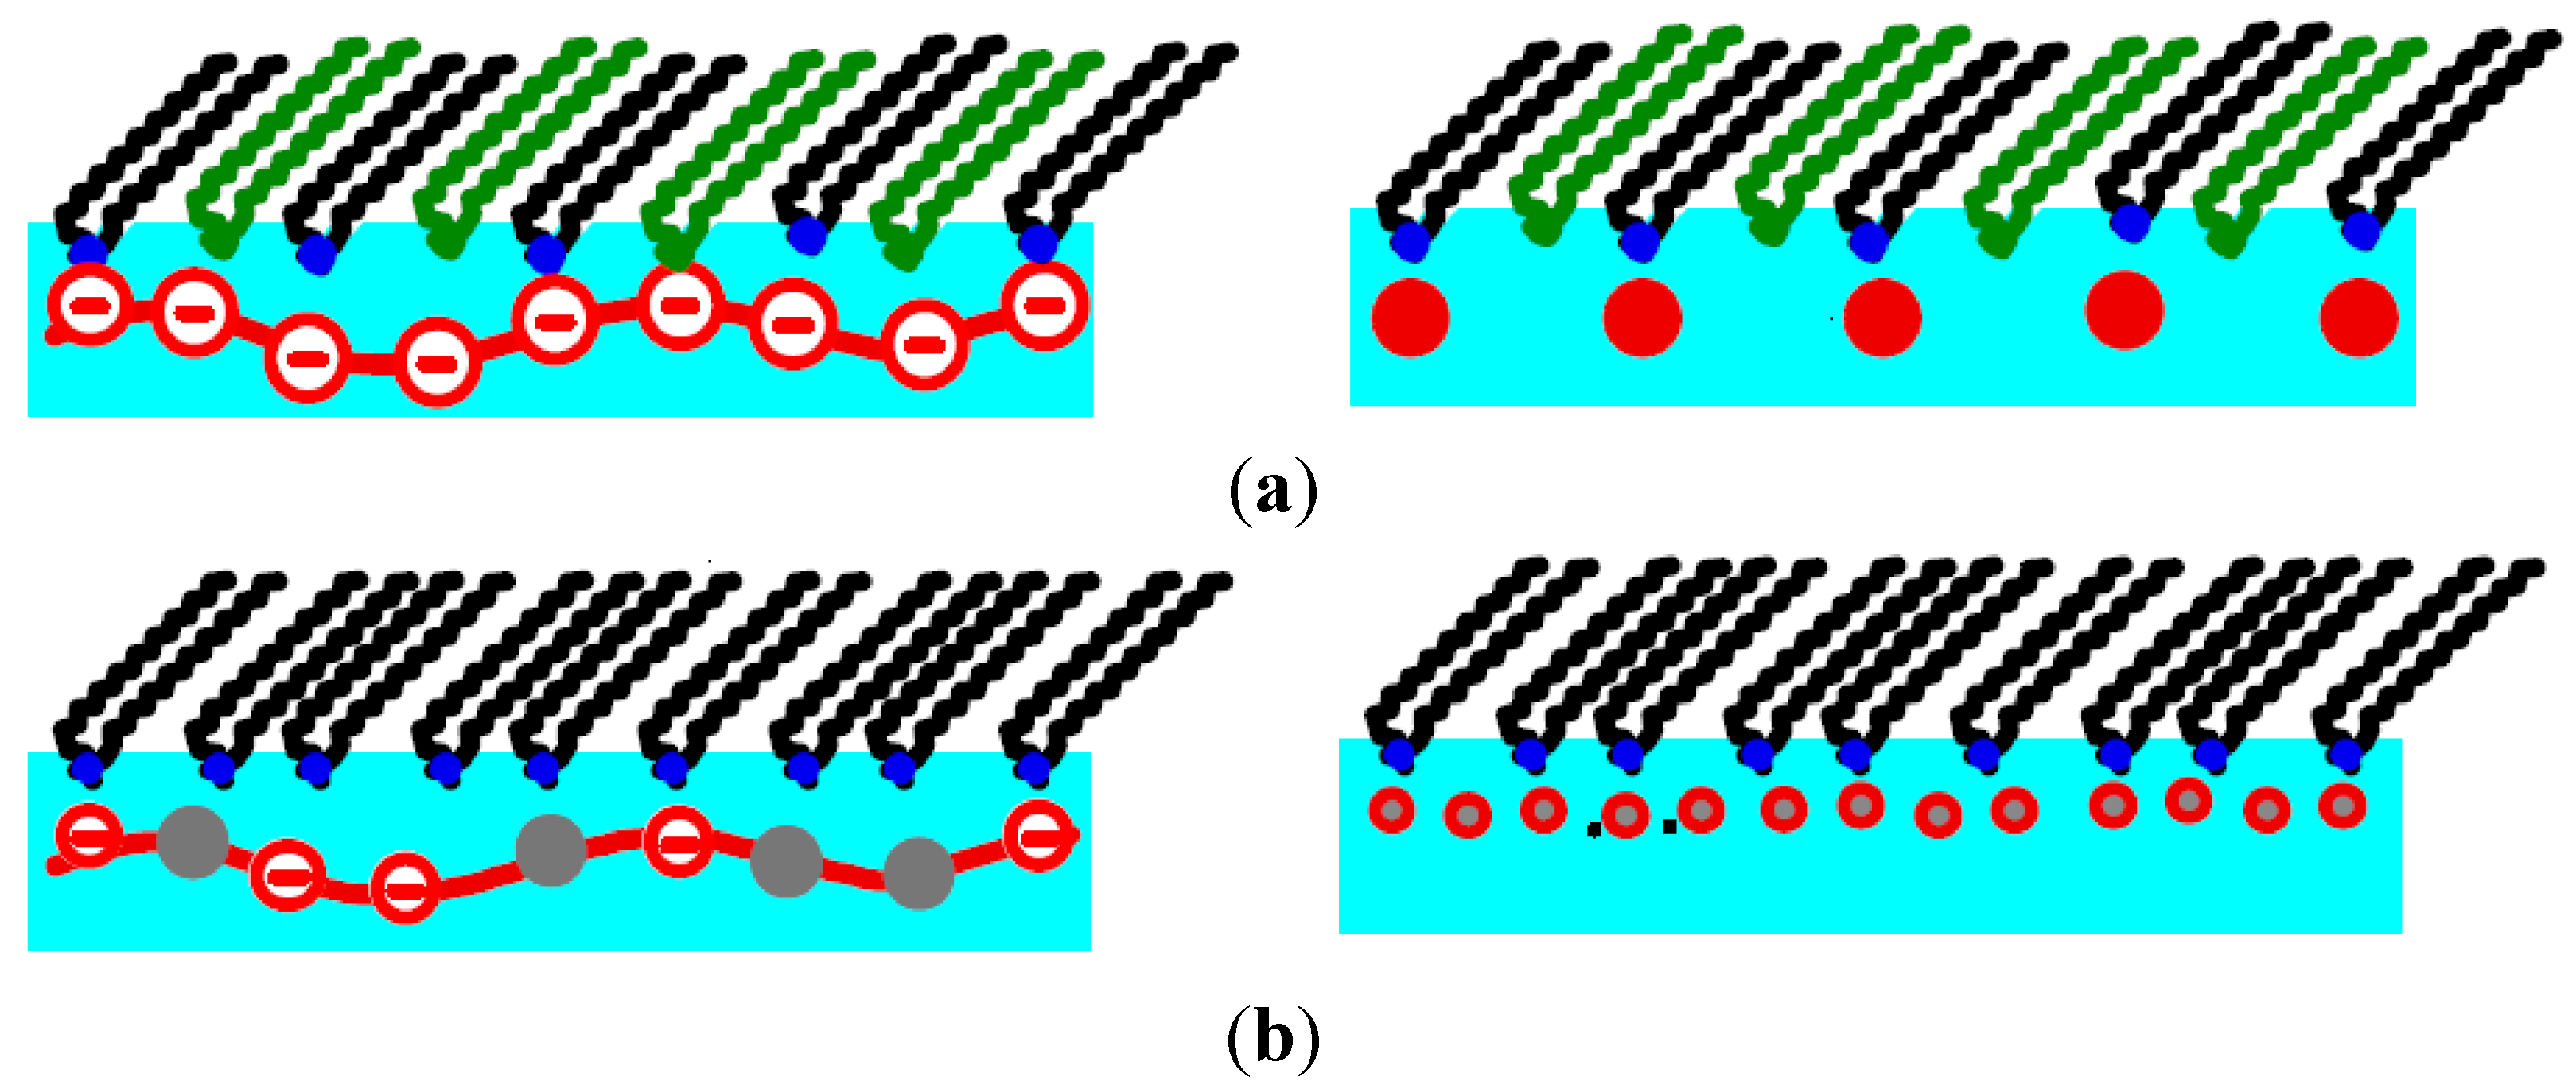
The repulsion between the head groups of DODA and DPPC have different physical origins. Therefore, mixing the two lipids reduces both the DODA–DODA and DPPC–DPPC repulsion. In the LC phase, the average distance between the charged DODA head groups is increased compared to a pure DODA monolayer. Therefore, the electrostatic repulsion of the DODA head groups is reduced.
Table 1.
The temperature dependence of the phase transition pressure dπ
c/d
T of DODA monolayers as function of the adsorbed PE molecules. When polystyrene sulfonate (PSS) is adsorbed, dπ
c/d
T decreases with the molecular weight of PSS by a factor of two, until
Mw (PSS) = 16 kDa is reached (superscript “1” indicates data from [
14]). The composition of the statistical copolymer P–TrisAA
x–rand–AMPS
1−x influences dπ
c/d
T. The subphase concentration of all PEs is 0.01 mmol/L in monomer units.
Table 1.
The temperature dependence of the phase transition pressure dπc/dT of DODA monolayers as function of the adsorbed PE molecules. When polystyrene sulfonate (PSS) is adsorbed, dπc/dT decreases with the molecular weight of PSS by a factor of two, until Mw (PSS) = 16 kDa is reached (superscript “1” indicates data from [14]). The composition of the statistical copolymer P–TrisAAx–rand–AMPS1−x influences dπc/dT. The subphase concentration of all PEs is 0.01 mmol/L in monomer units.
| DODA monolayer | ![Polymers 06 01999 i001]() (mN/(m·K)) (mN/(m·K)) |
|---|
| PSS (4 kDa)1 | 1.58 |
| PSS (6.5 kDa)1 | 1.28 |
| PSS (8.6 kDa)1 | 1.04 |
| PSS (16, 33, 77, 168, 1330 kDa)1 | 0.85 ± 0.05 |
| P–trisAA0.1–rand–AMPS0.9 | 1.76 |
| P–trisAA0.5–rand–AMPS0.5 | 0.68 |
Furthermore, the steric repulsion of the DPPC head-groups is decreased, due to the incorporation of small DODA head groups in the monolayer. The decreased head group repulsion solidifies the lipid monolayer, and the LE/LC phase transition pressure πc of the lipid mixtures is reduced.
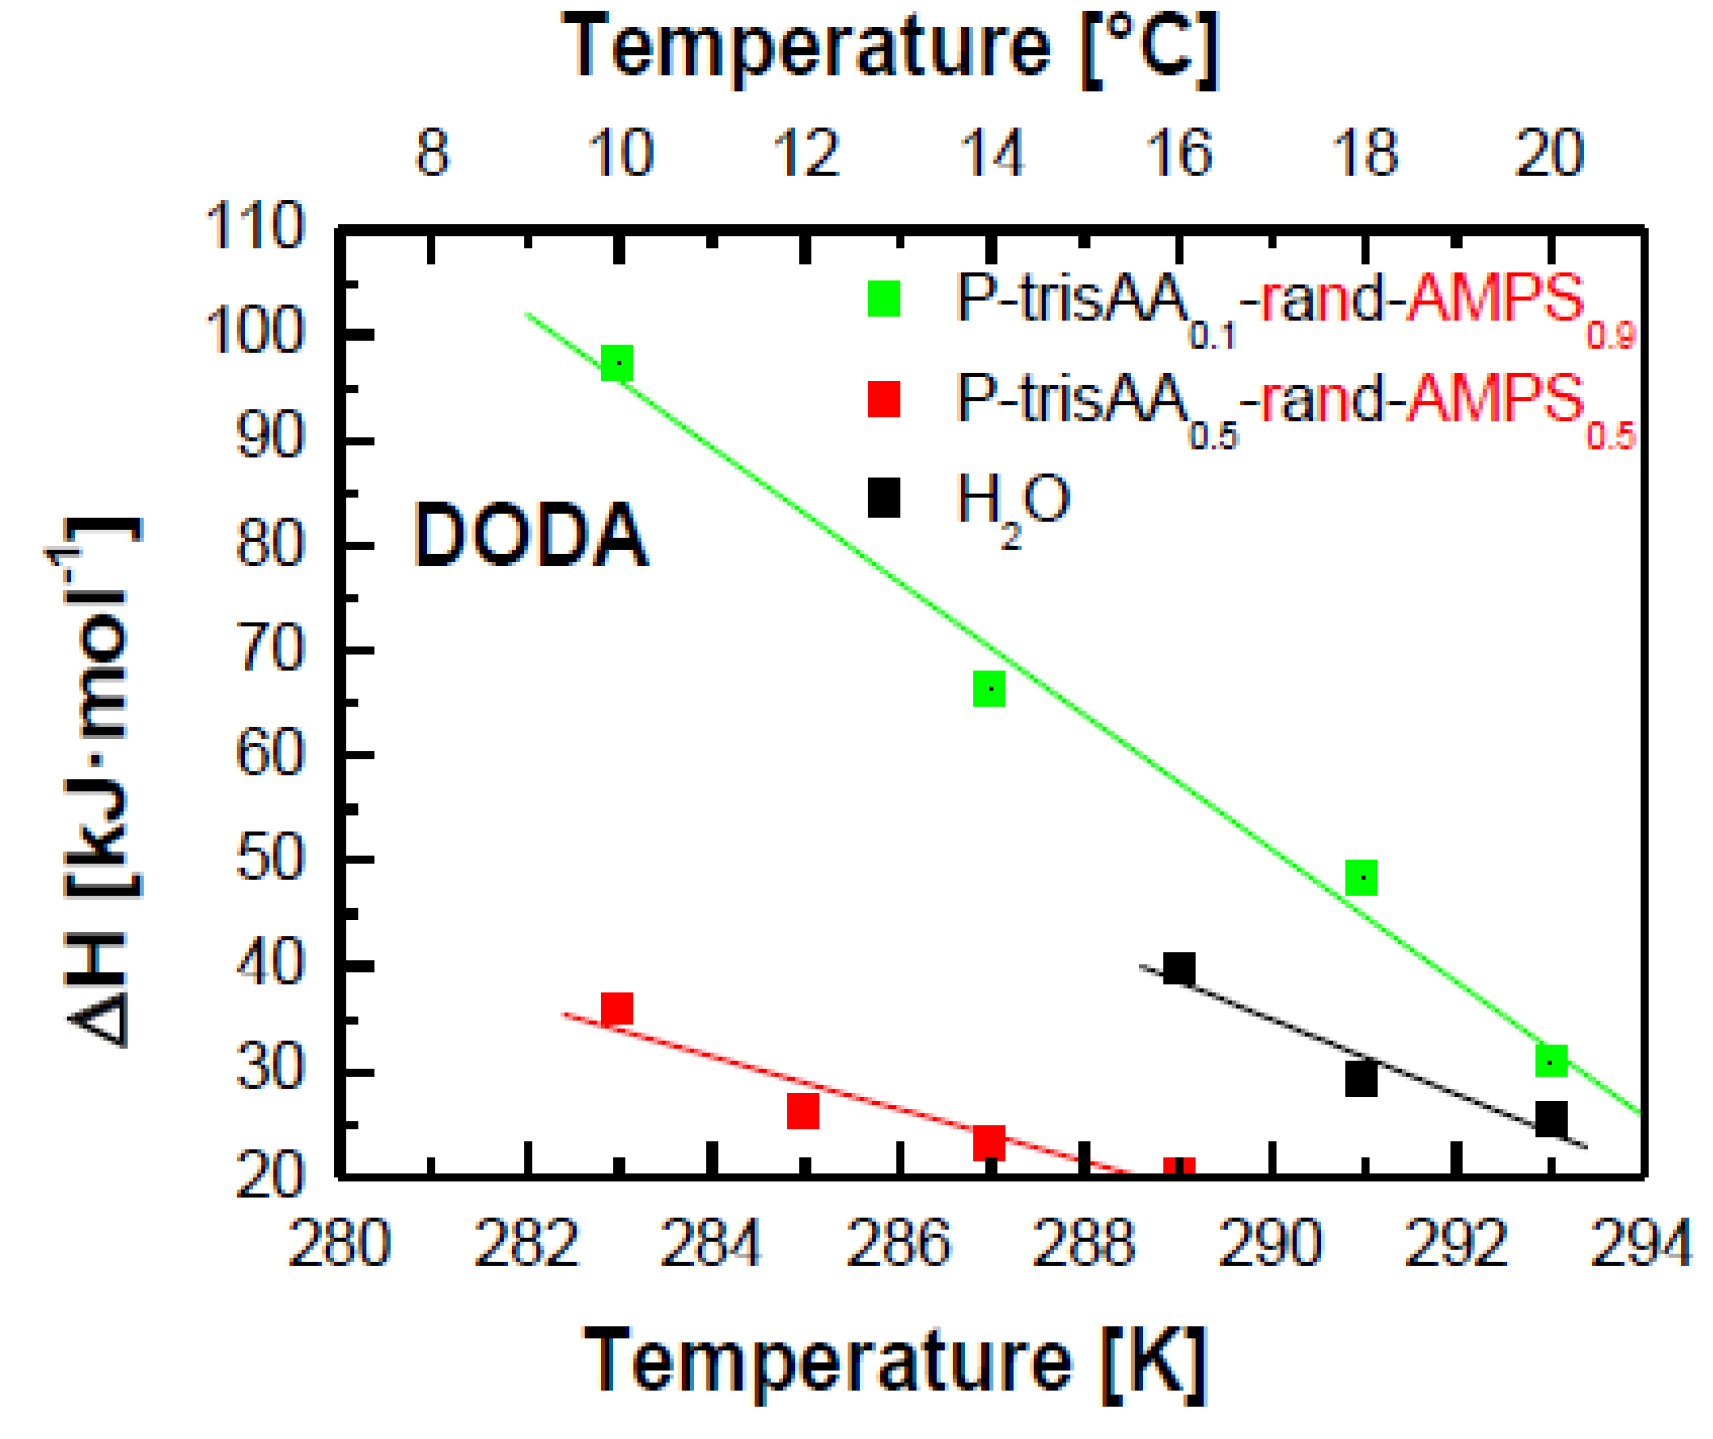
To better understand the LE/LC phase transition of the monolayers, the transition enthalpy ∆
H is calculated according to the two-dimensional Clausius-Clapeyron equation:
T denotes the temperature and
NA the Avogradro constant.
Afl and
As are the molecular areas in the fluid and gel phase, respectively. In
Figure 2 the temperature dependence of ∆
H of DODA monolayers with different adsorbed PEs is shown. The strongest temperature dependence is found with adsorbed statistical copolymer consisting of 90% charged AMPS, the weakest when the copolymer consists of 50% charged AMPS. DODA on pure water is in-between.
Figure 2.
Transition Enthalpy ∆H of DODA monolayers on pure water (black) and with statistical copolymer P–trisAAx–rand–AMPS1−x (x = 0.1 green, 0.5 red) in the subphase. The concentration of P–trisAAx–rand–AMPS1−x is 0.01mmol/L in monomer units.
Figure 2.
Transition Enthalpy ∆H of DODA monolayers on pure water (black) and with statistical copolymer P–trisAAx–rand–AMPS1−x (x = 0.1 green, 0.5 red) in the subphase. The concentration of P–trisAAx–rand–AMPS1−x is 0.01mmol/L in monomer units.
3.2. Lamellar Phase and Adsorbed PEs
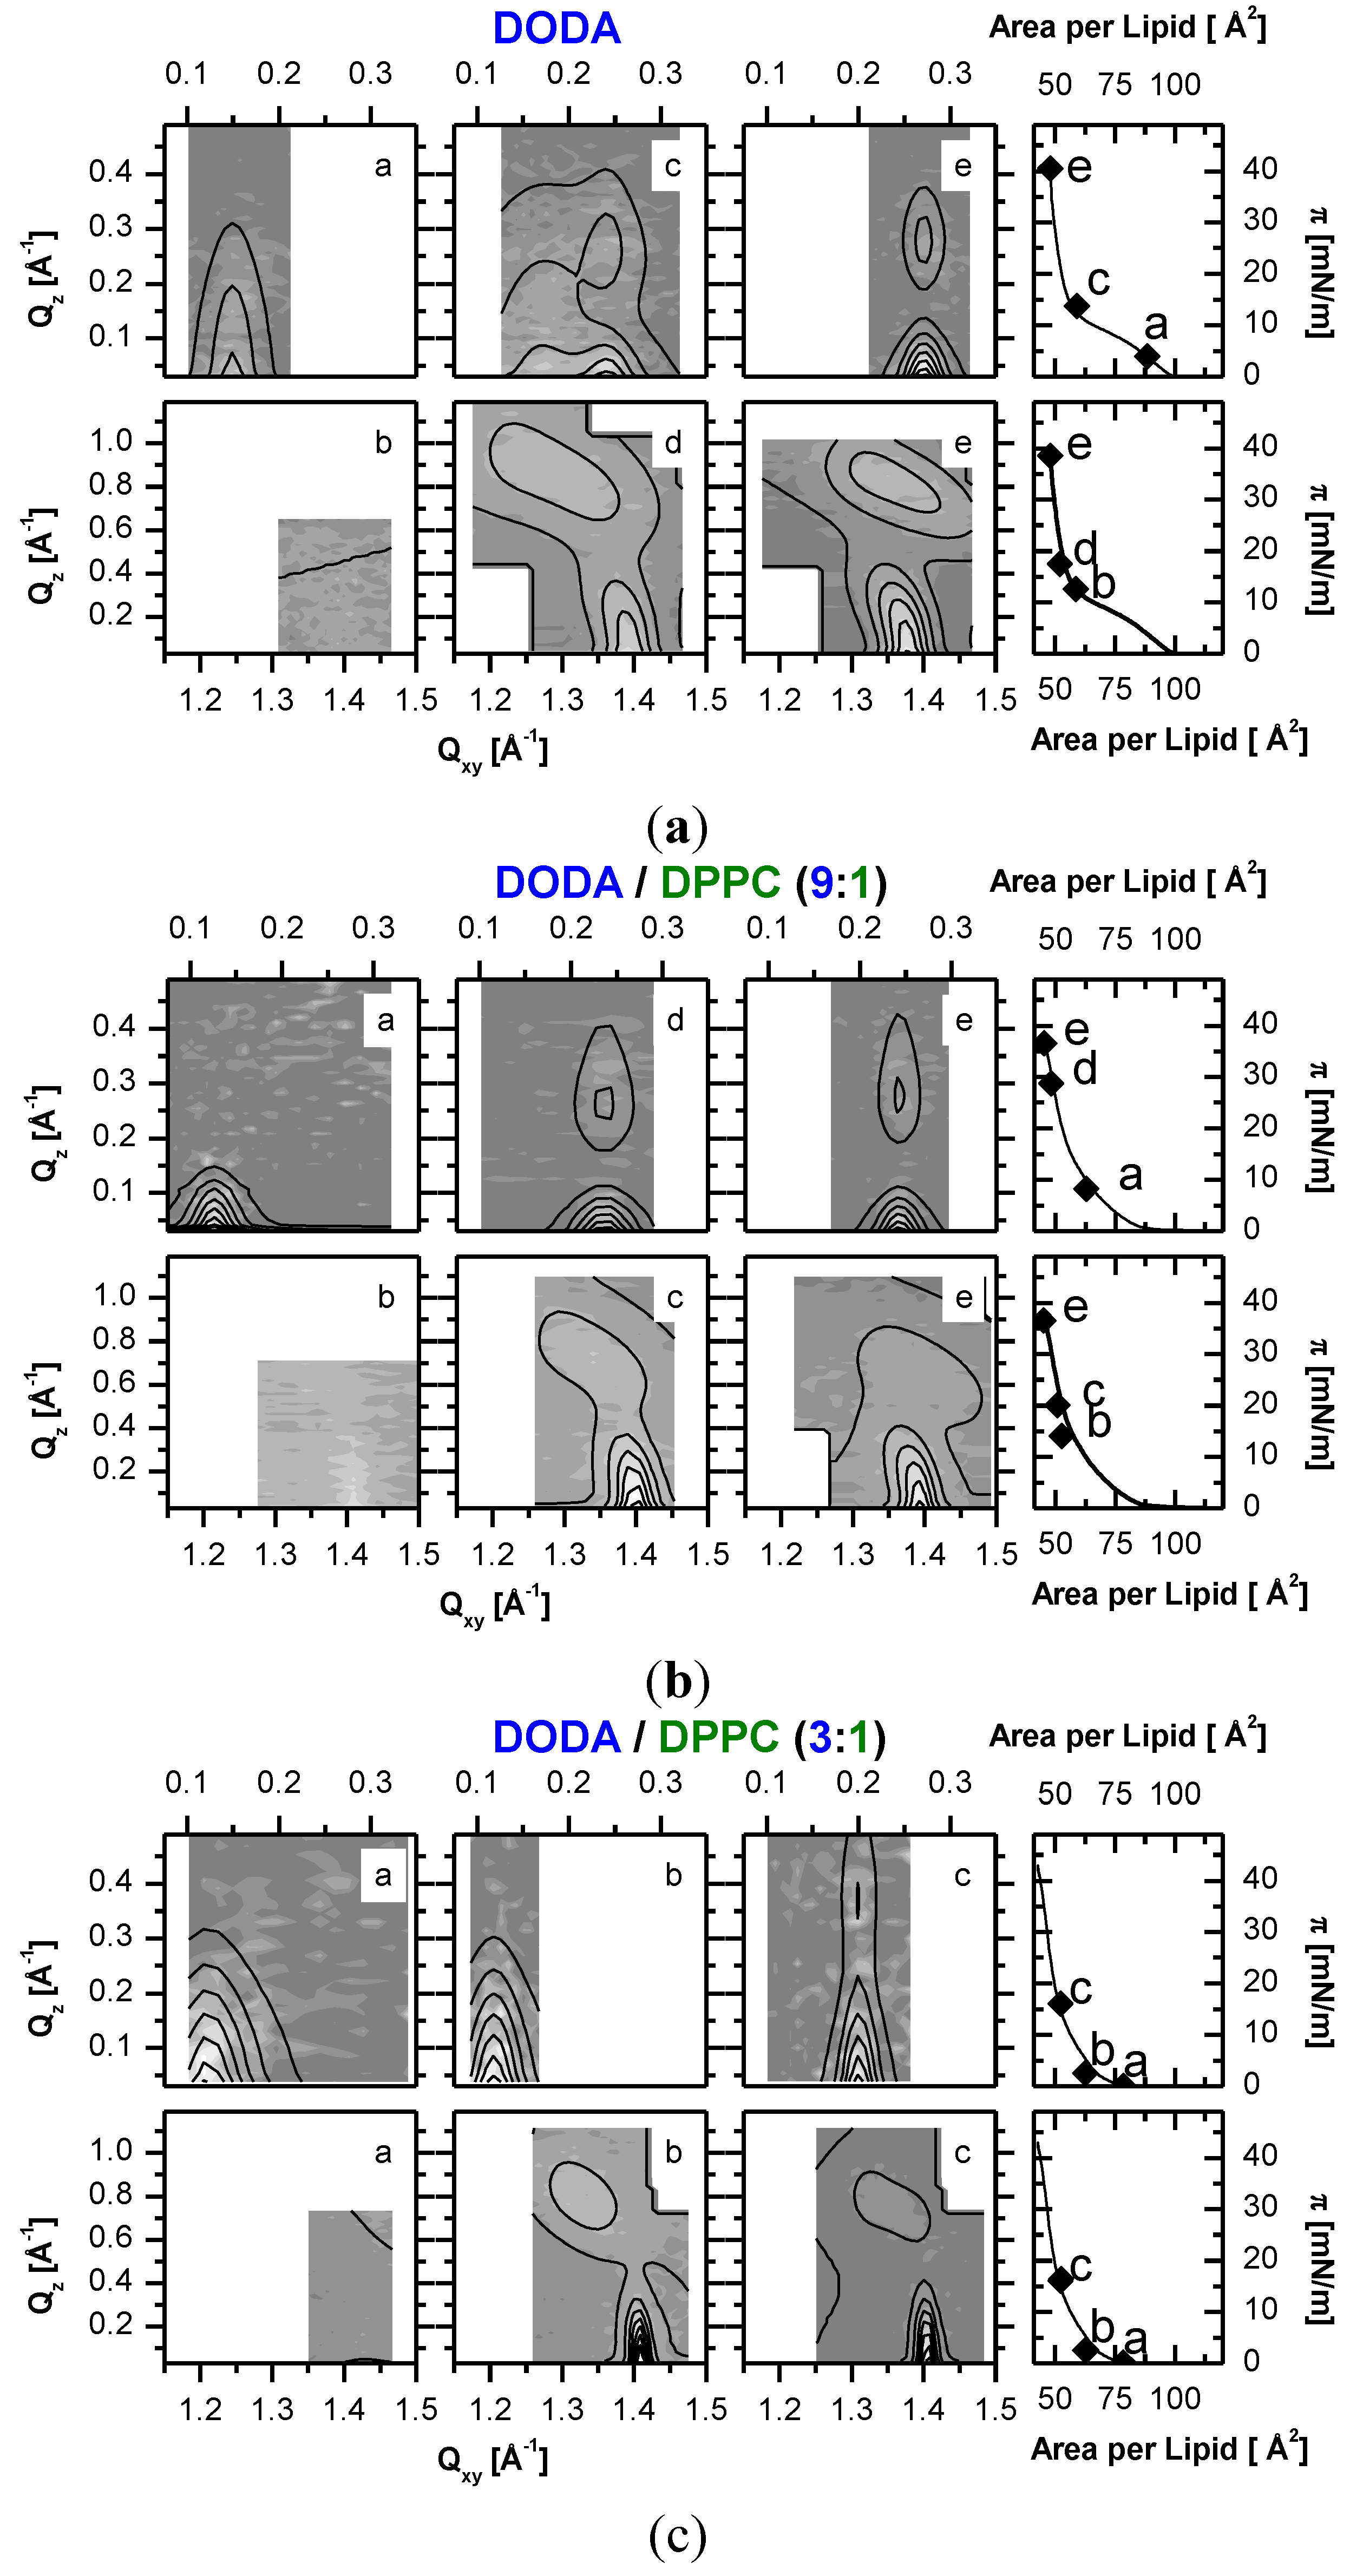
Diffraction peaks: The lamellar phase of the adsorbed PSS is studied with grazing incidence diffraction measurements along the compression isotherm. A typical measurement for PSS (
Mw = 16 kDa,
LK = 210 Å) adsorbed to a DODA monolayer is shown in
Figure 3a. When the lipids are in the LE phase, a low-angle peak is observed. It is attributed to aligned PSS chains separated by a distance
dPE. On monolayer compression the low-angle peak shifts to larger
Qxy values (from 0.12 to 0.16 Å
−1), indicating a decrease of the interchain separation
dPE. In the coexistence region, the low-angle peak observed in the fluid phase exhibits a constant position [
14]. Simultaneously, at larger
Qxy-values a peak with an unusual structured rod in
Qz-direction appears (two peaks at the same
Qxy and different
Qz positions). The positions of the two different low-angle peaks never coincide (no peaks for 0.181 Å
−1 ≤
Qxy ≤ 0.230 Å
−1) [
14]. The structured rod arises from two scattering centers with the same periodicity, one is due to aligned PSS chains and the other to an induced corrugation of the film/air interface [
13,
27]. At the end of the coexistence region, high-angle peaks due the lipid structure can be resolved (see
Figure 3). One peak occurs at low
Qz, the other broad peak at high
Qz is actually a superposition of two peaks, as detailed analysis shows. On monolayer compression, the wide angle peak positions shift to larger values in
Qxy direction, therefore the lattice distance of the alkyl tails decrease. Simultaneously, the peak positions in
Qz-direction decrease,
i.e., the tilt angle decreases. As shown previously, the alkyl tails of the DODA molecules have the same monoclinic tilted phase as on clean water [
13].
The surface charge of the monolayer is reduced by mixing DODA with increasing proportions of DPPC, mixtures of 90%, 75% and 50% DODA are used. Small angle GID peaks due to aligned PSS chains are only observed, when the mixtures contain 90% or 75% DODA (see
Figure 3). When the monolayers contain 50% DODA, no small angle peaks are found. For 90% and 75% DODA, the same features of the small angle peaks are observed as for pure DODA monolayers (one simple peaks for the LE phase, one peak with a structured rod for the LC phase). The large angle diffraction peaks caused by the lipid structure show a similar monoclinic tilted phase as for pure DODA monolayers.
When the DODA proportion is reduced to 75%, the onset of the surface pressure increase at 75 Å2 suggests a LE phase. No clear LE/LC phase transition can be discerned. However, above 3–5 mN/m wide angle peaks are observed which indicate that at least some lipids are in the LC phase. These wide angle peaks are similar to those obtained with pure DODA monolayers, yet the peak at low Qz shows a reduced width in Qxy direction, indicative of an increased correlation length perpendicular to the tilt direction. Actually, a pure DPPC monolayer shows an orthorhombic lattice with a tilt towards the next neighbour, the corresponding diffraction pattern shows two peaks, one at Qz = 0. The structure of DODA0.5DPPC0.5 is similar: it is orthorhombic with a tilt towards the next neighbor (data not shown).
Figure 3.
Small and wide angle Grazing Incidence X-ray Diffraction (GID) measurements along DODAyDPPC1−y isotherms at the molecular areas indicated (0.01mmol/L PSS in monomer units and T = 20 °C). The low-angle diffraction peaks are due to aligned PSS chains, the wide-angle peaks measure the lipid structure. (a) pure DODA (Mw (PSS) = 16 kDa). (b) DODA0.9DPPC0.1 (Mw (PSS) = 76 kDa). (c) DODA0.75DPPC0.25 (Mw (PSS) = 76 kDa). For the small angle peaks, background is subtracted. Contour plots are calculated from least square fits to appropriate models.
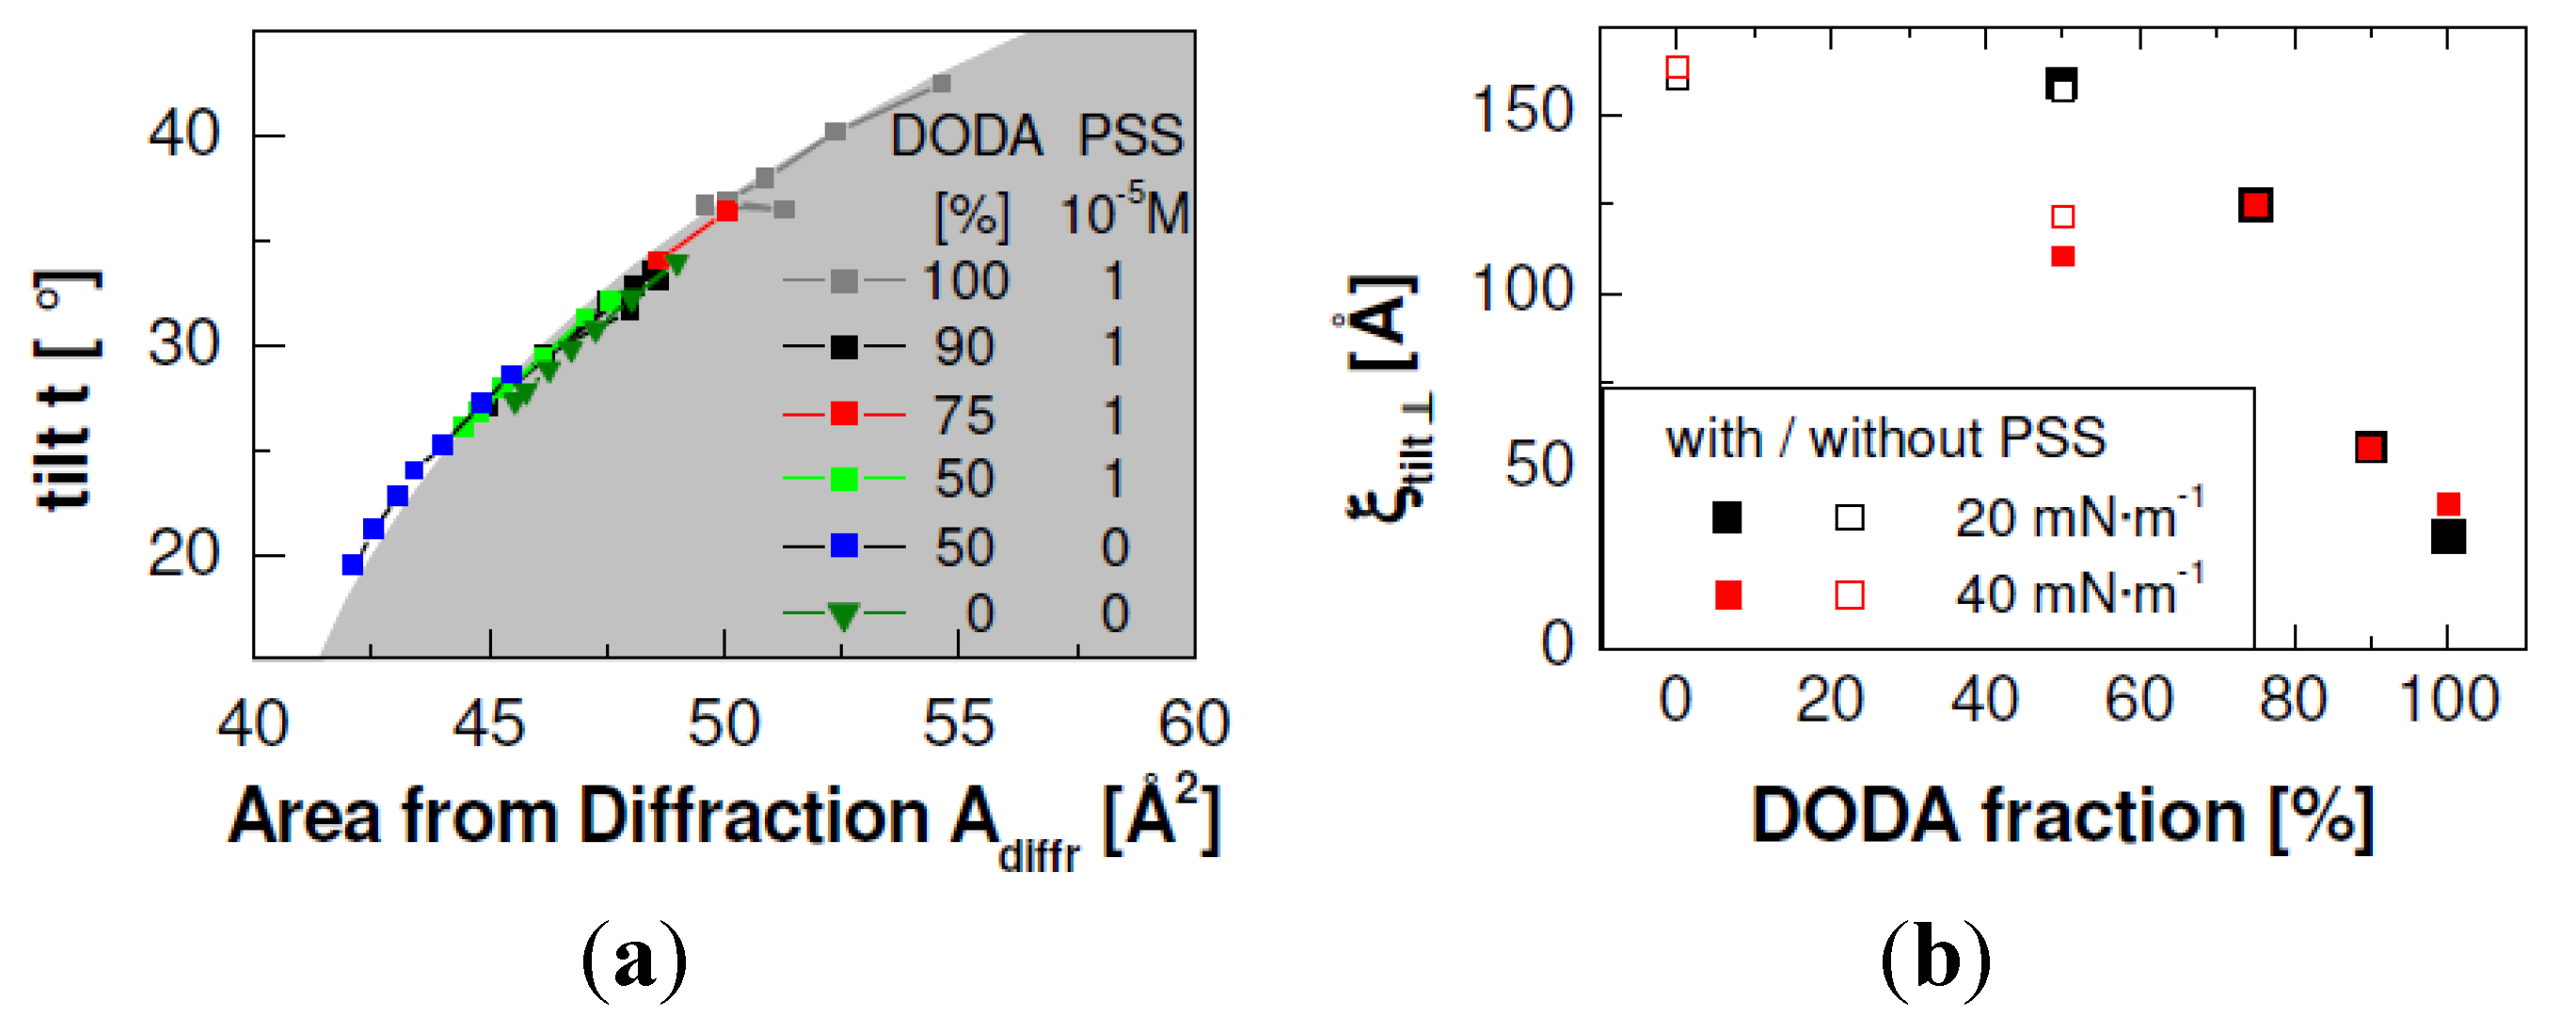
Figure 4 shows parameters of the alkyl tail lattice of mixed DODA/DPPC monolayers. The proportion of DODA is varied. The area per molecule
Adiffr measured by diffraction correlates with the tilt angle
t according to
Adiffr =
Atail/cos(
t) [
1].
Atail is the average area of the tails, measured perpendicular to the long axis. One obtains
Atail = 20 Å
2. This value is very similar to the 19.8 Å
2 known from phospholipid monolayers [
1].
Figure 4.
The liquid condensed (LC) phase of DODAyDPPC1−y monolayers with different proportions of DODA. The tilt angle t is shown as a function of the area from diffraction Adiffr (b) and the correlation length of the ordered alkyl chains perpendicular to the tilt direction (a). The shaded area on the left side is calculated according to t = arccos(Adiffr/20). (T = 20 °C, Mw (PSS) = 76 kDa, cPSS = 0.01 mmol/L with respect to the monomer concentration).
Additionally,
Figure 4 shows that pure DODA films have the largest tilt angles, on addition of DPPC the tilt angle decreases. The smallest tilt angle is found for 50% DPPC, without adsorbed PSS. The tilt angle of pure DPPC is again larger; it is similar to a mixture with 75%–90% DODA or 50% DODA with adsorbed PSS. A decreased tilt angle means that a monolayer can be compressed to smaller molecular areas. This effect is indeed observed in the isotherms (see
Figure 1). The structure of pure DODA is a monoclinic lattice with a broad azimuth distribution [
13] and a small correlation length ξ
tilt,┴ perpendicular to the tilt angle (≈30 Å) [
14]. Pure DPPC has an orthorhombic lattice, the respective correlation length ξ
tilt,┴ is larger (≈150 Å).
Figure 4 shows the dependence of ξ
tilt,┴ on the film composition. ξ
tilt,┴ increases on decrease of the DODA proportion. When the DODA proportion is 50%, the correlation length is almost as large as for pure DPPC monolayers. The dependence of the tilt angle and of the correlation length on the monolayer composition confirms our assumption that DODA and DPPC form homogeneous mixtures.
In the next step, PSS is replaced by the statistical copolymer P–trisAA
x–rand–AMPS
1−x with a reduced line charge. DODA monolayers with their large surface charge are used. Again, small-angle diffraction peaks due to aligned PE chains are observed (
Figure 5). Always, these are simple peaks, without a structured rod. For the copolymer with the higher line charge, P–trisAA
0.1–rand–AMPS
0.9, peaks are observed along the whole isotherm, when the lipids are in the LE and the LC phase (see wide-angle diffraction peaks). However, for P–trisAA
0.5–rand–AMPS
0.5 with its reduced line charge, small angle peaks are observed only when DODA is in the LE phase. In the LC phase, wide angle GID peaks due to ordered alkyl tails are found, but there are no low angle peaks due to aligned PSS chains.
Figure 5.
Small and wide angle GID measurements along DODA isotherms at the molecular areas indicated. The subphase contains 0.01 mmol/L P–trisAAx–rand–AMPS1−x (with respect to the monomer concentration), T = 20 °C. The low-angle diffraction peaks are due to aligned PE chains, the wide-angle peaks measure the DODA structure. (a) P–TrisAA0.1–rand–AMPS0.9. (b) P–TrisAA0.5–rand–AMPS0.5. Always, background is subtracted and contour plots are calculated from least square fits to appropriate models.
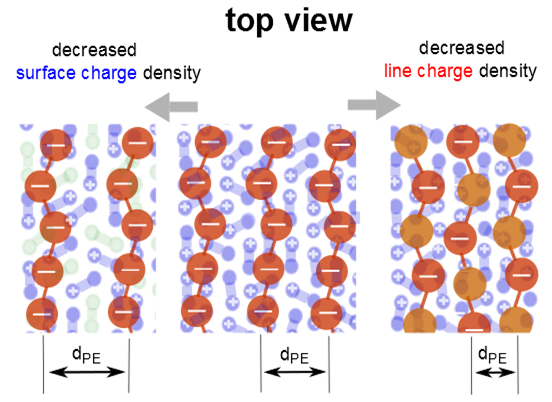
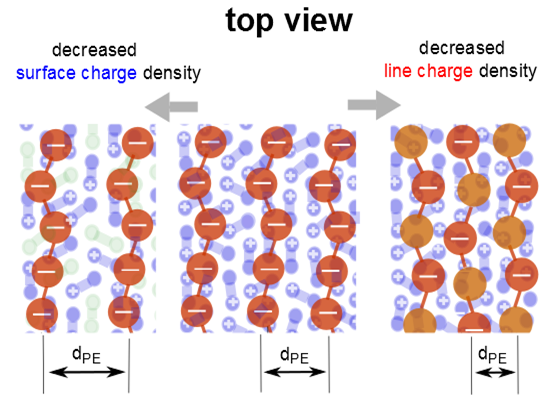
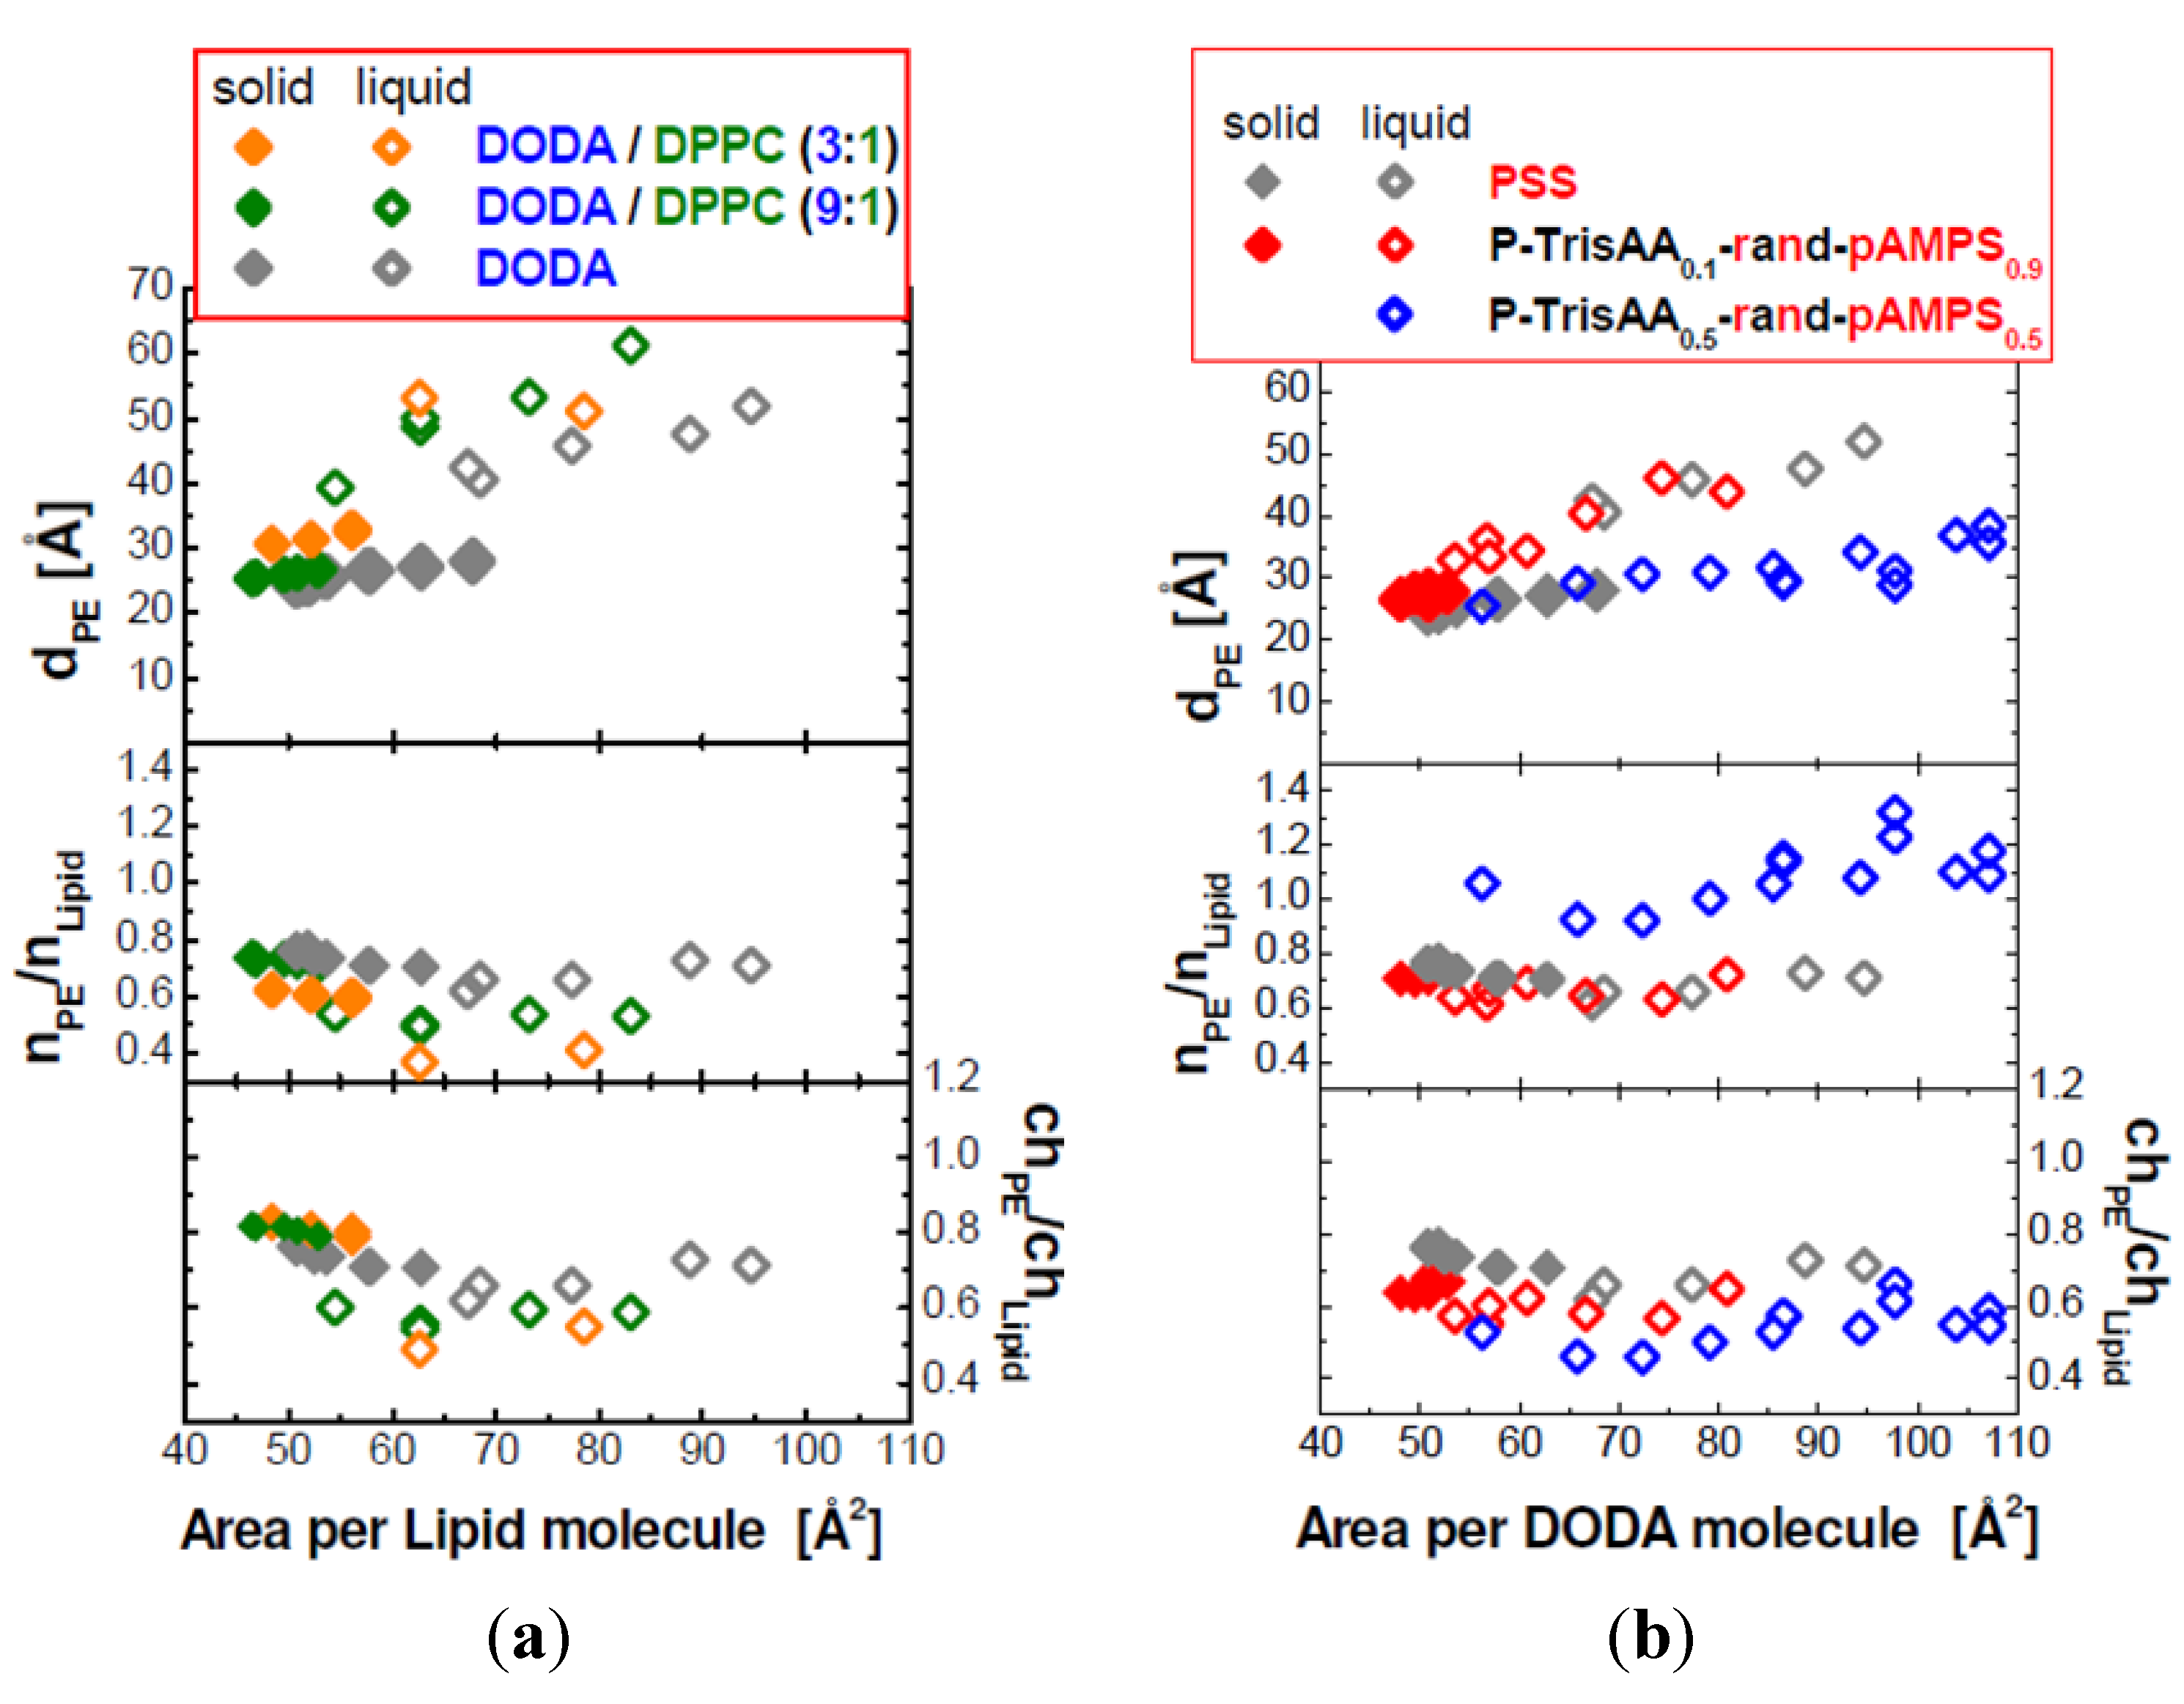
Quantification of polyelectrolyte coverage: In
Figure 6, the interchain separation
dPE as deduced from the low angle GID peaks is plotted for the different systems. On monolayer compression, it decreases at most by a factor of two, provided the monolayer shows both a LE and a LC phase. Also shown is the ratio of lipid molecules to PE monomers,
nPE/
nLipid. To get further insight into electrostatic interactions, the ratio between charged PE monomers and charged lipid molecules is given, ch
PE/ch
Lipid. For these calculations, the average molecular area
A is determined from the isotherms, and multiplied if necessary with
y, the mole fraction of charged lipids. Similarly, the area per monomer is determined from the monomer length multiplied by the interchain separation
dPE (
Amonomer = 2.5 Å
dPE; 2.5 Å is the monomer length of all PEs, see
Scheme 2), and if appropriate by (1 −
x), the mole fraction of charged monomers of P–trisAA
x–rand–AMPS
1−x.
Figure 6.
Top row: The dependence of the interchain separation dPE on the molecular area A of the lipids. The left panel (a) shows PSS adsorbed to DODA/DPPC monolayers (composition indicated), the right panel (b) P–TrisAAx–rand–AMPS1−x adsorbed to DODA. Center row: the ratio between PE monomers and lipid molecules, nPE/nLipid. Bottom row: ratio of charged PE monomers to charged lipid molecules, chPE/chLipid.
For the mixed DODA/DPPC monolayers with adsorbed PSS,
dPE increases with decreasing surface charge. This observation is valid when the lipids are in the LC phase, in the LE phase, or the coexistence region of the LE and LC phase. A comparison of the three monolayers shows that a decrease of the fraction of the charged lipids causes a decrease in the ratio
nPE/
nLipid (see
Figure 6). However, the ratio between PSS monomers and charged lipids, ch
PE/ch
Lipid, is between 0.5 and 0.8. Expected are values below 1, reversal of the surface charge hinders the formation of the lamellar phase. ch
PE/ch
Lipid is largest for the system with the highest surface and linear charge density, DODA monolayers (see
Figure 6). It is slightly larger for DODA in the LC phase (ch
PE/ch
Lipid = 0.74 and 0.67). In the LC phase, ch
PE/ch
Lipid increases to about 0.8. However, in the LE phase, ch
PE/ch
Lipid decreases with decreasing fraction of charge lipids.
Next, pure DODA monolayers with adsorbed PSS and statistical copolymer P–TrisAA
x–rand–AMPS
1−x, are compared (see
Figure 5b). For PSS and the statistical copolymer with 90% charged monomers,
dPE coincides within resolution for all phases of the lipid monolayer. When 50% of the monomers are charged,
dPE is drastically decreased. The interchain separation is smaller,
i.e., the surface coverage of the PE is larger. For this PE, P–TrisAA
0.5–rand–AMPS
0.5, Bragg peaks can only be observed when the DODA monolayer is in the LE phase.
nPE/
nLipid shows that for this copolymer with the low line charge about one monomer per lipid molecule is adsorbed. This ratio between PE monomers and lipid molecules suggests that in the LC phase the interchain separation is 20 Å or less,
i.e., that the polyelectrolyte chains touch each other [
13]. Then, no Bragg peaks can be resolved. This makes sense if the physics of diffraction is considered. A domain of aligned PEs is ordered only in one dimension (perpendicular to the chains). To obtain a Bragg peak, the scattering center is obtained by integrating along the PE backbone. A polyelectrolyte is not a stiff rod, but it is flexible. When the positional broadening (in the direction perpendicular to the chain) approaches the distance between adjacent PE chains, no diffraction peaks form. Also, when the chains are adsorbed in a flat disordered phase, no Braggs peaks are observed.
Nevertheless, when we consider the ratio between charged monomers and lipid molecules, we get again values below 1. ch
PE/ch
Lipid depends on the phase of the lipids. When the lipid phase is unchanged, ch
PE/ch
Lipid changes little during monolayer compression (see
Figure 6). Therefore, we consider the average of ch
PE/ch
Lipid for each lipid phase (see
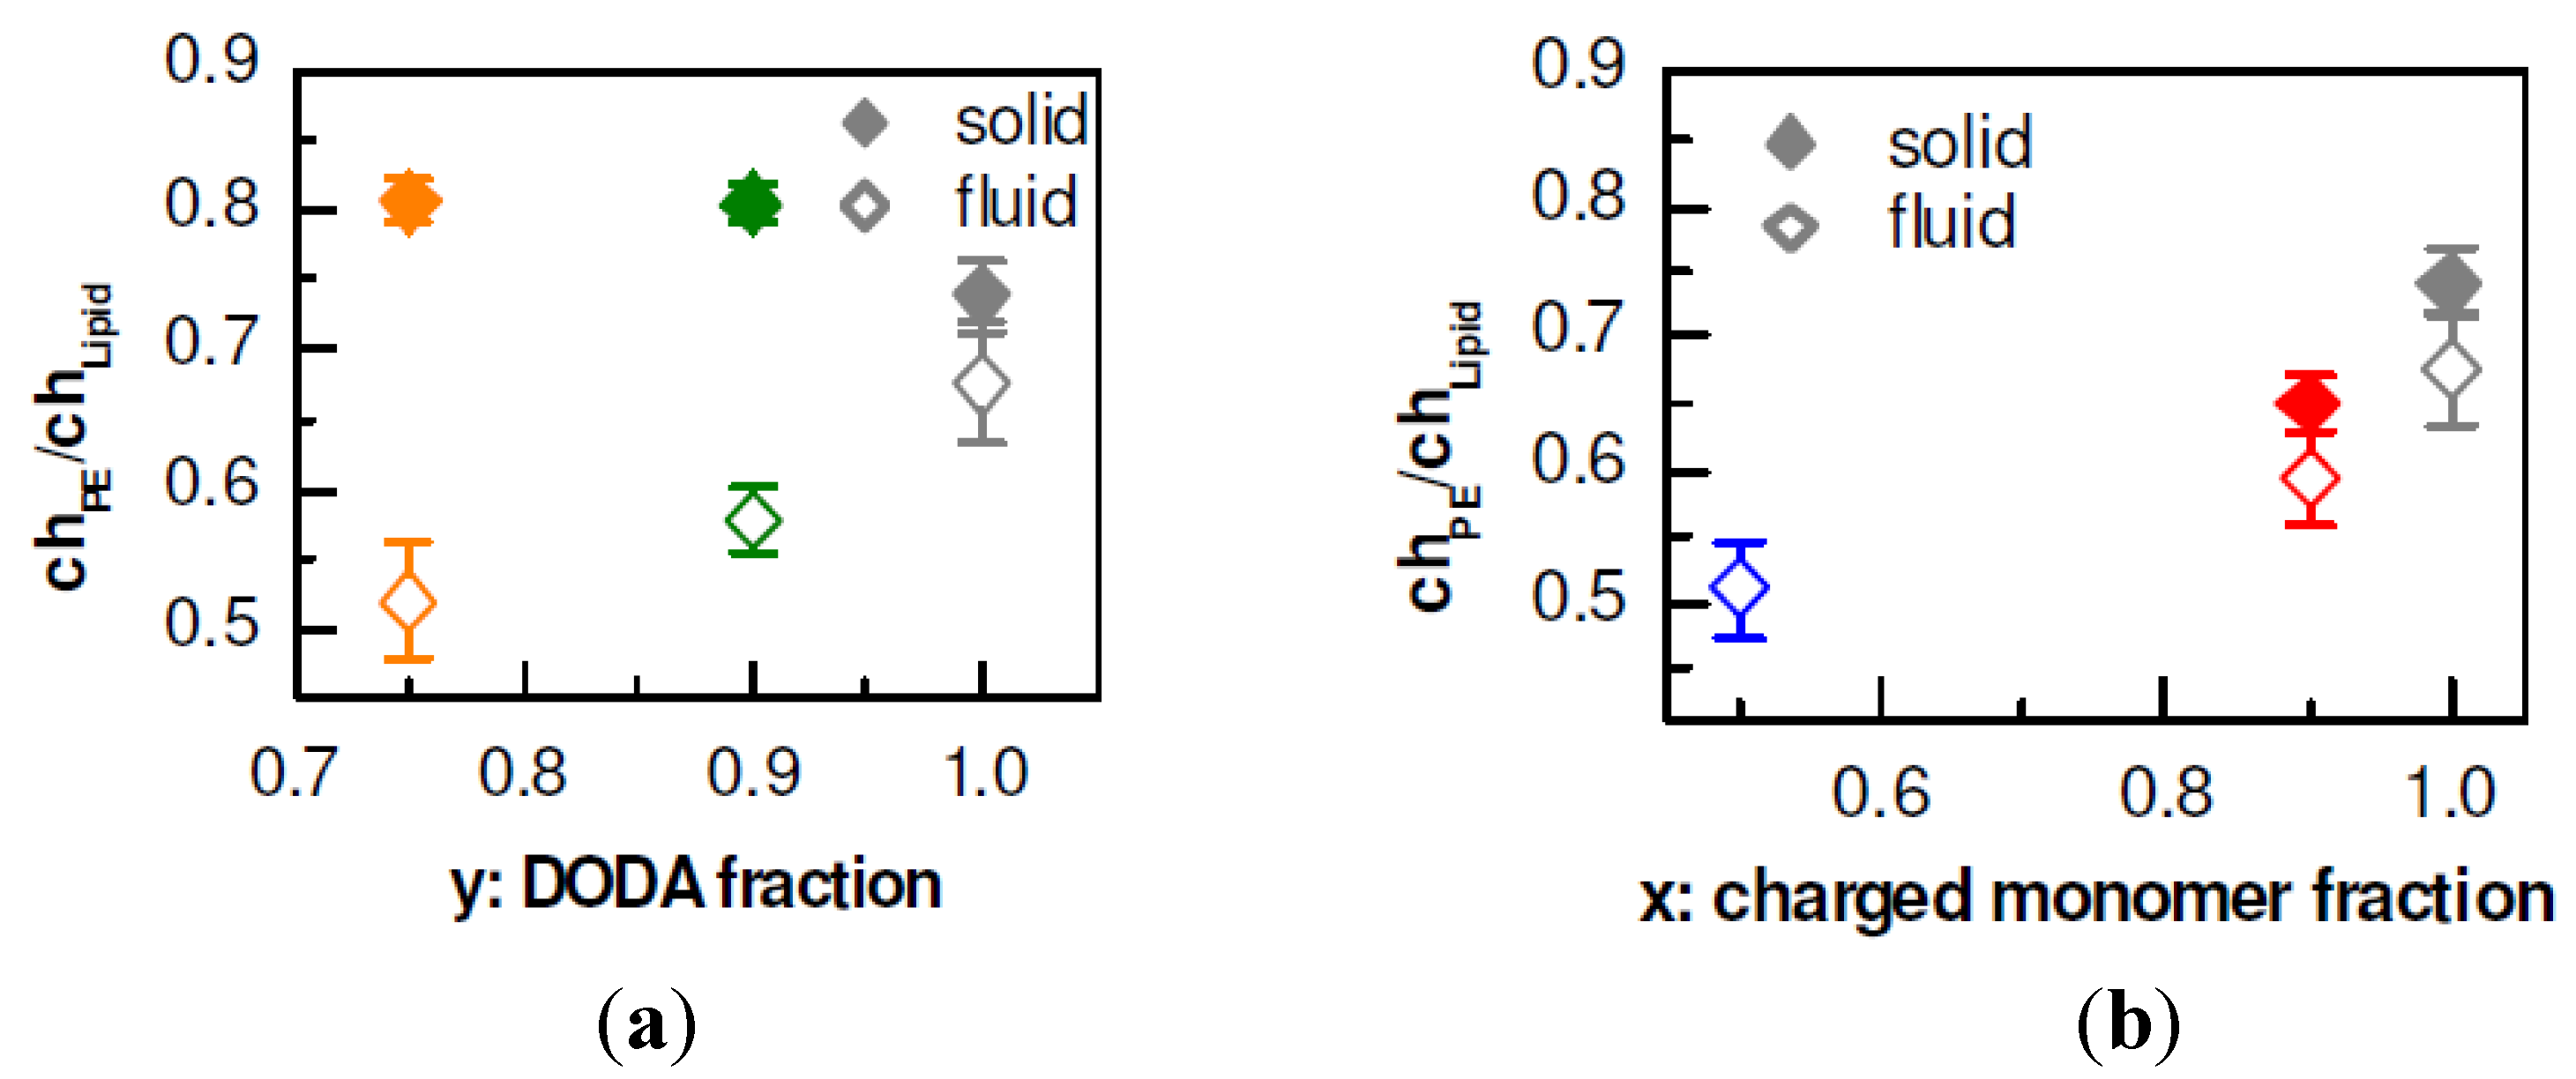
Figure 7). For each system investigated, ch
PE/ch
Lipid is larger in the LC phase than in the LE phase. When the surface charge is varied, ch
PE/ch
Lipid is fairly constant, suggesting that the adsorption is mainly due to electrostatic forces. However, with decreasing linear charge, ch
PE/ch
Lipid decreases. The neutral monomers seem to interact strongly with the DODA monolayer; other interactions besides electrostatic forces have to be considered.
Figure 7.
Ratio of charged adsorbed PE monomers to charged lipid molecules ch
PE/ch
Lipid as function of the surface charge or linear charge density, respectively. Each value of ch
PE/ch
Lipid shown is the average of all GID measurements taken from the lipid phase indicated. (
a) DODA
yDPPC
1−y monolayers with adsorbed PSS. (
b) DODA monolayers with adsorbed PE (PSS, P–TrisAA
x–rand–AMPS
1−x with
x = 0.9, 0.5). Symbol assignment and color code is the same as in
Figure 6.
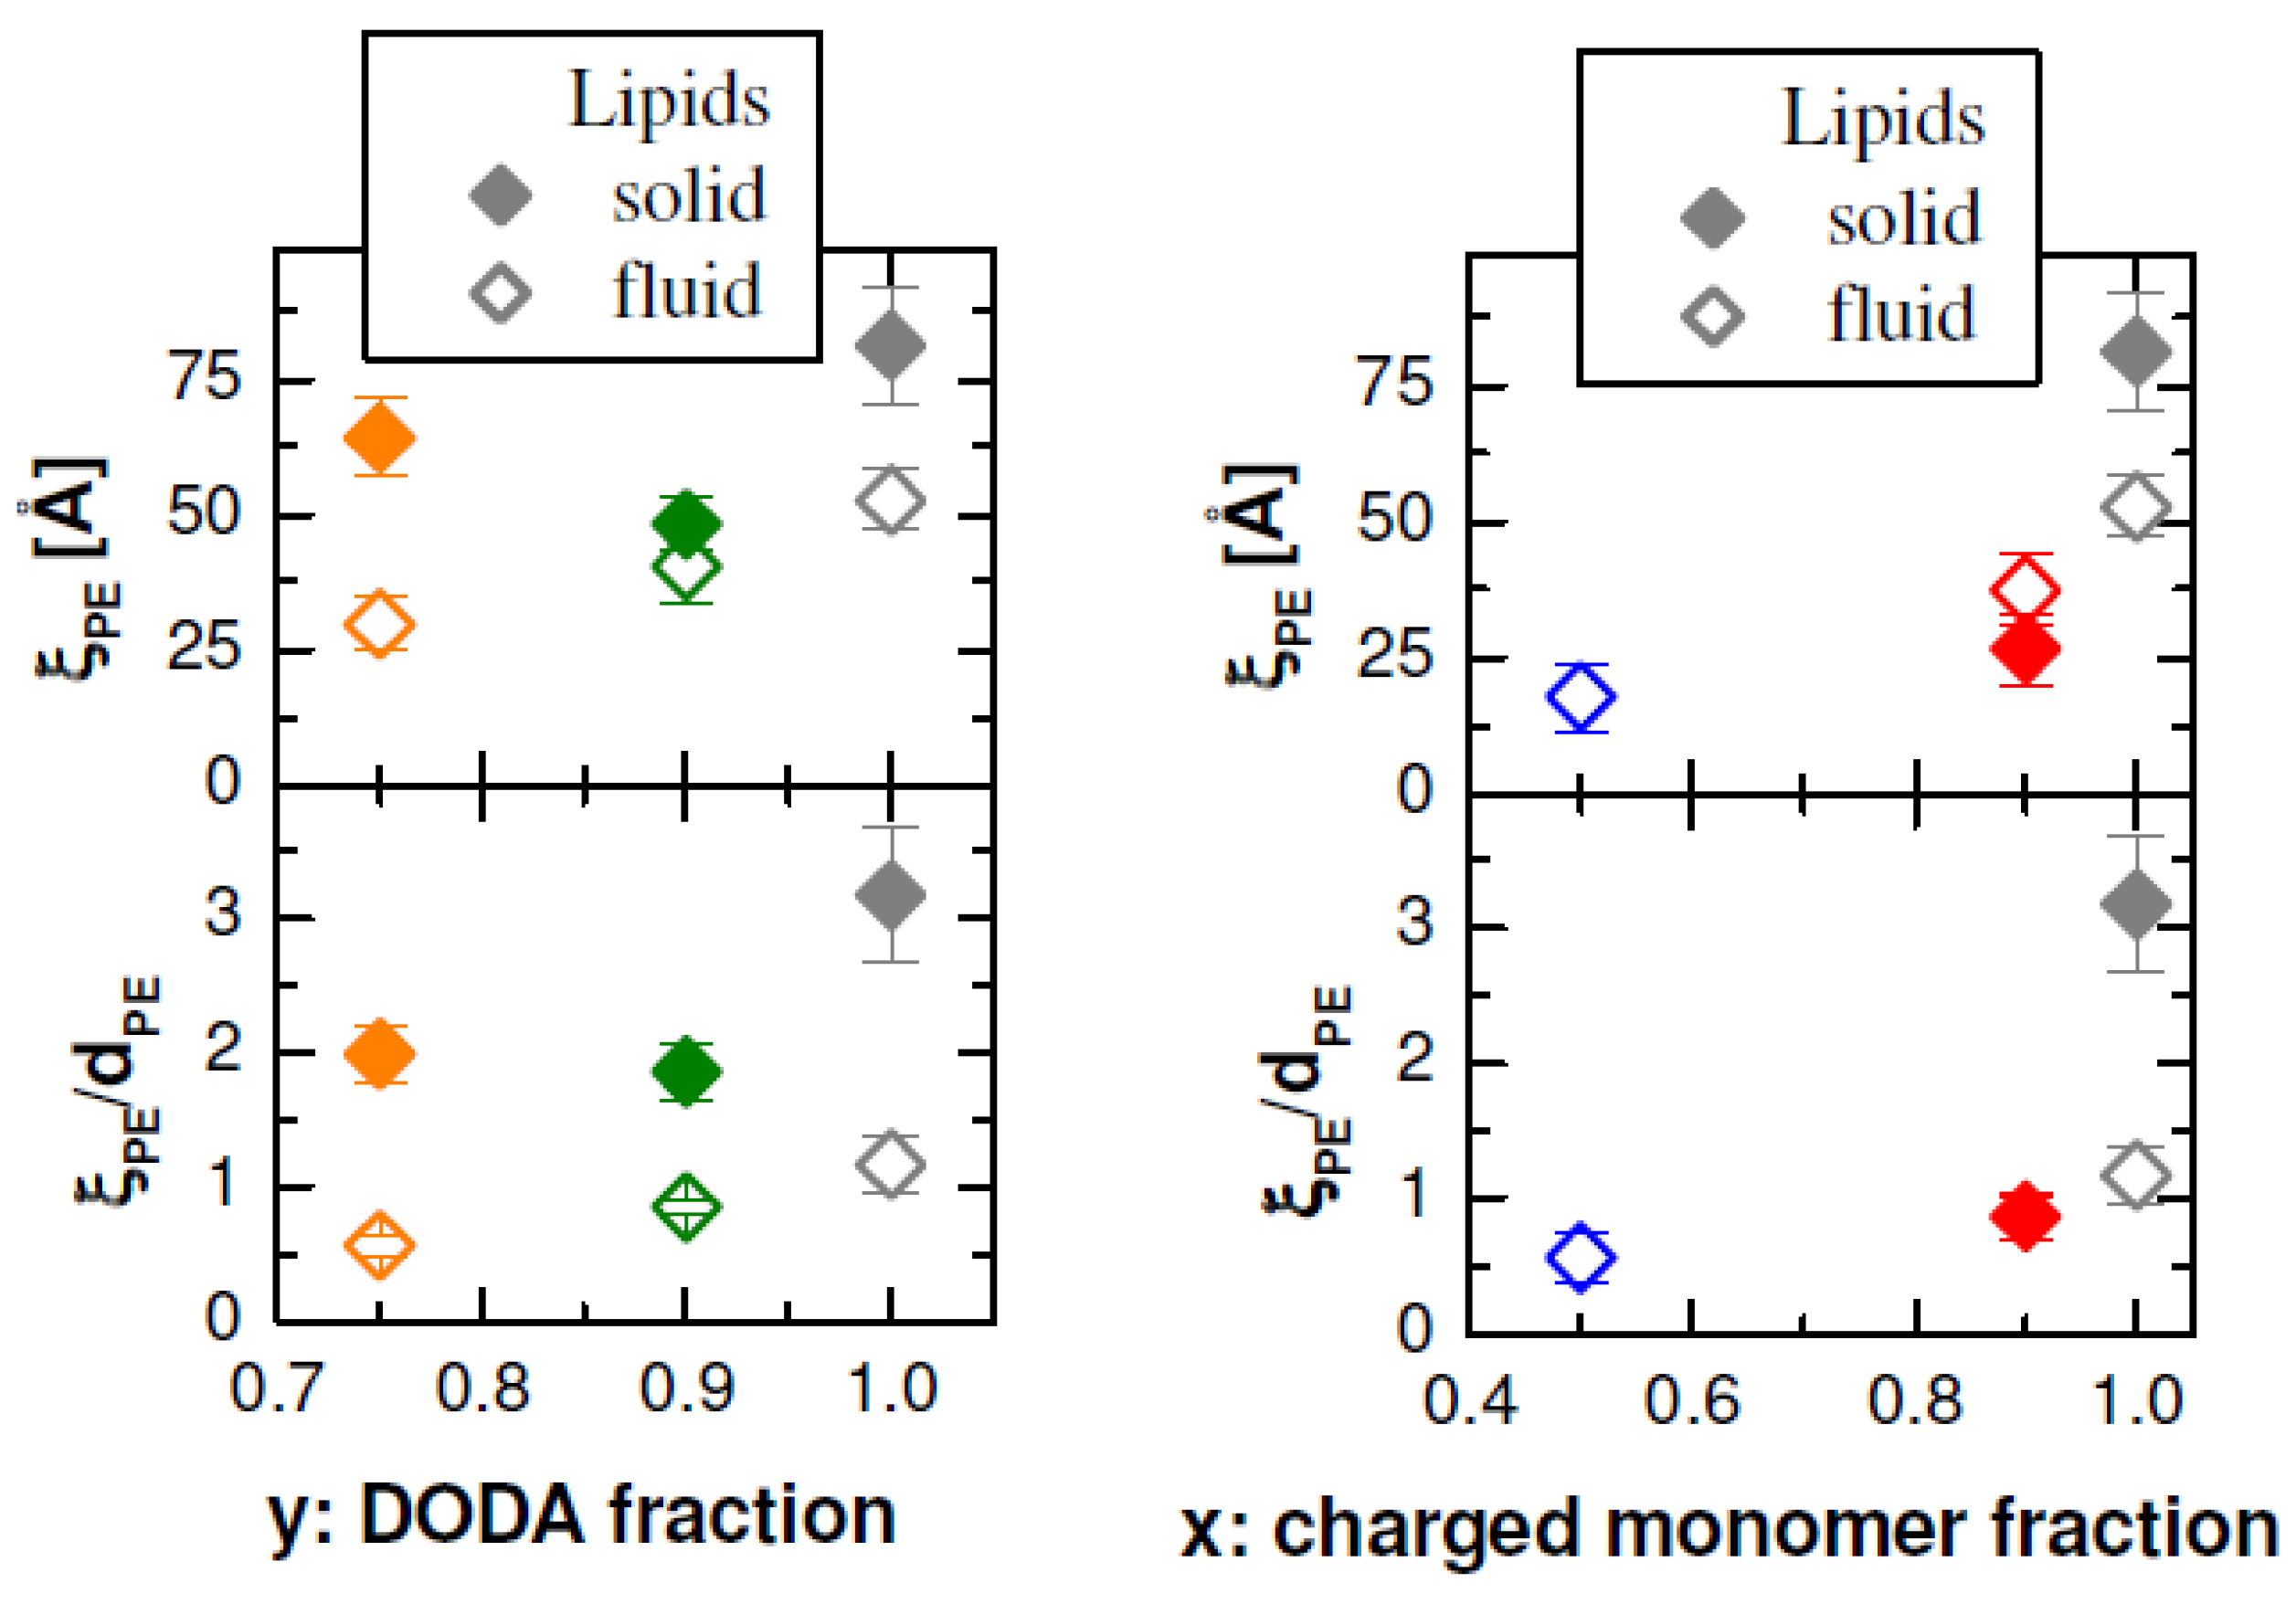
The correlation length is a measure of the extension of lateral order.
Figure 8 shows ξ
PE, the correlation length of the domains consisting of aligned PEs. ξ
PE depends on the phase of the lipids. When the monolayer is compressed within a lipid phase, ξ
PE does not change [
14]. Therefore, we consider the average of ξ
PE for each lipid phase (see
Figure 8). The largest value (≈75 Å with lipids in LC phase) is found for the system with the largest electrostatic forces, DODA and PSS. On decrease of the surface charge density, the correlation length decreases. However, the interchain separation increases. To get an idea of the extension of the order within the two-dimensional lamellar phase, we consider the ratio ξ
PE/
dPE (see
Figure 8), again the average value for each lipid phase. The largest correlation length 364 ξ
PE is found for PSS adsorbed to DODA in the LC phase, it corresponds to three times
dPE.
Figure 8.
Left: DODA
yDPPC
1−y monolayers with adsorbed PSS (76 kDa). Right: DODA monolayers with adsorbed PE (PSS, P–TrisAA
x–rand–AMPS
1−x with
x = 0.9, 0.5). Top: Correlation length ξ
PE of adsorbed PEs as function of the surface charge density or linear charge density, respectively. Bottom: Ratio between correlation length ξ
PE and interchain separation
dPE. ξ
PE and ξ
PE/d
PE are the average of all GID measurements taken from the lipid phase indicated. Symbol assignment and color code is the same as
Figure 6.
For all DODA
yDPPC
1−y monolayers, we find a larger correlation length ξ
PE when PSS adsorbs to the LC phase than to the LE phase. This finding was attributed to a larger mobility of PSS adsorbed to lipids in the LE phase [
12,
14]. On decrease of the surface charge density, the correlation length ξ
PE decreases. If PSS adsorbs to lipids in the LC phase, the ratio ξ
PE/d
PE decreases from 3 to 2. However, if the lipids are in the LE phase, the decrease is more drastic, from 1.3 to 0.6. The small value of ξ
PE/d
PE suggests that on further decrease of the surface charge density PSS will adsorb no longer in the 2-D lamellar phase, but in a flatly disordered phase.
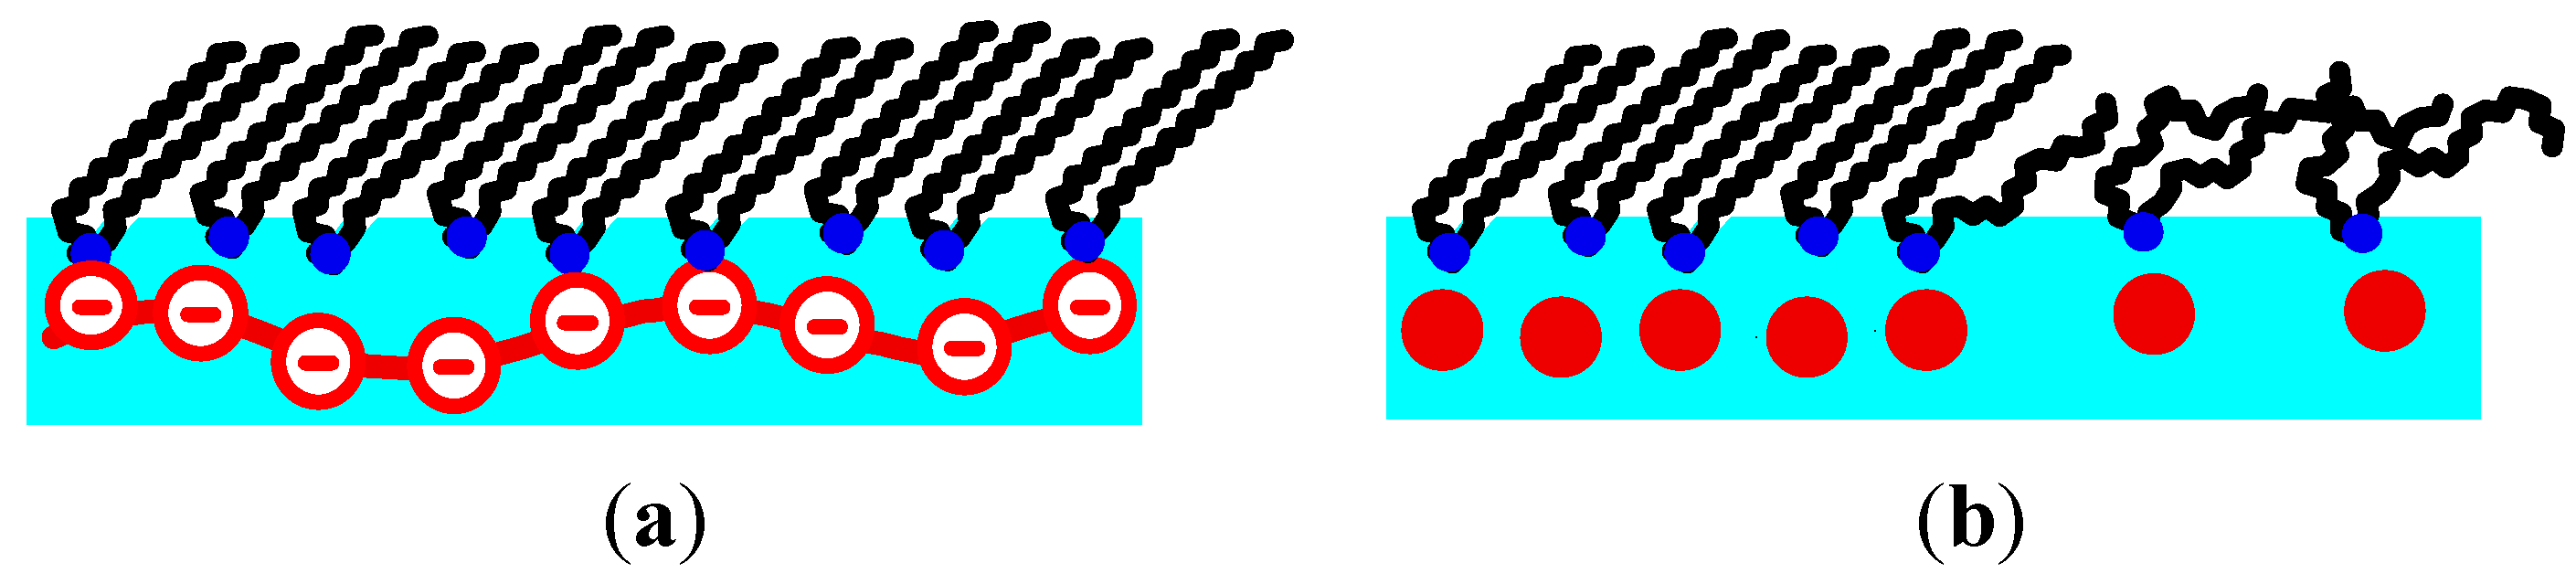
For the statistic copolymer adsorbed to DODA, the picture is more complex. Already for the strongly charged P–TrisAA0.1–rand–AMPS0.9, we obtain ξPE/dPE = 1, independent of the lipid phase. The order of the aligned PE chains is very short-ranged. When the proportion of charged monomers is decreased (P–TrisAA0.5–rand–AMPS0.5), Bragg peaks due to aligned PE molecules are only found when the lipids are in the LE phase. ξPE/dPE is small, only 0.6. When the lipids are in the LC phase, dPE decreases further. Now, the positional broadening of the PE chain (in the direction perpendicular to the chain) exceeds the distance between adjacent PE chains, no diffraction peaks can form. This is indeed observed.
Actually, we developed a model of the density distribution of the adsorbed PE chains beneath the lipids described in [
13]. Briefly, PE chains with high electron density are embedded in water with lower electron density. The electron density ρ
total is the sum of a laterally homogeneous part, ρ(
z) (determined in X-ray reflectivity measurements) and its local deviation ρ
diff(
x,
y,
z), with ∫dxdyρ
diff(x, y, z) = 0. The molecular form factor is given by the Fourier transformation, |
Fmol(
Qz)|
2 = |∫∫∫dxdydz ρ·
diff(x, y, z) ·exp(
iQxx +
iQyy) +
iQzz|
2. When a Bragg peak in
Qxy–direction is observed, then one obtains
![Polymers 06 01999 i003]()
. The lateral structure exhibits a periodicity of width
dPE, consisting of a chain with a diameter
dchain and electron density ρ
PE embedded in water (width
dPE – dchain, electron density ρ
H2O). Focusing on the in-plane integration at the peak position, one has
![Polymers 06 01999 i004]()
. Performing the integration at
Qpeak yields
![Polymers 06 01999 i005]()
. For P–TrisAA
0.1–rand–AMPS
0.9, one obtains ρ
PE = 0.372 e
−/Å
3, which decreases for P–TrisAA
0.5–rand–AMPS
0.5 to 0.356 e
−/Å
3. When the lipids are in the fluid phase, one obtains for
![Polymers 06 01999 i006]()
the values 0.202 and 0.100 e
−/Å
2, respectively. In the gel phase,
dPE is decreased, and so is
![Polymers 06 01999 i006]()
, down to 0.165 and 0.031 e
−/Å
2, respectively. The latter number is an estimate, since below the lipids in the gel phase, no peak of P–TrisAA
0.5–rand–AMPS
0.5 is observed (see
Figure 5); we assumed
dPE = 15 Å. Note that
![Polymers 06 01999 i006]()
is low for two reasons: (a) P–TrisAA
0.5–rand–AMPS
0.5 has an electron density more similar to water than the random copolymer with the larger linear charge density and (b)
dPE approaches the diameter of P–TrisAA
0.5–rand–AMPS
0.5 (15 and 12 Å, respectively).
The description of the adsorbed PEs helps to understand the transition enthalpy ∆
H shown in
Figure 2. The temperature dependence of ∆
H is decreased when the random copolymer has a larger proportion of neutral monomers. A reduced transition enthalpy ∆
H with weak temperature dependence is found when the lipids in the LE phase are partly immobilized by network formation [
14]. We suggest that the neutral monomers TrisAA bind strongly to the lipids, reduce the mobility of DODA molecules in the LE phase, and thus influence the phase transition. While this work focuses on electrostatic interactions, the changed isotherm due to weakly charged trisAA
0.5–rand–AMPS
0.5 highlights the importance of not-electrostatic interactions between polyelectrolytes and model membranes.


 (mN/(m·K))
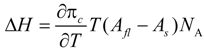


 . The lateral structure exhibits a periodicity of width dPE, consisting of a chain with a diameter dchain and electron density ρPE embedded in water (width dPE – dchain, electron density ρH2O). Focusing on the in-plane integration at the peak position, one has
  . Performing the integration at Qpeak yields
  . For P–TrisAA0.1–rand–AMPS0.9, one obtains ρPE = 0.372 e−/Å3, which decreases for P–TrisAA0.5–rand–AMPS0.5 to 0.356 e−/Å3. When the lipids are in the fluid phase, one obtains for
  the values 0.202 and 0.100 e−/Å2, respectively. In the gel phase, dPE is decreased, and so is