1. Introduction
The capability of the shape memory polymers (SMPs) to remember their initial form under the action of stimulants is attractive in engineering applications. SMPs have a wide range of functions in the design of micro-biomedical components, medical devices, smart textiles, sensors, aerospace deployable equipment, and so on. This has resulted in a growing research interest in this field [
1,
2,
3,
4,
5,
6,
7,
8,
9,
10,
11].
The ability of SMPs to change form could be programmed in various ways such as thermo mechanical; chemical, electrical and magnetic. Shape memory effects (SME) can be obtained by a process cycle. In the case of heating stimuli, the process can be summarized in successive steps: heating, deformation, relaxation, fixation and recovery.
A review of the literature gives a great deal of valuable information [
12,
13,
14,
15,
16,
17,
18,
19,
20] about the SMPs; however the answers to a number of serious and foremost questions are still shrouded in mystery. For example, some macroscopic phenomena still lack a detailed understanding on the microscopic level. Thus, there is a need for further fundamental research on SMP and related concepts in order to develop their applications.
The first question is about the definition of SME. Does this effect concern only the macroscopic scale or is it reflected also in the microscopic shape change? In fact, it is usually common to consider SME for macroscopic changes. However, if the capacity to regain the initial (permanent) shape after certain stimulation, even at microscopic scale, is considered as SME, several phenomena like elasticity, shrinkage, swelling, thermal expansion,
etc. can also be considered as various expressions of shape memory [
21,
22,
23,
24,
25]. The definition of SME, in this way, helps us to understand its mechanism more fully on the microscopic and molecular scale. One of the objectives of this work is to demonstrate the importance of this new concept of SME.
The second question concerns the chemical, physical origins of SME and its mechanisms. It is generally accepted that shape memory effect is related to the presence of two different, hard and soft segments in the structure of polymers. The hard morphology stabilizes the permanent shape of the structure while the soft morphology allows the passage from permanent to temporary state or vice versa. In the case of cross-linked polymers, the cross-linkage points and the segments of the chains directly linked to these points may be considered as the hard zones of the morphology. These zones are responsible for the permanent state of the polymer because of their high stability. Moreover, there is no significant molecular motion in these zones. In the case of a blend, the mixture of two themoplastic polymers, one of the polymers (with higher glass transition temperature) may play the role of hard segment and the other one that of soft segment. The compatibility of these two polymers has a high influence. Even though this explanation is correct, it cannot respond to all of the questions related to the SME mechanism; for example it cannot illustrate the chemical and physical origin of SME. So our objective is also to bring in some new elements to explain the mechanism of SME. For example, we try to show the role of driving force during recovery.
In a study of SMPs one of the questions is about the relationship between SME and properties memory effect (PME). In our previous work [
26], we showed that after recovery a SMP does not necessarily exhibit the same properties; that means even after regaining 100% of initial shape, the polymer may not always show the same properties. In the case of thermal stimuli sensible polymers, one of the ways to determine this relationship is to perform cyclic-thermo-mechanical tests. This investigation can be carried out by means of a tensile machine equipped with a thermo chamber.
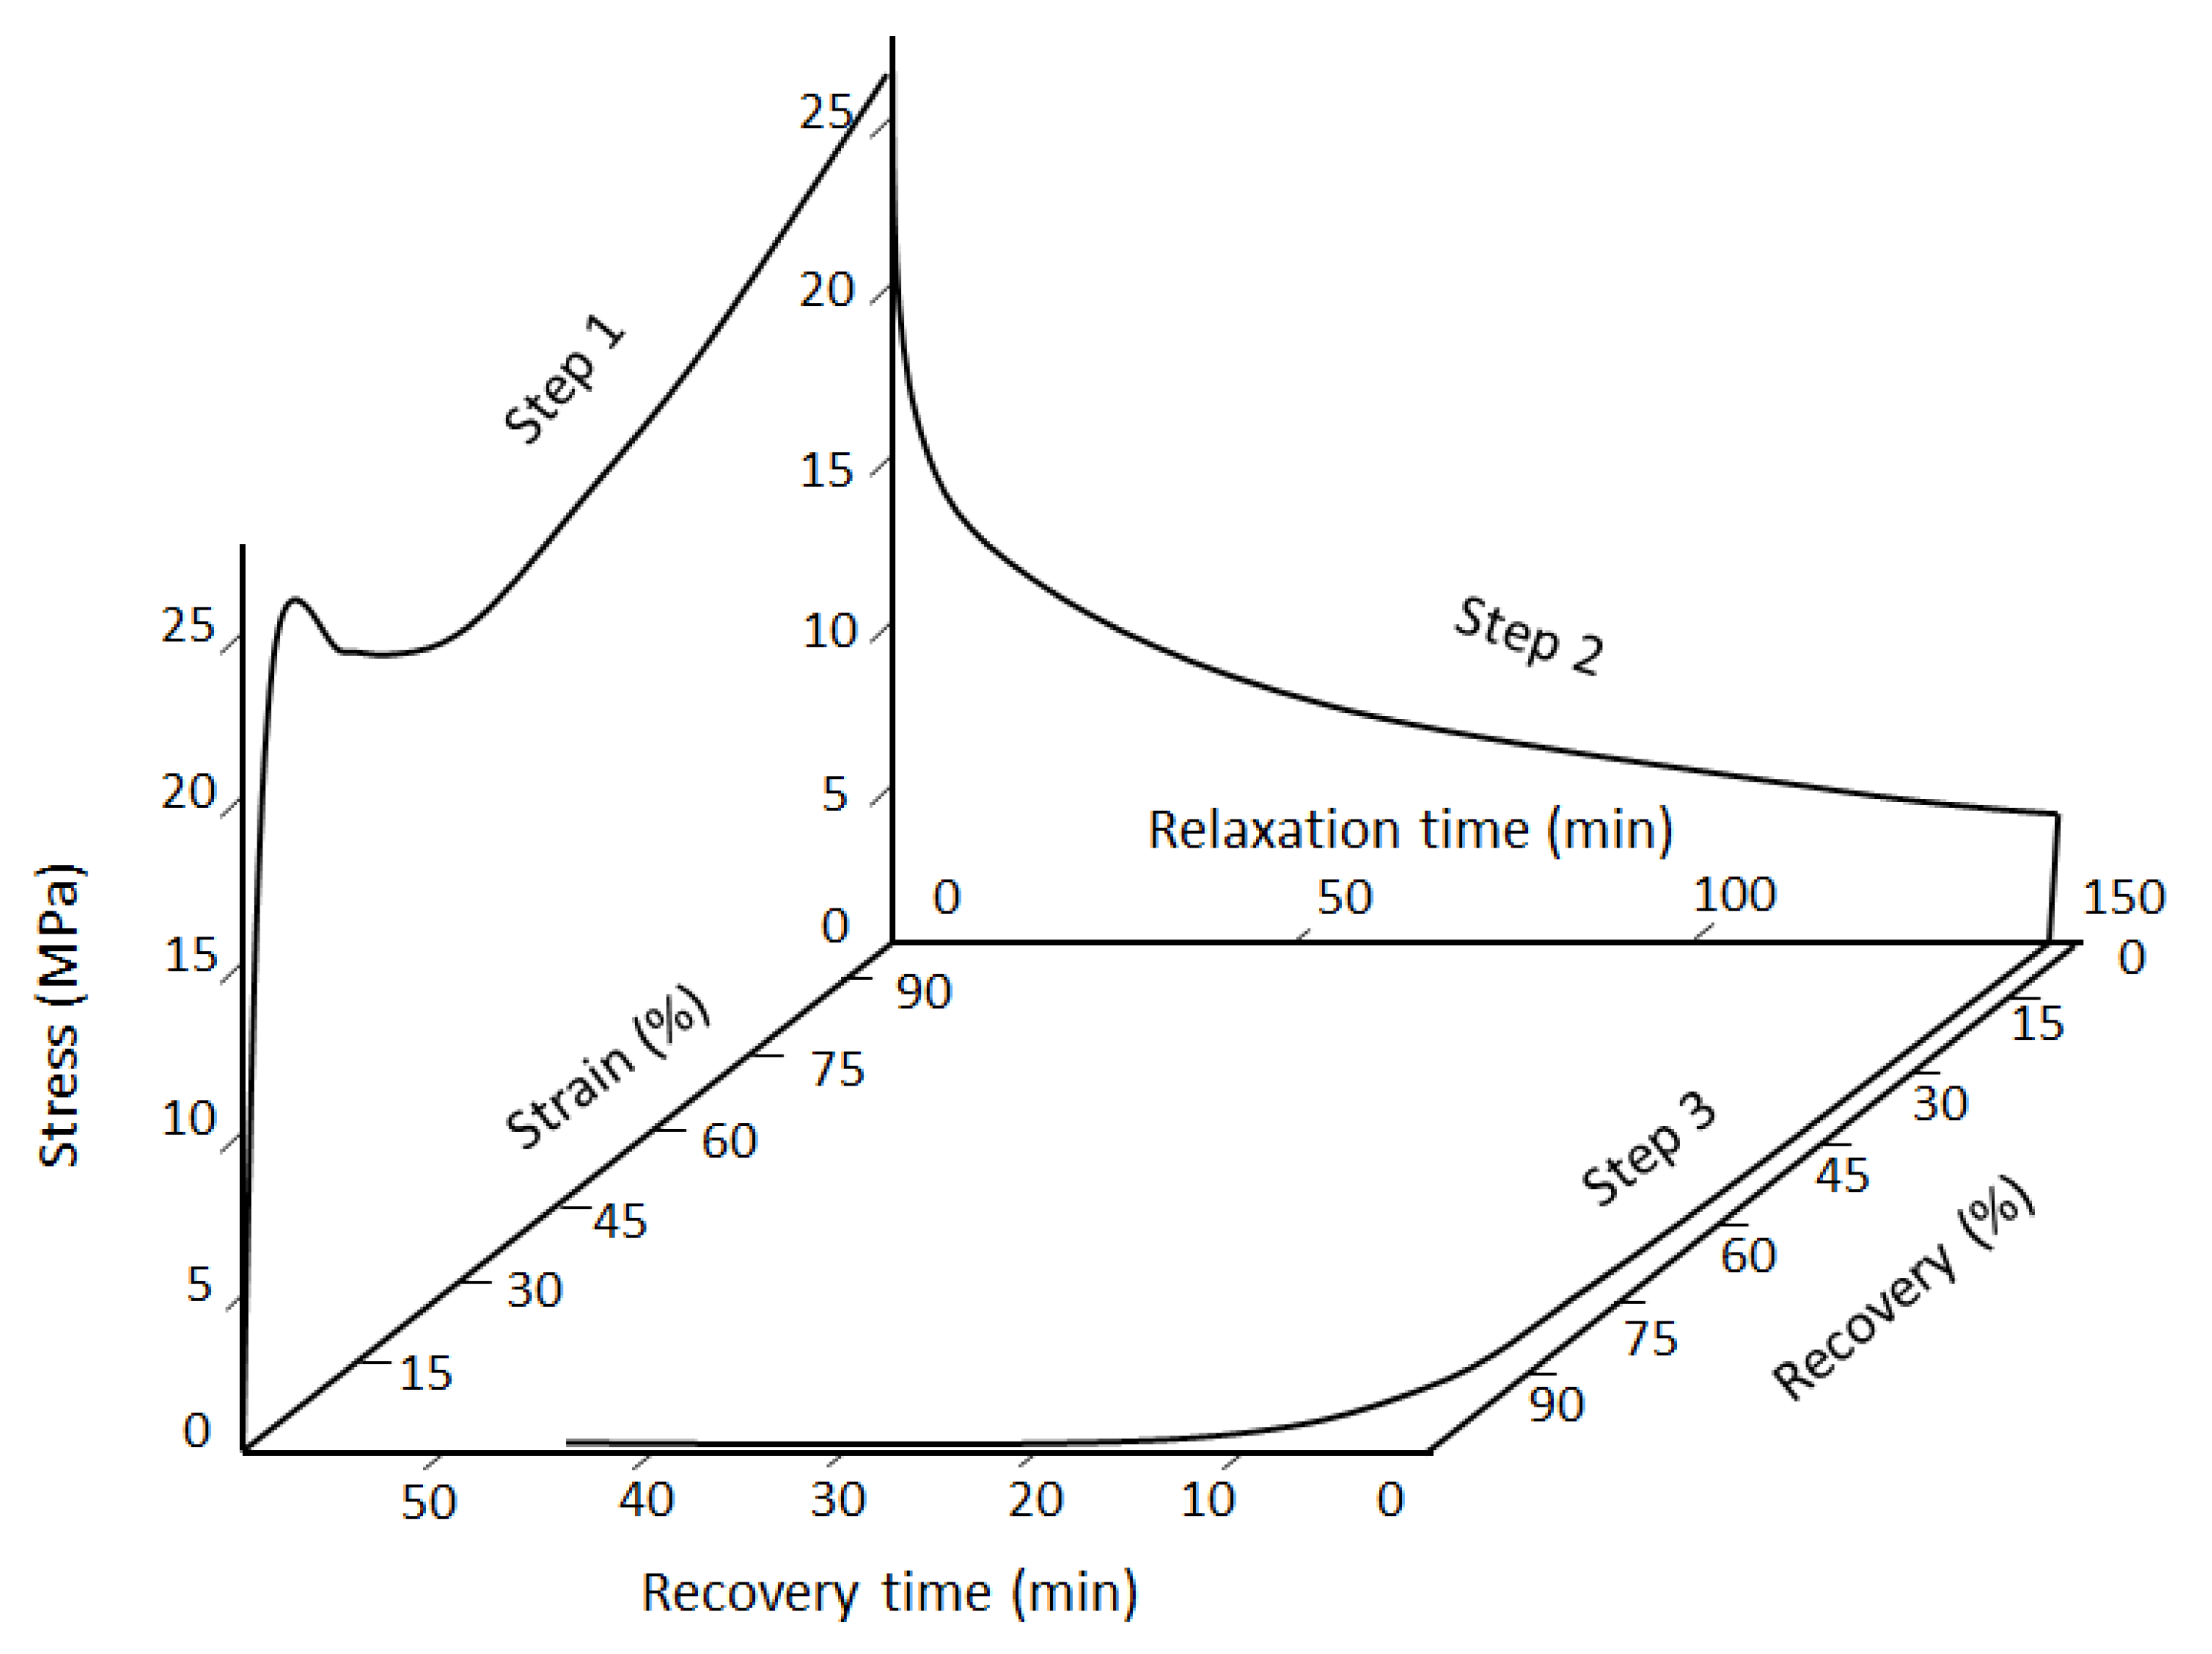
Figure 1 shows a three-dimensional demonstration of each cycle. As can be seen, each cycle consists of three consecutive steps, stress–strain curve, stress-relaxation time evolution and recovery.
Figure 1.
A tridimensional presentation (stress-time-strain) of one cycle of shape memory tests on polyurethane [
26].
Figure 1.
A tridimensional presentation (stress-time-strain) of one cycle of shape memory tests on polyurethane [
26].
This paper also introduces the concept of partial shape memory effect (PSME). It is worth mentioning that between the SMP and those without SME, there are polymers which have an intermediate behavior. This concept is important because it helps us to understand the difference between an SMP and a non-SMP via the behavior of the polymers with PSME.
2. Materials
In this study, two polymers were used: polyurethane (PU) and a blend of polylactic acid (PLA) and polybutylene succinate (PBS), which is one of the most promising polymers in the family of synthetic biodegradable polyesters. The PU exhibits 100% SME and the PLA/PBS shows PSME.
The blend PLA (80%)/PBS (20%) was made with the following polymers:
Polylactic acid (PLA): PLA, trade name “Ingeo™ biopolymer 2003D”, is a NatureWorks LLC product (Blacksburg, VA, USA). It is a semi-crystalline thermoplastic, used naturally or as part of a formulated blend. This is a high molecular weight biopolymer grade that processes easily on conventional extrusion equipment.
Polybutylene succinate (PBS), trade name PBE002 commercialized by Natureplast (Caen, France) is a kind of fully biobased macromolecular polymer which is synthesized from succinic acid and 1,4-butanediol through a direct process of condensation polymerization.
The PLA that we used for this study is brittle, however different experiments showed that [
27,
28], the blend of up to 20% (by weight) PBS content in PLA is expected to overcome the deficiencies of PLA.
Polyurethane (PU), supplied by the RAIGI Company (Rouvray-Saint-Denis, France), is the result of the reaction between an isocyanate (diphenyl-methane di-isocyanate, (MDI) with a functionality of more than two) and a mixture of polyol (polyester with molecular weight of 800 g/mol) and chain extender (another polyol with a molecular weight of 400 g/mol). The catalysts of the types aluminosilicate and diamine were used for the reactions.
3. Processing Methods and Tests
To prepare the blend the homogenous mixture of PLA (80%) and PBS (20%) was extruded using a twin screw Brabender extruder machine (Brabender, Duisburg, Germany). The transformation temperature ranged from 180 to 200 °C. Extruded films were obtained by pulling the product through a set of cooling rolls.
In order to prepare the samples, extruded films are cut by punch using a manual press. NF ISO 6239 standard [
29] defines the test conditions and the shape of the samples. Two types of samples were obtained: parallel and perpendicular to the extrusion axis.
In the characterization methods the differential scanning calorimetry (DSC) measurements were carried out with the DSC Q10 V9.0 Build 275 (TA Instruments, Guyancourt, France). The samples of mass between 10 and 20 mg were placed in hermetic aluminum capsules. The sample was heated first up to 200 °C with a temperature rate of 5 °C/min, in order to eliminate the effect of the thermal history of the material. It was cooled down to −60 °C in order to be reheated up to 200 °C with the same temperature rate.
For the characterization of the viscoelastic behavior of PLA/PBS blends, the tests were carried out in tension using a dynamic mechanical analyzer (DMA) Q800 instrument, from the TA Company (Guyancourt, France). These tests were performed under the following condition: frequency 1 Hz, temperature ranging from −80 to 120 °C, temperature rate 2 °C/min, and dynamic force 0.1 N. The sample had a rectangular shape with 25 mm × 4 mm × 2 mm dimensions. Multi-frequency tests were performed on virgin and 100% recovered polyurethane (PU) in order to use the Williams-Landel-Ferry (WLF) equation for the determination of free volume fraction and thermal expansion coefficient.
A shape memory cycle test consists of the following successive steps: tensile test, stress-relaxation test, fixing and recovery test. For reproducibility of the results, the shape memory tests were carried out on at least three samples, each time.
(i) Tensile test: Tensile tests were achieved with the Instron 5881 (Elancourt, France), loading cell of 1 kN, according to the standard NF ISO 6239 [
29]. The strain rate is 5 mm/min. This machine is equipped with a temperature controlled thermo chamber for heating the samples and performing the tests at different temperatures.
(ii) Stress-Relaxation test: This test was performed at the end of the tensile test with the same machine. The strain was taken as constant (100%, 200% and 250%) and the decrease of stress was measured versus time. This test was performed to eliminate the residual stress induced during the tensile test in the samples. The stress-relaxation tests were performed at 70, 75 and 80 °C.
(iii) Fixing: By cooling the sample with a ventilator at the end of the stress-relaxation test (or tensile test) the dimension of the sample, of the 100%, 200% and/or 250% strain was conserved in the sample.
(iv) Recovery test: The recovery tests are carried out in a thermal chamber at 70, 75 and 80 °C and must follow the changes in size (length) of the samples as a function of time.
Because of the shape memory effect, the specimens regain a percentage of their initial shape.
In the multi-cycle method, successive shape memory tests were conducted on the same sample. After the first cycle (at the end of the recovery test) the sample was used for a second cycle in order to carry out the same tests successively; this means tensile, fixing (without relaxation test) and recovery test. The cycle was repeated several times.
4. Experimental Results
In terms of the thermal characteristics of the blend the results of DSC tests on PLA, PBS and PLA (80%)/PBS (20%) blend are presented in
Table 1. It can be seen that the glass transition temperature (
Tg) of PBS and PLA are respectively −38 and 58 °C and the melting point (
Tm) of PLA and PBS are respectively 154 and 115 °C. These results were confirmed by the same tests on two other samples.
Table 1.
Values of glass transition temperature (Tg) and melting point (Tm) of polylactic acid (PLA), polybutylene succinate (PBS) and the blend PLA/PBS.
Table 1.
Values of glass transition temperature (Tg) and melting point (Tm) of polylactic acid (PLA), polybutylene succinate (PBS) and the blend PLA/PBS.
| Polymer | Tg (°C) | Tm (°C) |
|---|
| Pure polylactic acid (PLA) | 58 | 154 |
| PLA 80% + PBS 20% | PLA | 54 | 154 |
| PBS | −38 | 115 |
| Pure polybutylene succinate (PBS) | style="border-top:solid thin"38 | 115 |
The DSC test on the blend shows two distinct
Tg (−38 and 54 °C) and two distinct
Tm (115 and 154 °C). These values are nearly the same as the
Tg and
Tm of PBS and PLA. This means that these polymers are not miscible in the blend. The same results were obtained by thermo-mechanical analysis (
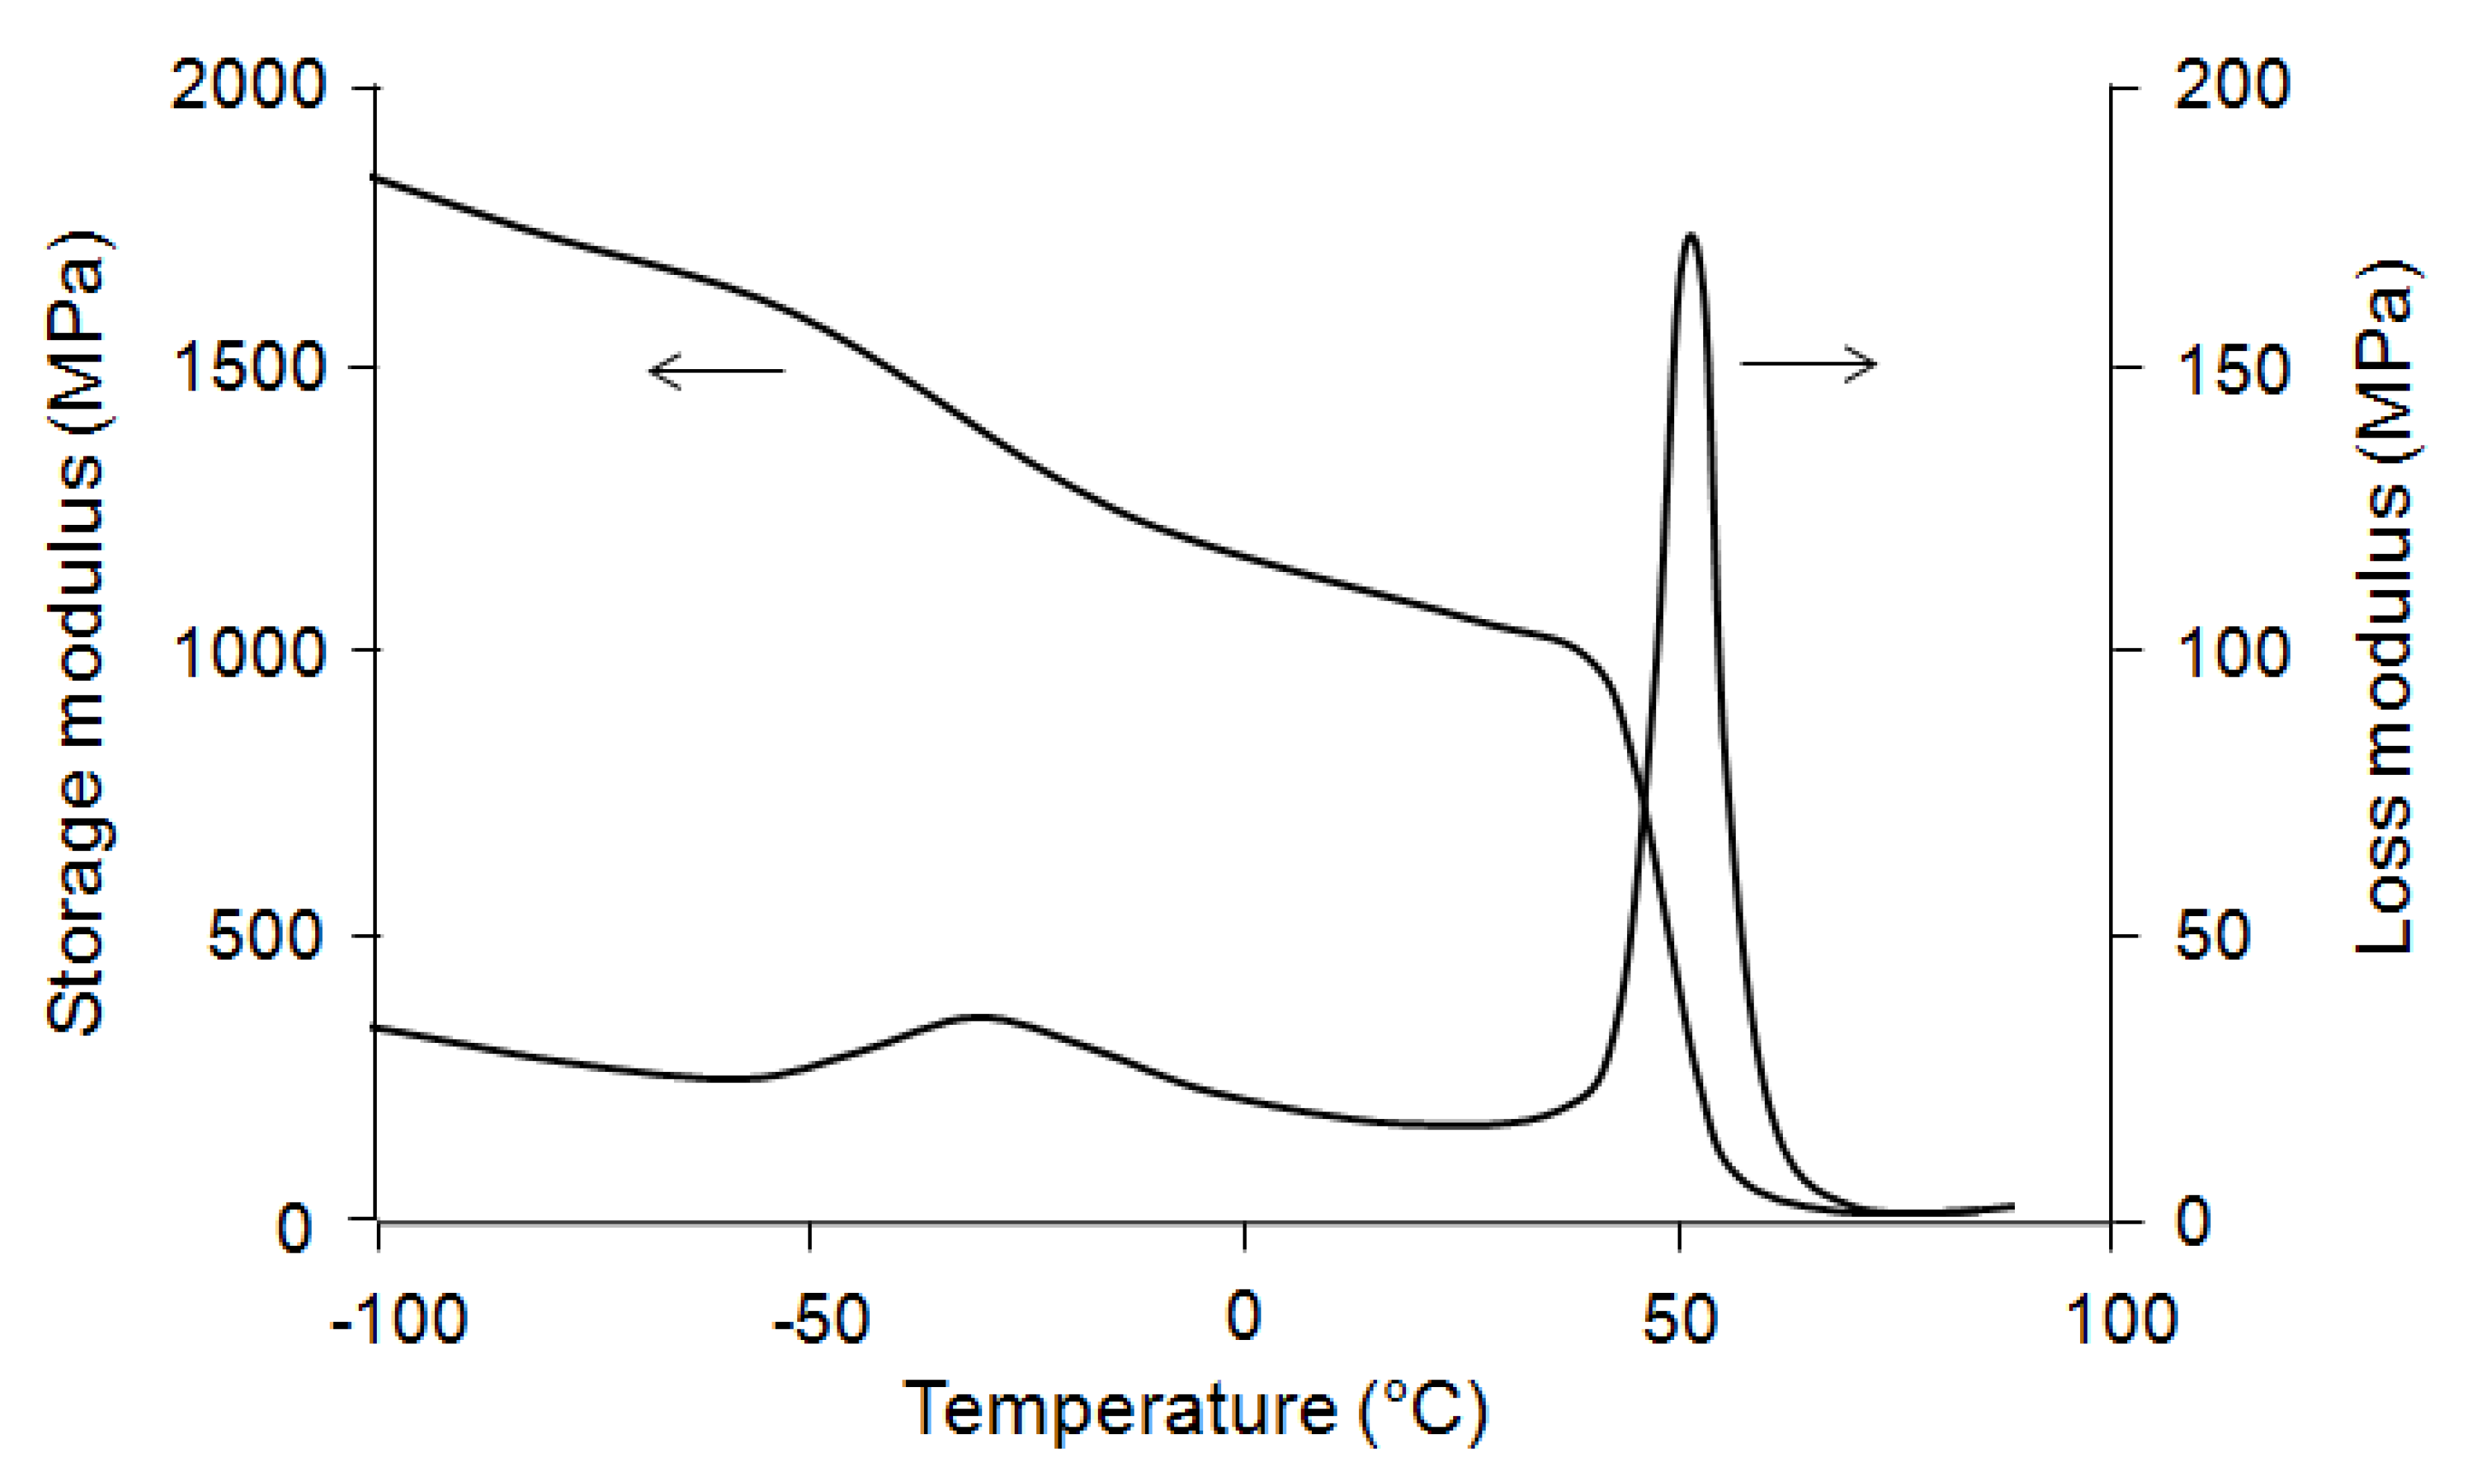
Figure 2). In this case, the loss modulus (E′′) spectra also shows two distinct transition regions, at −30 and 51.5 °C, related respectively to the glass transitions of PBS and PLA.
Figure 2.
Storage (E′) and loss modulus (E′′) spectra of polylactic acid (PLA)/polybutylene succinate (PBS) blend.
Figure 2.
Storage (E′) and loss modulus (E′′) spectra of polylactic acid (PLA)/polybutylene succinate (PBS) blend.
The immiscibility of these two polymers was observed previously by scanning electron microscopy (SEM) [
28] with which the separation of two phases was shown clearly. However, it can be seen that by mixing 80% of PLA with 20% of PBS, the glass transition temperature of PLA in the blend decreases clearly from 58 to 54 °C. This decrease of
Tg value may be contributing to the plasticizing effect of PBS. The results of tensile tests on pure PLA and the PLA/PBS blends confirm this hypothesis (
Table 2). The pure polymer PLA with a very low strain at break (5.2%) is brittle at 24 °C, while the PLA/PBS blend (parallel sample) with a strain at break more than 110% is ductile.
Table 2.
Results of tensile tests at 24 °C, on virgin PLA and blend of PLA/PBS (parallel samples).
Table 2.
Results of tensile tests at 24 °C, on virgin PLA and blend of PLA/PBS (parallel samples).
| Polymer | | E (MPa) | σy (MPa) | εy (%) | σr (MPa) | σr (%) |
|---|
| PLA | Average | 1340 | - | - | 53 | 5.2 |
| Standard deviation | 165 | - | - | 7.5 | 0.40 |
| PLA/PBS blend | Average | 925 | 45 | 4.8 | 31.5 | 110 |
| Standard deviation | 99 | 6.0 | 0.50 | 0.96 | 8.5 |
In fact PBS has a melting point lower than PLA; during extrusion of the blend at a temperature higher than the melting point of PLA, PBS is at very low viscosity; it may partially penetrate between the molecular chains of PLA, like a plasticizer, even it is not miscible in PLA.
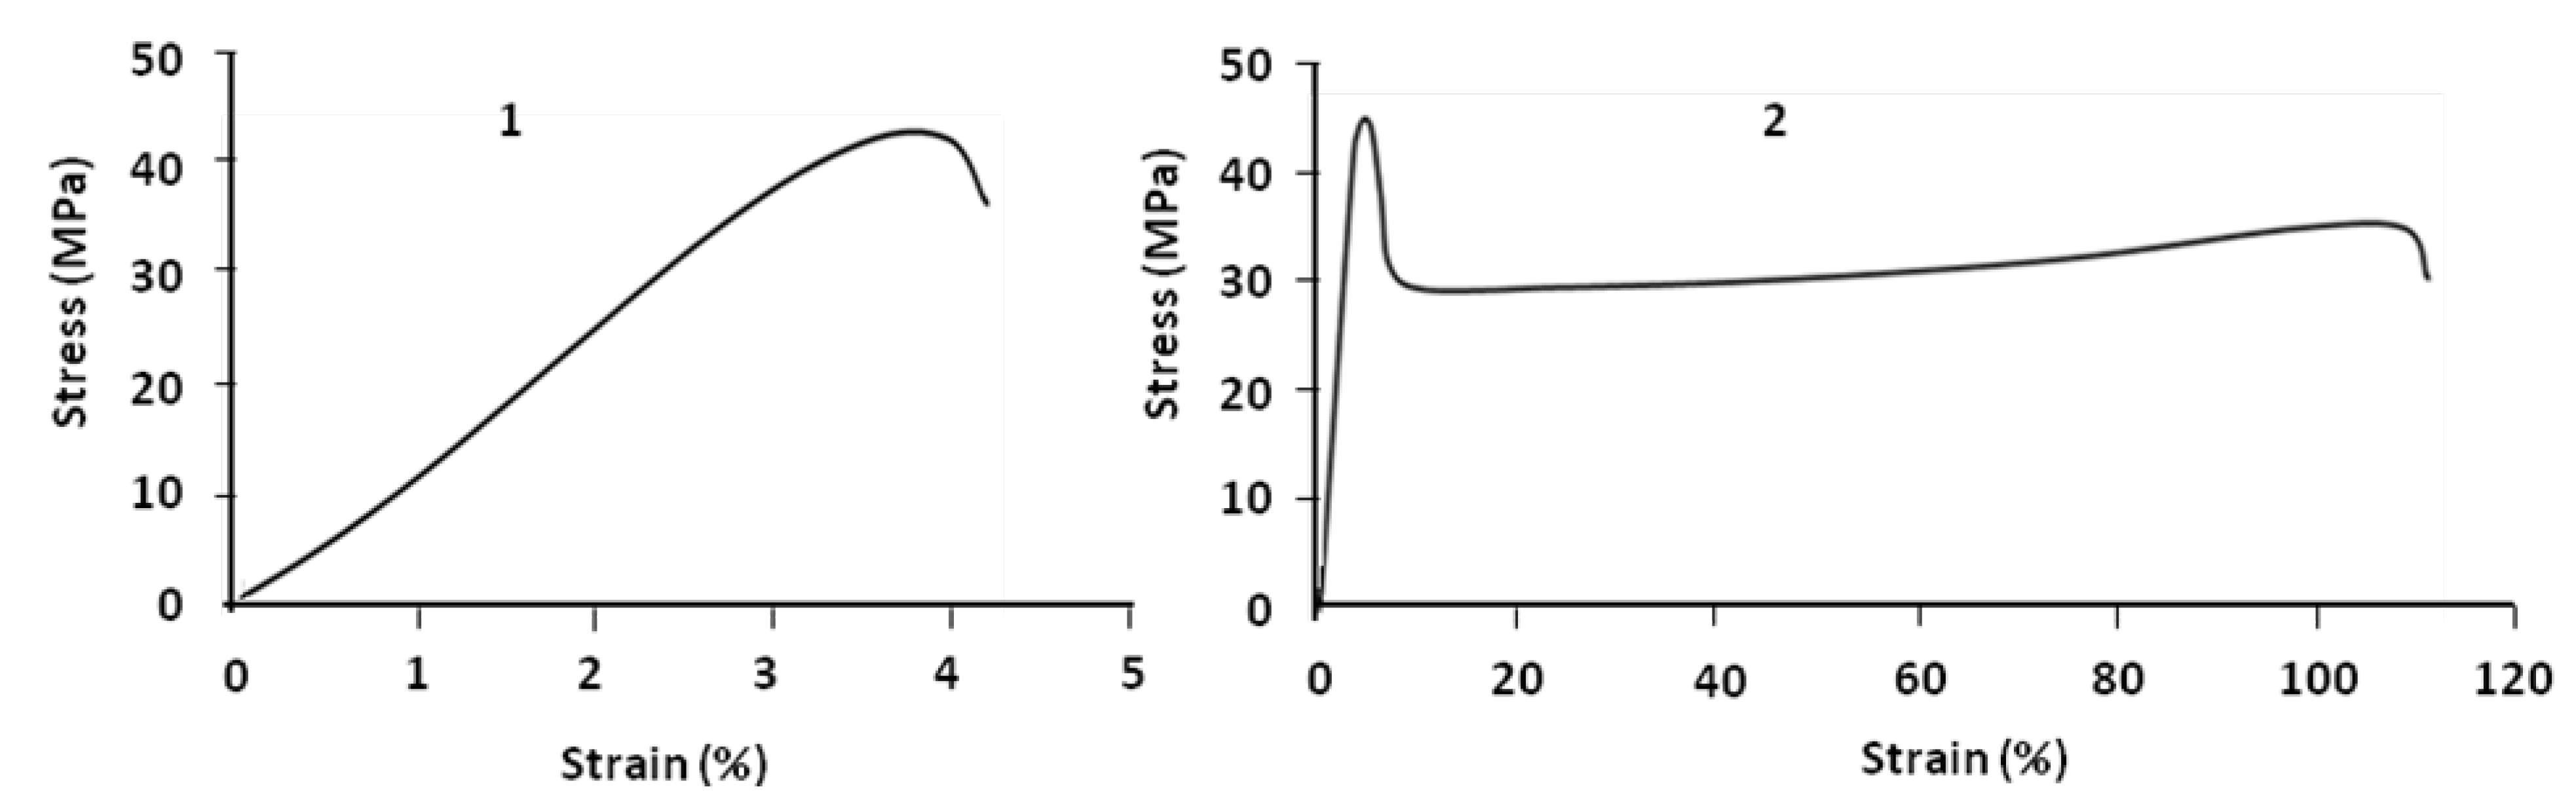
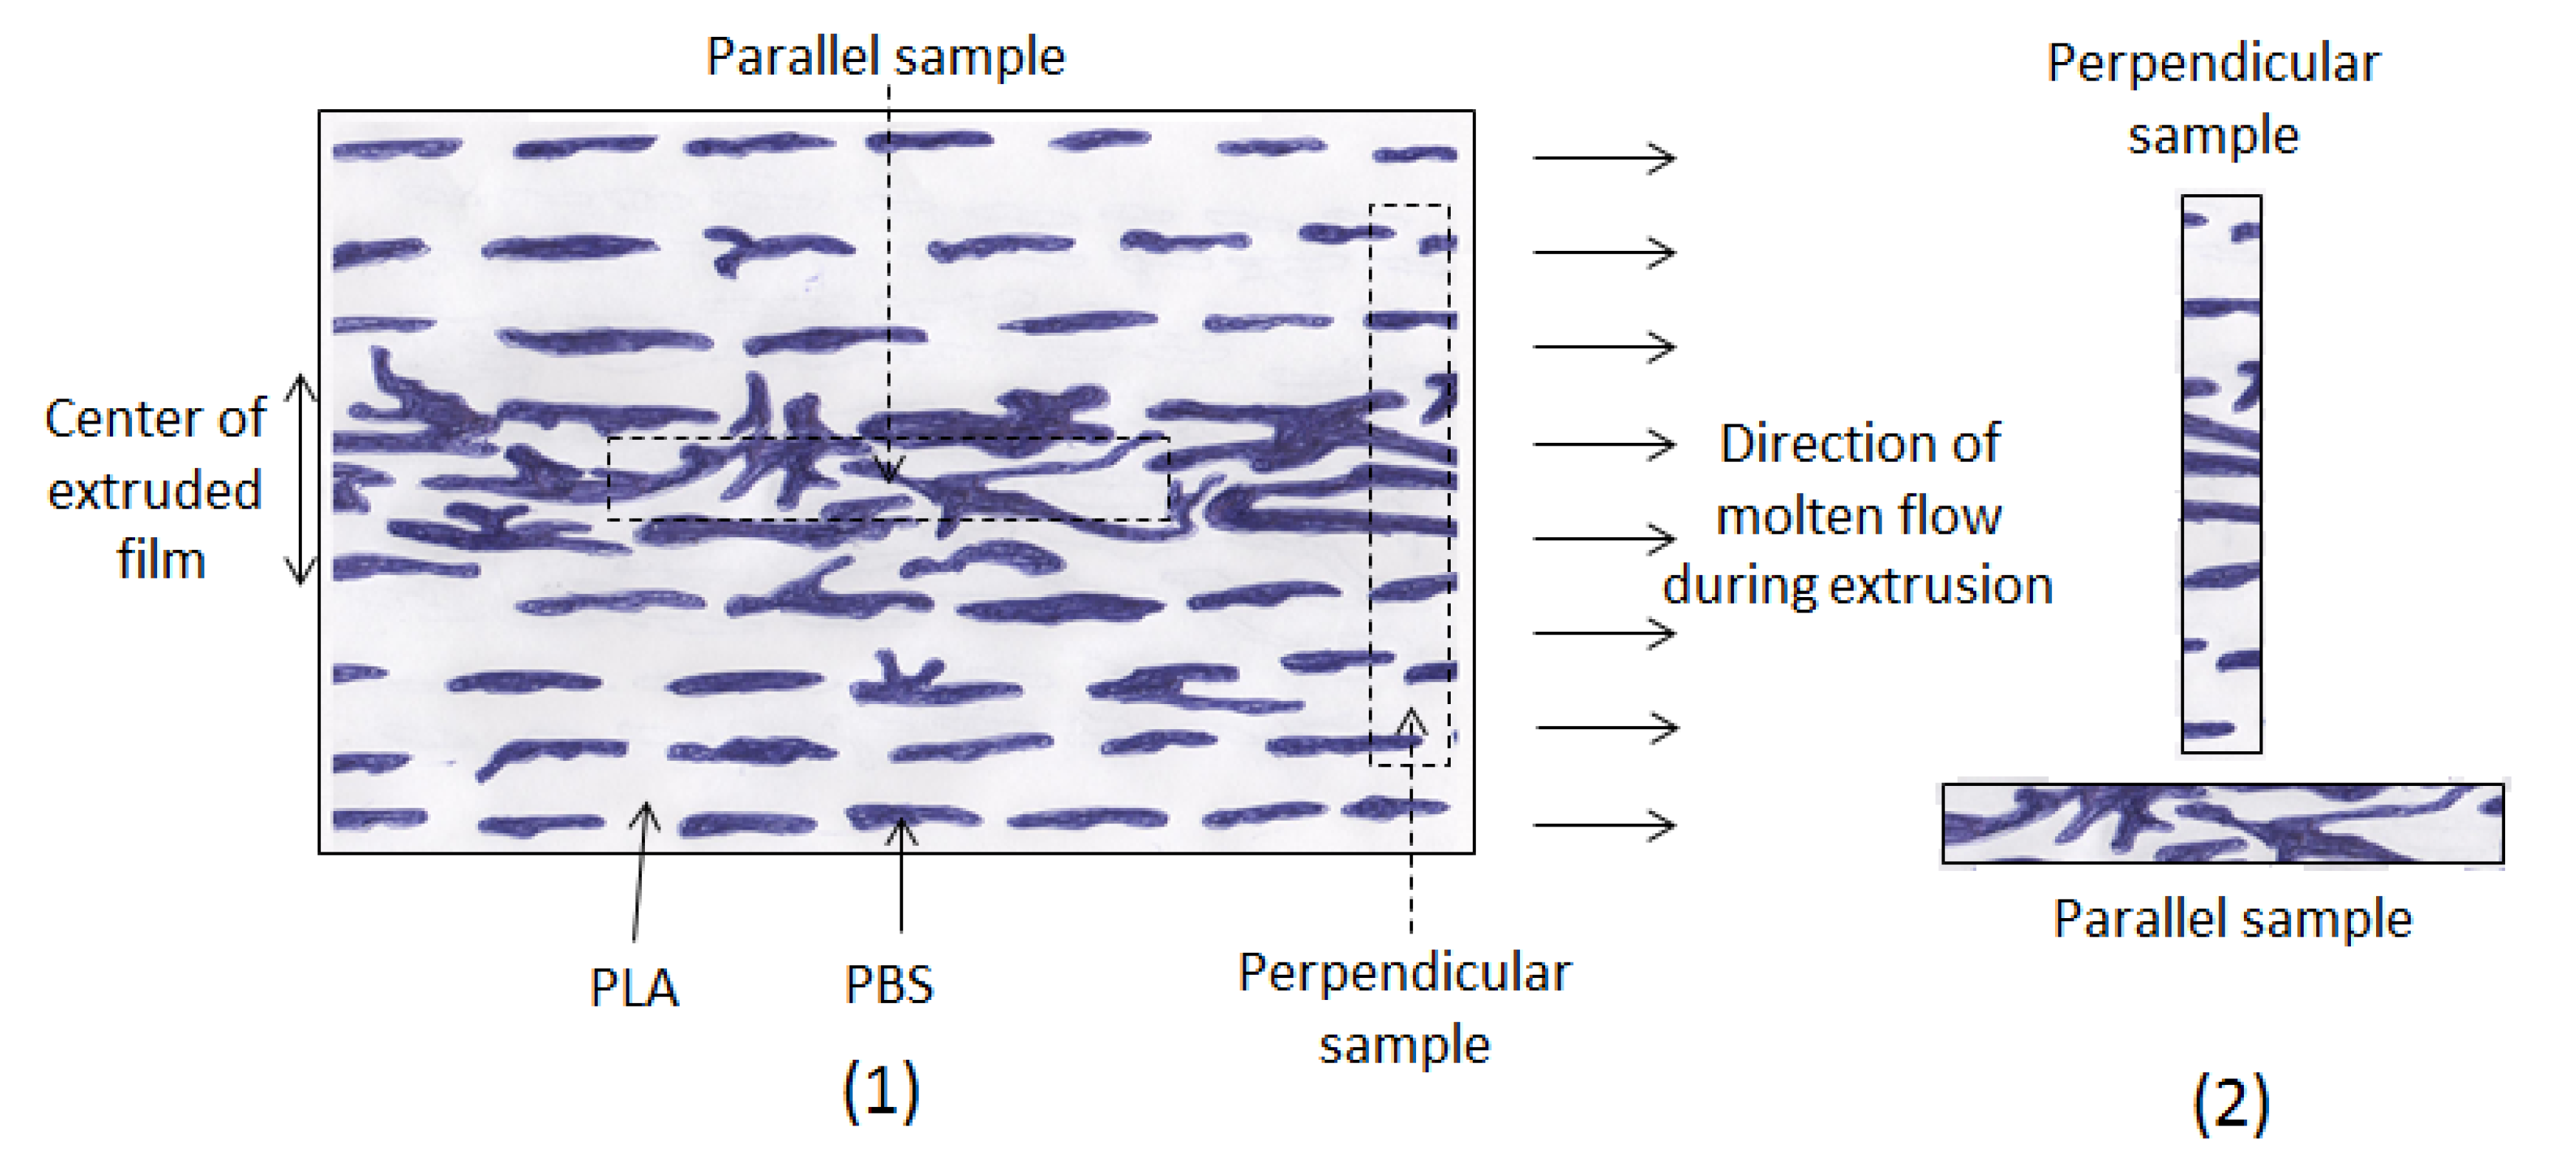
Figure 3 compares parallel and perpendicular samples. For parallel samples the value of strain at break is about 110% at room temperature; that means by blending 20% of PBS and 80% of PLA, the brittleness of PLA is improved and it becomes ductile. This is not the case for the perpendicular sample which always remains brittle.
Figure 3.
Stress–strain curves of PLA (80%)/PBS (20%) at 24 °C: perpendicular (1) and parallel (2) samples.
Figure 3.
Stress–strain curves of PLA (80%)/PBS (20%) at 24 °C: perpendicular (1) and parallel (2) samples.
The difference between parallel and perpendicular samples may be explained as follows:
- (i)
During extrusion, the molecular chains of PLA and the discontinuous phase PBS became oriented in the direction of the flow (
Figure 4). So, because of this orientation, the parallel sample (
E = 925 MPa) is more rigid than the perpendicular sample (
E = 855 MPa).
- (ii)
The standard deviation related to the results obtained from the tests on the parallel samples is more important than the perpendicular samples. In fact, the mechanical properties of the polymer in the center and at the edge of the film are not the same. The samples which are taken from these two zones have different properties.
Figure 4.
Molten film of PLA/PBS blend during extrusion (1); perpendicular and parallel samples (2).
Figure 4.
Molten film of PLA/PBS blend during extrusion (1); perpendicular and parallel samples (2).
After obtaining these results, only parallel samples were used, taken from the center of the extruded film. This type of sample has high ductility (εr = 110% at room temperature), necessary for shape memory study.
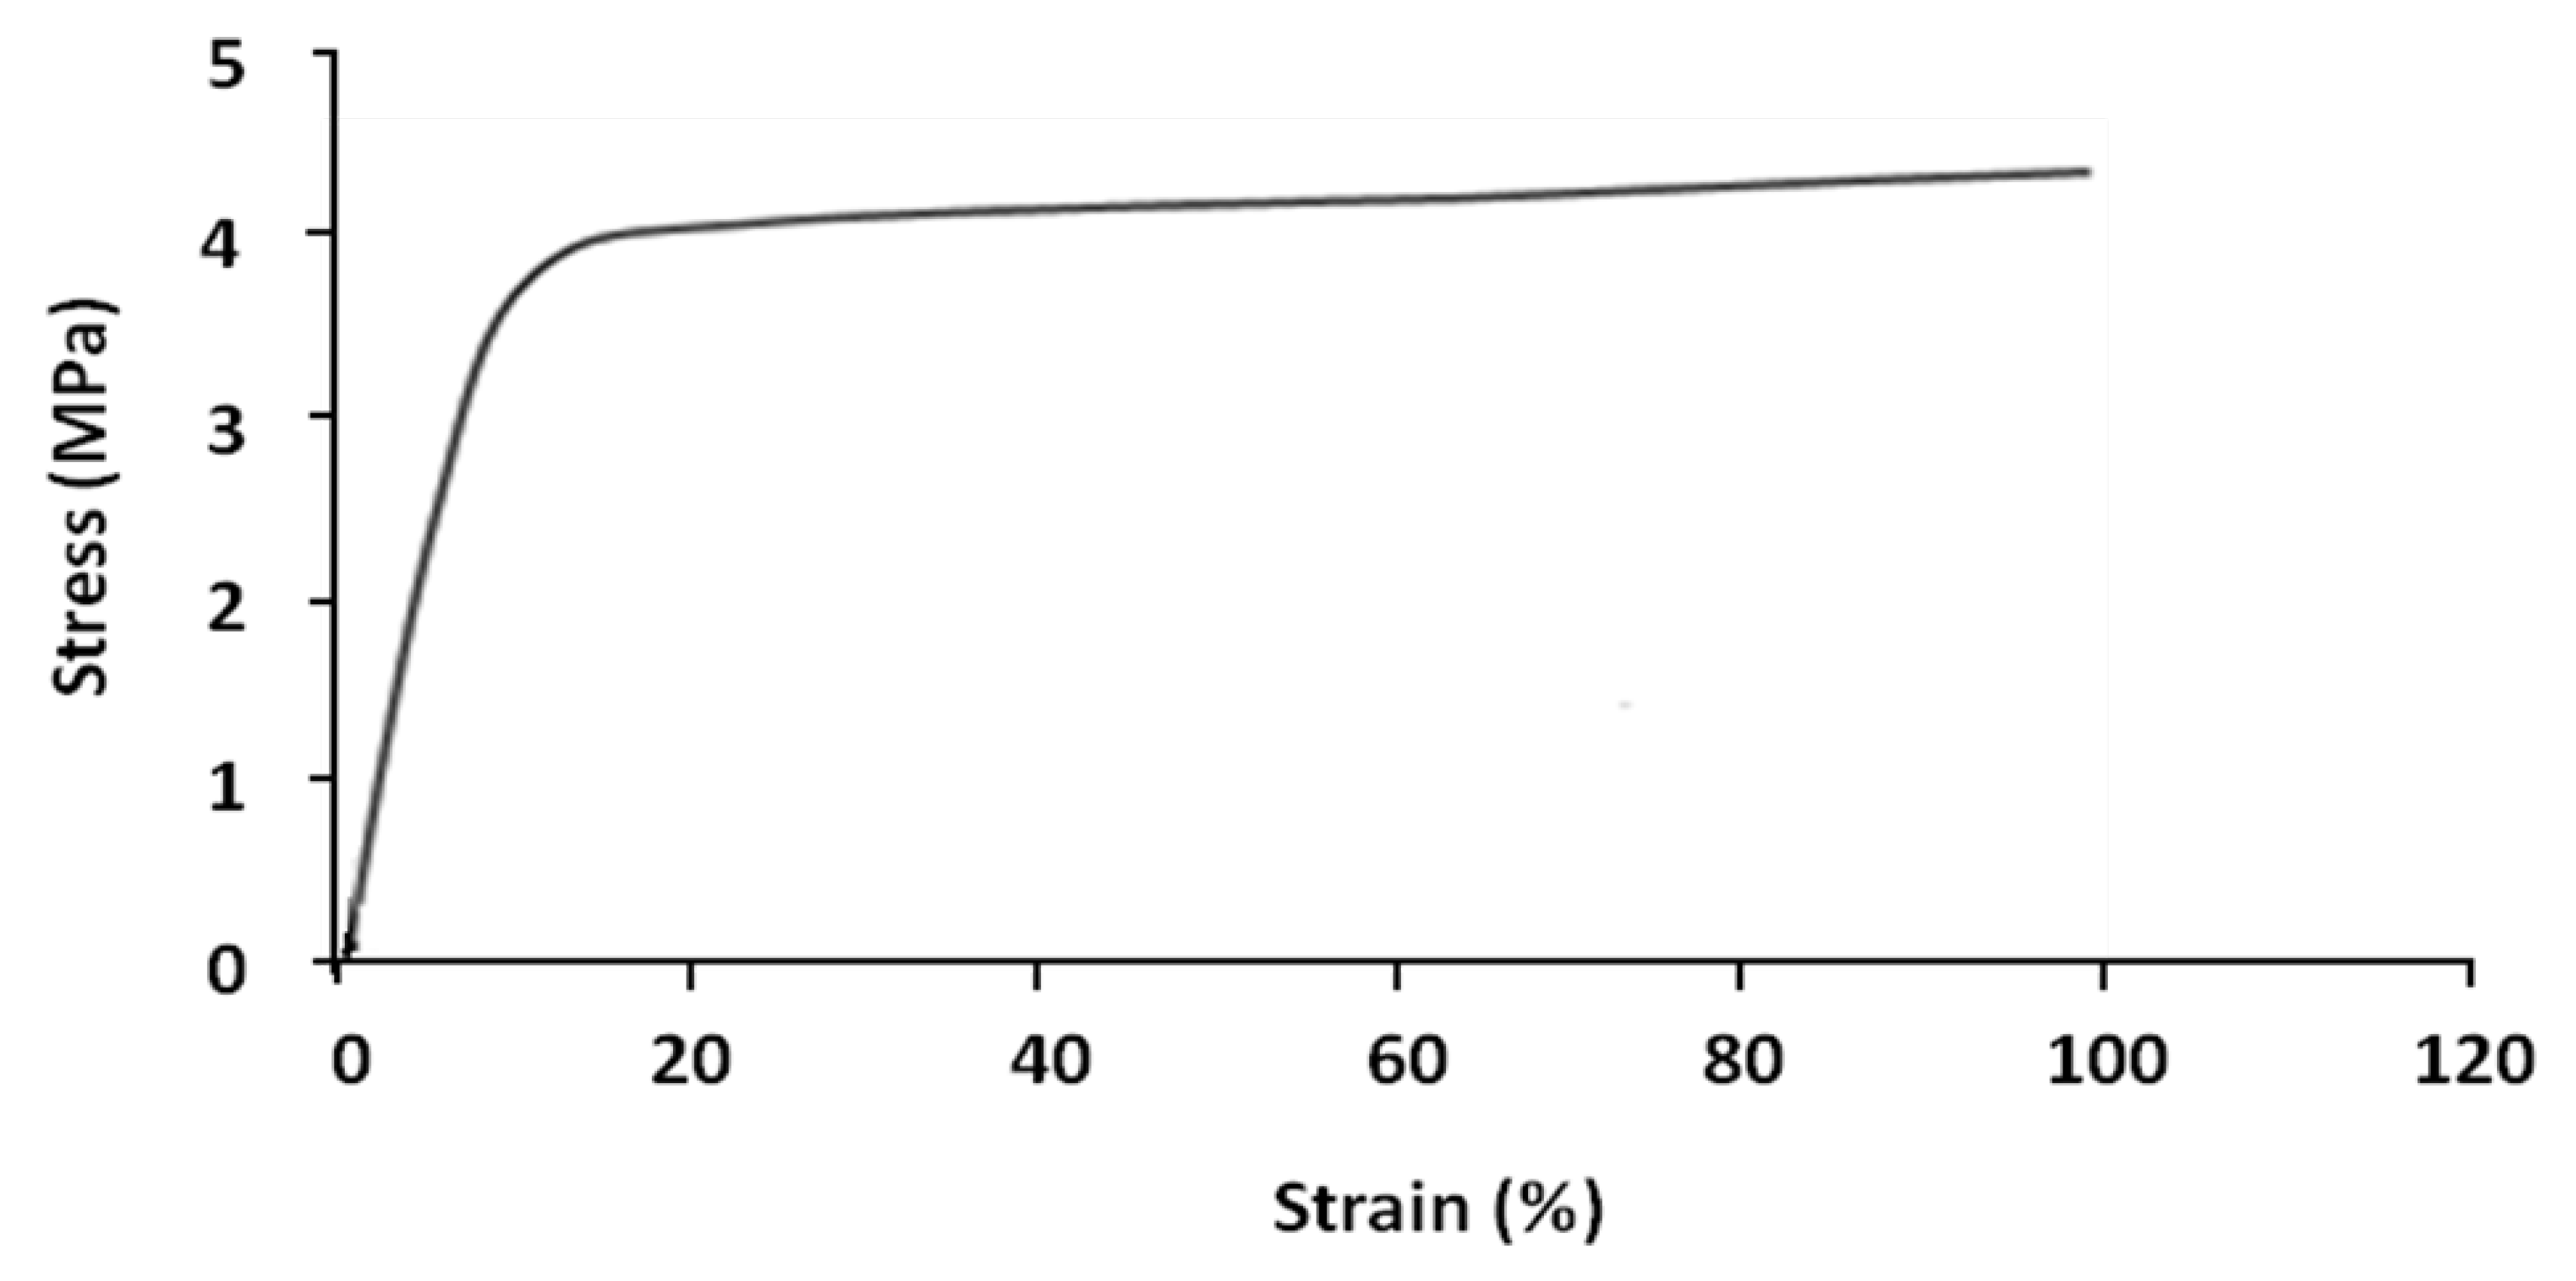
Shape memory tests were carried out on the parallel extruded samples. In general, each shape memory cycle consists of the following successive tests: tensile, stress-relaxation, fixing and recovery. However, certain cycles were limited to tensile, fixing and recovery tests, without stress-relaxation tests. Tensile tests were performed on parallel samples at 70 °C. The result is shown in
Figure 5.
Figure 5.
Nominal stress–strain curves of parallel sample at 70 °C.
Figure 5.
Nominal stress–strain curves of parallel sample at 70 °C.
The sample has two different linear deformation zones; elastic zone (8%–10% strain) and plastic zone (>10% strain). At 100% strain the value of stress is about 4.3 MPa.
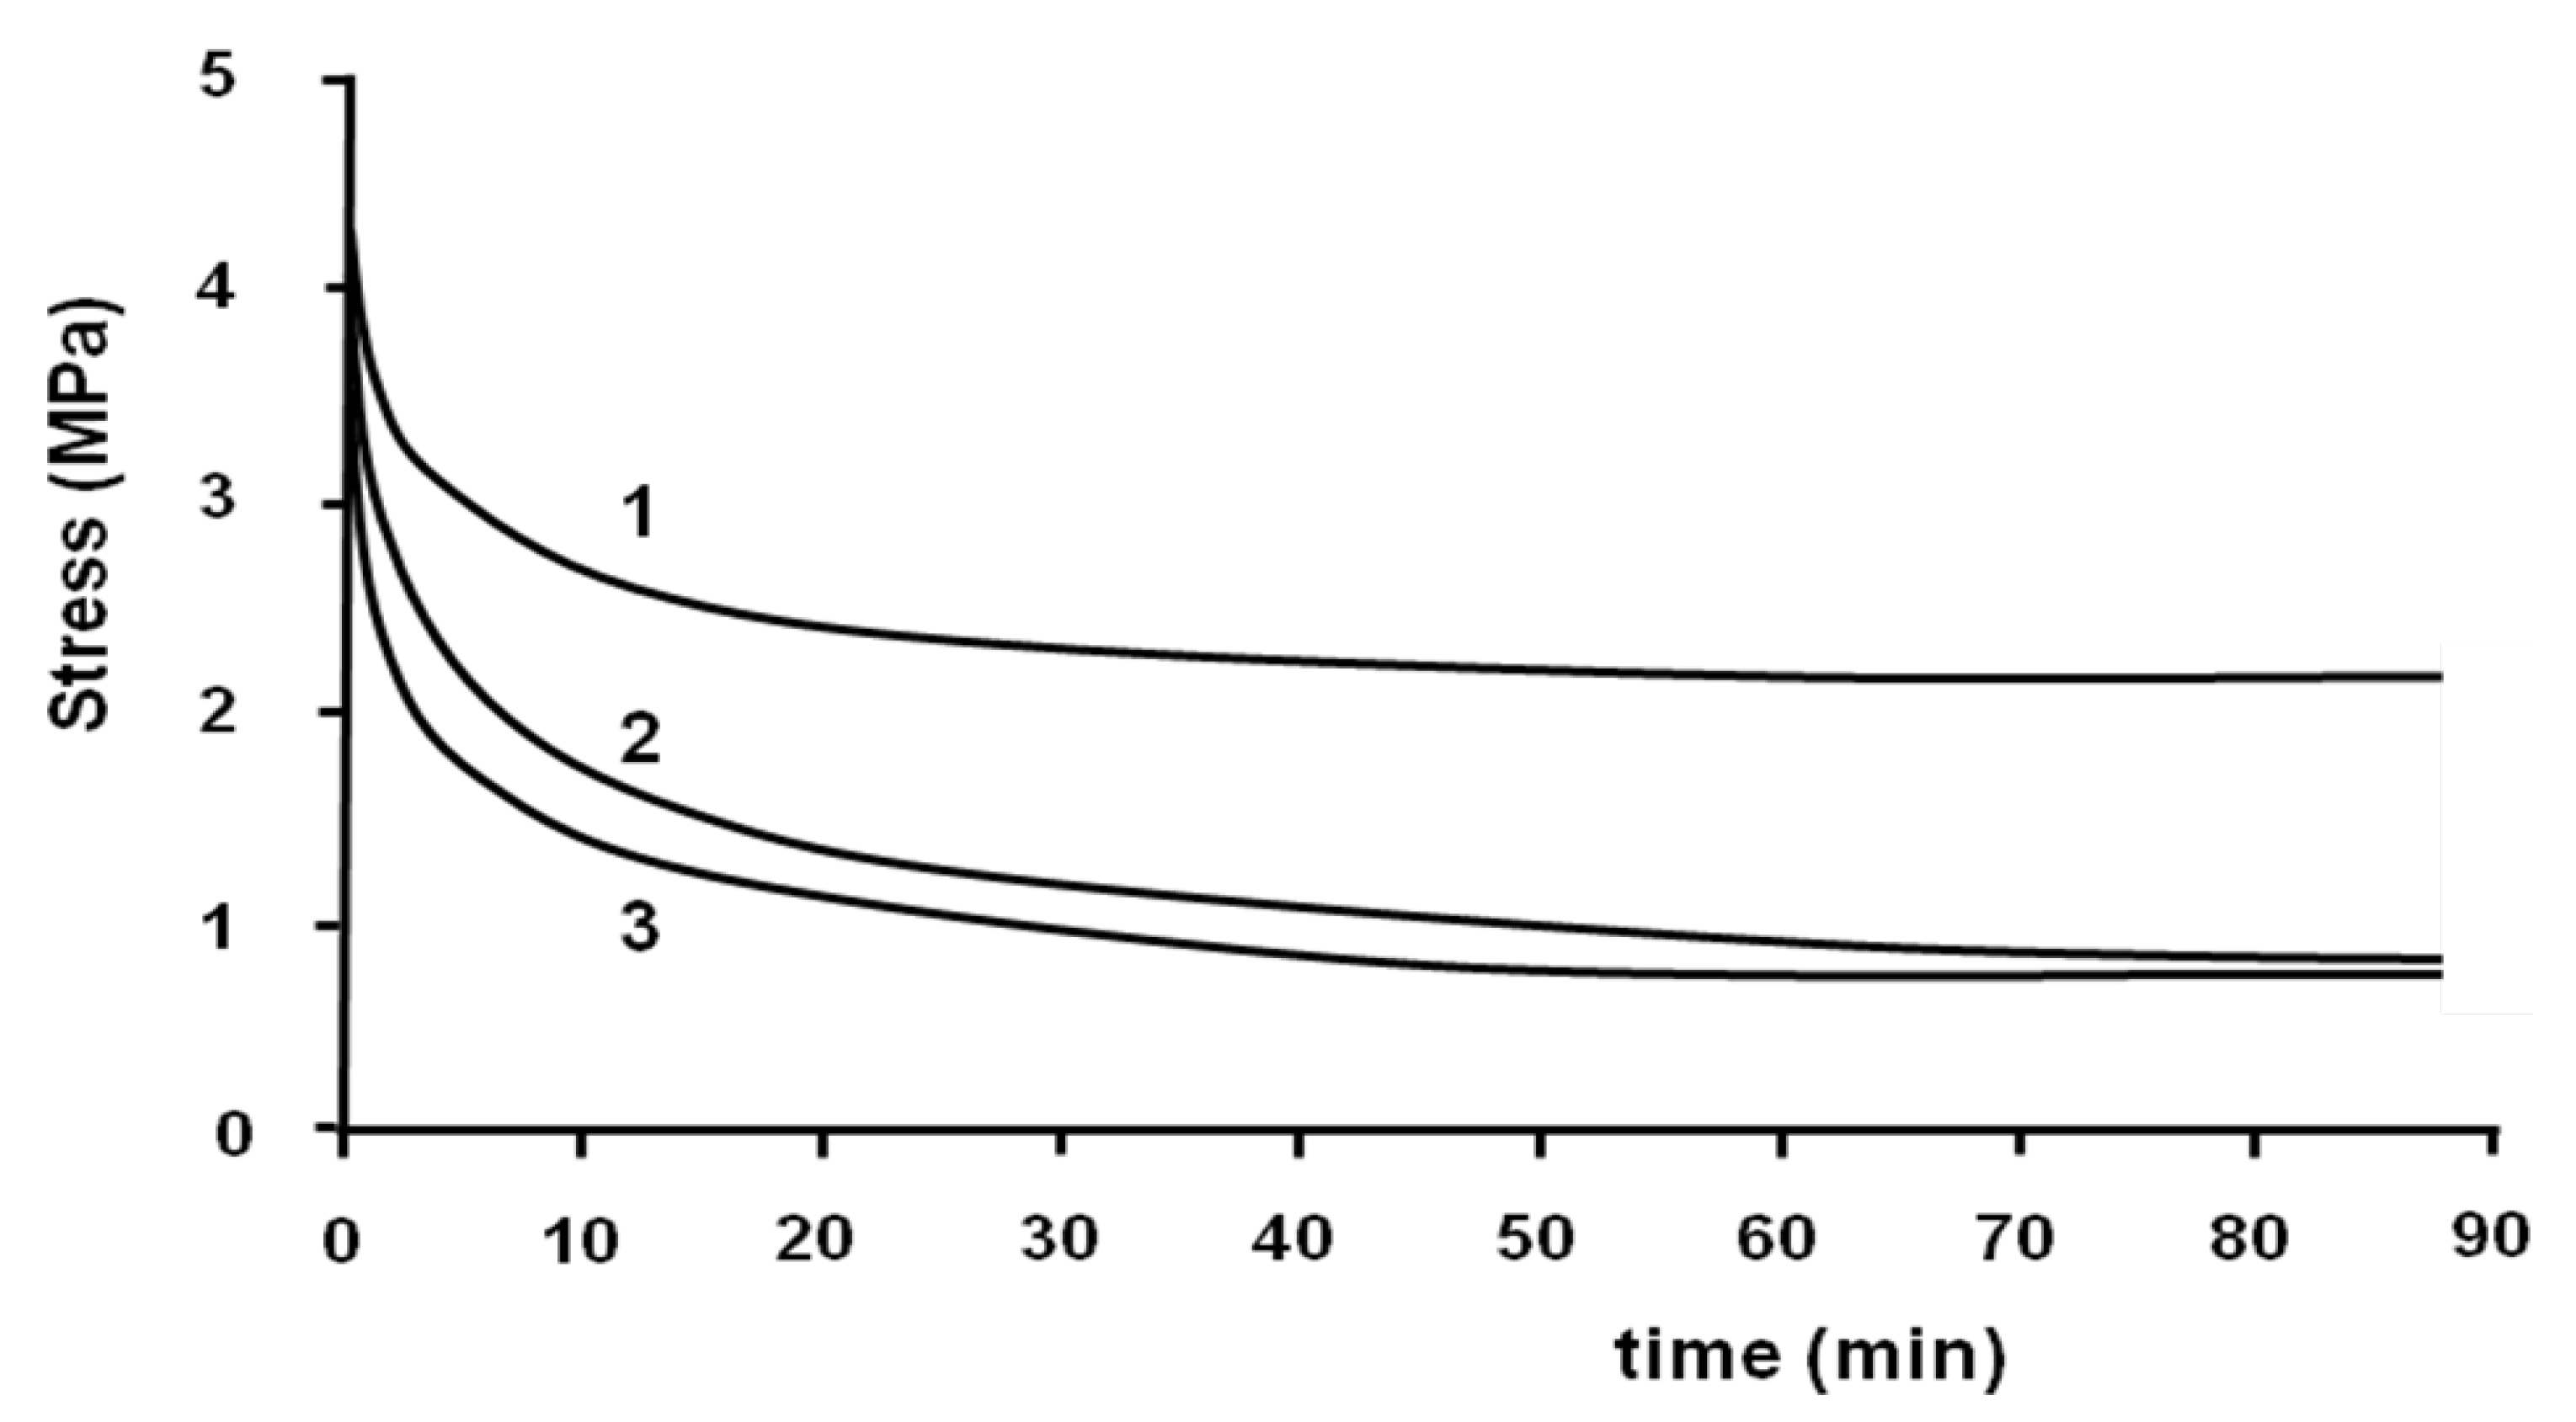
The stress-relaxation isothermal test was performed at the end of the tensile test with the same machine. The strain was taken constantly and the decrease of stress was measured
versus time. This test was performed to eliminate the residual stress induced during the tensile test in the samples. The stress-relaxation tests were performed at 70, 75 and 80 °C (
Figure 6).
Figure 6.
Relaxation tests at 70 °C (1); 75 °C (2) and 80 °C (3).
Figure 6.
Relaxation tests at 70 °C (1); 75 °C (2) and 80 °C (3).
All stress-relaxation curves show two different regimes. At the beginning, the decrease of stress is relatively fast, and then it becomes slow. For example, at 70 °C, the value of stress decreased from 4.3 to 2.3 MPa after 20 min. Then, it decreased to 2.1 MPa after 90 min. It can be seen that the relaxation does not lead the sample to zero stress.
The rate of relaxation and the value of stress at the end of the test depend on the temperature. The rate of decrease of stress is more important when the temperature is higher. The value of the stress at the end of the relaxation test at 70 °C is more important than 80 °C. This value is the same at 75 and 80 °C.
Fixing can be performed after tensile tests or after stress-relaxation tests. During this step, the sample obtains a temporary shape. By cooling the sample with a ventilator, the maximum deformation (100%, 200% and/or 250%) obtained at the end of tensile tests is conserved in the sample.
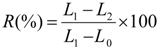
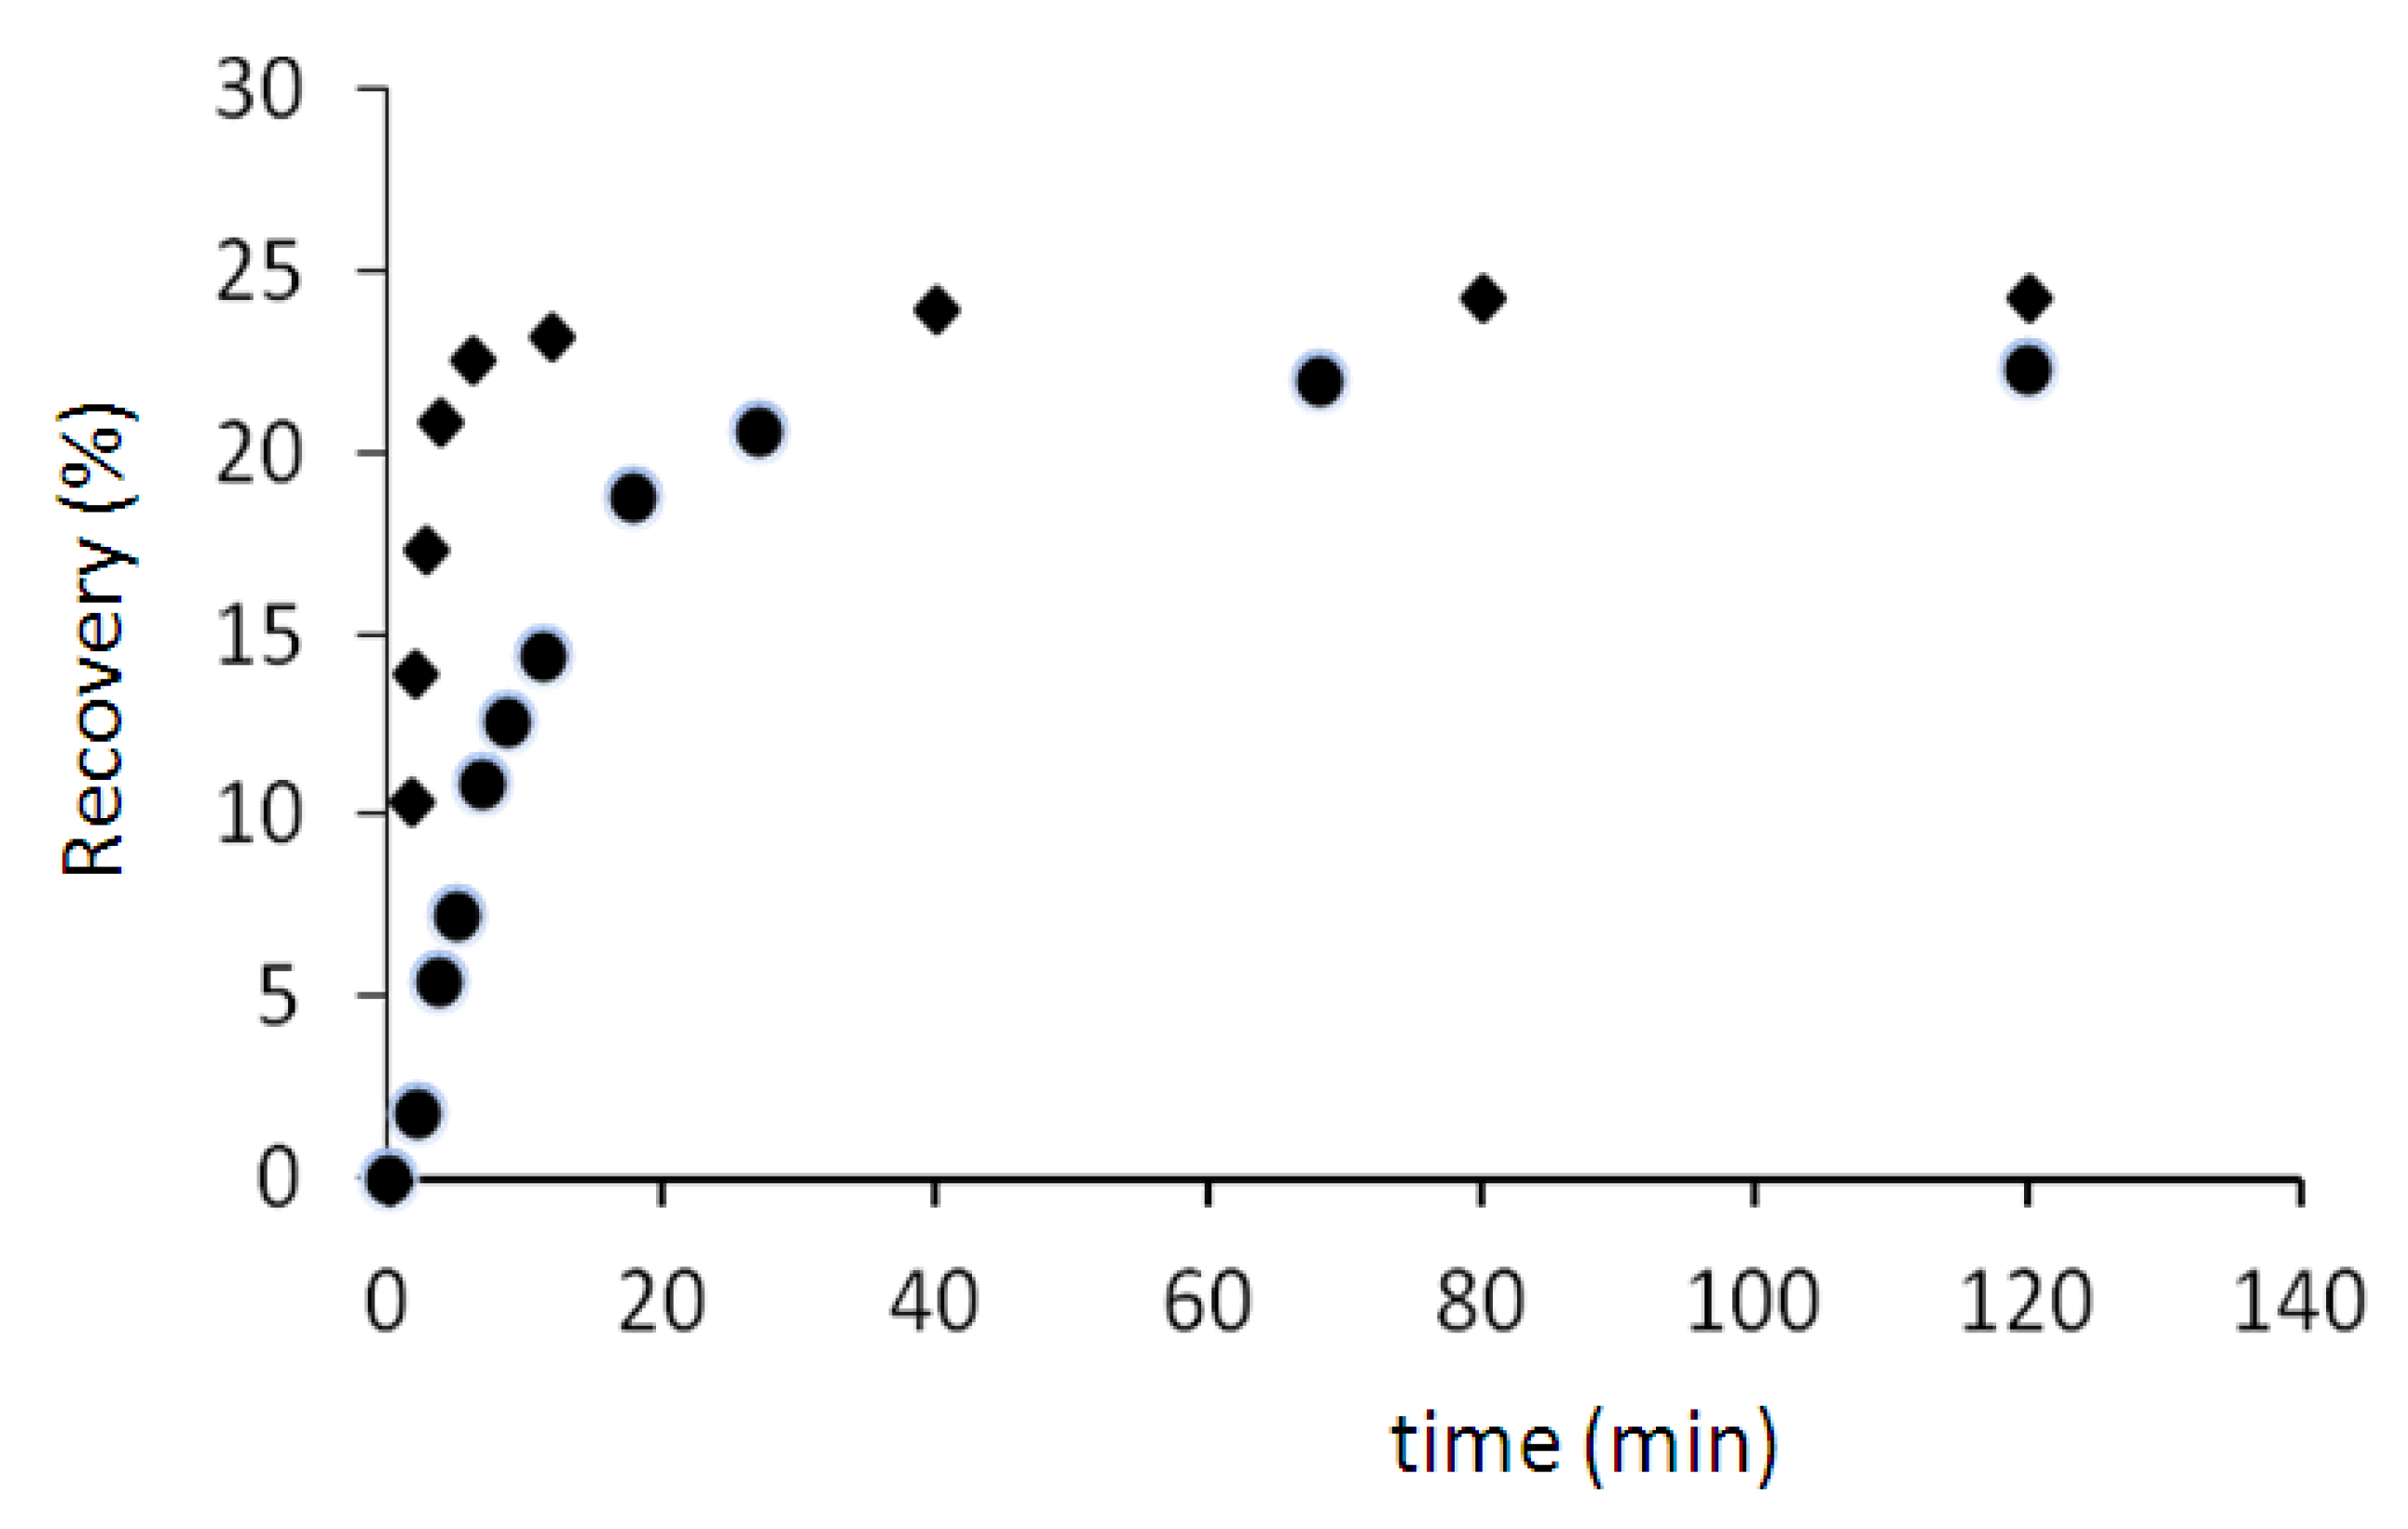
The recovery tests are carried out in a thermal chamber at 70 and 75 °C after fixing at 100% of deformation. The percentage of recovery was determined using Equation (1):
where,
L0 is the initial length of sample,
L1 represents the length of sample after tensile tests and
L2 is the length of sample after recovery test.
The results (
Figure 7) show that the percentage of recovery in two cases (70 and 75 °C) is about 24%. But the recovery rate at 75 °C is higher than the recovery rate at 70 °C. For example after 5 min, the sample regains only 7% of its initial shape when the temperature is 70 °C, but this value is more than 21% (three times more) when the temperature is 75 °C.
The viscoelastic behavior of the blend is determined by comparing the thermodynamic behavior of the SMPs at different stages of the process. These results help to find the relationship between shape memory effect and the viscoelastic properties of the polymer. In fact, by increasing the temperature, the molecular motion becomes more and more important. The test on the stretched sample is especially interesting because, in the glass transition zone, the polymer tries to regain its initial shape.
Figure 7.
Recovery tests at 70 °C (●) and 75 °C (♦).
Figure 7.
Recovery tests at 70 °C (●) and 75 °C (♦).
The results show that the stretching, relaxation test and fixing increase the value of the glass transition temperature. However, the comparison of the DMA spectrum of the samples before and after the recovery test reveals that the Tg of the blend decreases during the recovery test. In parallel samples, before the recovery test, the Tg is about 63.7 °C while after the recovery test it shifts to 62.3 °C. Indeed before the recovery test, the sample is stretched and its molecular mobility is decreased because of this stretching.
5. Analysis of a Multi-Cycle Shape Memory Test
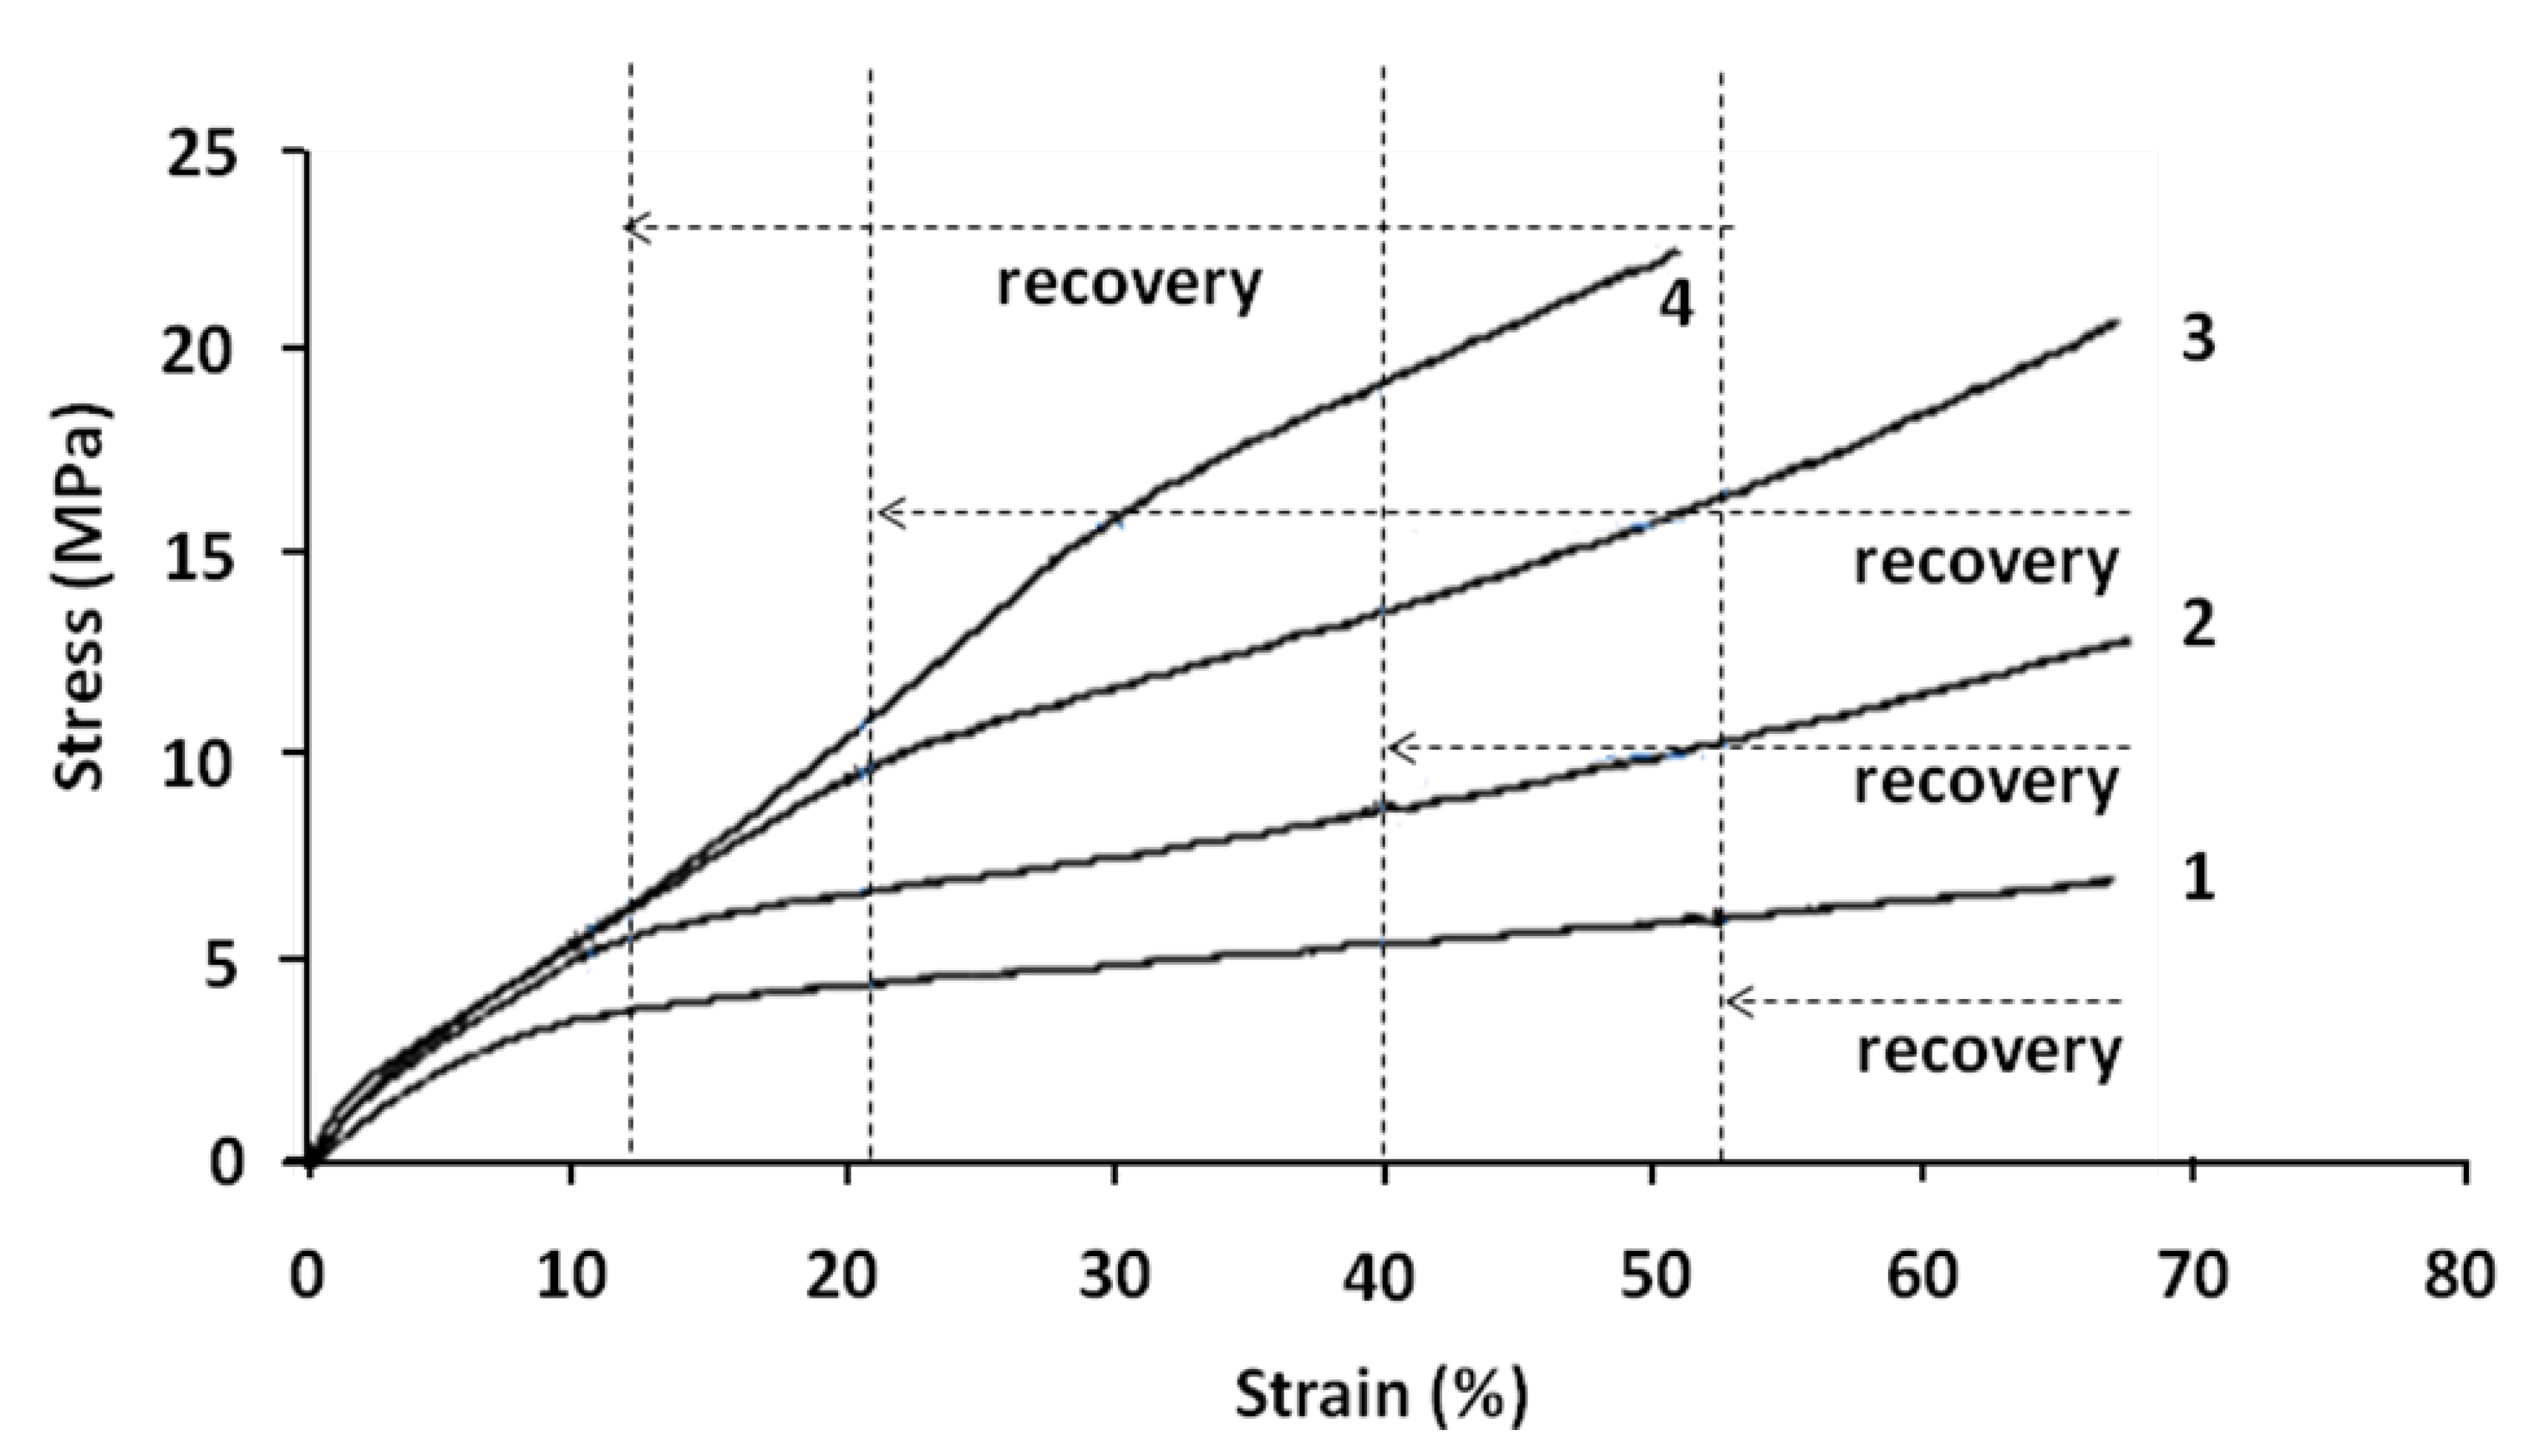
Multi-cycle shape memory tests were performed on the same sample according to the procedure, explained before. The results of the tensile tests (at 70 °C) of the different cycles are presented in
Figure 8. In this figure, real stress is plotted
versus real strain.
These tests were repeated at least with two other samples; the same results were obtained.
Figure 8.
Real stress versus real strain (tensile tests) at the beginning of each cycle of shape memory tests at 70 °C. (1) First cycle; (2) Second cycle; (3) Third cycle; and (4) Fourth cycle.
Figure 8.
Real stress versus real strain (tensile tests) at the beginning of each cycle of shape memory tests at 70 °C. (1) First cycle; (2) Second cycle; (3) Third cycle; and (4) Fourth cycle.
The different cycles may be analyzed as follows:
- (1)
Cycle 1 can be divided into two zones with:
Elastic stage up to 6%–8% of deformation and with a Young’s modulus of 50 MPa;
Plastic linear stage up to 69% of real strain. After recovery test, the sample regains 24% of deformation (6%–8% of elastic part and 16%–18% of plastic part).
- (2)
Cycle 2 begins at the end of the first cycle and after the recovery test. This cycle is obviously divided into three linear stages.
First stage up to 3%–4% of deformation and with a modulus of 110 MPa;
Second stage up to 12% of real strain and with a modulus of 41 MPa. The stress–strain curve at this stage is relatively linear;
Third stage with a modulus of 11 MPa. In this stage, the stress–strain curve remains first linear up to 30% of deformation; then its slope increases.
- (3)
Cycle 3 begins at the end of the second cycle and after recovery test. This cycle is also divided into three linear stages.
First stage up to 3%–4% of deformation and with a modulus of 115 MPa;
Second stage up to 20% of real strain and with a modulus of 42 MPa. The stress–strain curve at this stage is relatively linear;
Third stage with a modulus of 20 MPa. In this stage, the stress–strain curve is relatively linear up to 45% of deformation. Then its slope increases because of the molecular orientation.
- (4)
Cycle 4 begins at the end of the third cycle and after recovery test. As in previous cycles, it is separated into three different stages.
First stage up to 3%–4% of deformation and with a modulus of 130MPa;
Second stage up to 30% of deformation and with a modulus of 44 MPa. In this stage, the stress–strain curve is not linear; the increase of its slope may be related to the molecular orientation;
Third stage up to 50% of real strain and with a modulus of 37 MPa. In this stage, the stress–strain curve is relatively linear.
These results can be summarized by the following comments:
(1) It can be seen that during the first cycle, the stress–strain curve is a classical one. From the second cycle, the obtained tensile curves show three stages. Stage 1 seems to correspond to an elastic behavior. Stage 2 is an intermediate behavior stage. Stage 3 follows Stage 2 until the end of the test;
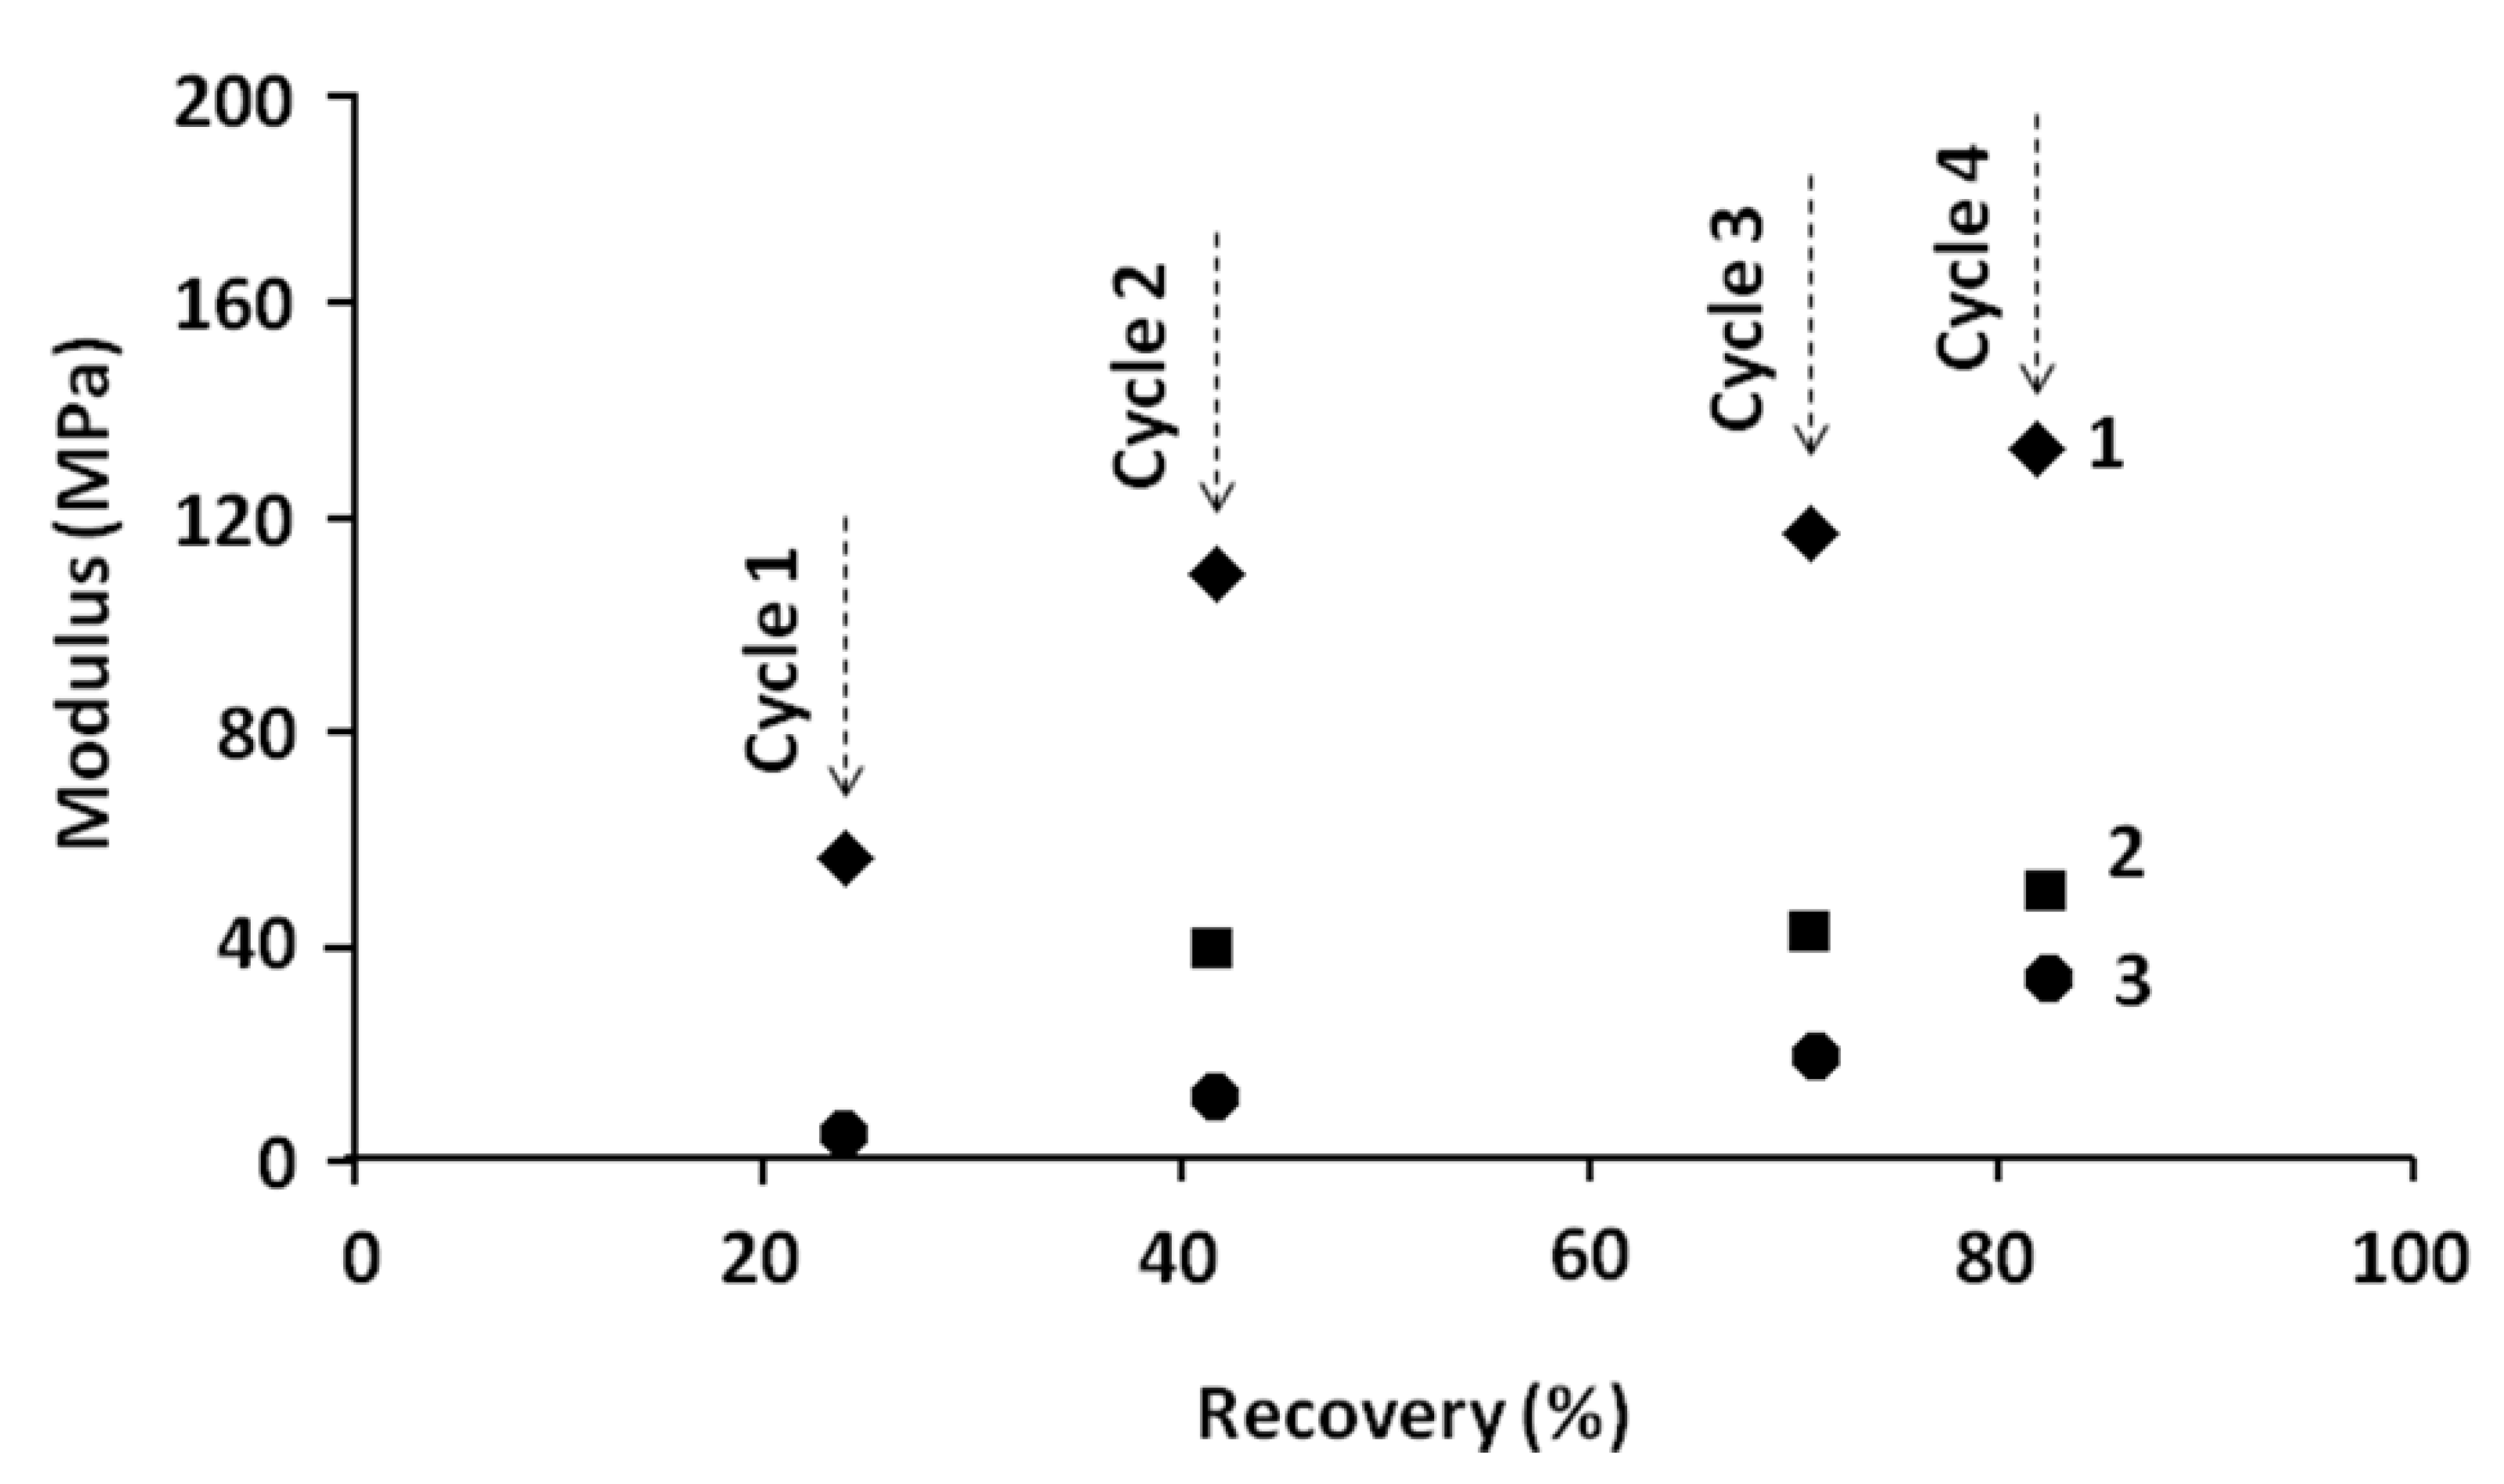
(2) The slope measured during Stage 1, assumed to be a Young’s modulus,
E1 increases with the number of cycles, from 50 to 130 MPa (
Figure 9 and
Table 3). This increase in the stiffness of the blend may be related to the reinforcement of the homogenous matrix, PLA phase (hard segment). The orientation of molecular chains in the PLA structure may be presumed as the cause of this reinforcement. However the change of
E1 between first and second cycles is more important (from 50 to 110 MPa). From the second cycle,
E1 changes less and the variation of its value is not very significant.
Figure 9.
Relationship between tensile modulus and recovery percentage related to the first zone (E1) and the second and third zones (E2 and E3) of stress–strain curves (at 70 °C) of different successive cycles.
Figure 9.
Relationship between tensile modulus and recovery percentage related to the first zone (E1) and the second and third zones (E2 and E3) of stress–strain curves (at 70 °C) of different successive cycles.
Table 3.
Relationship between percentage of recovery and modulus related to the different stages of different cycles of multi-cycle tests.
Table 3.
Relationship between percentage of recovery and modulus related to the different stages of different cycles of multi-cycle tests.
| Cycle No. | Stage | Residual stress (MPa) | Recovery (%) | E1 (MPa) | E2 (MPa) | E3 (MPa) |
|---|
| 0 | Initial | 0 | - | - | - | - |
| 1 | before recovery | 7.2 | | | | |
| after recovery | 6.5 | 24% | 50 | - | 5 |
| 2 | before recovery | 13.1 | | | | |
| after recovery | 9.5 | 42% | 110 | 41 | 11 |
| 3 | before recovery | 21 | | | | |
| after recovery | 11 | 71% | 115 | 42 | 20 |
| 4 | before recovery | 22.9 | | | | |
| after recovery | 6.5 | 82% | 130 | 44 | 37 |
(3) Regarding the formation and development of Stage 2, several remarks on the constitutive tensile curve should be made:
- (a)
The slope of the curves related to this stage remains in the same order of magnitude (41–44 MPa) and its value is nearly the same as that of the original stiffness of the material in cycle 1 (50 MPa);
- (b)
The extent of this stage increases significantly with the number of cycles;
- (c)
The slope of Stage 3 increases also with the number of cycles. In this stage, the last part of the curves presents a transition zone of kinetic change. After this zone, the material becomes stiff. This is classically attributed to the orientation of the macromolecular chains. One should draw attention to the fact that the level of stress measured at this point is always of the same order of magnitude as the level of stress reached at the transition (“yield point”) between Stages 2 and 3 at the next cycle. For example, the transition zone of curve 1 (around 6 MPa) corresponds to the level of the stress observed at the “yield point” (between Stages 1 to 2) of the curve 2.
For a first approach, the Stage 2 of the curve 2 may be considered also as the expression of an elastic behavior. Indeed, in order to understand the origin of the appearance and development of Stage 2, we propose here an original phenomenological interpretation of the consecutive tensile curves. Let us first take a classical case. When the polymer is under plastic deformation (and more generally “anelastic deformation”), we can assume that the total strain (ε
tot) can be divided in two parts, elastic (ε
e) and plastic (ε
p) deformations:
In the case of linear elasticity:
At the end of the first cycle, during fixing, the temperature decreases under the glass transition zone and the sample passes from a rubbery state (70 °C) to a glassy state (room temperature) leading to an increase of the Young’s modulus. Thus the elastic part decreases (Equation (3)) and tends to zero, leading to an increase of plastic (anelastic) strain which tends towards the imposed total strain (Equation (2)). So the yield stress on the curve related to cycle 2 corresponds to the stress at the end of fixing during cycle 1. On the other hand, from the phenomenological point of view, fixing leads to a hardening of the polymer.
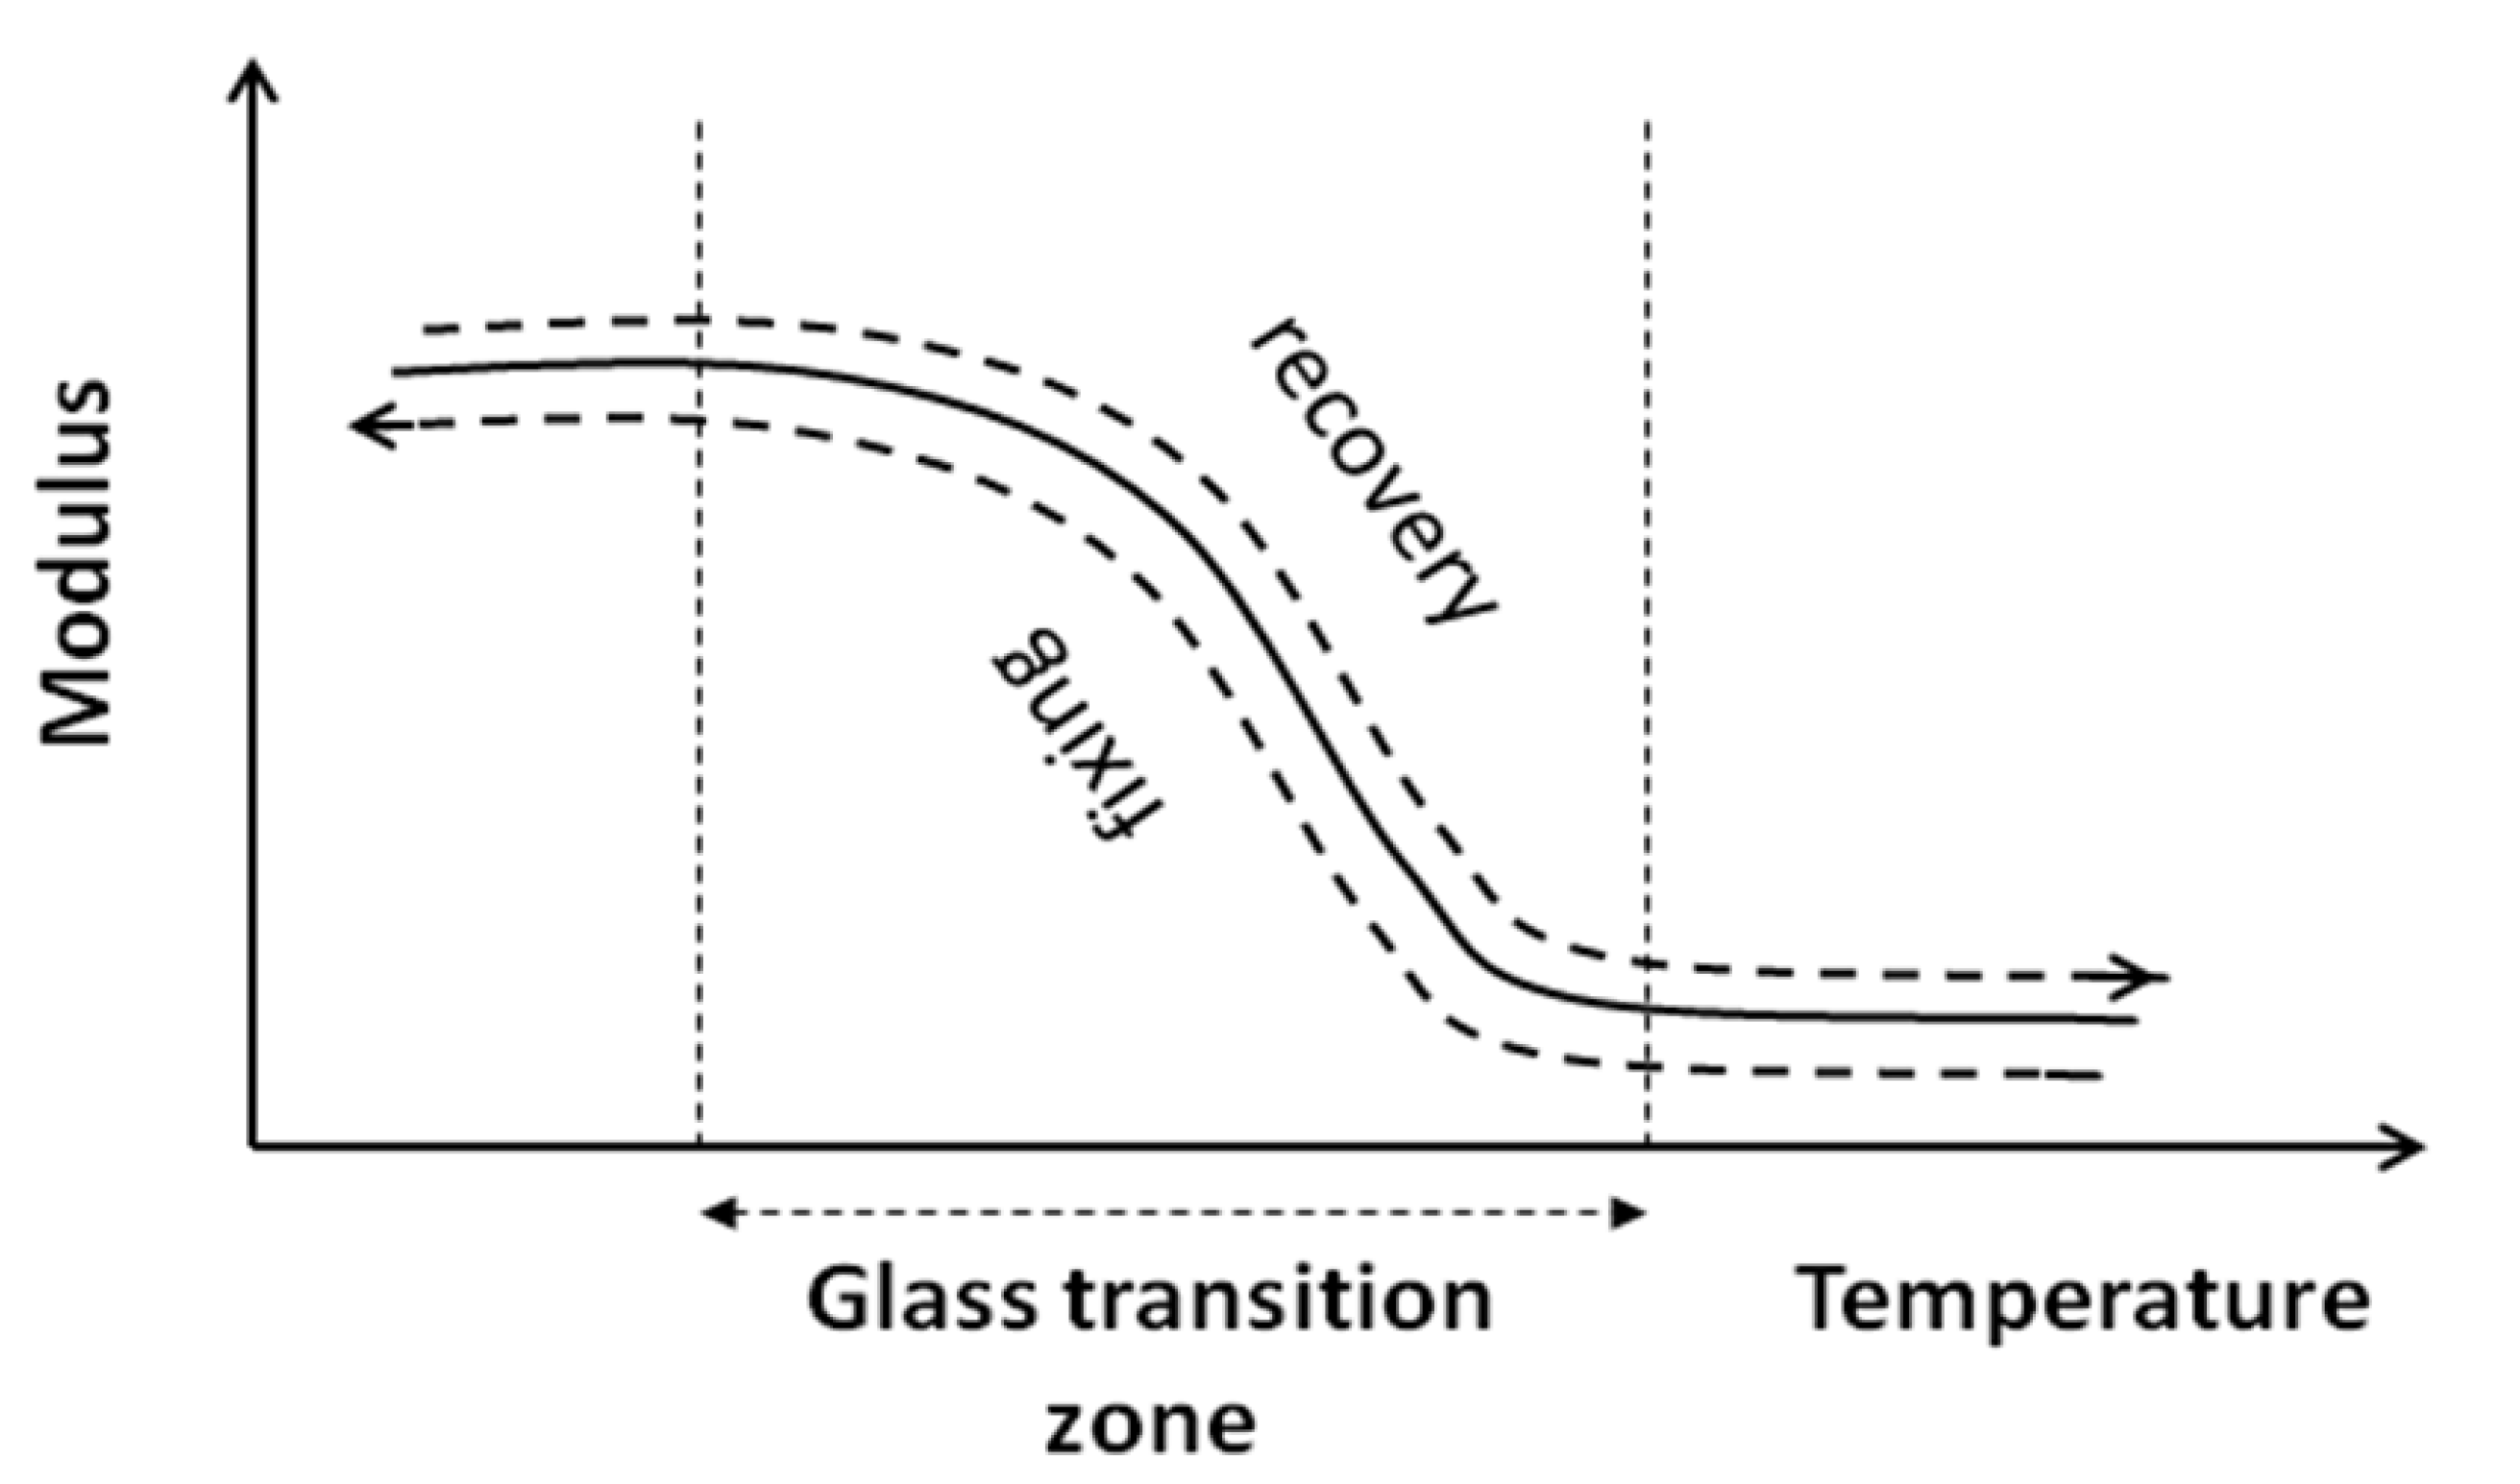
When performing recovery, the specimen is submitted to a driving force.
Figure 10 shows the elevation of temperature up to the glass transition which leads to a decrease of the stiffness simultaneously, due to decrease in the plastic strain (equilibrium between plastic and elastic strain, see Equation (2)), where the elastic part of the strain is released.
Figure 10.
Variation of modulus versus temperature (fixing and recovery).
Figure 10.
Variation of modulus versus temperature (fixing and recovery).
Moreover the extent of Stage 2 increases significantly with the number of the cycle. This phenomenon may be understood by the hardening effect due to the fixing as it has been explained by the fact that the level of stress at this point is always of the same order of magnitude as the “yield point” of the previous cycle. This expression of a second elastic phase can be explained by different physical phenomena as, for example, the local effect due to the multi-phased configuration. Indeed, the localization of the deformation around the heterogeneity coupled with chain orientation can produce this kind of effect. This will be discussed in a further paper through the results of a micromechanical model using the concept of a coated heterogeneity.
(4) Additionally, the presence of a transition zone on Stage 2 for curve 4 (cycle 4) can be noticed. It seems after several cycles the orientation of the chain has been greatly facilitated and can be activated sooner even during cycle 2.
6. Shape Memory Effect
Some new concepts of shape memory effect are discussed by looking at the origin of the recovery and driving force. For example, partial shape memory effect, relationship between the shape and properties of SMP, and shape memory in micro-scale domains.
6.1. Origin of the Recovery and Driving Force
Because of the temperature increase during the recovery test, the stiffness of the polymer decreases leading to the decrease of the elastic (or viscoelastic) part of the strain. Consequently, the partition of the strain of Equation (1) leads to the decrease of the plastic strain. The release of the elastic part of the strain contributes partially to the recovery.
The driving force responsible for the shape memory effect is in fact the residual stress introduced in the sample during the tensile test.
In the case of polymers without shape memory, this deformation in the plastic zone is irreversible. The sample will recover only the elastic portion of deformation when it is released in the plastic zone. In this case if the test temperature is below the Tβ and the polymer is in its glassy state, due to a low mobility, the elastic deformation will be small and the sample remains relatively far from its original form. However, if the test temperature is above the Tβ and especially when the polymer is in a rubbery state, with a high molecular mobility, the elastic deformation may be very important and when the sample is released at the end of the tensile test, it can regain an important part of its original shape.
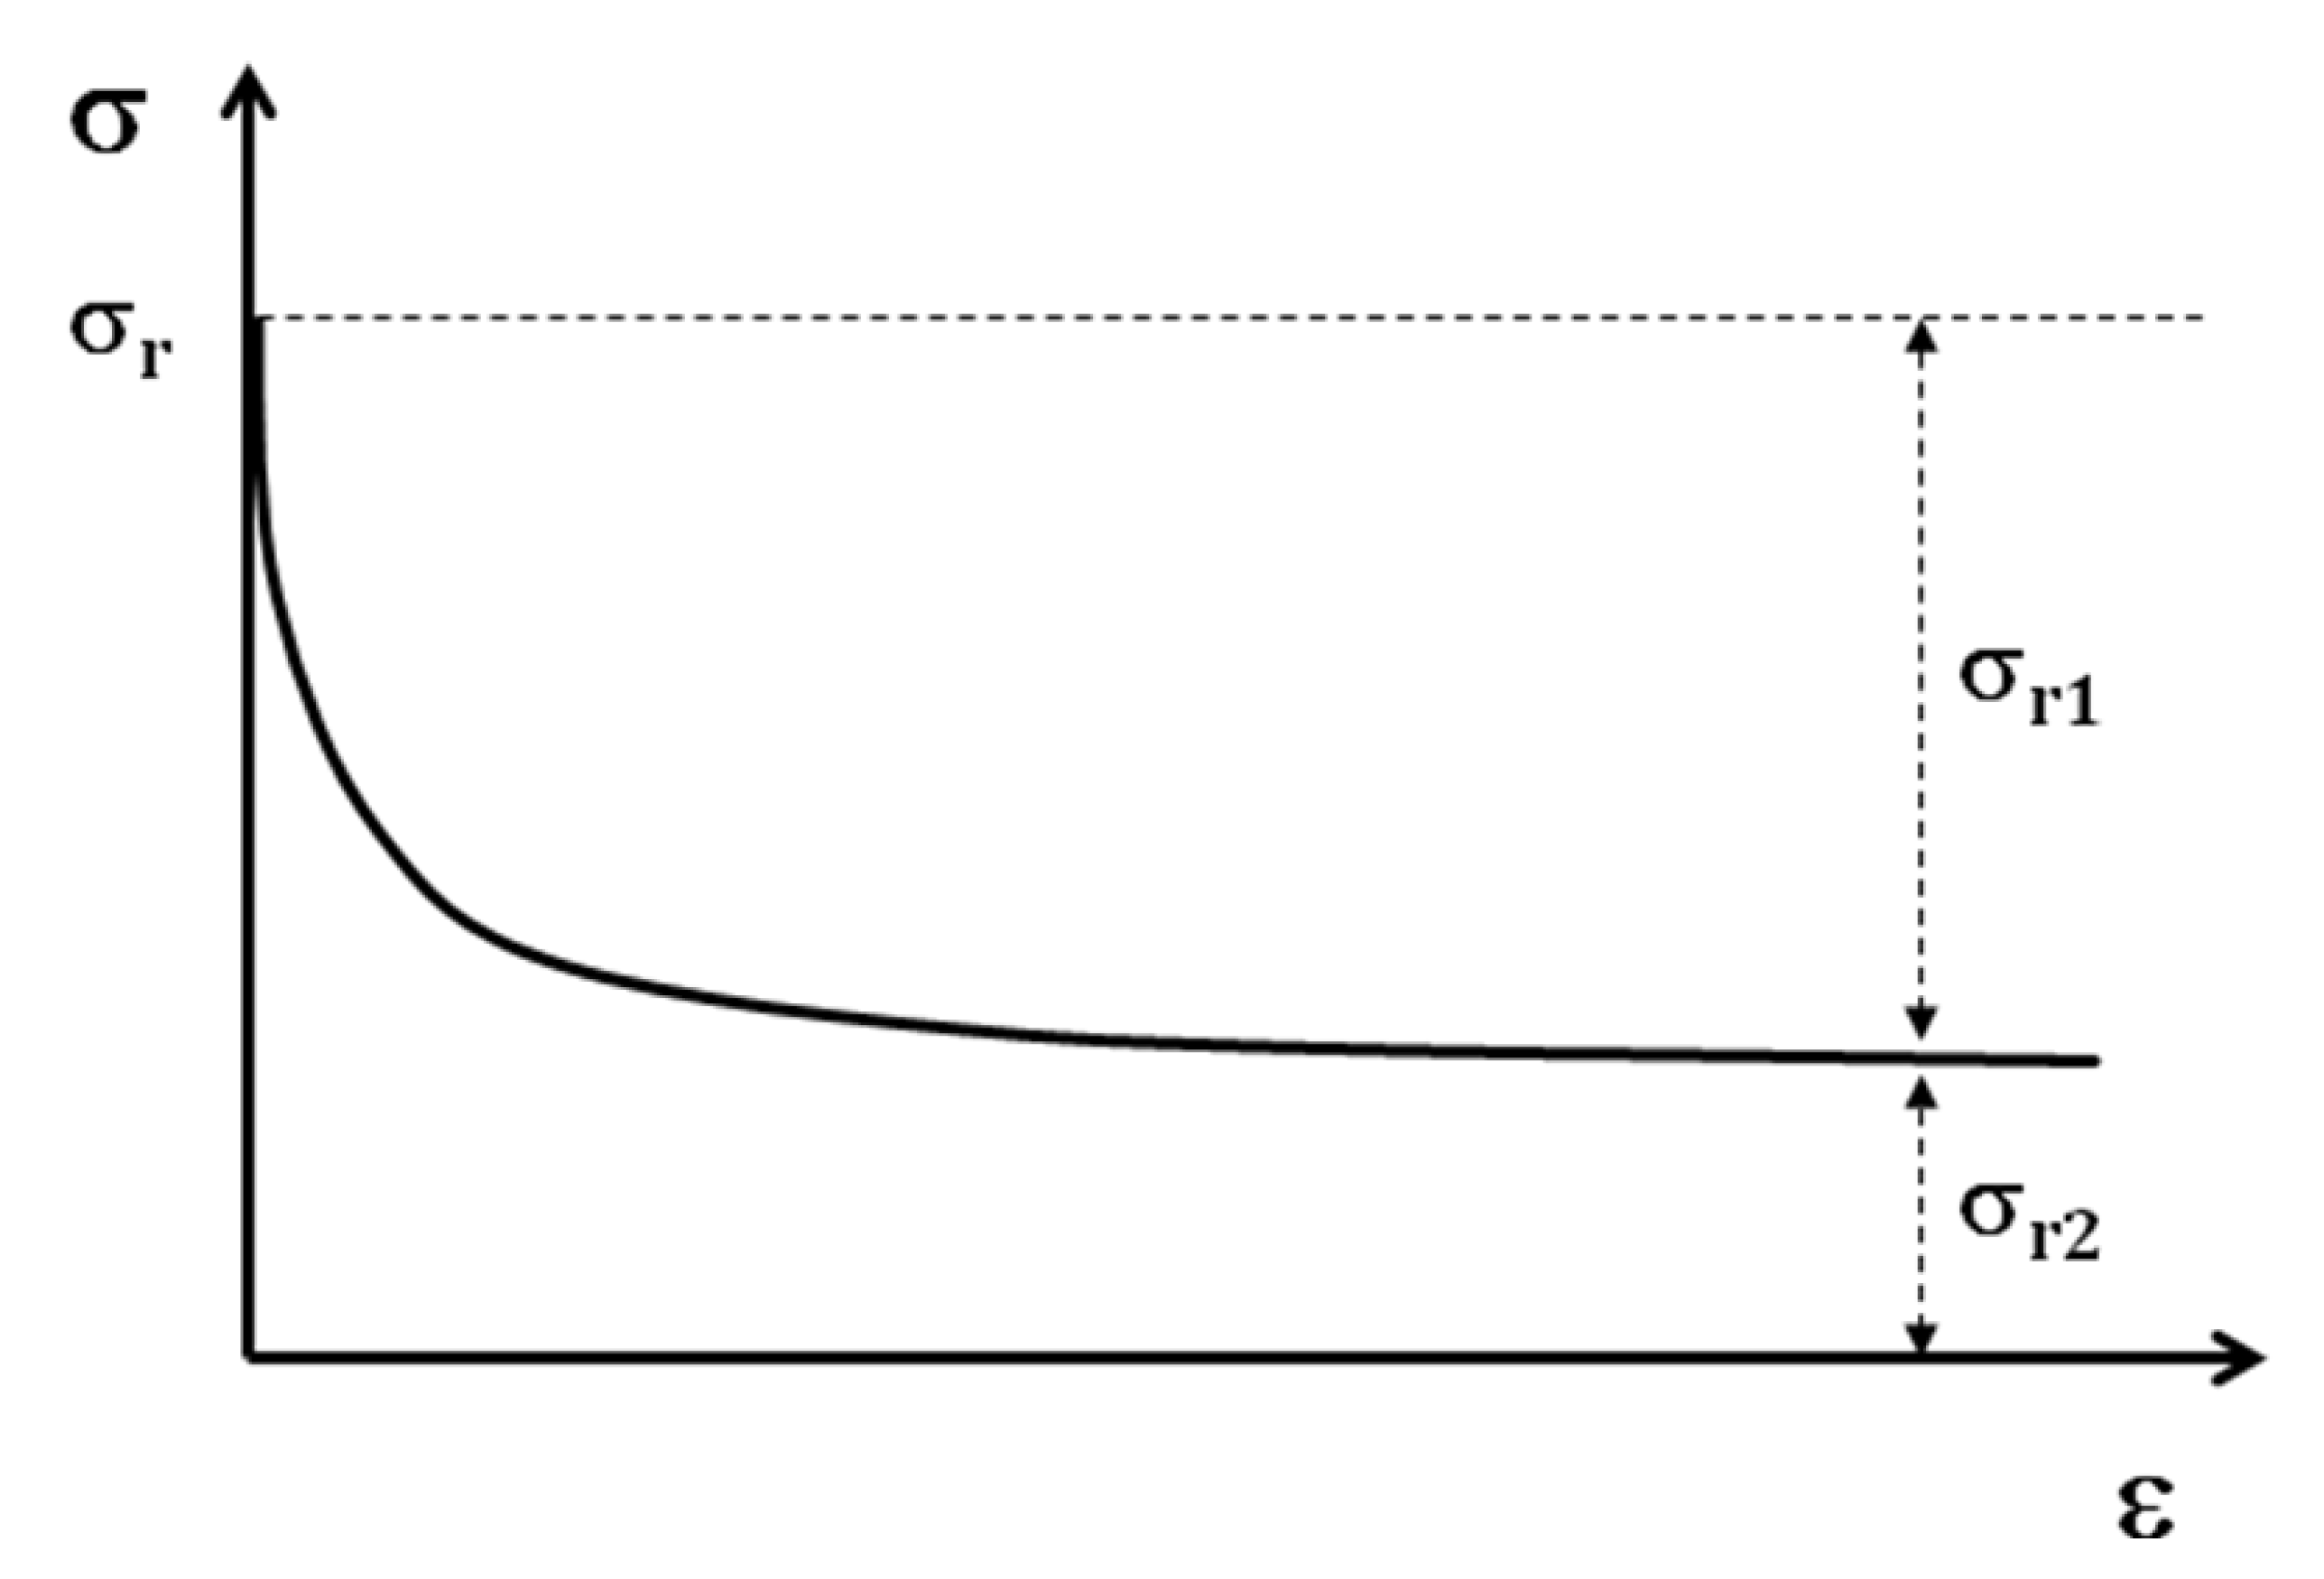
In the case of shape memory polymers, after the tensile test is at 100% of deformation, a stress will be introduced in the sample. By the relaxation test (
Figure 11) after the tensile test, two portions of residual stress can be distinguished.
Figure 11.
Schematic relaxation curve
Figure 11.
Schematic relaxation curve
The first portion, σr1, will be eliminated at the end of the relaxation test; but the second portion of this residual stress σr2, remains in the structure of the sample. This stress is the origin of shape memory effect. If the shape memory cycle test is performed without the relaxation test, as the value of residual stress is higher, the SMP regains its initial form faster. In any case the SMP regains its initial shape with or without the relaxation test. The residual stress then can be considered as the driving force of a SMP for regaining the initial shape.
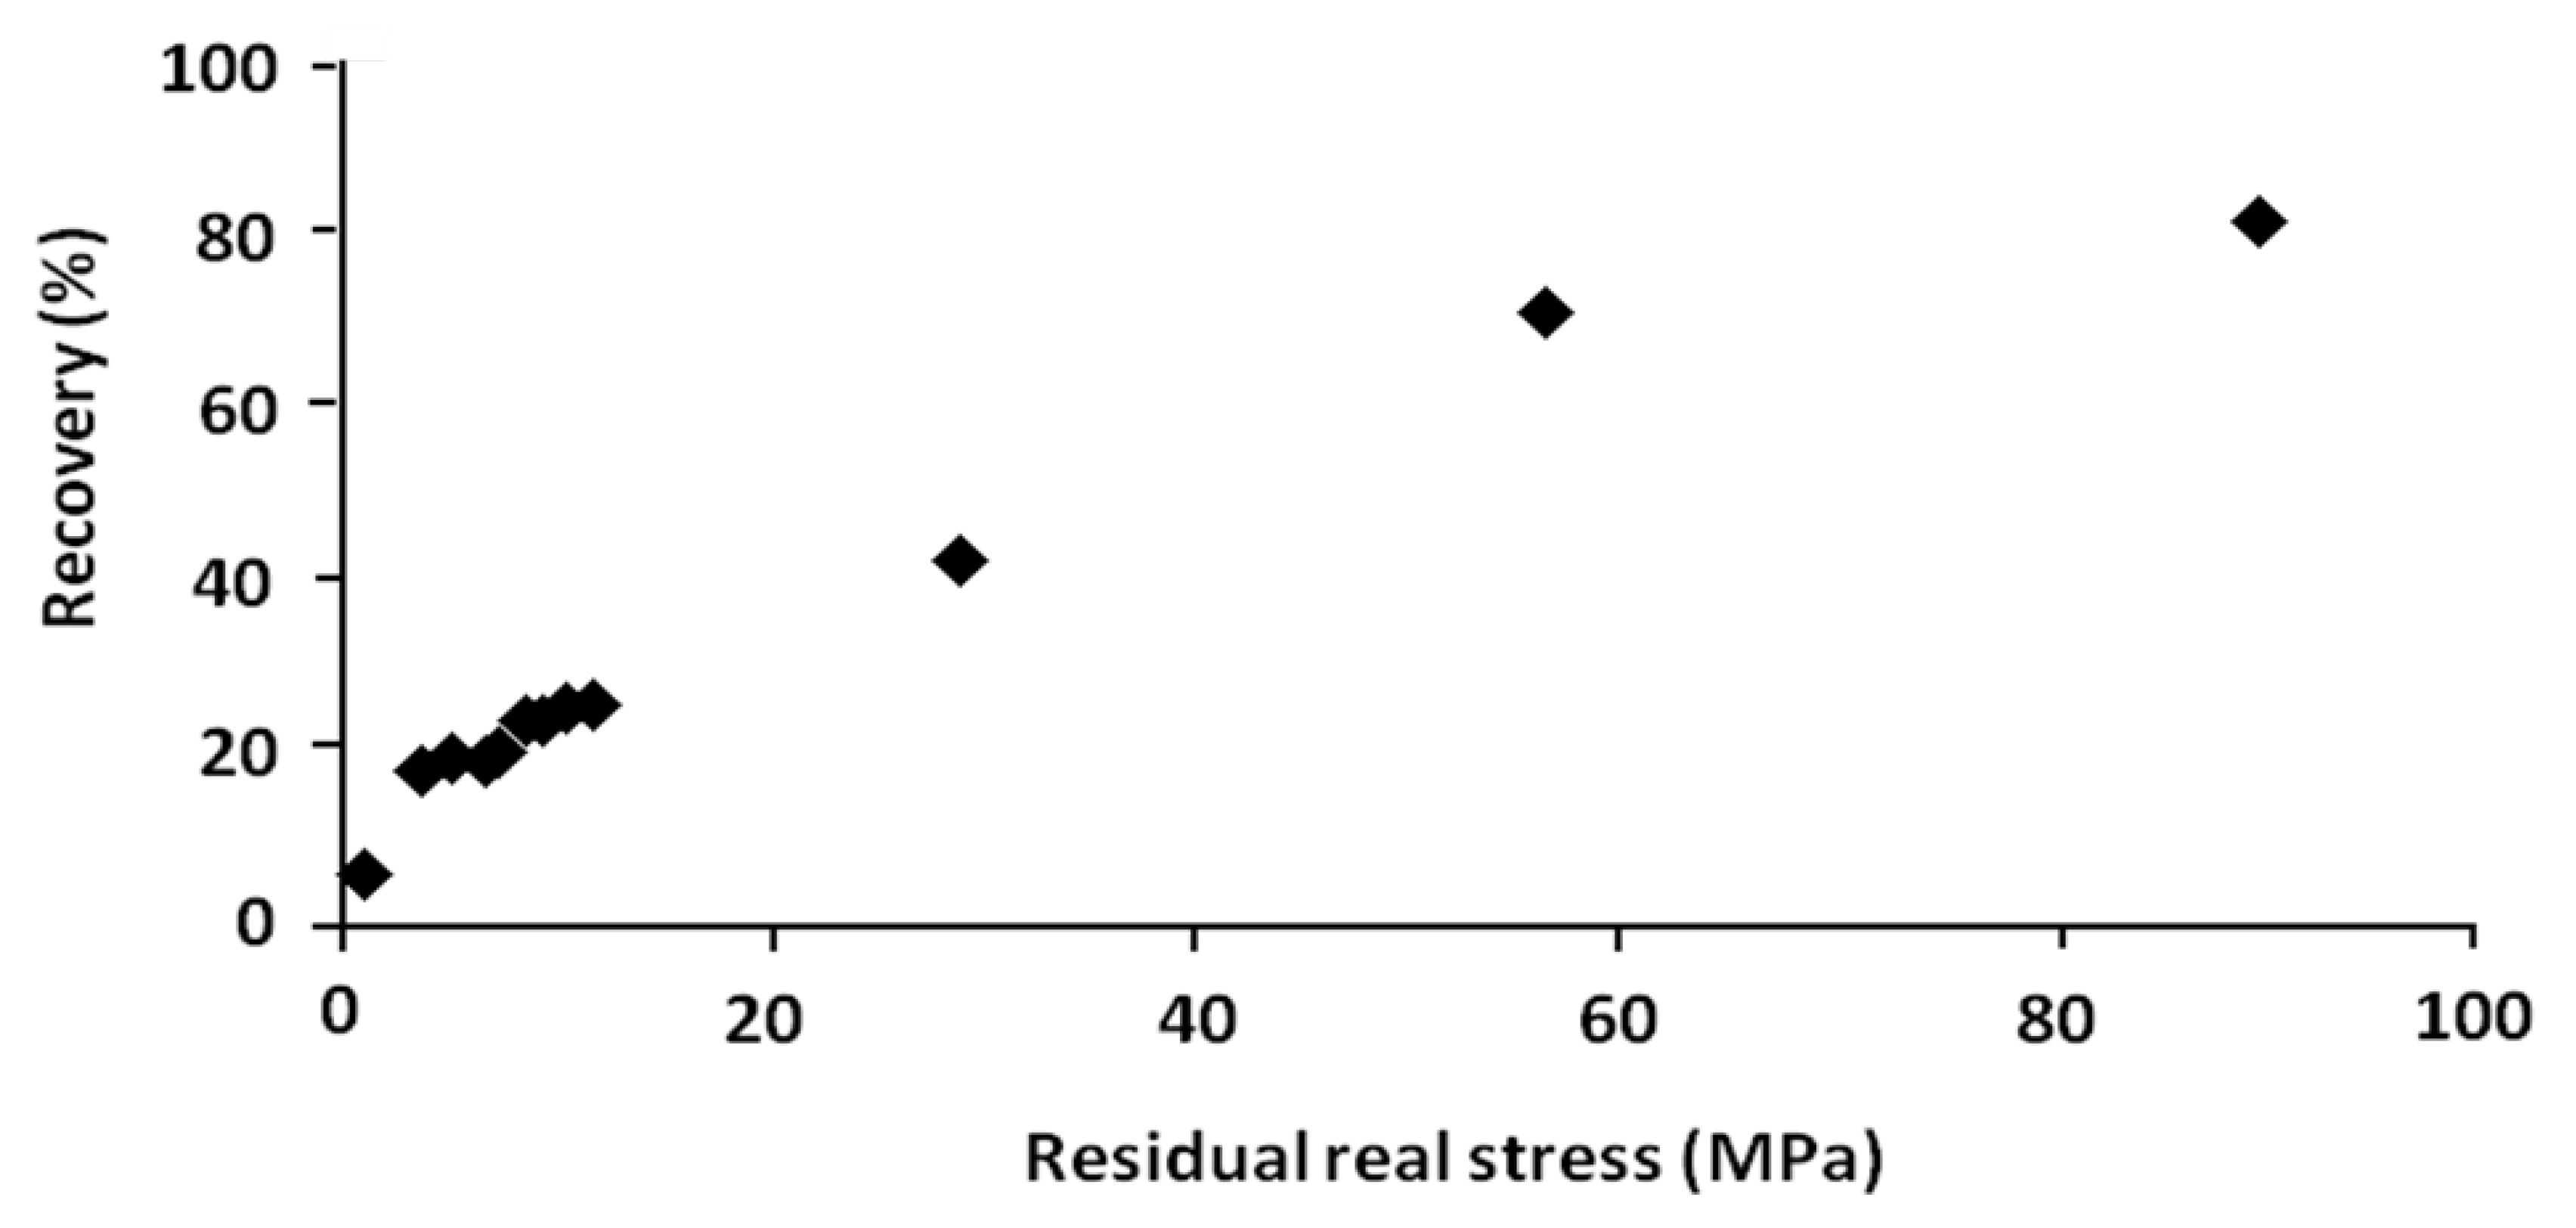
In order to show the role of this driving force, the residual stress is recapitulated and plotted
versus the percentage of recovery respectively in
Table 4 and
Figure 12. These results were obtained from the shape memory tests with and without stress-relaxation experiments.
Table 4.
Relationship between residual stress and percentage of recovery.
Table 4.
Relationship between residual stress and percentage of recovery.
| No. | Residual real stress (MPa) | Temperature of recovery tests (°C) | Recovery (%) |
|---|
| 1 | 1.22 | 80 | 4.72 |
| 2 | 1.25 | 80 | 5.17 |
| 3 | 3.81 | 80 | 17.14 |
| 4 | 3.83 | 80 | 17.20 |
| 5 | 5.37 | 80 | 18.20 |
| 6 | 5.51 | 80 | 19.00 |
| 7 | 7.10 | 70 | 19.12 |
| 8 | 7.41 | 70 | 19.21 |
| 9 | 7.73 | 70 | 20.51 |
| 10 | 8.22 | 75 | 20.86 |
| 11 | 8.47 | 70 | 23.50 |
| 12 | 8.73 | 80 | 22.30 |
| 13 | 7.78 | 70 | 22.35 |
| 14 | 9.39 | 70 | 23.00 |
| 15 | 11.02 | 75 | 24.00 |
| 16 | 11.69 | 75 | 24.34 |
| 17 | 29.32 | 70 | 42.00 |
| 18 | 56.61 | 70 | 70.90 |
| 19 | 90.17 | 70 | 81.80 |
Figure 12.
Percentage of recovery versus residual real stress.
Figure 12.
Percentage of recovery versus residual real stress.
6.2. Partial Shape Memory Effect
As we have seen before, the blend under study (PLA (80%)/PBS (20%)) is not a 100% shape memory polymer. At the beginning the blend has a partial shape memory effect with a recovery rate of 24%.
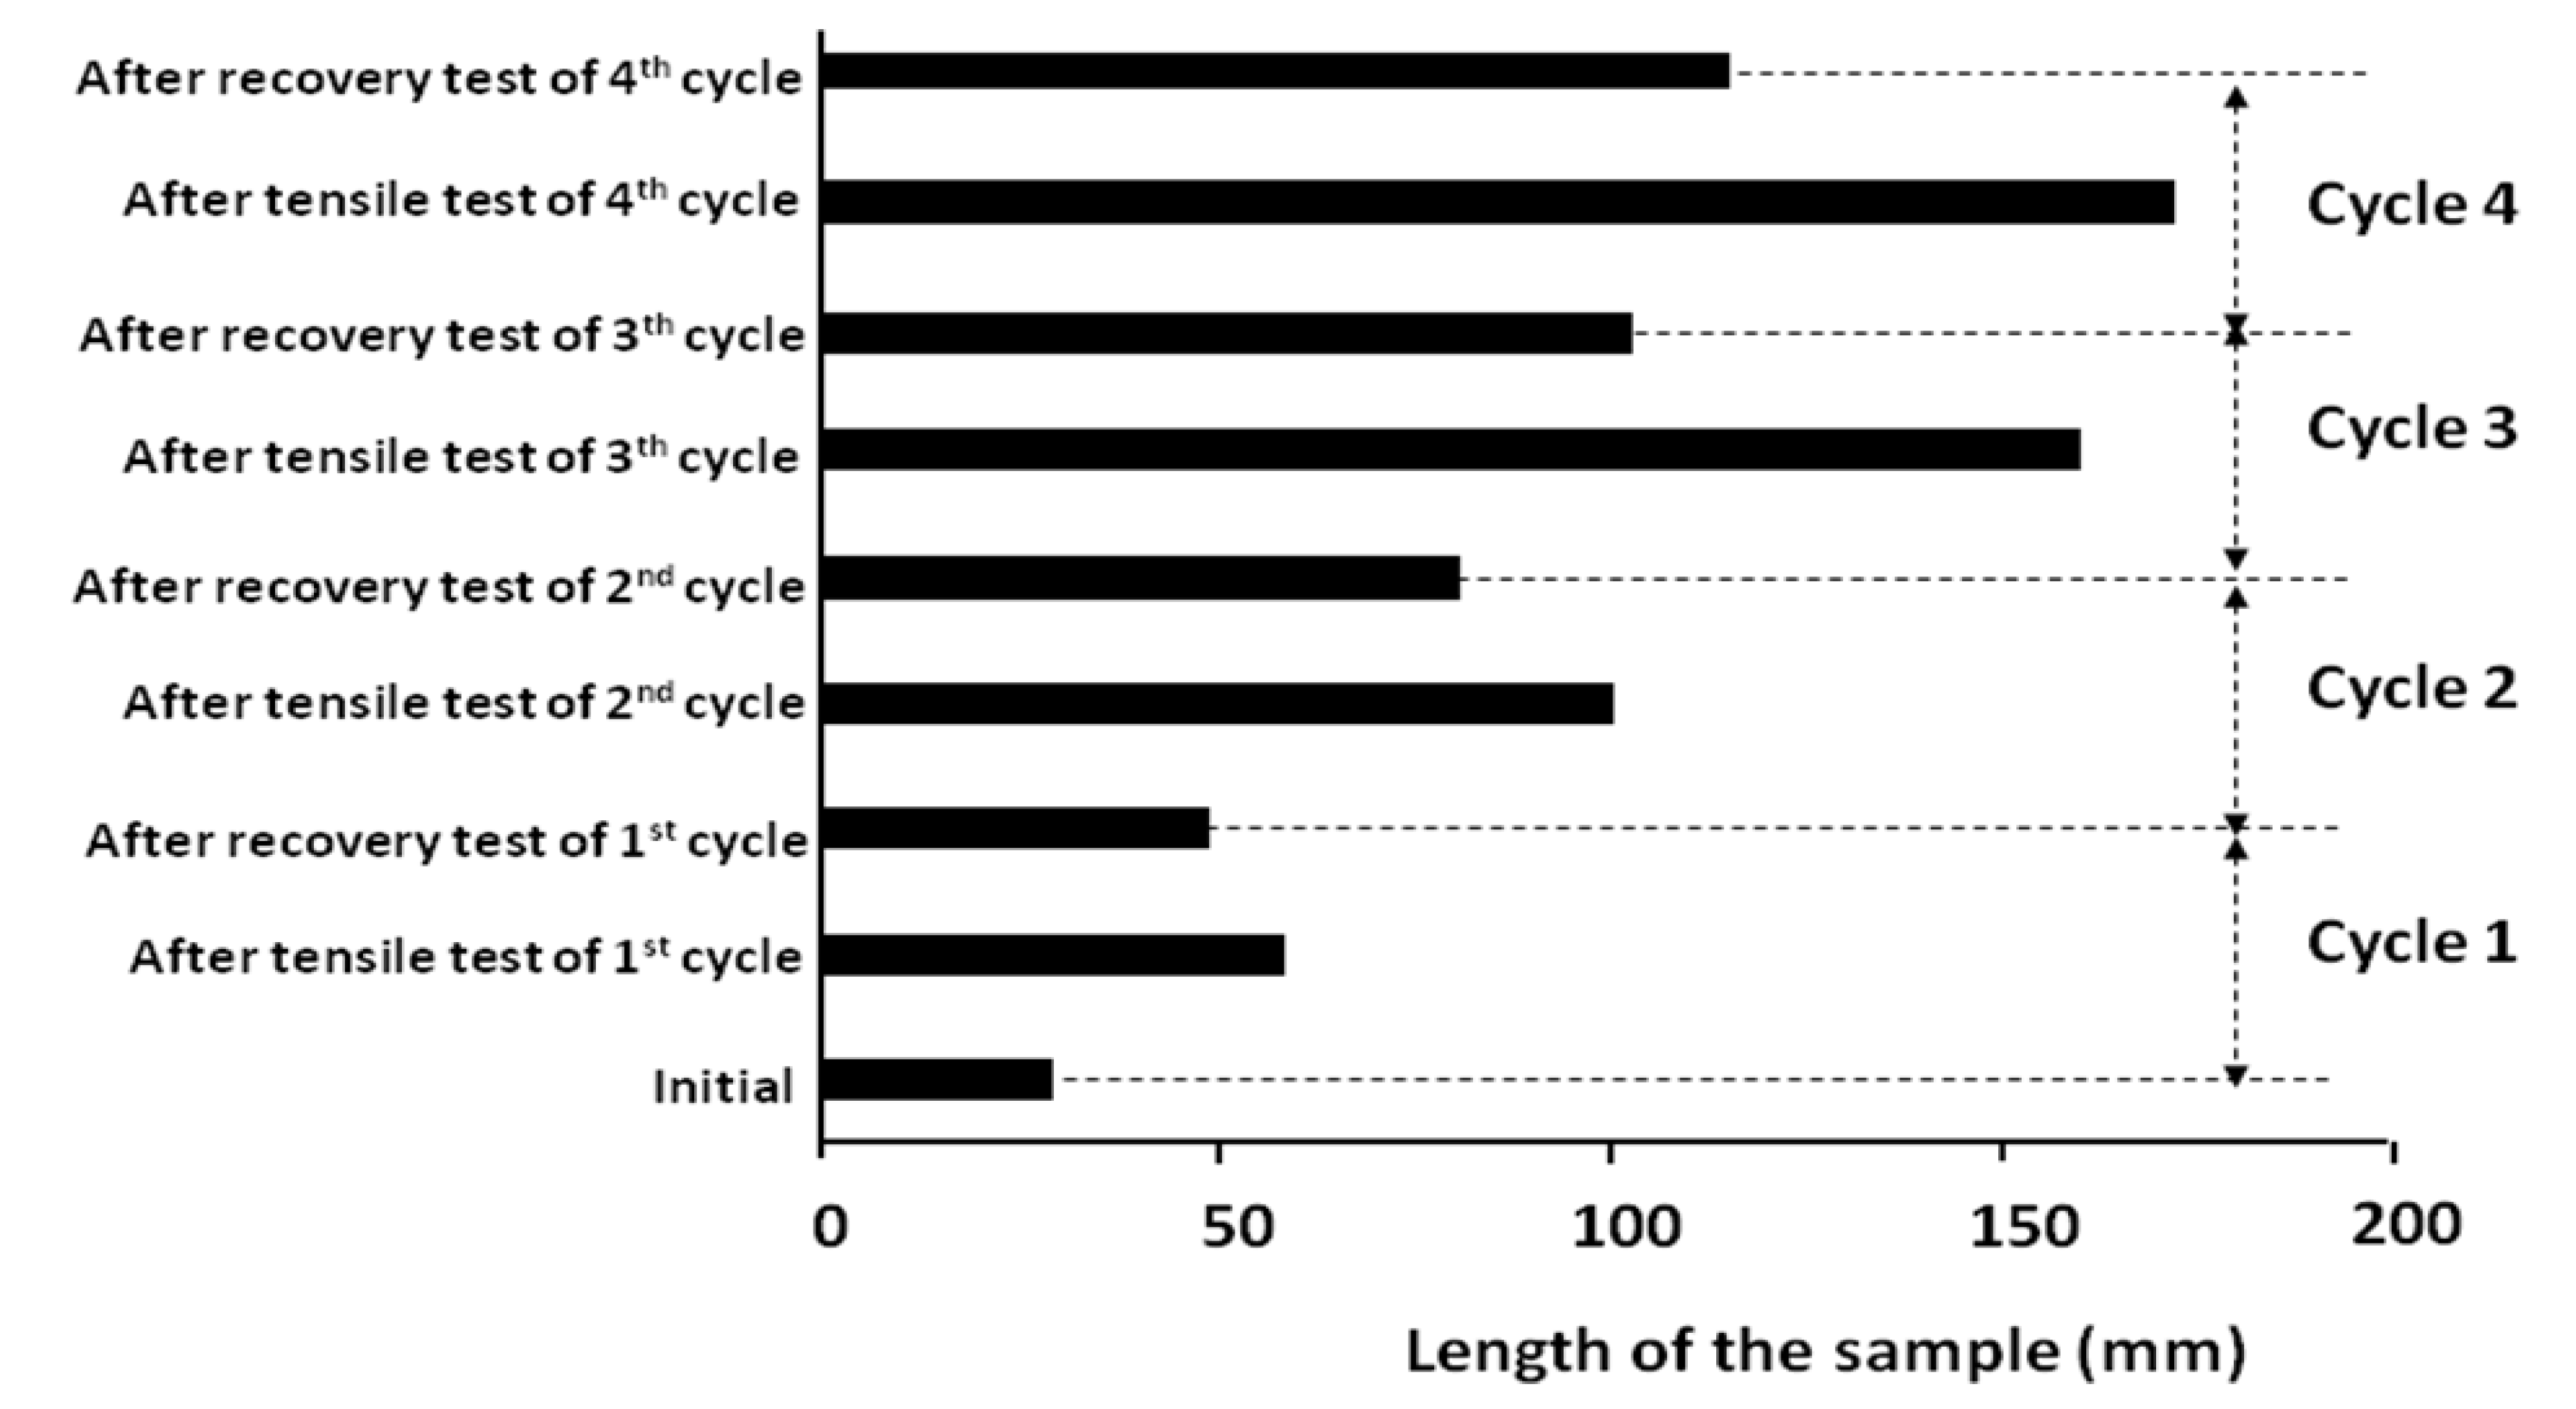
Figure 13 shows that after each cycle, the blend has been modified and transformed to a new blend with SME. This effect increases after each cycle; 42% after the second cycle, 71% after the third cycle and reaches 82% after the fourth cycle. The evolution of the shape memory capacity of a polymer which is not originally a SMP, can reinforce the following ideas: As it was explained before, logically a polymer with partial shape memory effect may be transformed into a 100% SMP. However, this idea must be confirmed by experiments. In any case the improvement of shape memory properties of a PSMP is very attractive for industry.
Figure 13.
Evolution of shape memory effect (SME) of PLA/PBS by succesive shape memory tests.
Figure 13.
Evolution of shape memory effect (SME) of PLA/PBS by succesive shape memory tests.
6.3. Shape Memory in Micro-Scale Domains
In the previous paper [
26], it was shown by dynamic mechanical analyzer (DMA) tests on polyurethane (with shape memory effect) that after recovery test and even after regaining 100% of the initial shape, the sample does not have the same properties. It was seen that, G′ (storage modulus) and G′′ (loss modulus) of recovered and virgin samples were different with different alpha transition temperatures. These results were followed by the successive cycles tests, performed on the same sample. The results indicated that the Young’s modulus of the virgin sample of SMP and the same sample after recovery test was not the same.
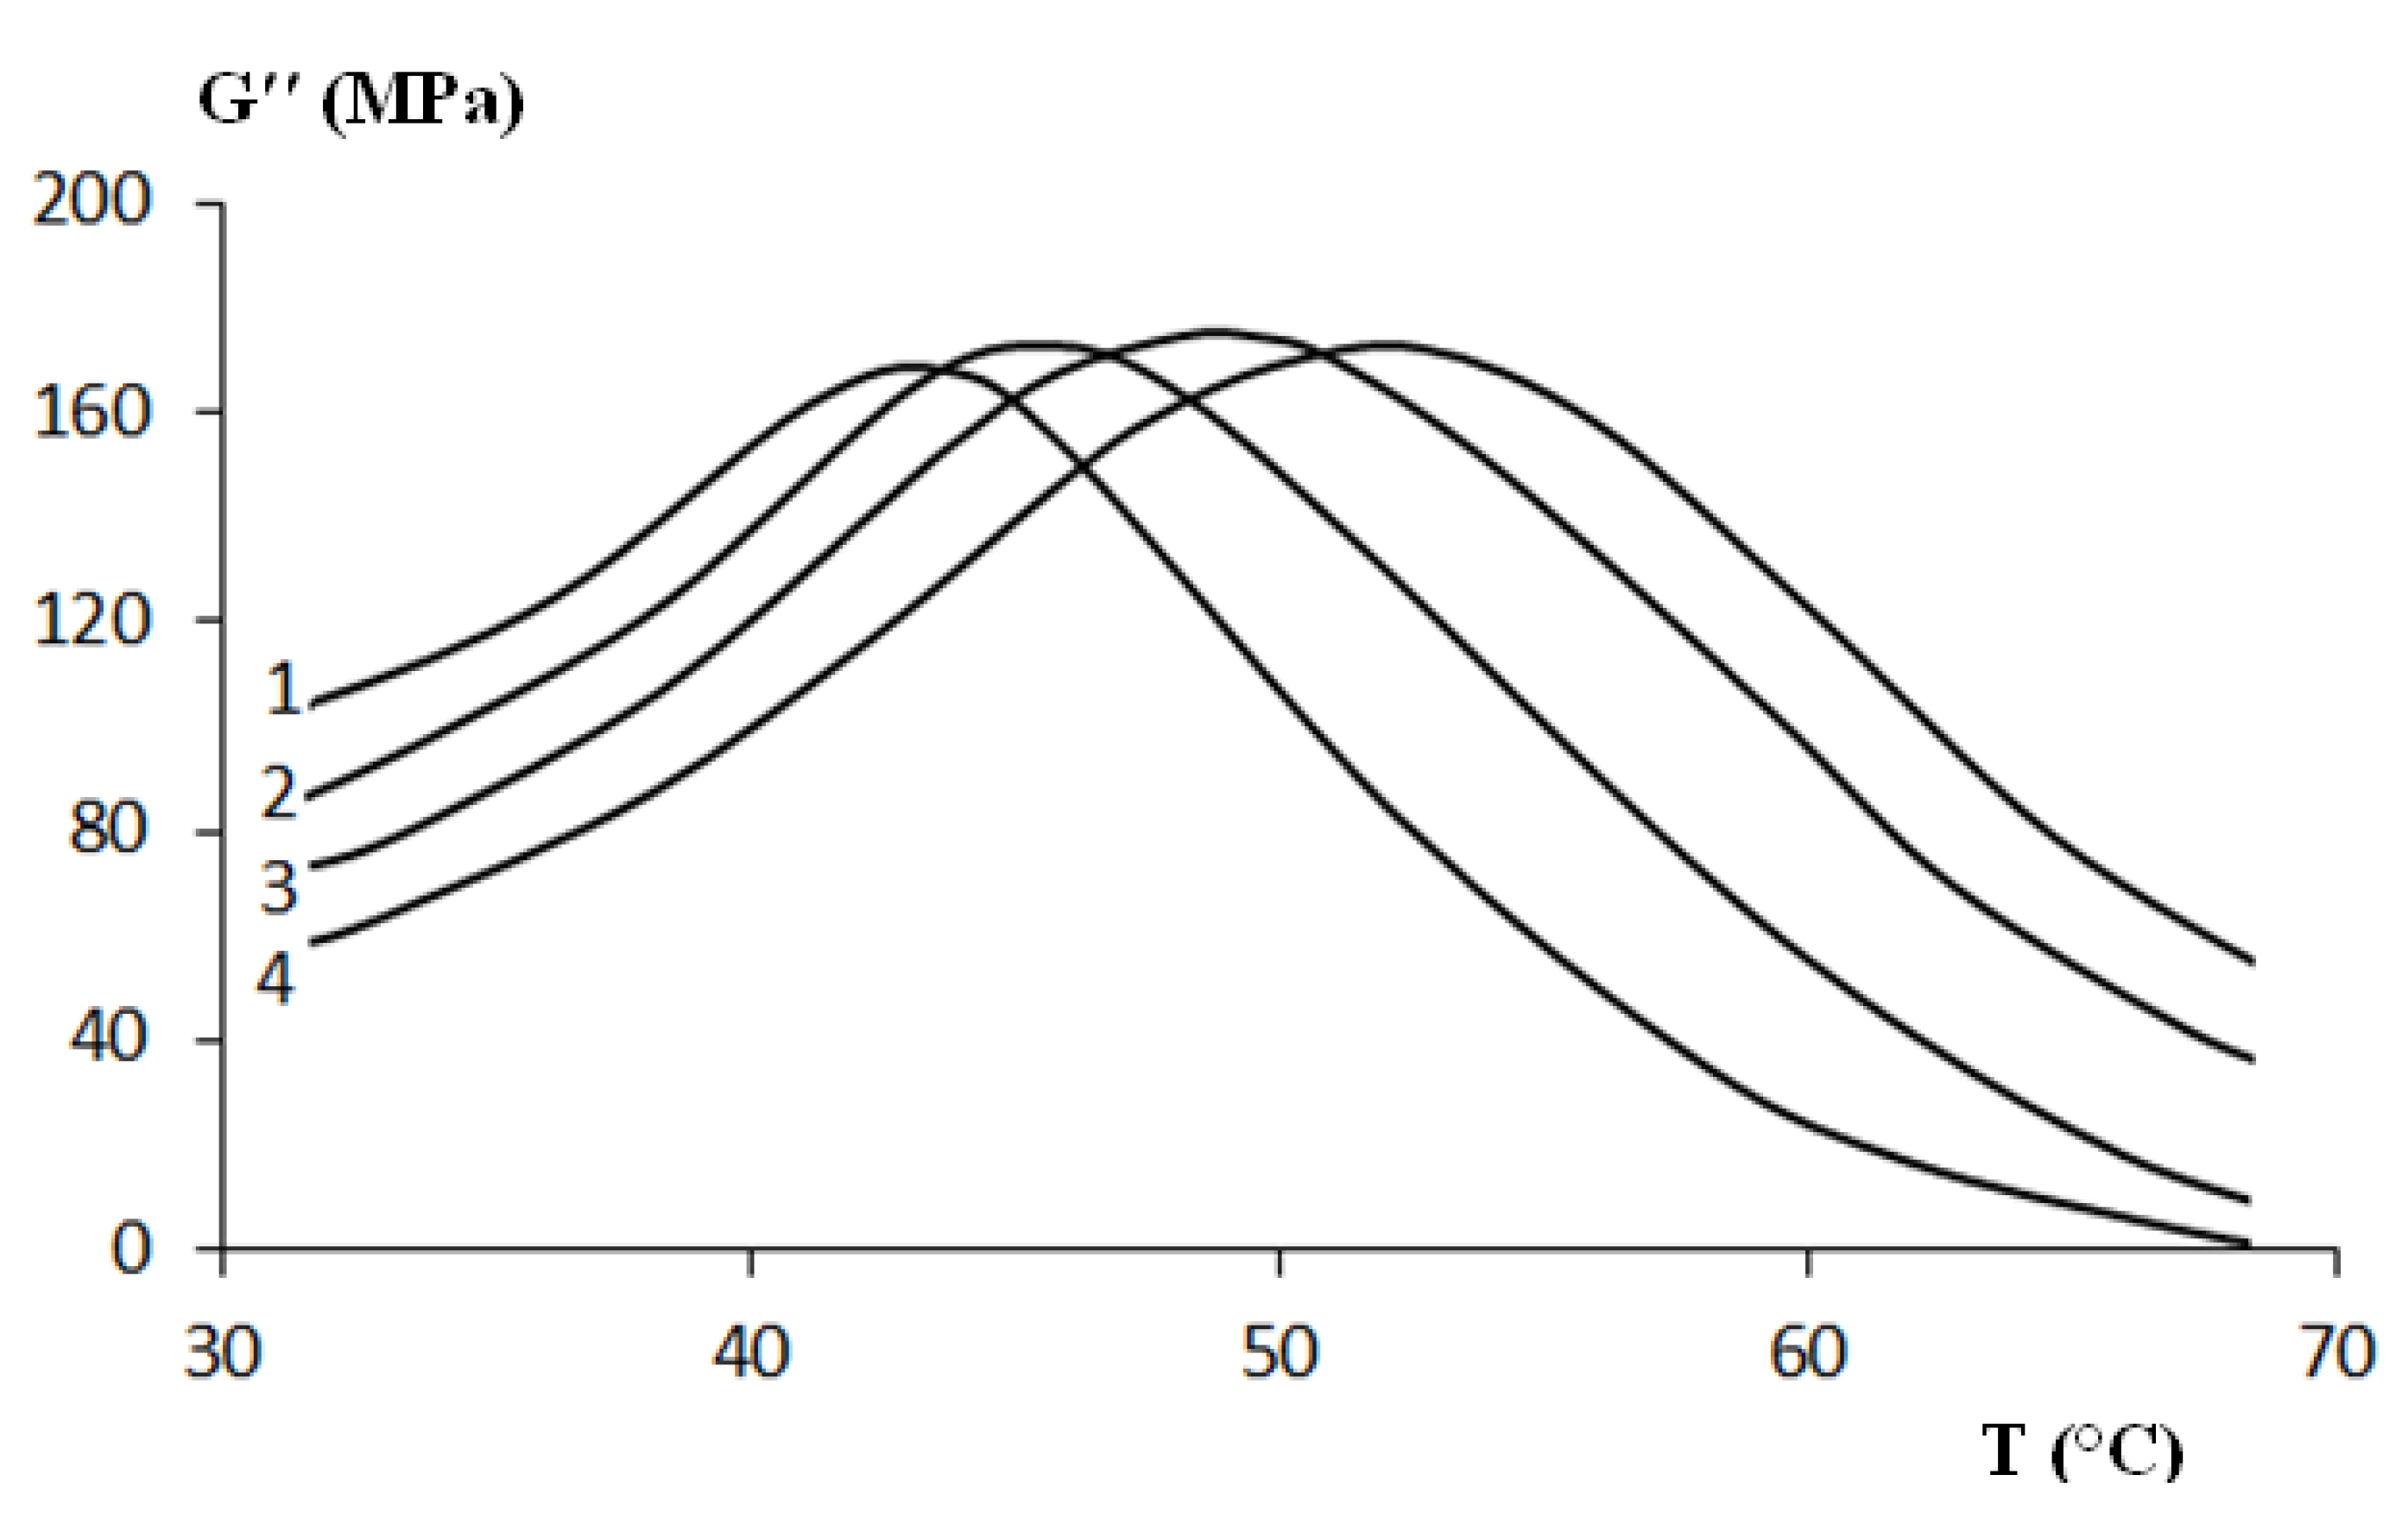
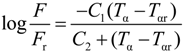
Another physical property which is related to the microstructure is free volume, shown by free volume fraction
fg. This parameter may be determined by the results of multi-frequency DMA tests on polyurethane (
Figure 14), using the Williams-Landel-Ferry (WLF) equation:
where
F = frequency,
Tα = α transition temperature,
Fr = reference frequency,
Tαr = reference temperature,
C1 =
B / 2.303
fg,
C2 =
fg / ∆α,
B ≈ 1, ∆α = thermal expansion coefficient and
fg = free volume fraction.
In order to verify the validity of this equation, the linear regression method was used and
![Polymers 06 01144 i005]()
was plotted
versus 1 /(
Tα −
Tαr). If this plot is linear having
S =
C2 /
C1 as slope then the validity of the WLF equation is verified and
fg may be determined by the following equation:
Using this method, we performed multi-frequency 3 point bending DMA tests on the PU. The test conditions are as follows: frequency range 0.1–100 Hz, temperature range 25–80 °C. The results are shown in
Table 5. These results show clearly that
Tg, ∆α and
fg of virgin and recovered (100%) samples are not the same. That means that the PU under study shows SME but not memory effect for certain properties.
Figure 14.
Multi-frequency 3 point bending dynamic mechanical analyzer (DMA) test on virgin polyurethane (PU): (1) 0.1 Hz; (2) 1 Hz; (3) 10 Hz; and (4) 100 Hz.
Figure 14.
Multi-frequency 3 point bending dynamic mechanical analyzer (DMA) test on virgin polyurethane (PU): (1) 0.1 Hz; (2) 1 Hz; (3) 10 Hz; and (4) 100 Hz.
Table 5.
The values of constants of WLF obtained by multi-frequency 3 point bending dynamic mechanical analyzer (DMA) test on polyurethane (PU).
Table 5.
The values of constants of WLF obtained by multi-frequency 3 point bending dynamic mechanical analyzer (DMA) test on polyurethane (PU).
| PU | Tg (K) | C1 | C2 (K) | S
(K) | ∆α (K−1) | fg |
|---|
| Virgin | 318.5 | 0.0647 | 15.5 | 3.8 | 5.5 | 0.0301 |
| Recovered (100%) | 314 | 0.0570 | 17.2 | 4.7 | 5.2 | 0.0326 |
After recovery tests and regaining initial shape, it is possible that the sample does not regain some of its initial properties because of microstructure irreversible changes. These microstructure changes may induce the micro-change of volume which cannot be regained after the recovery test. In a study of shape memory effect, generally, the authors measure the macro-change of volume. They do not give enough attention to the micro-change of volume. In fact on the macroscopic scale, the measurement of micro-changes is practically impossible.
The difference has been explained by the presence of two types of properties:
The properties like density or Poisson’s ratio which are related directly to the macro-structure (shape) of the sample. These properties may be regained after recovery tests.
The properties like modulus or glass transition temperature which is related to the micro-structure (in molecular or macromolecular scale). During shape memory test, the mechanism of their evolution is not the same as the mechanism of the shape memory effect. So these properties may not be regained totally after the recovery test.
7. Conclusions
This study proposes certain new concepts for shape memory polymers. For properties memory effect (PME) from the results of DSC tests, tensile tests, DMA test, and by using the WLF equation on virgin and 100% recovered polyurethane, we determined the value of: modulus, strength, glass transition temperature, heat coefficient expansion and free volume fraction. The results show that they do not have the same properties indicating that shape memory effect and properties memory effect may have two different mechanisms.
For the partial shape memory effect (PSME), the multi-cycle shape memory tests show that blend PLA (80%)/PBS (20%), regains only 24% of the initial shape at the end of the first cycle, indicating that certain polymers have a partial shape memory effect. This test also showed the shape capacity of polymer increases by the number of cycles. The same polymer after the second, third, and fourth cycles regains respectively, 42%, 71% and 82% of its initial shape. This new concept of shape memory effect is of very important value. We can in a legitimate way suppose that a polymer without shape memory effect can be transformed into a shape memory polymer.
Finally, for the shape memory effect in micro, as certain properties of polymers can be affected by the micro change of the shape (elasticity, free volume, etc.), it is very important to study the shape memory effect on the micro-scale. In fact, the shape memory effect has always been studied macroscopically. This study may not in itself be sufficient to fully explain the relationship between shape memory effect and properties memory effect.


 and
and 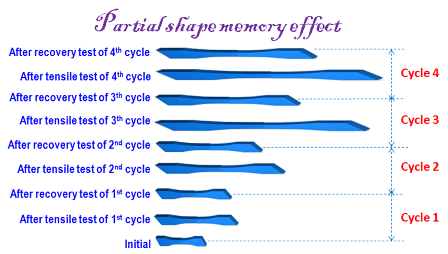


 was plotted versus 1 /(Tα − Tαr). If this plot is linear having S = C2 / C1 as slope then the validity of the WLF equation is verified and fg may be determined by the following equation: