Article

Influence of Boron on Initial Austenite Grain Size and Hot Deformation Behavior of Boron Microalloyed Steels

Liaoning Key Laboratories of Ecological Utilization Technology of Boron Resources and Boron Materials, Northeastern University, Shenyang 110819, China
*
Author to whom correspondence should be addressed.
Crystals 2015, 5(4), 592-607; https://doi.org/10.3390/cryst5040592
Submission received: 11 October 2015 / Accepted: 16 November 2015 / Published: 24 November 2015
(This article belongs to the Special Issue Boron-Based (Nano-)Materials: Fundamentals and Applications)

Abstract

:
The initial austenite grain size of boron microalloyed steel with three different amounts of boron (20, 40, and 60 ppm) was investigated under different heating temperatures (1150, 1100, and 1050 °C), and hot compression tests of samples in a wide range of temperature (900–1100 °C) and strain rate (0.1–10 s−1) were conducted. It was found that the initial austenite grain size increases with increasing temperature and boron content. The flow stress decreased with increasing boron content at lower strain rates. The flow stress constitutive equation of hot deformation was developed for the experimental steels; results showed that boron addition has the trend to reduce the hot deformation activation energy. The characteristic points of the flow curves were analyzed. Results revealed that the peak and critical stress decreased in response to an increase of boron content. The work-hardening behavior of both steels was investigated, and it was found that boron addition can decrease the work-hardening rate when strained at lower strain rates. On the contrary, peak and critical strains increased as boron content increased, indicating that boron has the ability to delay the onset of dynamic recrystallization.

1. Introduction

High strength low alloy steels (HSLA) are attracting a strong interest from various industrial sectors, particularly in the automotive industry [1,2]. This is due to their exceptional strength and ductility as compared to other conventional grades of steel. The mechanical properties of HSLA steel depend on its grain size, its volume fraction martensite or bainite and the carbon content of each phase. The ferrite grain refinement of steels has attracted considerable interest from investigators due to its unique role of increasing both strength and toughness [3]. It is well known that the refinement of the initial austenite grain size and thermo-mechanical processing (TMP) are the most common method to refine the microstructural for hot-rolled steel. Furthermore, various phenomena have been shown to occur during the high temperature deformation process of austenitic steel: (1) work hardening (WH), (2) dynamic recovery (DRV) and (3) dynamic recrystallization (DRX) depending on tunable process conditions such as deformation temperature and strain rate. DRX plays a major role in reducing the flow stress and the grain size [3]. Therefore, it is necessary that the influence of alloying elements on initial austenite grain size and hot deformation behavior is well understood.
Boron is known to be an effective alloying element used to increase the hardenability of HSLA. Generally speaking, hardenability occurs because boron atoms easily segregate to prior austenite grain boundaries, lowering the grain boundary energy while retarding the transformation of austenite to ferrite [4,5,6]. Advantageously, the grain boundary segregation of boron in steel occurs via two mechanisms: (1) equilibrium and (2) non-equilibrium segregation. Qualitatively, non-equilibrium segregation proves to be the dominant contributing factor in conventional heat treatment conditions of steel [7]. Migration of boron to the austenite grain boundaries affects the thermodynamics of the respective boundaries. It can effect the austenite grain and hot deformation behavior. Although many investigations have reported the effect of boron on hot stamped [8], hot ductility [9], phase transformation [10], hardenability [11] and boundary segregation behavior [12], systematic work of boron content on initial austenite grain size and hot deformation behavior is lacking. Mun [11] only concluded that the hardenability of the boron-bearing steel decreases with increasing austenite grain size, but the effect of boron content on initial austenite grain size was not clarified in this study. In addition, the effect of boron on hot flow behavior is still disputed by numerous authors. Mejía [13,14] and López-Chipres [15] have reported that boron addition generates a softening effect and accelerates the onset of DRX. On the other hand, Kim [16], Banks [17] and Stumpf [18] observed that boron had a delayed effect of the onset of DRX. However, in these studies [13,14,15,16,17,18], the effect of boron content on initial austenite grain size and activation energy for hot deformation was not discussed. Therefore, there is an obvious scientific and commercial significance for more insight into influence of boron content on initial austenite grain size and hot deformation behavior.
In the present paper, the initial austenite grain size of steels with different boron content was investigated under different heating temperatures. In addition, the activation energy and constitutive equation for experimental steels were given. Moreover, the flow curves at different deformation and critical parameters as a function of boron composition are presented.

2. Results and Discussion

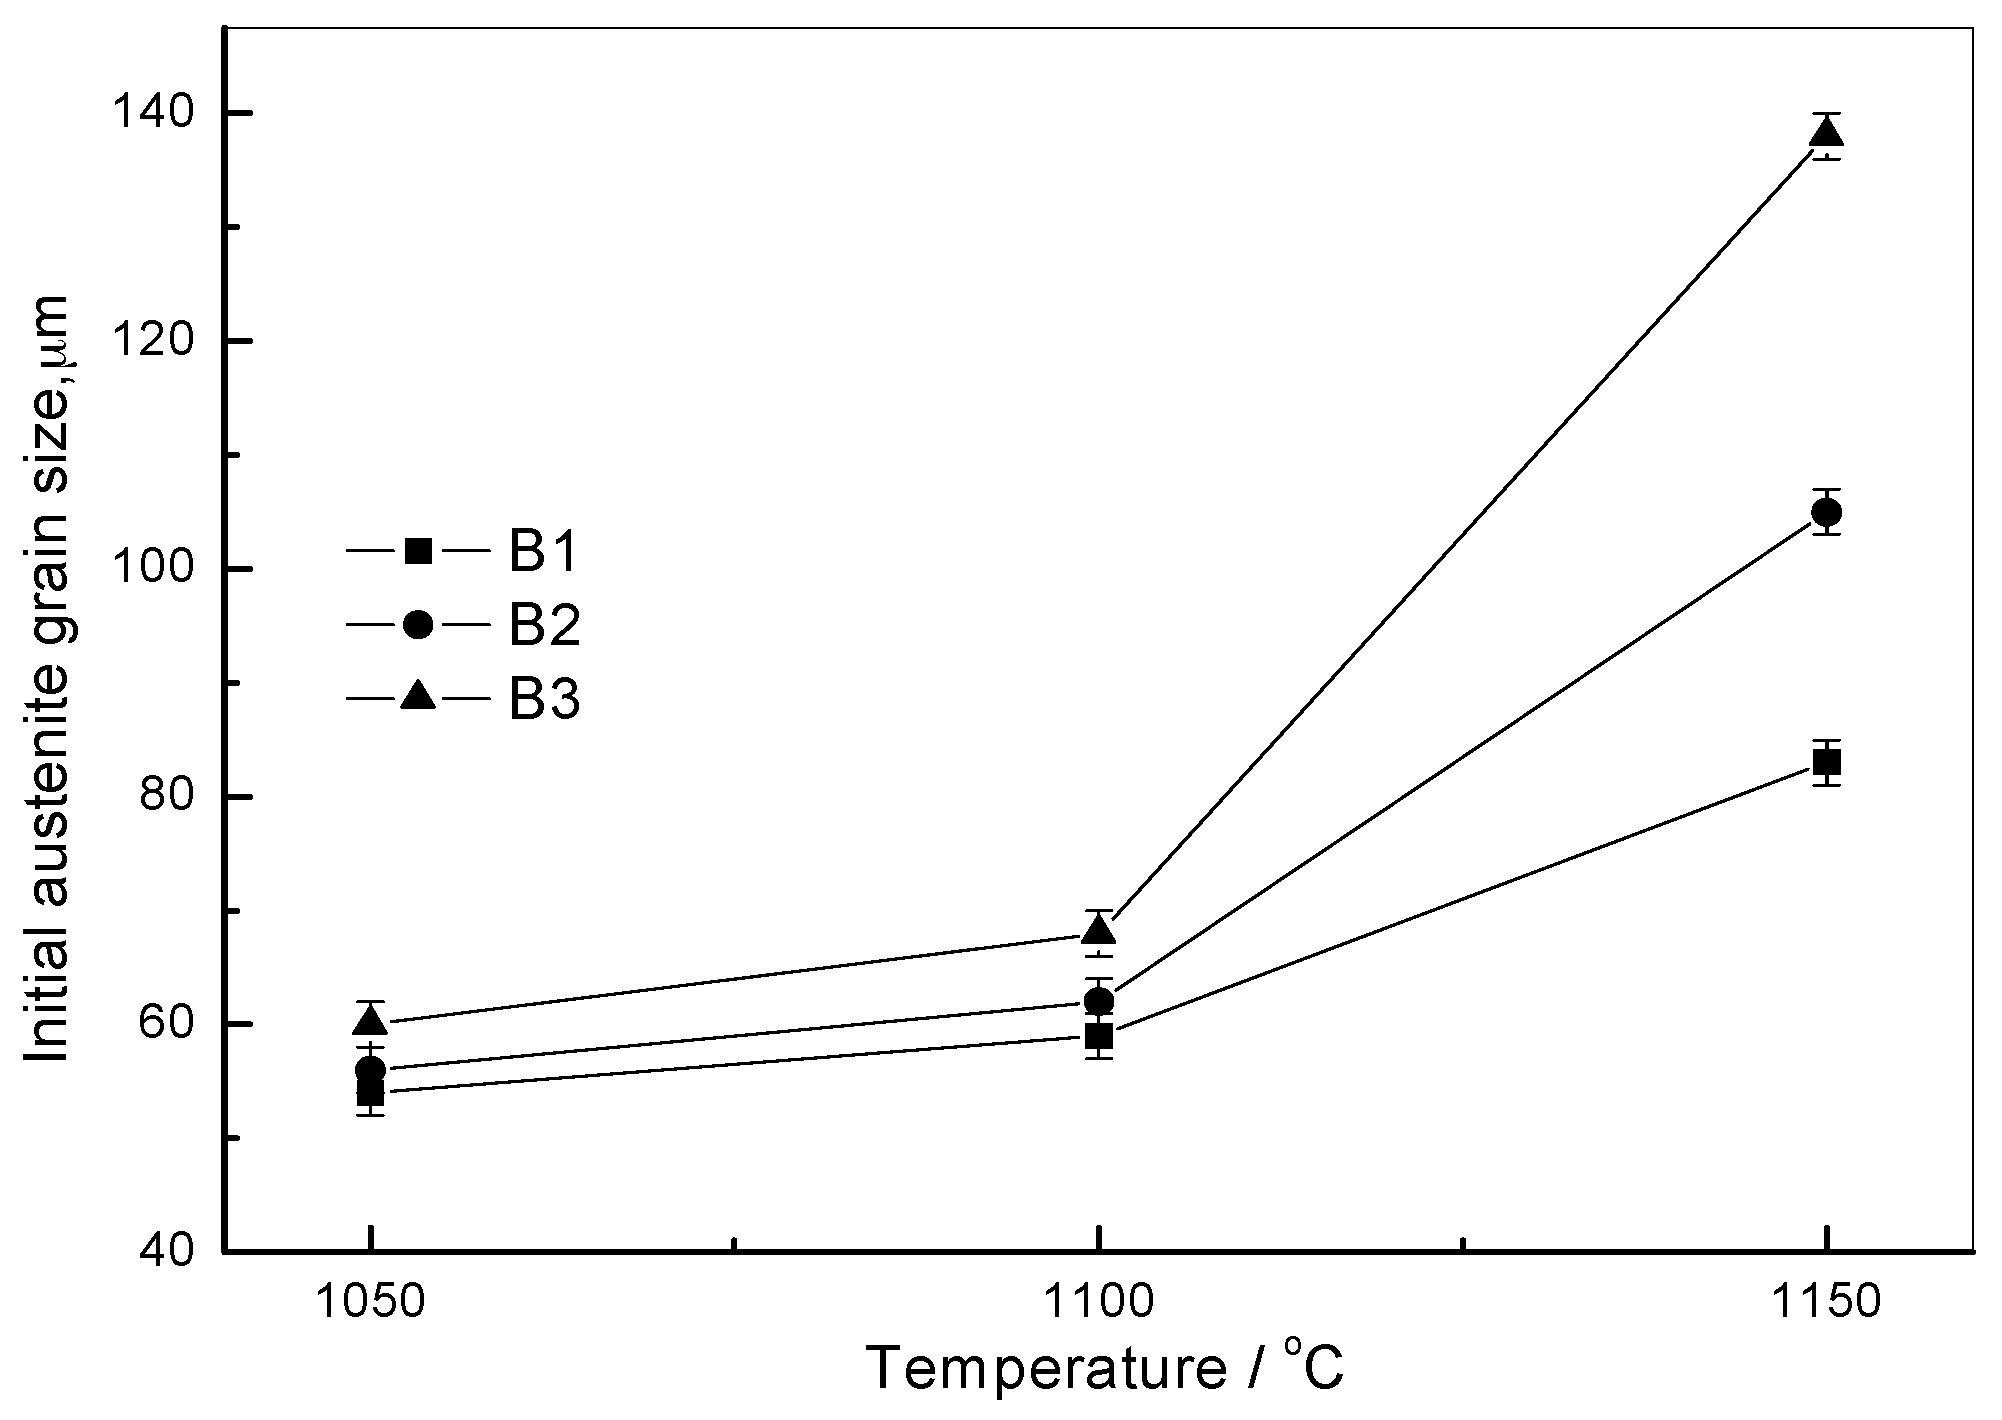
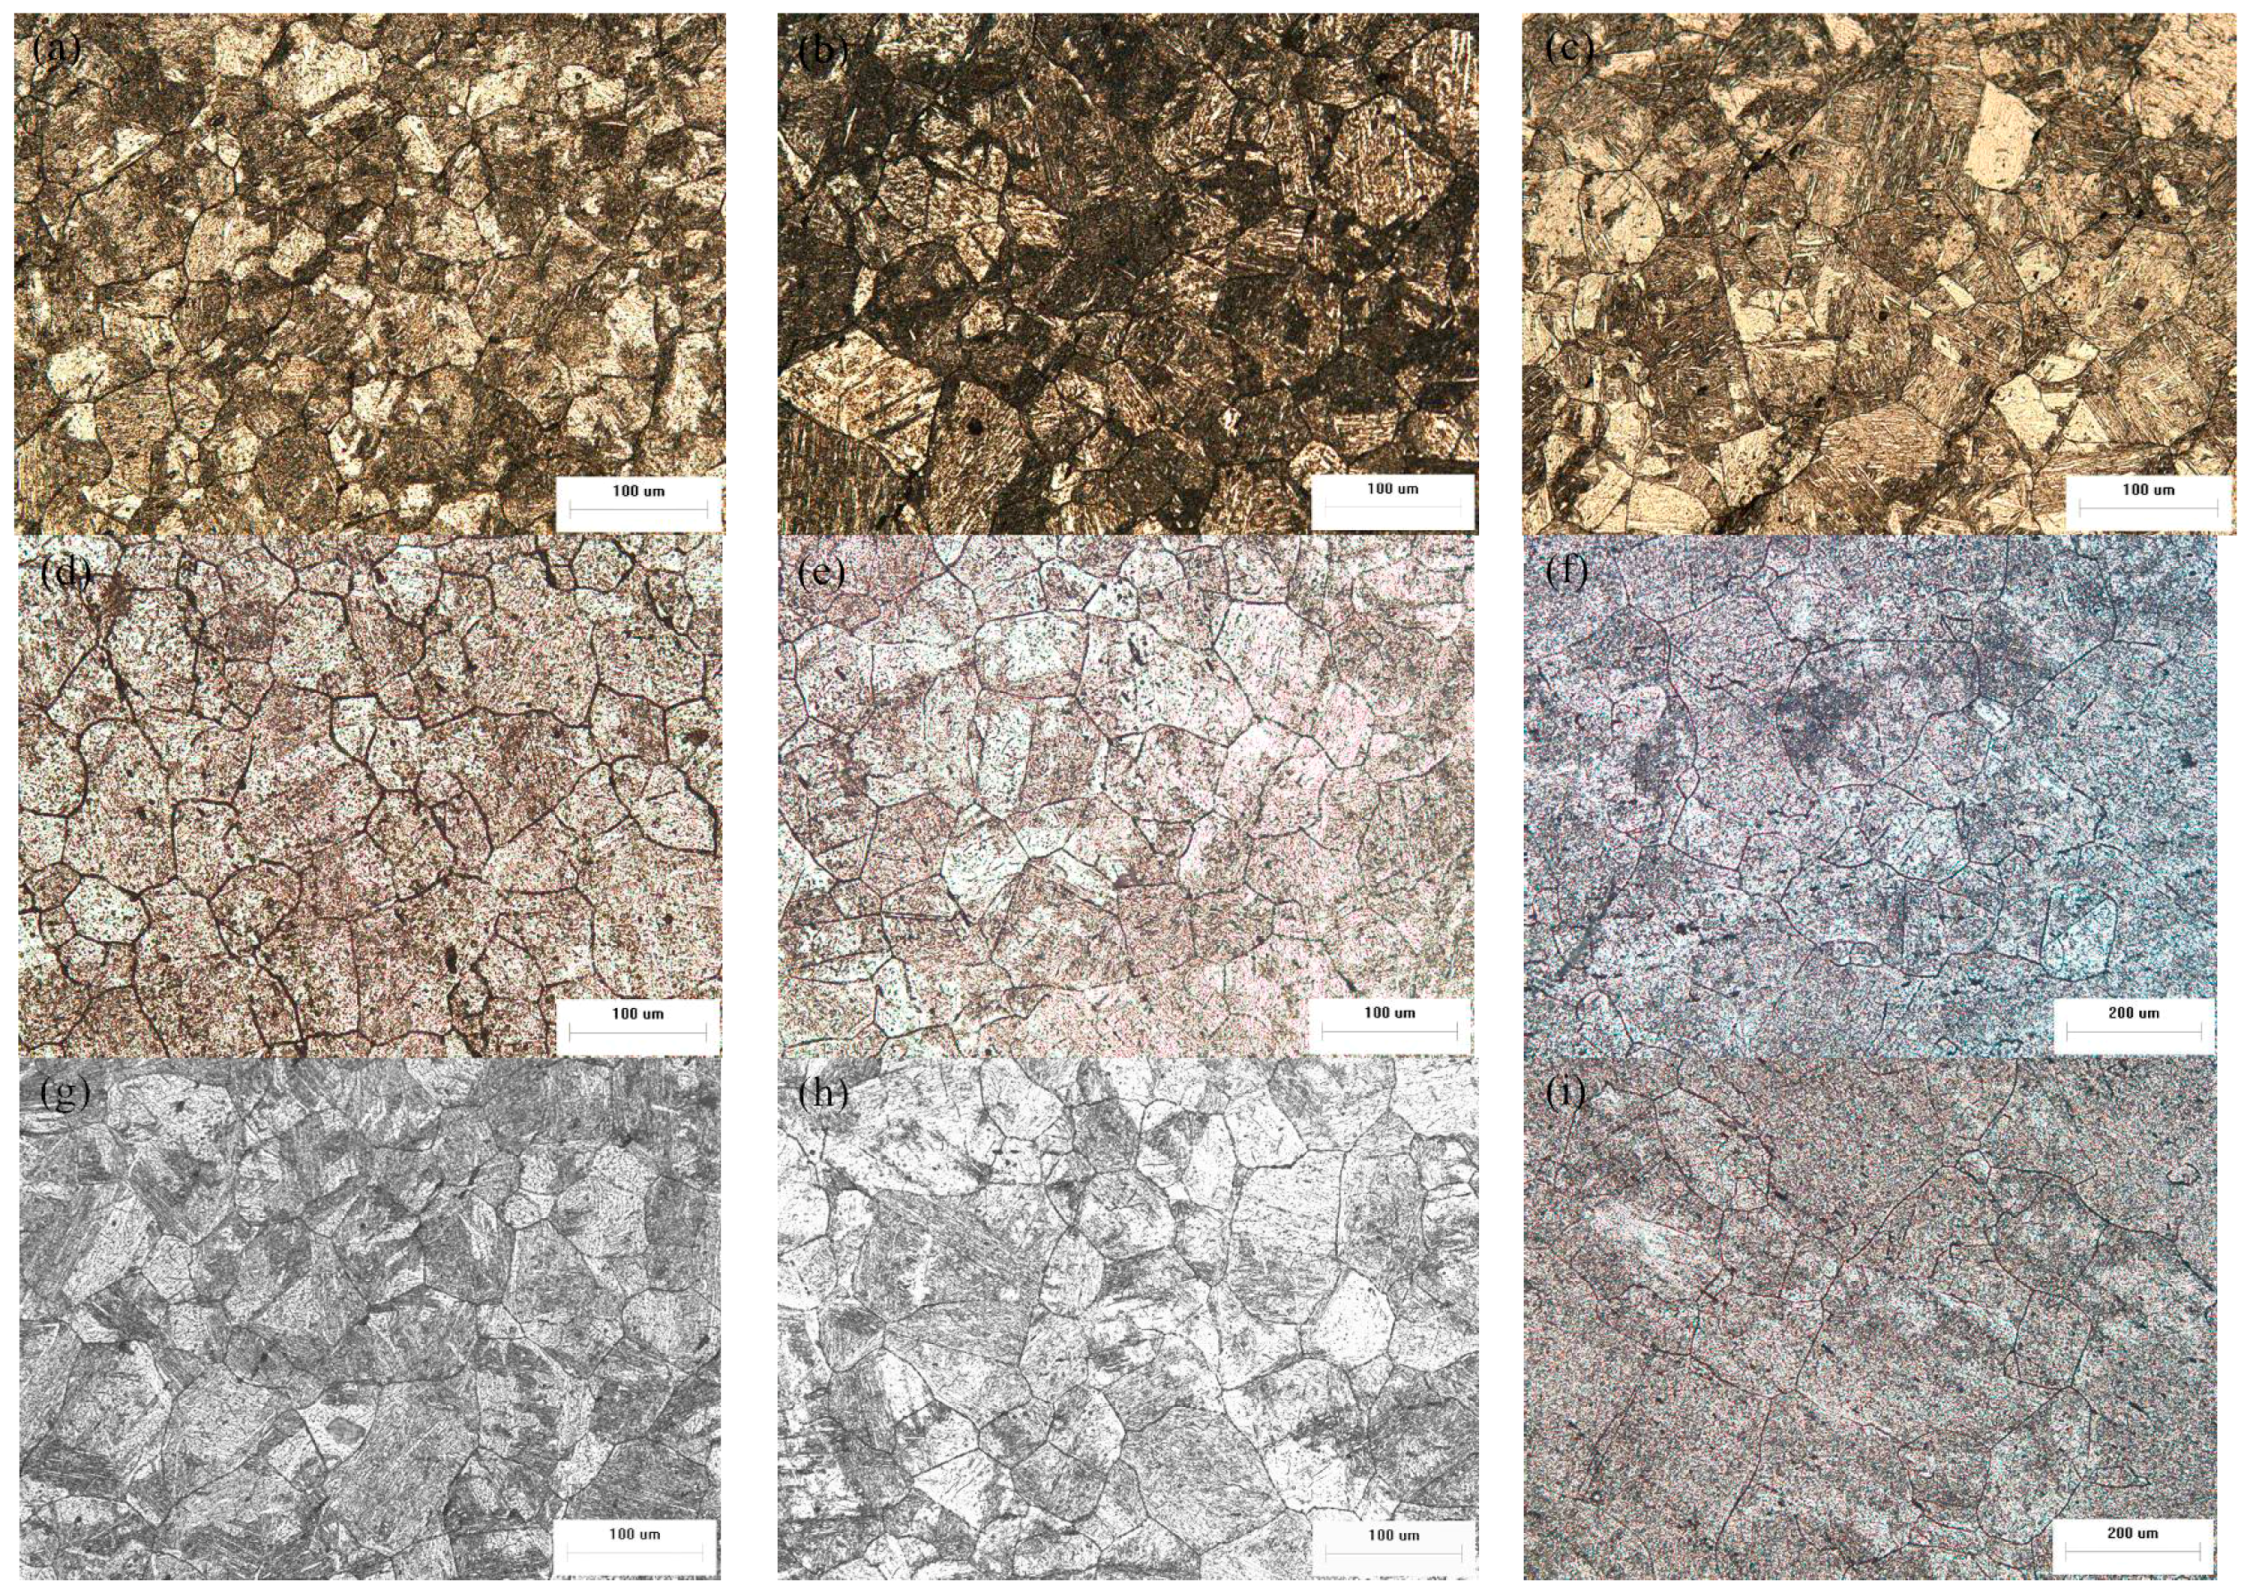
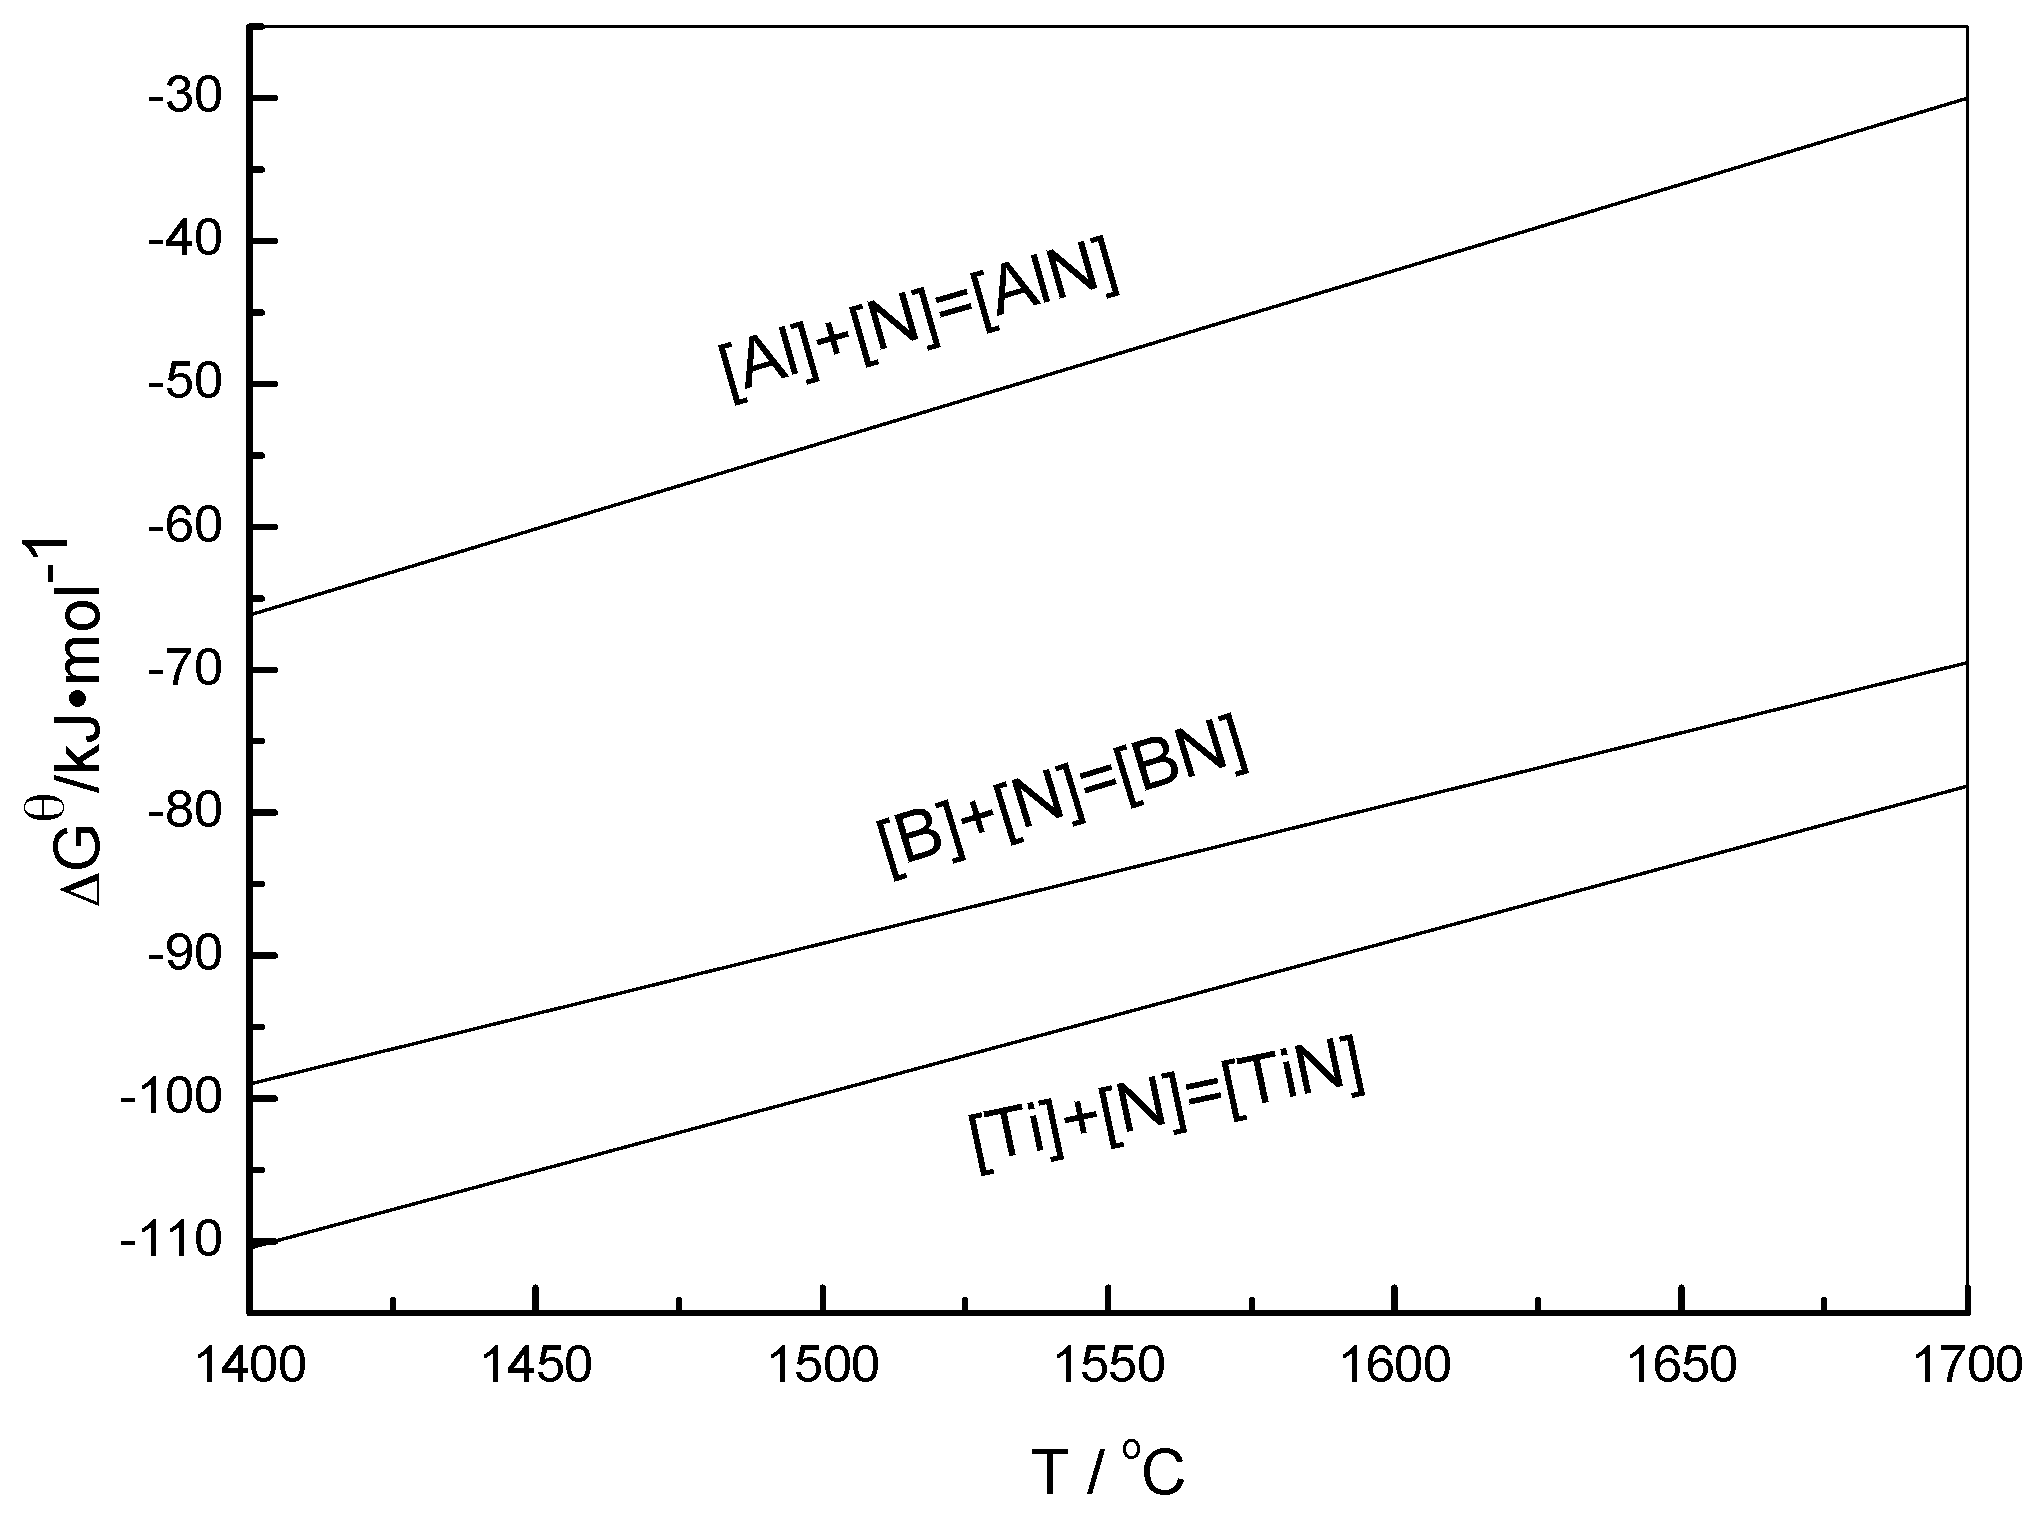
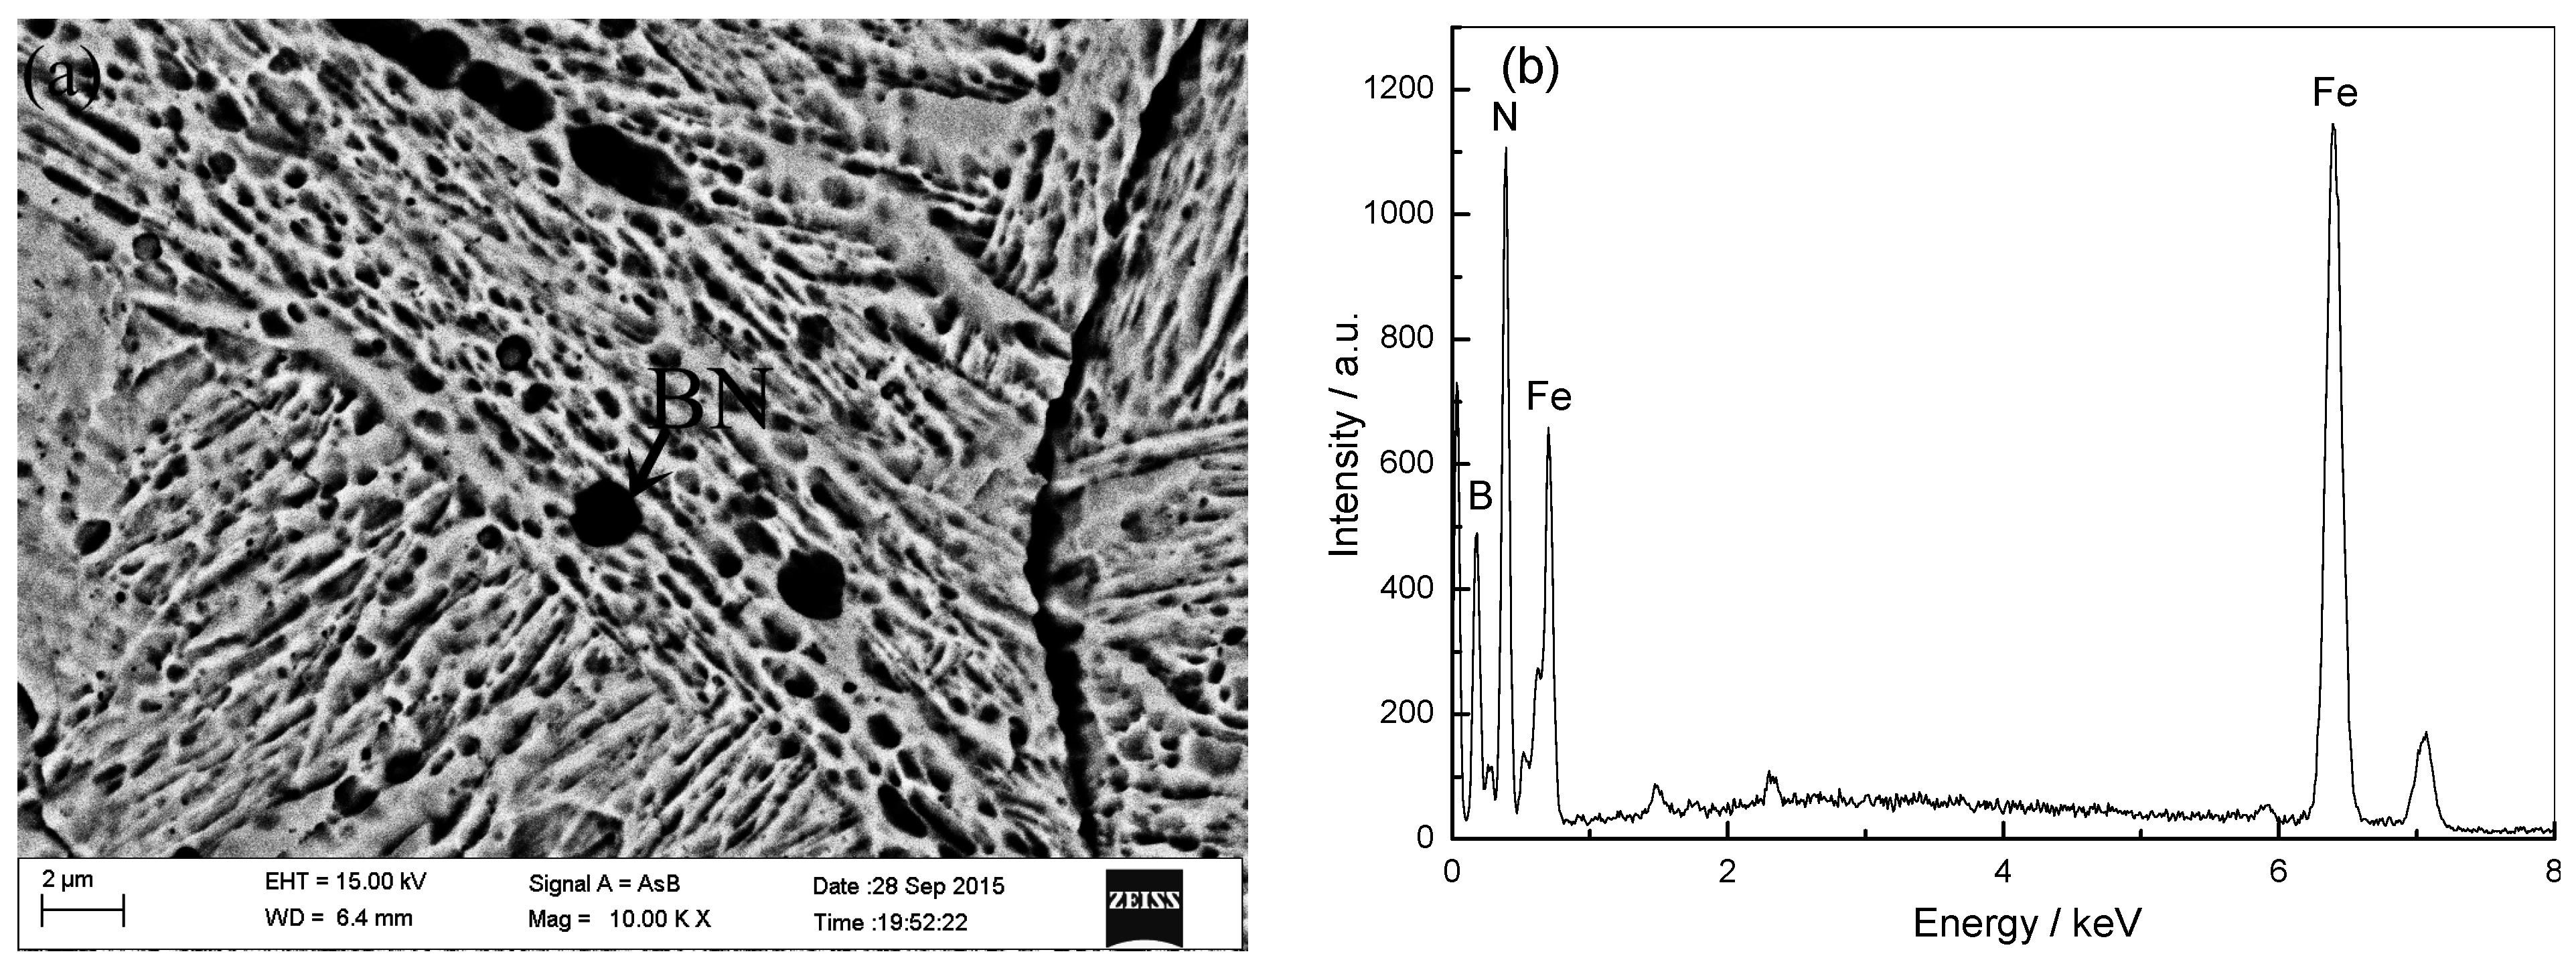
2.1. Influence of Boron Content on Initial Austenite Grain

Figure 1 shows the morphology of initial austenite grains of steels B1, B2 and B3 under various heating conditions respectively. Figure 2 shows the relationship between temperatures and average austenite grain sizes for steels B1, B2 and B3. It can be seen that the initial austenite grain size in all the regions increases with an increase in austenitization temperature. In addition, the austenite grain size of steel with higher boron content is larger than steel with lower boron content at each temperature.
Figure 1. Optical micrographs of initial austenite grain at different austenitizing temperatures: (a) B1, 1050 °C; (b) B1, 1100 °C; (c) B1, 1150 °C; (d) B2, 1050 °C; (e) B2, 1100 °C; (f) B2, 1150 °C; (g) B3, 1050 °C; (h) B3, 1100 °C; (i) B3, 1150 °C.
Crystals 05 00592 g001
Figure 2. Initial austenite grain size of specimens at different austenitizing temperatures.
Crystals 05 00592 g002
The initial austenite grain size of both steels is shown in Table 1. It can be seen that the grain size of steel B1 increases from 54 to 83 μm, while that of steel B2 and B3 increase from 56 to 105 μm and from 60 to 138 μm, respectively. This result indicates that additional boron can coarsen initial austenite grain size. This trend can be attributed to the fact that the amount of fine AlN reduces because of the formation of BN. It has been reported that AlN can pin the austenite grain boundaries and retard the growth of austenite grain [19]. Figure 3 shows that BN can be produced earlier than AlN at an identical temperature [20]. Figure 4 shows the characteristics and compositions of precipitates in steel B3. EDS analysis indicates that the particles in steel B3 contain B and N elements. Consequently, it indicates that the content of AlN reduces because of the formation of BN. Li [21] also observed a different content of AlN present in boron-free and boron-treated steel, with expected results showing that the amount of AlN decreases in boron-treated steel. In Bao’s work [22], the results showed that when the size of BN particles is about 10 mm, they are spherical and distributed along grain boundaries. When BN particles are larger than 20 mm, they are rod-like and distributed along grain boundaries. It can be seen that the size of BN is much larger. In addition, Chown [23] found that boron has a tendency to segregate to high-angle grain boundaries and to interfaces of incoherent particles such as MnS and Al2O3. This leads to the formation of complex precipitates, such as [MnS + BN], in which a spherical MnS precipitate is surrounded by polycrystalline aggregates of hexagonal BN. This coarsened the boron-containing precipitates. The size of AlN precipitates is much smaller than BN precipitates. The content of AlN reduces via boron addition. Consequently, additional boron can coarsen initial austenite grain size.
Table 1. Initial austenite grain size of the test steels (μm).
Steels1050 °C1100 °C1150 °C
B1545983
B25662105
B36068138
Figure 3. The ∆Gθ of producing AlN, BN, and TiN at different temperatures.
Crystals 05 00592 g003
Figure 4. SEM morphology of BN precipitate (a) and EDS spectrum; (b) in steel B3.
Crystals 05 00592 g004

2.2. Influence of Boron Content on Hot Deformation Behavior

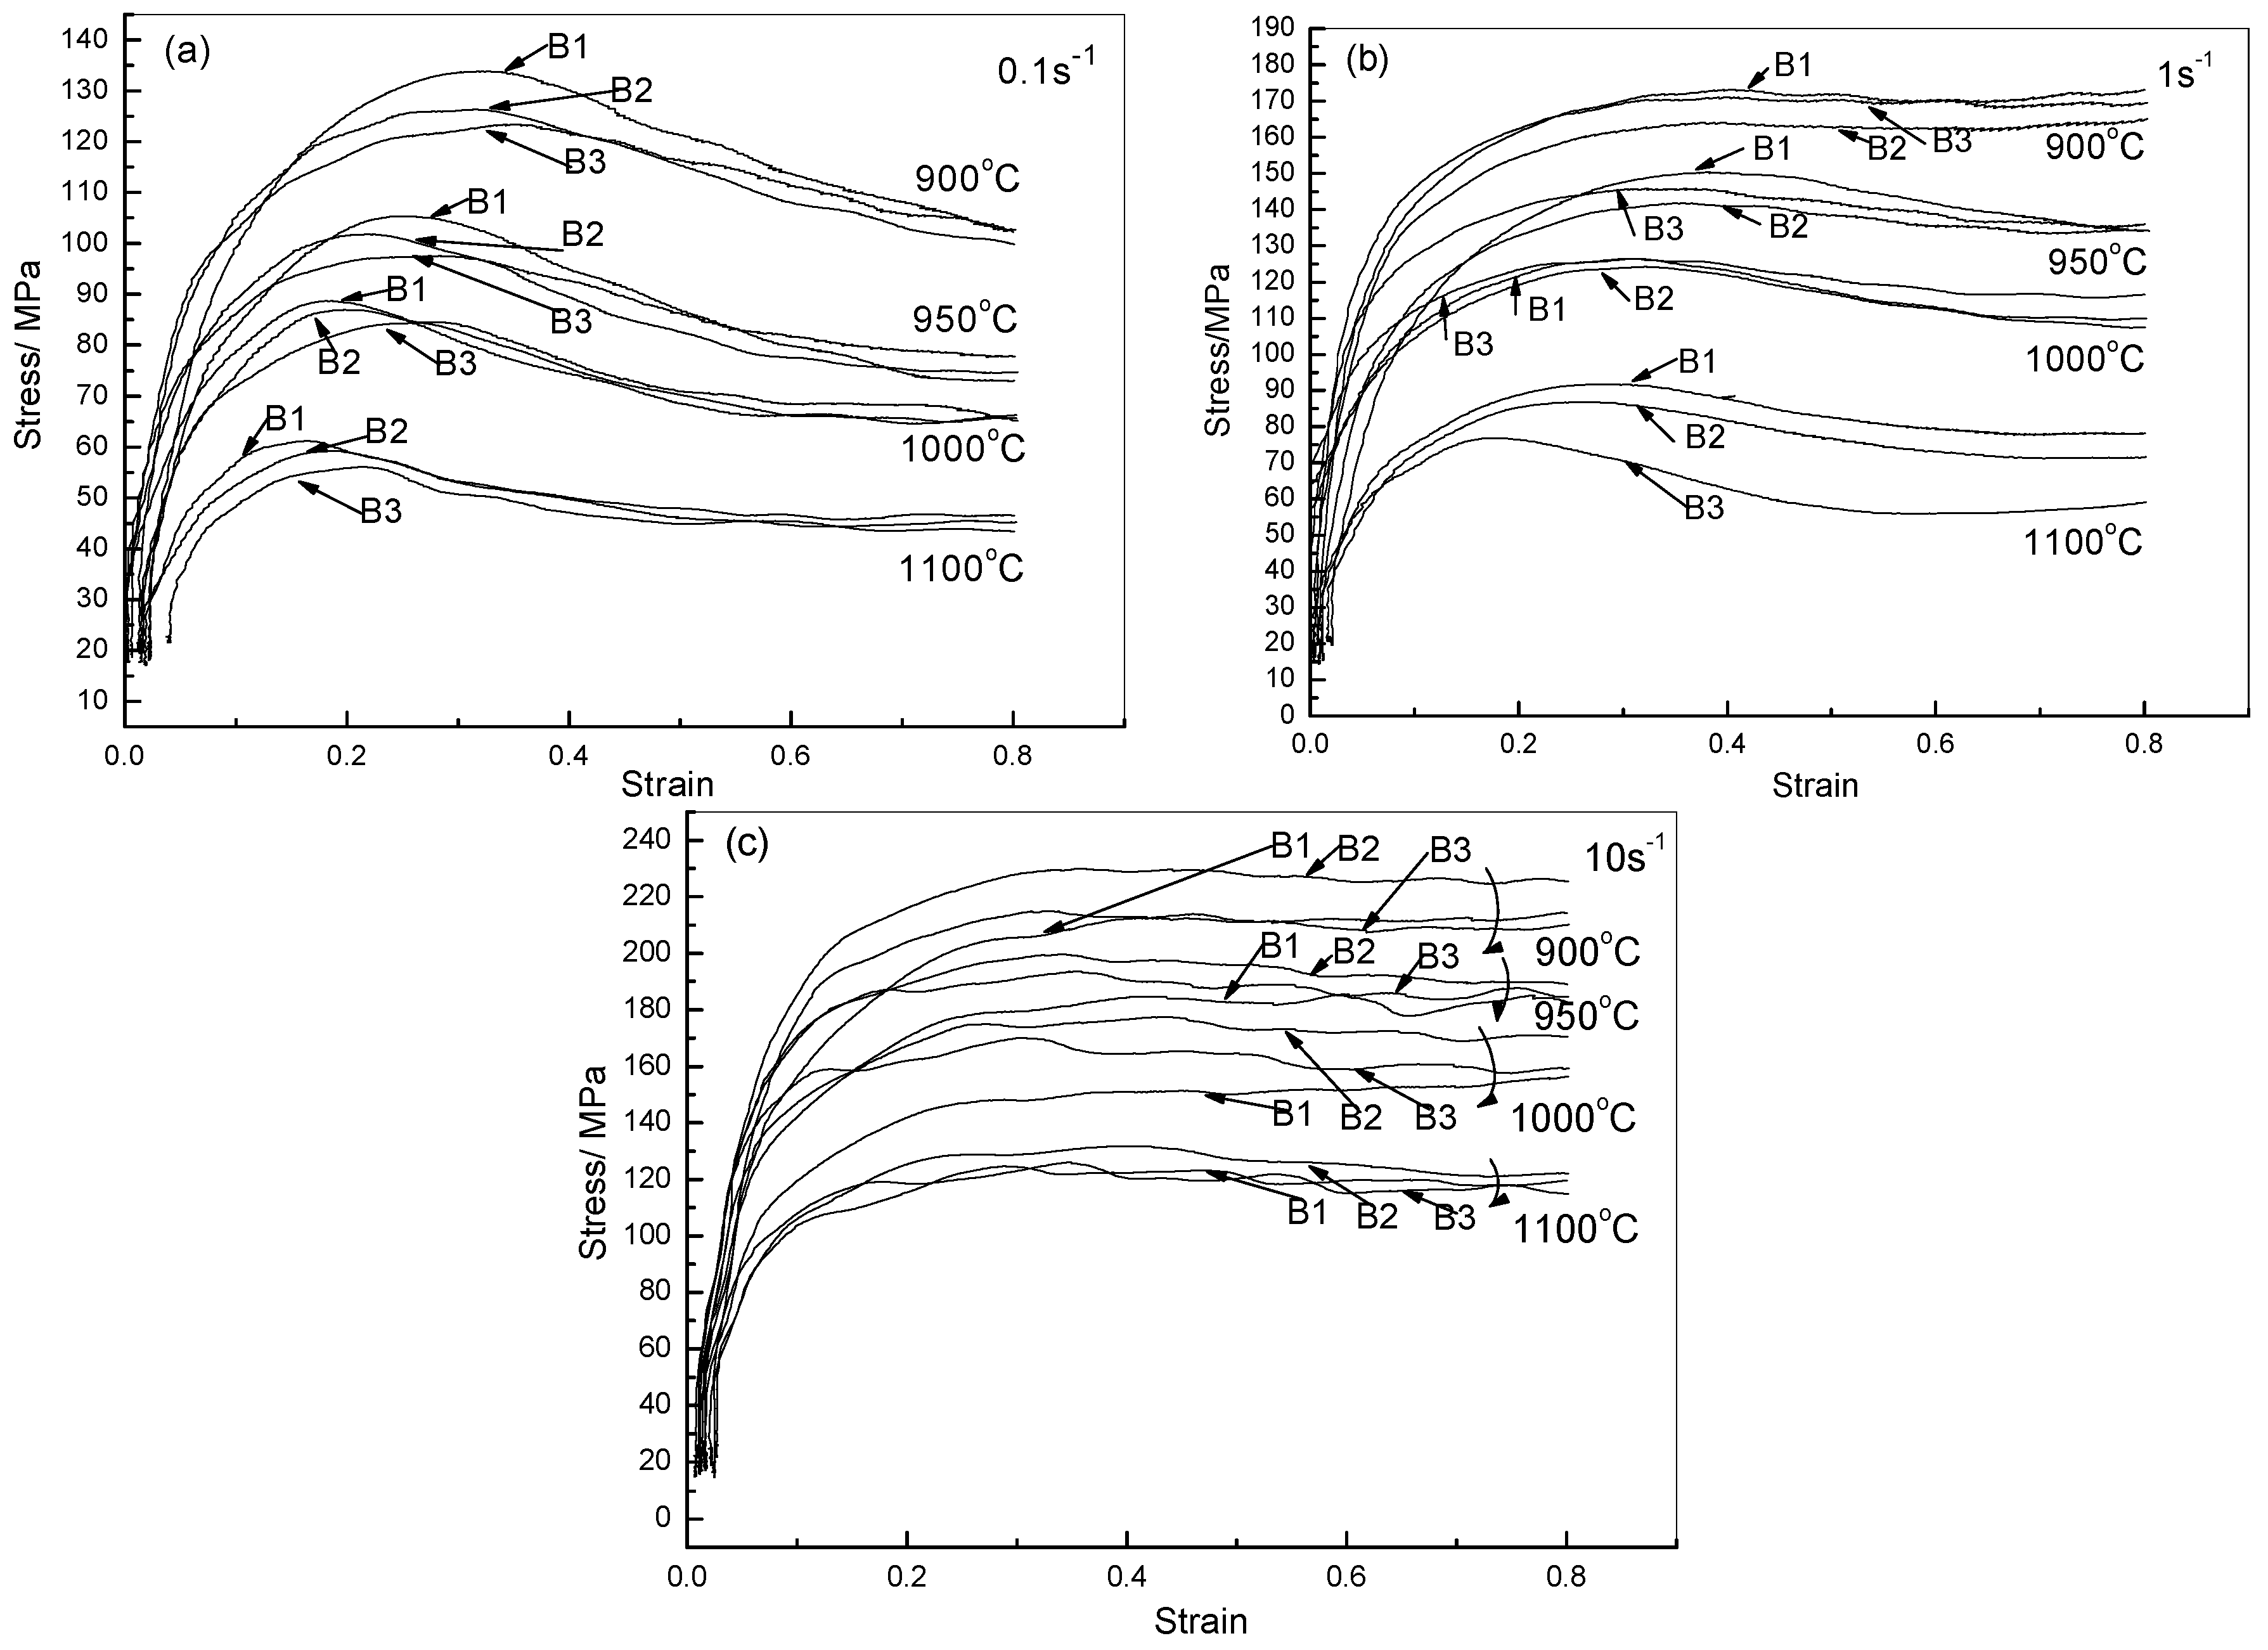
2.2.1. Flow Stress Curves

The flow stress curves of boron-treated steels deformed at distinct temperatures and strain rates are shown in Figure 5. It can be seen that the deformation temperatures and strain rates have considerable influence on the hot deformation behavior of the samples. The flow stress of each steel decreases significantly as temperature increases and strain rate decreases. Furthermore, the stress–strain curves (Figure 5) demonstrate a distinct classification of mechanisms taking place, DRV and DRX. Generally, stress rises to a peak and softens toward a steady state region, revealing the occurrence of DRX, and flow curves without well-defined peak stresses are generally believed to display DRV as the only restoring mechanism. DRV occurs for all deformation temperatures at a strain rate of 10 s1. When the strain rate decreases to 1 s1, DRV is only observed to occur at a deformation temperature of 900 °C. DRX occurs for all deformation temperatures at a strain rate of 0.1 s1.
From Figure 5a,b, it can also be seen that the DRX plots demonstrate that steel containing a higher boron concentration yields a lower peak stress value when compared to a sample with less boron at an identical temperature and strain rate. Accordingly, it is believed that boron has a solid solution-softening effect when DRX occurs. In the DRV process, Figure 5c displays B2 samples possessing an increased flow resistance in relation to the B3 samples, which only show a higher flow resistance relative to B1 samples at high strain rate (10 s−1). The expressed data proves to be identical with Kim’s [16] research. The reasoning for this phenomenon is that boron atoms have insufficient time for reorganization, precluding them from having any significant effect on softening under high strain rate. Additionally, the results exhibit that boron atoms hinder dislocation motion at high strain rates, and pinning effect decreases when boron reaches a distinct concentration limit.
Figure 5. Flow curves for different steels at different temperatures and strain rates.
Crystals 05 00592 g005

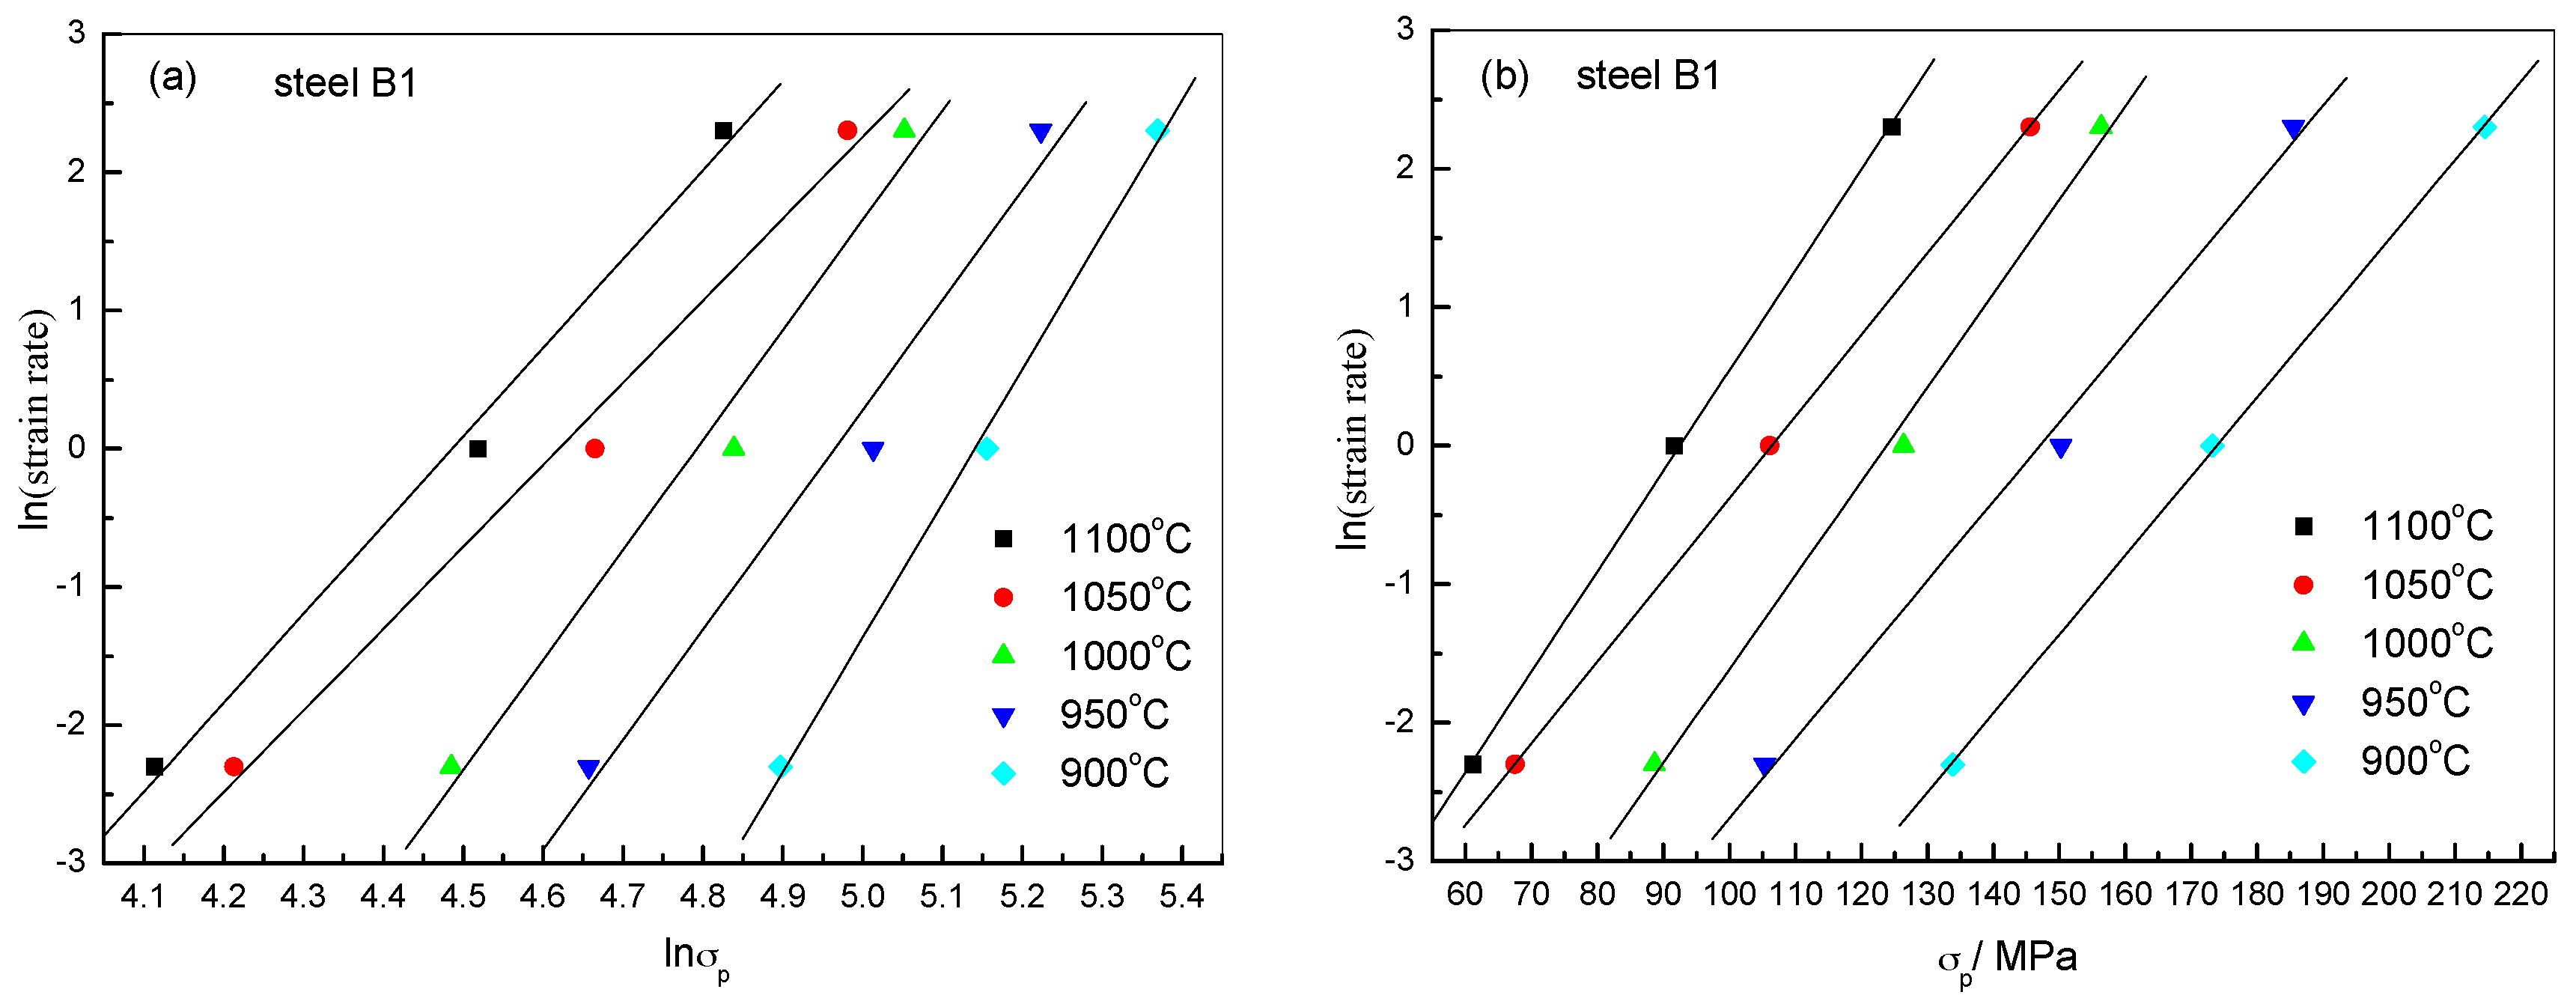
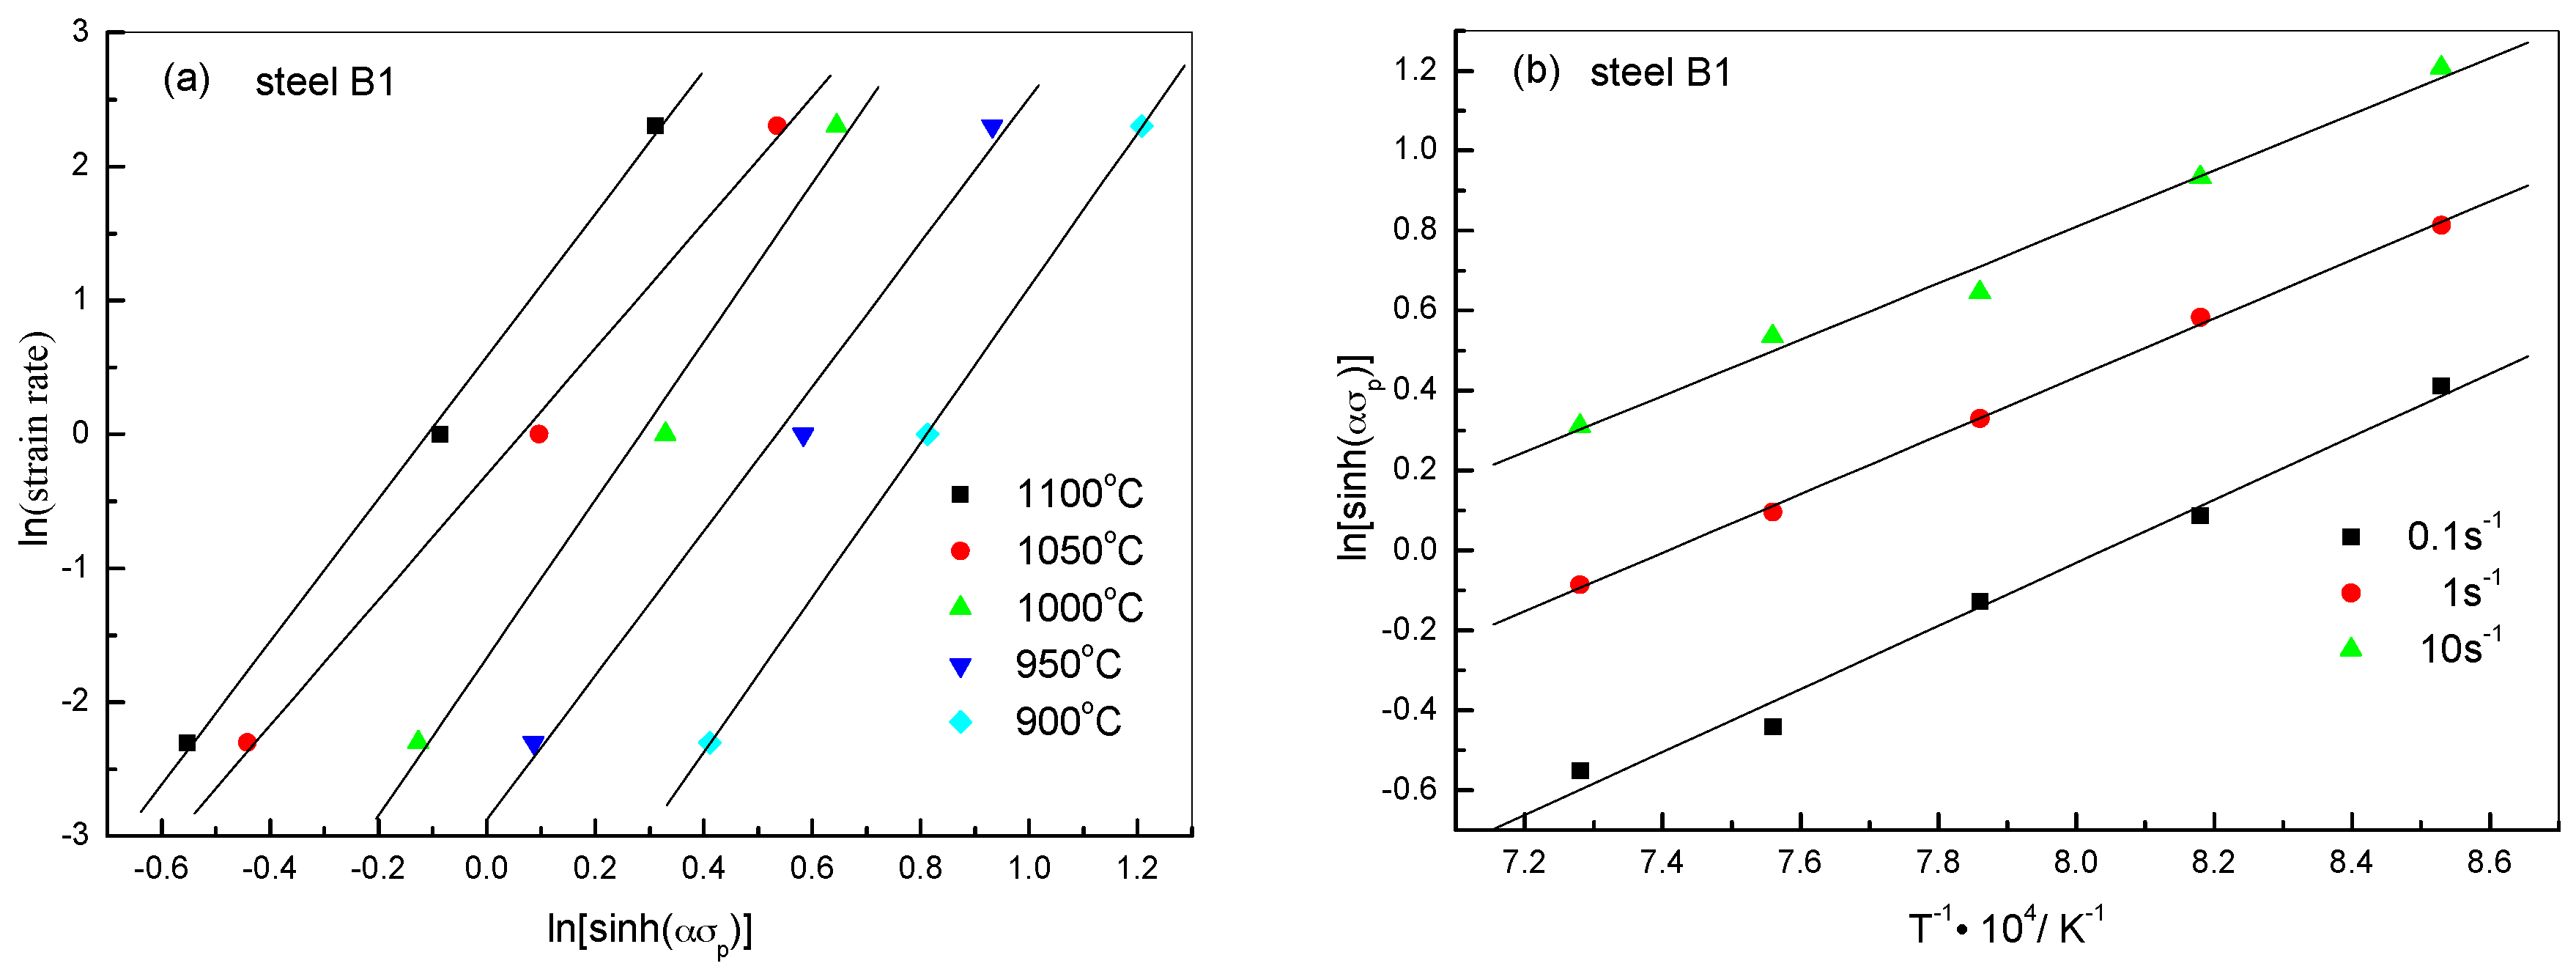
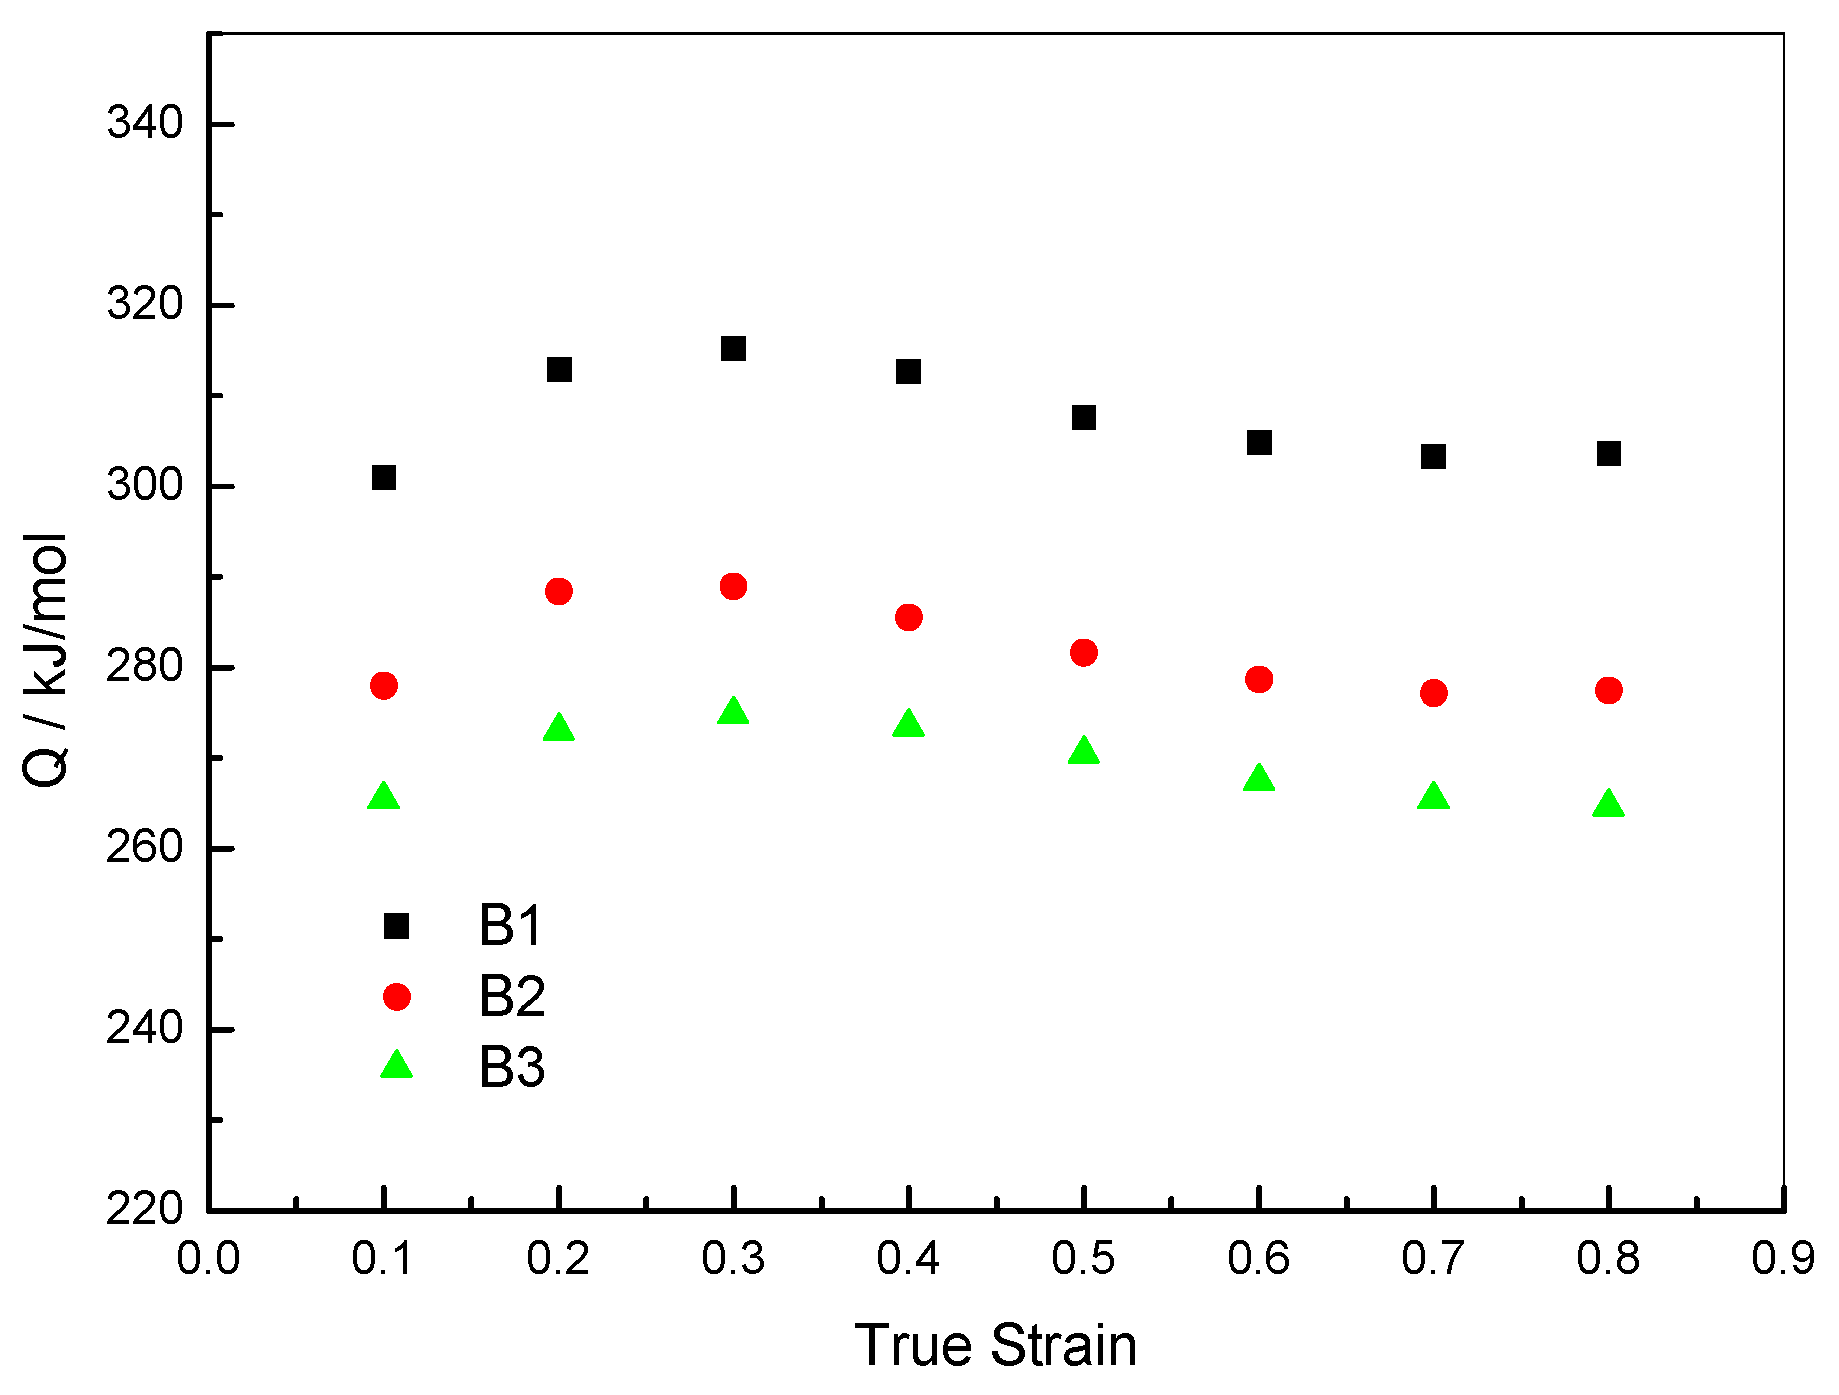
2.2.2. Constitutive Analysis

To investigate the effect of boron on the hot deformation behaviors, it is necessary to study the activation energy for deformation. Usually, the effects of the temperatures and strain rates on the deformation behaviors can be represented by Zener-Hollomon parameter, Z, in an exponent-type equation. Arrhenius equations are often employed to study the influence of temperature and strain rate on flow stress, and the hyperbolic law in the Arrhenius equation gives better approximations between Z parameter and stress [24]:
Z = ε ˙   exp ( Q / R T )
ε ˙ = A   [ sinh ( α σ ) ] n   exp ( Q / R T )  for all  σ
where
[ sinh ( α σ ) ] n = { σ n 1 α σ < 0.8 exp ( β σ ) α σ > 1.2
in which, ε ˙ is the strain rate (s−1), R is the universal gas constant (8.31 J·mol−1·K−1), T is the absolute temperature (K), Q is the activation energy of hot deformation (kJ/mol), A, α, β, n1 and n are the material constants, and σ is the flow stress (MPa). Characteristic stresses such as peak stress, steady state stress, or stress corresponding to a specific strain can be used in these equations [25]. The constitutive equations of the three steels are established using peak stress. The value of α can be calculated from α = β/n1.
For low (ασp < 0.8) and high (ασp > 1.2) stress levels, taking natural logarithms on both side of Equation (2) produces:
ln
ln ε ˙ = ln A + n 1 ln σ ( Q / R T )
ln ε ˙ = ln A + β σ ( Q / R T )
There is a linear relationship between lnσp and ln ε ˙ as well as between σp and ln ε ˙ at different deformation conditions, as shown in Figure 6a,b, respectively. The mean value of n1 and β at different temperature can be computed as 6.7717 and 0.0607, so α = 0.0090 for steel B1.
Figure 6. Relationship between ln(strain rate) and (a) lnσp; (b) σp.
Crystals 05 00592 g006
Taking natural logarithms on both sides of Equations (2) and (6) can be obtained.
ln
ln ε ˙ = n   ln [ sinh ( α σ p ) ] + ln A Q / ( R T )
When T is constant, the partial differentiation of Equation (6) yields Equation (7).
n = ln ε ˙ ln [ sinh ( α σ p ) ]
In accordance with the relationship curves of ln ε ˙ and ln[sinh(ασp)] (Figure 7a), the average value of n can be estimated to be 5.4195 for steel B1.
When ε ˙ is constant, the partial differentiation of Equation (6) yields Equation (8).
Q = R n ln [ sinh ( α σ p ) ] ( 1 / T )
Figure 7b shows the relationship between ln[sinh(ασp)] and T−1, which is a set of parallel lines. This means that the activation energy for hot deformation is the same, irrespective of the strain rate. Thus, the activation energy for steel B1 can be calculated according to Equation (8); it is 316.86 kJ/mol.
According to Equations (1) and (2), the following equation can be obtained.
Z = A[sinh(ασp)]n
Figure 7. Relationship between ln[sinh(ασp)] and (a) ln(strain rate); (b) T−1.
Crystals 05 00592 g007
The relationship between [sinh(ασp)]n and Z is presented in Figure 8, from which A can be readily computed as 1.501 × 10¹². The parameters in constitutive equations of all tested steels are shown in Table 2, and the constitutive equations of the experimental steels are shown as follows:
Z(B1) = 1.501 × 10¹²[sinh(0.0090σp)]5.4195
Z(B2) = 4.495 × 10¹¹[sinh(0.0078σp)]4.8760
Z(B3) = 6.009 × 10¹⁰[sinh(0.0089σp)]4.6014
Figure 8. Relationship between [sinh(ασp)]n and Z.
Crystals 05 00592 g008
Table 2. The parameters in the hot deformation constitutive equations.
Steelsβn1αnQ (kJ/mol)A
B10.06076.77170.00905.4195316.861.501 × 1012
B20.04656.00330.00784.8760286.454.495 × 1011
B30.05065.69400.00894.6014277.916.009 × 1010
Table 2 shows that the activation energy of steel B1 (316.86 kJ/mol) is higher than that of steel B2 (286.45 kJ/mol) and steel B3 (277.91 kJ/mol), which indicates that boron addition reduces the activation energy of steels in hot deformation. From Figure 9, it is seen that the Q value at different strains is also consistent with this trend: Steel B1 has the highest value, and steel B2 has a higher value than steel B3. These obtained results are in agreement with the results of other experiments [16]. On the basis of Jahazi’s work [26], boron has dual nature in the austenite lattice, i.e., boron atoms can occupy either substitutional or interstitial sites. He also found that a boron atom can make the transition from its substitutional position to an interstitial one in a sufficient energy condition. Research work [27] carried out previously has shown that interstitial atoms are able to reduce the activation energy for austenite deformation, while substitutional atoms increase the activation energy. Boron can thus move from their substitutional position to an interstitial one under hot deformation and subsequently reduce the activation energy.
Figure 9. Effect of strain on activation energy of steels.
Crystals 05 00592 g009

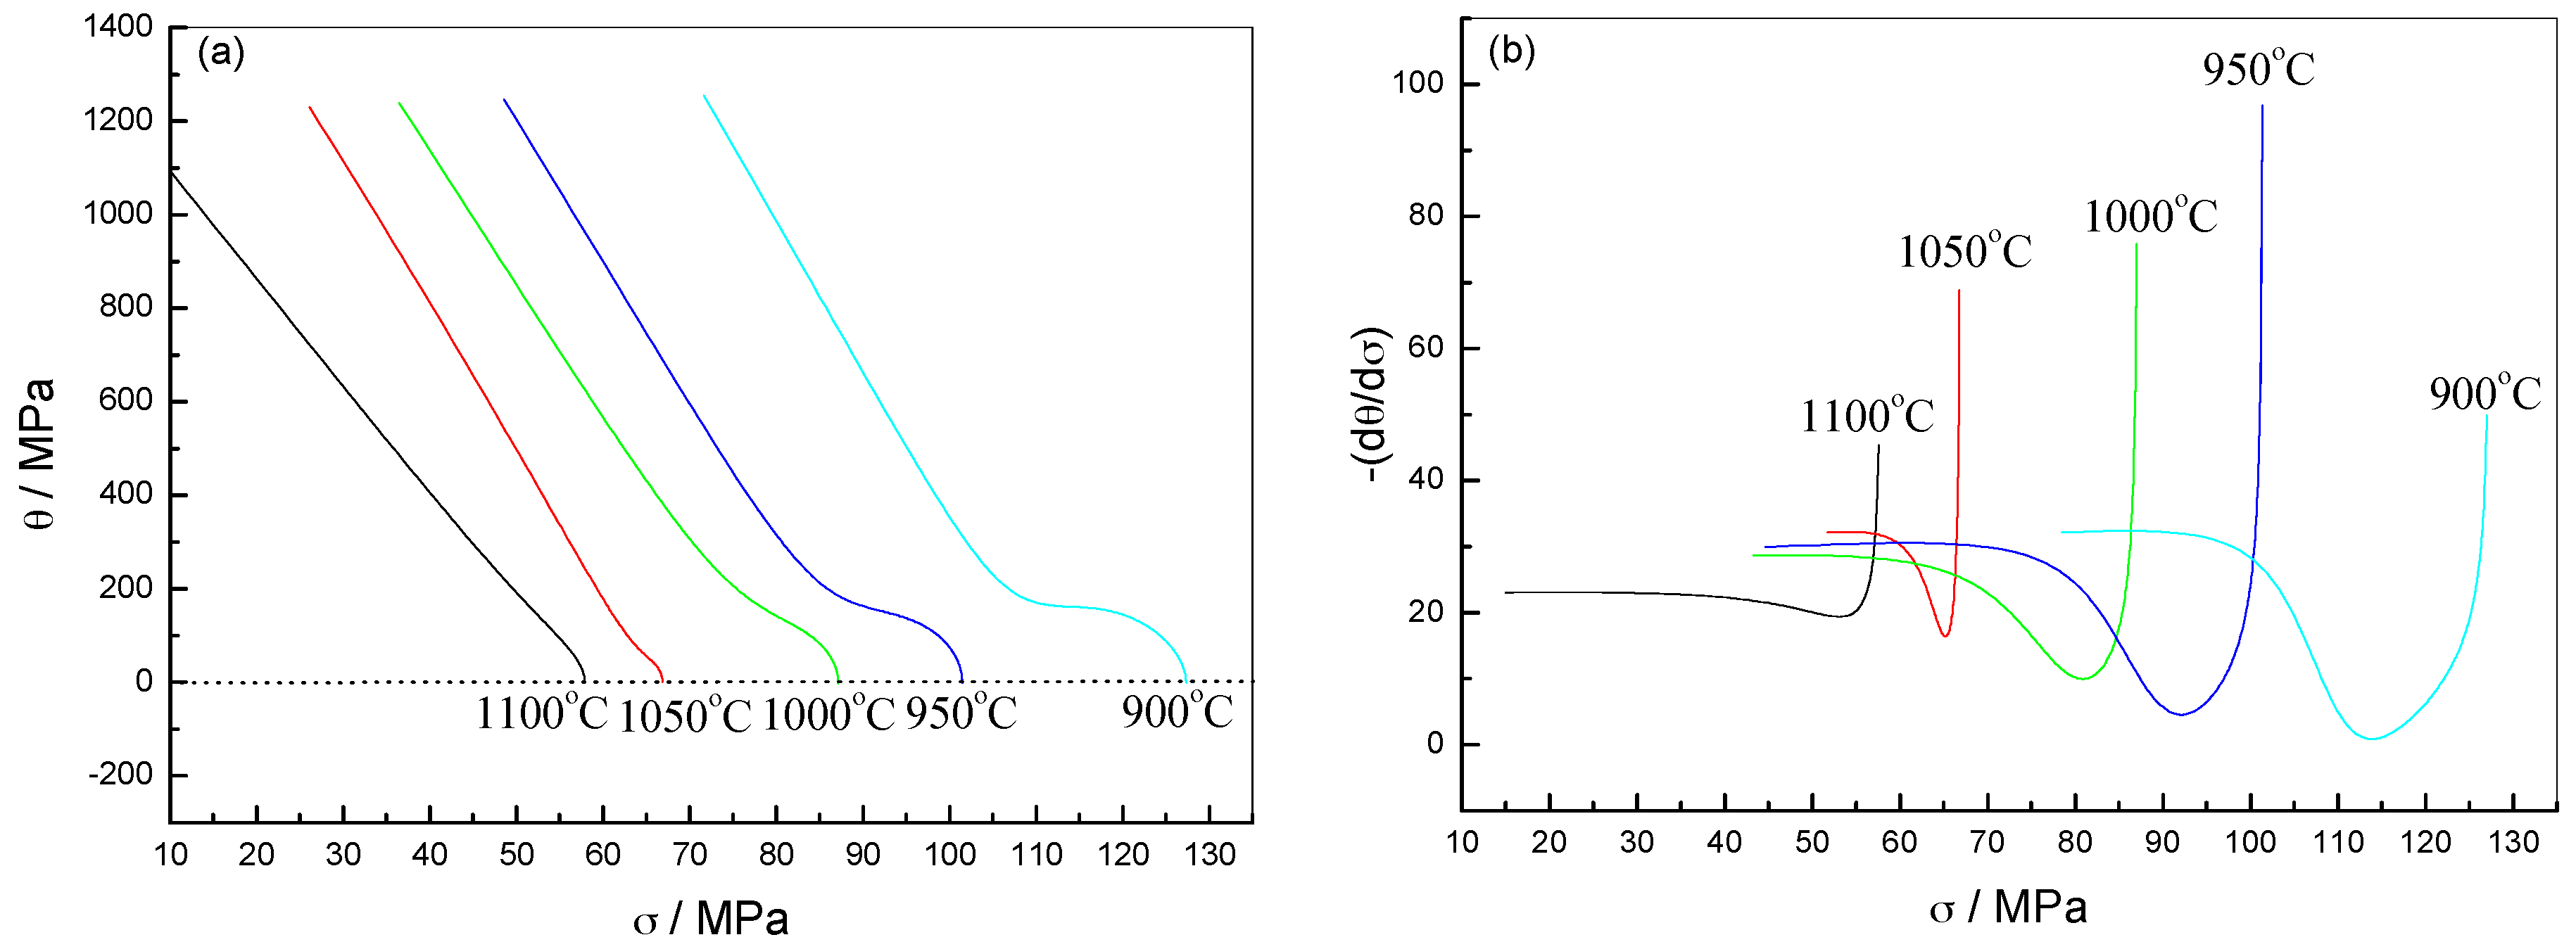
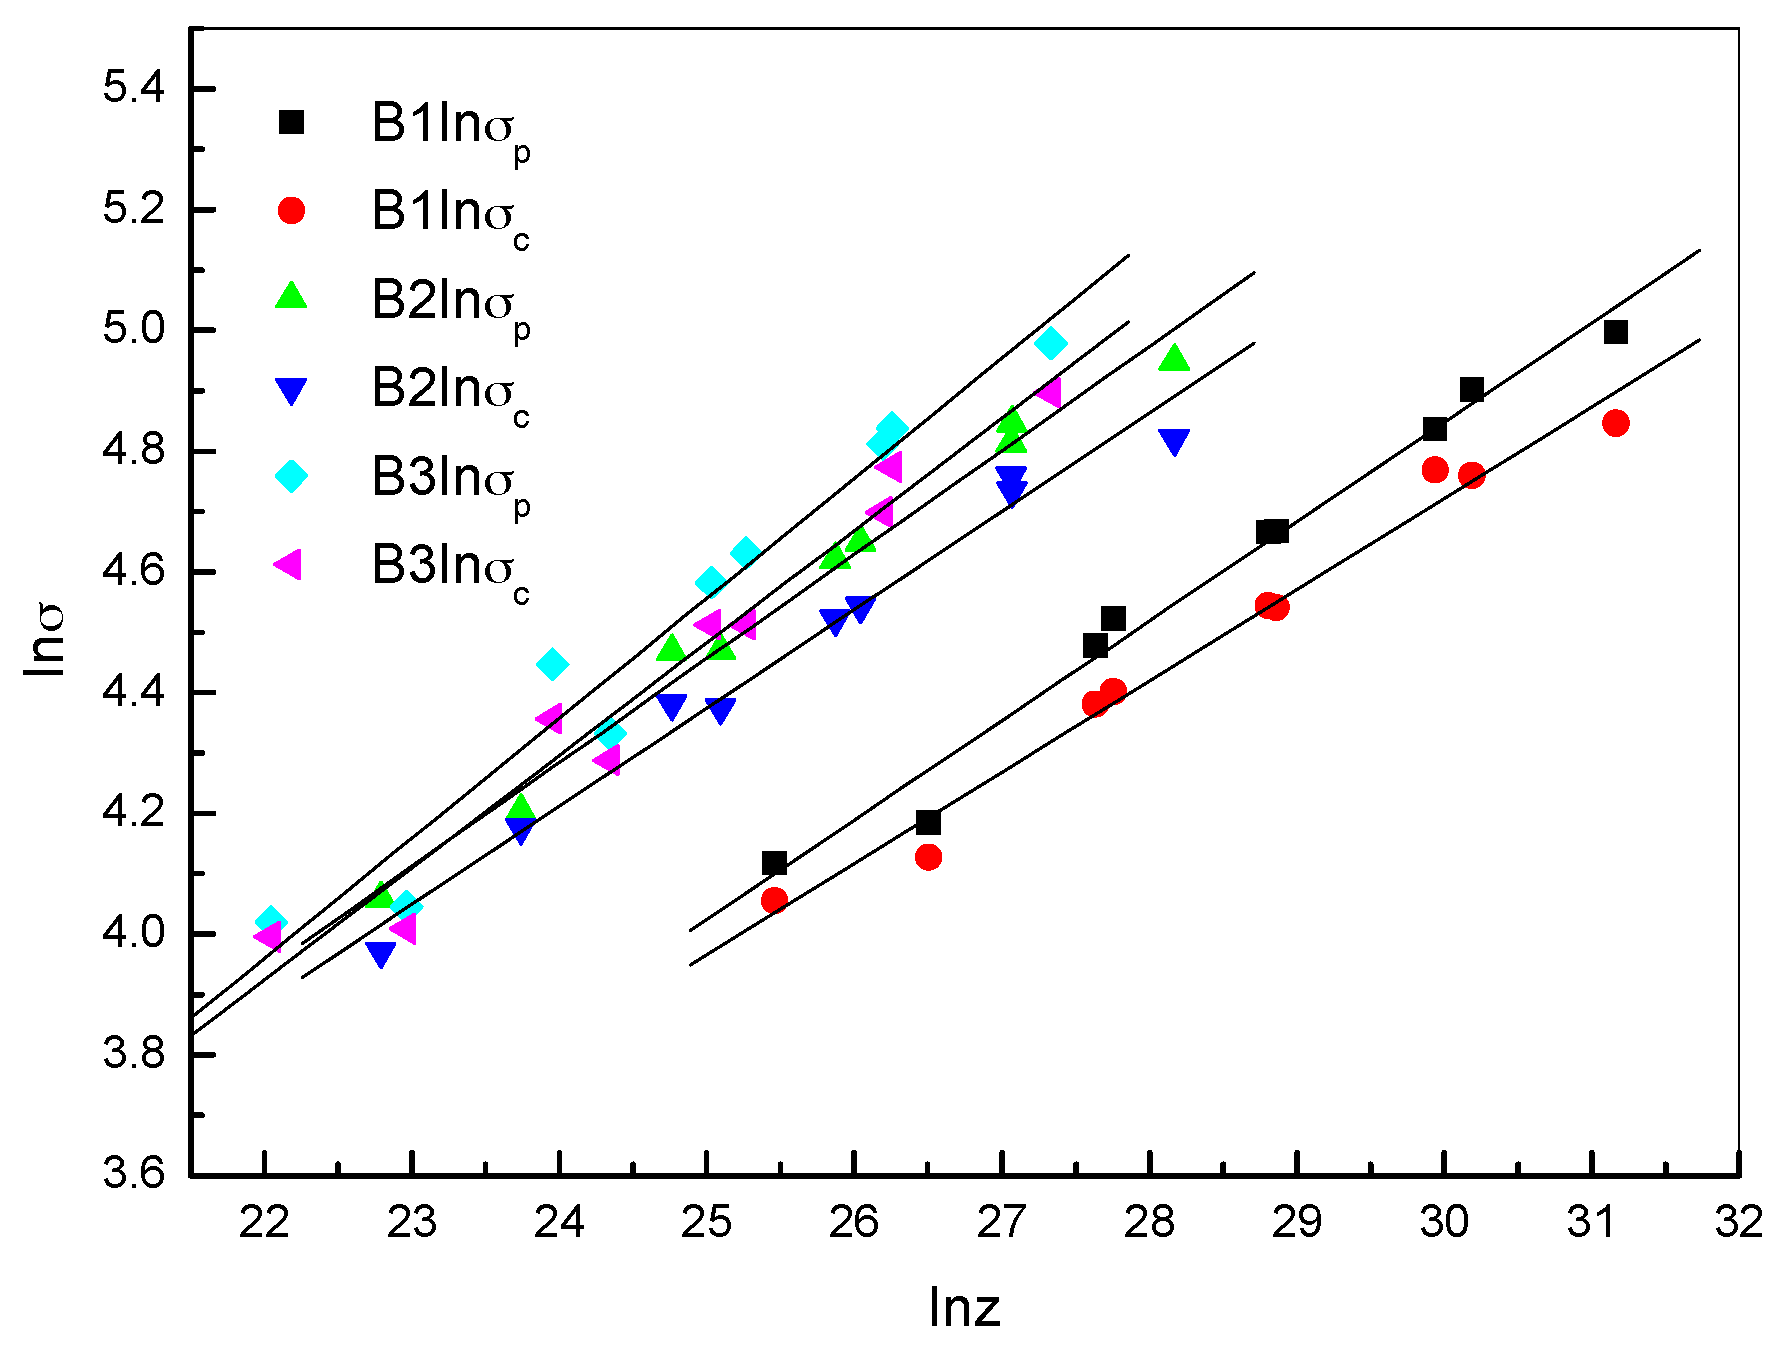
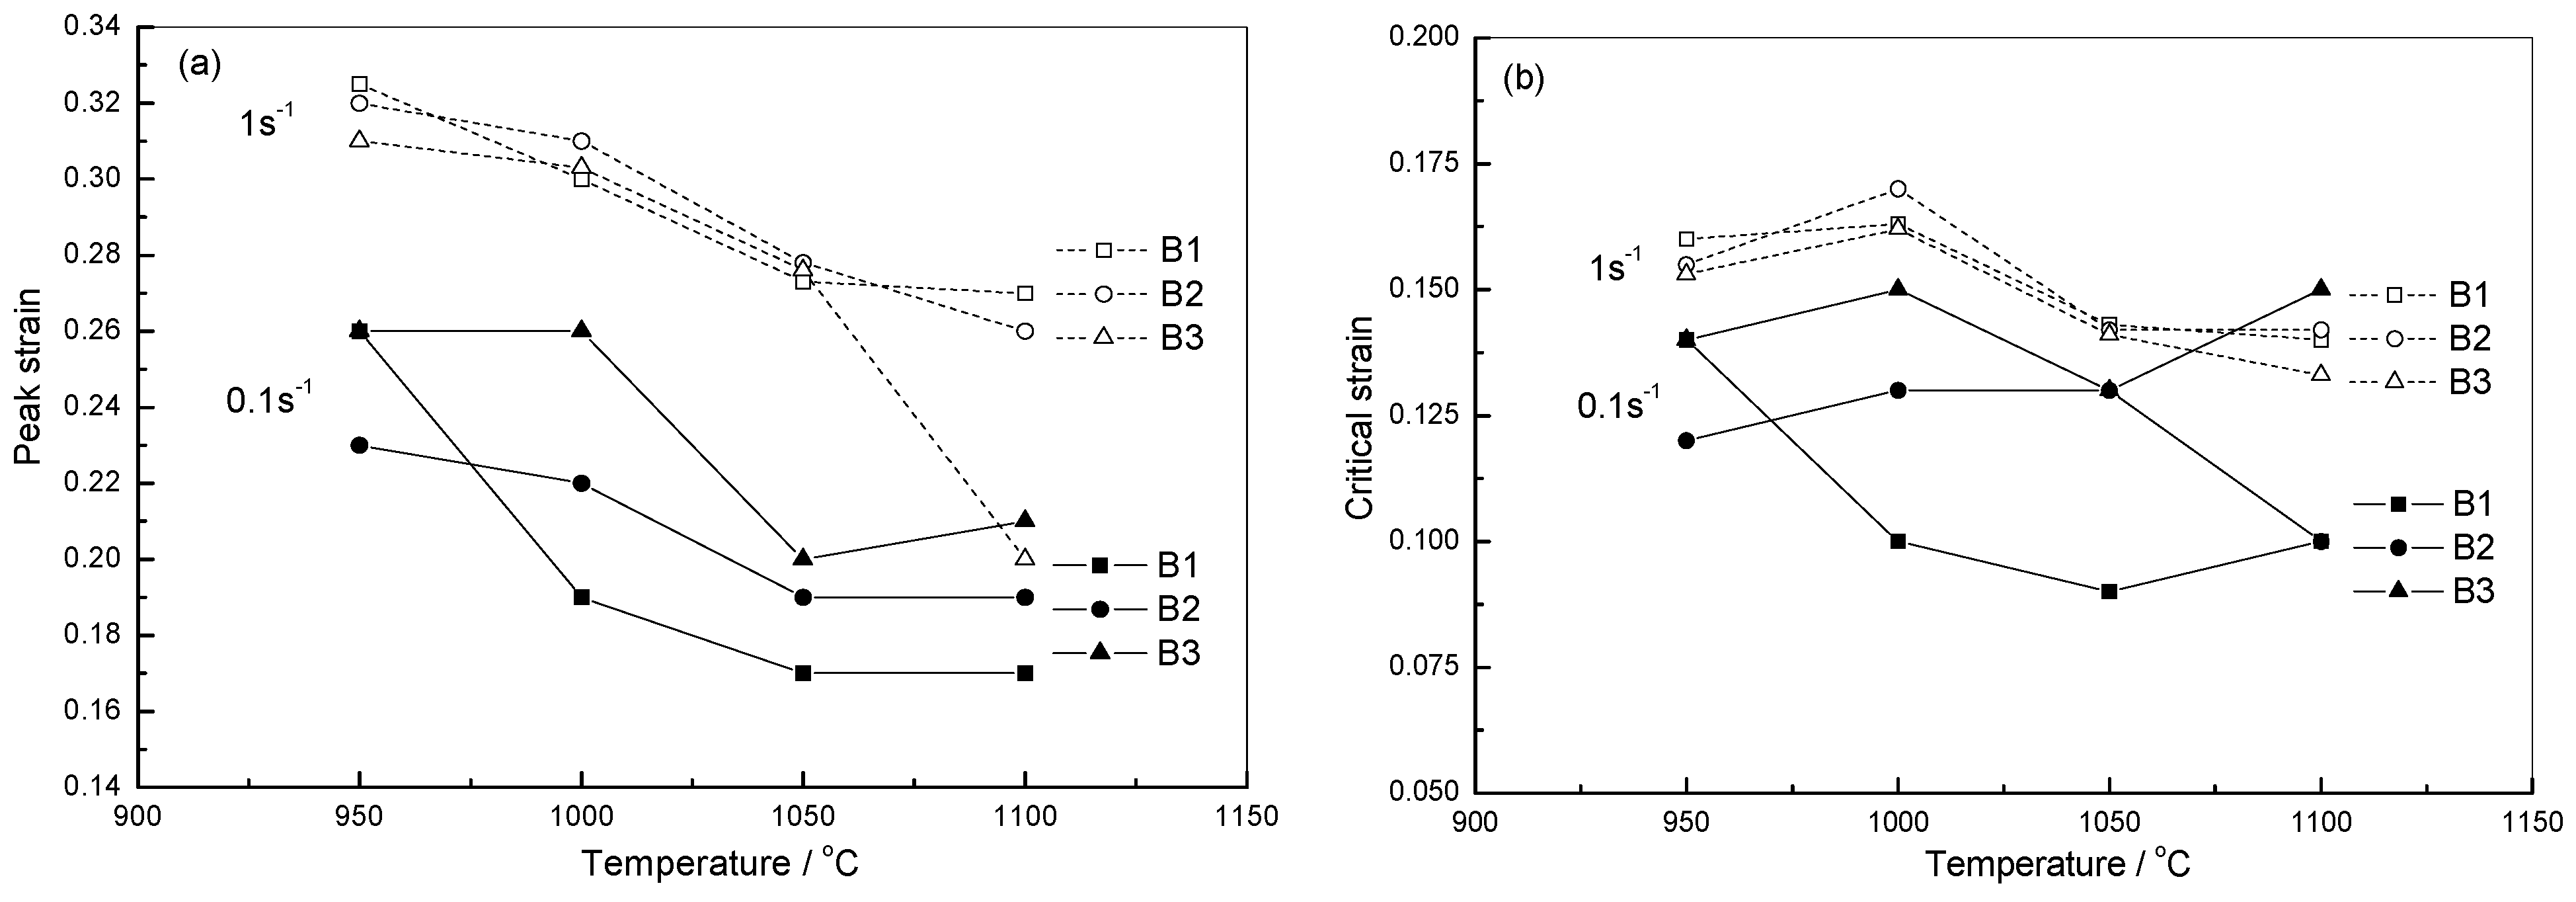
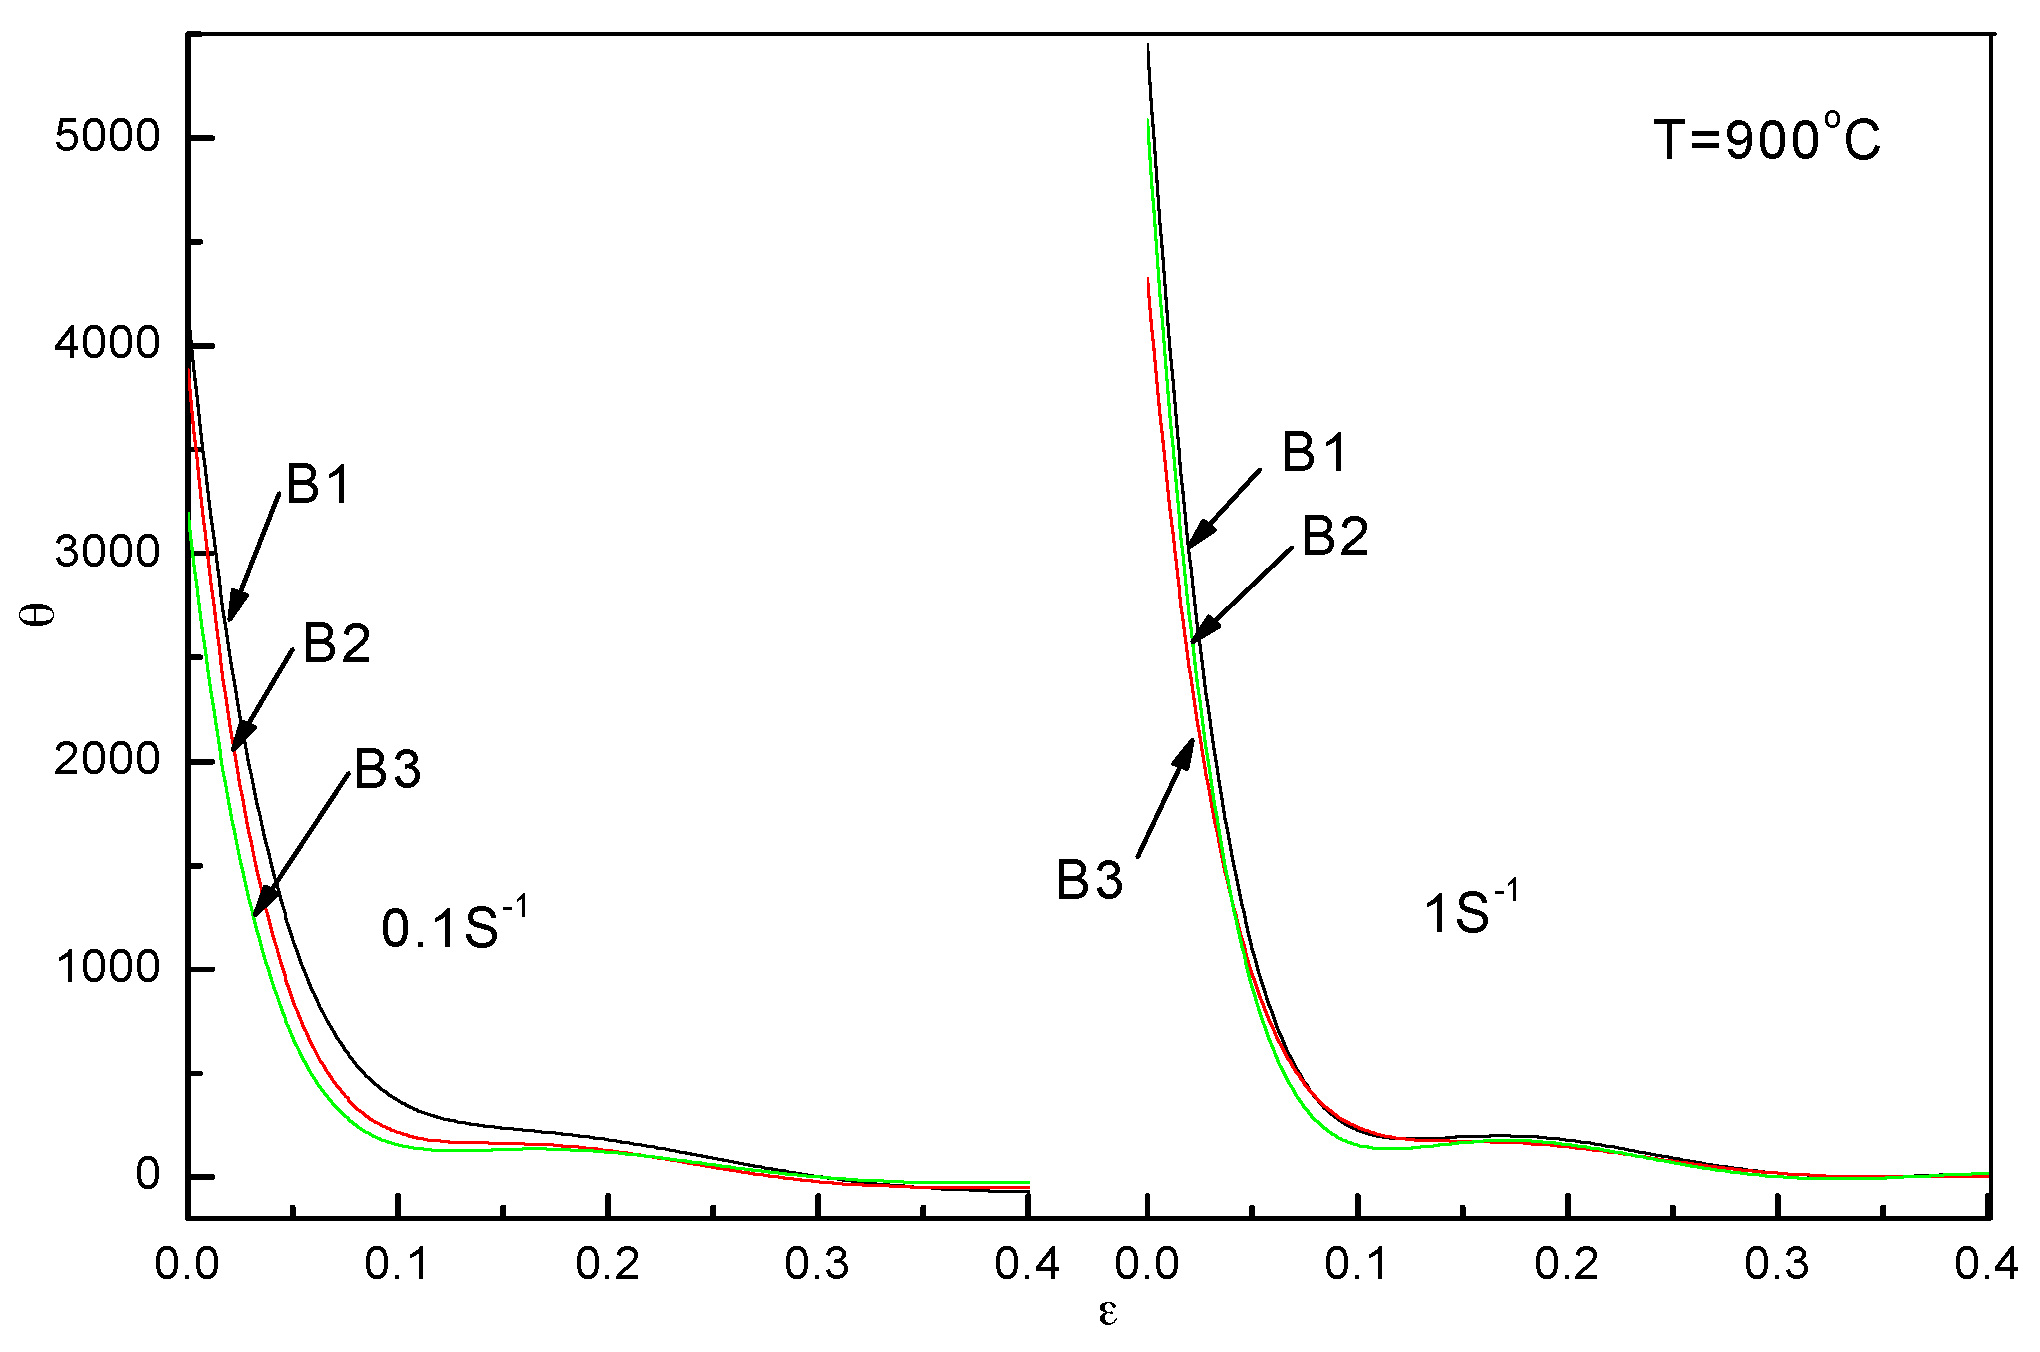
2.2.3. Critical DRX Parameters

To study the effect of boron content on the DRX behavior in more details, the peak stress (σp), critical stress (σc), peak strain (εp) and critical strain (εc) were analyzed according to the approach of Poliak and Jonas [28,29,30], an approach that is based on changes in the strain hardening rate (θ) as a function of the flow stress. In the θ-σ plot, the points at which the plot crosses the zero from above represent the peak stress, and the initiation of DRX appears as a distinct minimum in the (−(dθ/dσ))-σ plot. Figure 10a shows the θ-σ curve for steel B2 at strain rate 0.1 s−1 and different temperatures. As can be seen, peak stress of steel B2 clearly increases with decreasing temperature; similarly, critical stress also clearly increases with decreasing temperature, as seen from Figure 10b. Consequently, using θ-σ and (−(dθ/dσ))-σ curves, the peak and the critical stress and strains of texted steels can be determined for all ranges of analyzed deformation and temperature conditions.
The dependence of the characteristic points of steels under different deformation conditions on Z parameter is shown in Figure 11. It can be seen that the peak and the critical stress increase with a higher Z parameter and with the boron content. Table 3 shows the regression analysis of the curves; it can be seen that the differences of the Z parameter between the three steels is less clear.
Figure 10. Strain harding rate (θ) versus true stress at 0.1 s−1 for steel B2 at different temperatures. (a) θ-σ curves; (b) (−(dθ/dσ))-σ curves.
Crystals 05 00592 g010
Figure 11. Relationship between σp, σc and Z for the different steels.
Crystals 05 00592 g011
Table 3. The dependence of the characteristic points under different deformation conditions on Z parameter.
Steel B1Steel B2Steel B3
lnσp-lnZlnσp = 0.16465 lnZ − 0.09199lnσp = 0.17208 lnZ + 0.15473lnσp = 0.19057 lnZ − 0.40797
lnσc-lnZlnσc = 0.15116 lnZ + 0.18716lnσc = 0.16276 lnZ + 0.30586lnσc = 0.18593 lnZ − 0.16590

2.2.4. Analysis of DRX Behaviors

In Figure 12, the relationship between peak, critical stress, and the logarithms of the strain rate are plotted. As seen in the curve, peak and critical stress increase with decreasing boron content and temperature. This means that steel with higher boron content is softer than steel with lower boron content, which is in reasonable agreement with some previous reports [13,14,15,16]. It is worth mentioning that some curves show deviation from theoretical values, which is associated with experimental error and the noise level of the experimental data. Therefore, it is evident that adding boron produces softening at high temperature conditions, which is similar with respect to the role played by other elements such as carbon in steel. Recently, many investigations have reported that carbon promotes a solid solution-softening effect in steel. Sherby [31] attributed the change in creep strength to the measured increase in self-diffusivity of iron with carbon content. Wray [32] and Hai [33] confirmed that there is a decrease in the hot flow stress when the carbon content increases. This behavior was attributed to a decrease of the work-hardening rate due to a relaxation of the austenite lattice. It has been found that flow stresses can be rationalized as a balance between work-hardening and work-softening processes. Figure 13 shows how the influence of boron content on the work-hardening rate is effective. From Figure 13, it is seen that the work-hardening rate decrease with increasing boron content at lower strain rates (0.1 and 1 s−1). The results at other temperatures and lower strain rates also resemble this trend. Thus, it is inferred that the softening effect exhibited by boron increases its self-diffusivity of iron and expands austenite lattice. In addition, some researchers explained this phenomenon on the basis of the non-equilibrium segregation, as an effect of mobile vacancy-solute atom complexes diffusing through a vacancy gradient towards vacancy sinks (this gradient can be generated via plastic deformation) [13,14,15].
Figure 12. Relationship between peak, critical stress and the logarithm of the strain rate (a) peak stress; (b) critical stress.
Crystals 05 00592 g012
Figure 13. Strain dependence of the work-hardening rate for the experimental steels at 900 °C for strain rates of 0.1 and 1 s−1.
Crystals 05 00592 g013
The variation of peak and critical strain with deformation temperatures and strain rates of the experimental steels is shown in Figure 14. Some curves show deviation from theoretical values, particularly in the case of critical strain. This is associated with experimental error and fitting error. As seen in the plot, peak and critical strain increase with increasing boron content at strain rate 0.1 s−1. Therefore, the addition of boron retards the onset of DRX. These obtained results are in agreement with previous research work [16,17,18]. Wang [34] attributed this phenomenon to the fact that boron segregation to austenite grain boundaries retards mobility and recrystallization kinetics during hot working, which retards dynamic recrystallization when solute molecules drag by boron located on austenite grain boundaries. Moreover, the initial austenite grain size has also been shown to have an effect on the DRX behavior. The relationship between critical strain (εc) and initial austenite grain size (d0) was found in the literature proposed by Barnett [35]. The relationship between critical strain (εc) and initial austenite grain size (d0) was proven where the following equation was given: εc = 2.2 × 10⁻⁴ ε ˙ 0.24 d00.43 exp(56500/RT). From this equation, critical strain is found to increase with increasing initial austenite grain size. In this case, as previously mentioned, initial austenite grain size increases with increasing boron content. It is established that, for fine grain size, the onset of DRX is promoted by the rise of the amount of available nucleation sites as the grain boundary area per unit volume is increased [36]. Therefore, the retarding onset of DRX is probably caused by the initial austenite grain size increase due to boron addition. However, it is imperative to note that peak and critical strain has a negligible change with increasing boron content at strain rate 1 s−1 and different temperatures except at 1100 °C. Such behavior is attributed to the faster deformation process that does not allow for additional boron to segregate at austenite grain boundaries. Additionally, the deformation energy per time unit and the amount of available nucleation sites increase by improving strain rate. The driving force is thus significantly enhanced and becomes the primary contributing factor for the occurrence of DRX.
Figure 14. Peak and critical strain versus temperature at 0.1 and 1 s−1.
Crystals 05 00592 g014

3. Experimental Section

Low carbon boron-treated steels were fabricated via vacuum induction melting and the ingots were hot rolled into a 12 mm thickness plate followed by air cooling. The chemical compositions of the three steels are listed in Table 4. Cylindrical specimens 15 mm high and 8 mm in diameter were machined from the plate, and the Gleeble-2000 thermo-mechanical simulator was used for compression testing and heat treatment. For heat treatment tests, the specimens were heated to temperatures (1150, 1100 and 1050 °C) held for 5 min, respectively, and were subsequently quenched in water immediately. In order to study the effect of boron content on hot deformation behavior, samples were austenitized to 1150 °C at a rate of 10 °C/s and held for 180 s. Subsequently, the samples were cooled to the deformation temperature at 10 °C/s and maintained for 30 s. Five different deformation temperatures (900, 950, 1000, 1050, and 1100 °C) and three strain rates (0.1, 1, and 10 s−1) were used in hot compression tests and the true strain achieved was 0.8.
Table 4. Chemical composition of the test steels (mass percent, %).
SteelsCSiMnSPAlBN
B10.180.1840.6190.0250.0160.051%0.0020.004
B20.180.1910.6260.0250.0160.049%0.0040.004
B30.180.1960.6260.0250.0160.049%0.0060.004
The microstructure of initial austenite grain was observed by using an optical microscope (OM) after being corroded in saturated picric acid solution. The austenite grains of 6 visual fields in every specimen were observed through the optical microscope. Each visual field was measured by the linear intercept method via image software, and the number of grains intercepted by straight lines long enough to yield at least 50 intercepts in total were counted. This ensured accuracy and utilized the mean chord length of austenite grain as a measure of its grain size. BN precipitates were observed by using scanning electron microscope (SEM) and analyzed by energy dispersive spectrometer (EDS).

4. Conclusions

(1) The initial austenite grain size of different boron content under different heating temperatures was analyzed. Results showed that the grain size in all the regions increases with an increase in the austenitization temperature, and that the austenite grain size of steel with higher boron content is larger than steel with lower boron content at each temperature. This trend can be attributed to the fact that the amount of fine AlN reduces because of the formation of BN.
(2) Increasing the boron content of boron-tread steel decreases the flow stress at lower strain rates due to the increase in self-diffusivity of iron and expansion of the austenite lattice with increasing boron content. At the same time, boron addition leads to higher flow stress at higher strain rates because of boron atoms hindering dislocation motion.
(3) The constitutive equations of hot deformation for both steels were developed. Results showed that increasing the boron content of steels has the trend to reduce the hot deformation activation energy.
(4) Increasing the boron content of boron-tread steel increases the peak and critical strain of dynamic recrystallization, indicating that boron addition can delay the onset of dynamic recrystallization.

Acknowledgments

The authors would like to acknowledge the financial support of the National Science Foundation of China (51374052), Basic Research of Key Laboratory of Education Department of Liaoning (LZ2014-022) and the Century Excellent Talent in University (NCET-11-0074).

Author Contributions

Yong-liang Gao performed the experimental work and wrote the manuscript, Xiang-xin Xue conceived and designed the study, He Yang analyzed the experiment data and assisted with the writing of the paper. All authors have read and approved the final manuscript.

Conflicts of Interest

The authors declare no conflict of interest.

References

  1. Abid, N.H.; Al-Rub, R.K.A.; Palazotto, A.N. Computational modeling of the effect of equiaxed heterogeneous microstructures on strength and ductility of dual phase steels. Comput. Mater. Sci. 2015, 103, 20–37. [Google Scholar] [CrossRef]
  2. Al-Rub, R.K.A.; Ettehad, M.; Palazotto, A.N. Microstructural modeling of dual phase steel using a higher-order gradient plasticity-damage model. Int. J. Solids Struct. 2015, 58, 178–189. [Google Scholar] [CrossRef]
  3. Eghbali, B.; Abdollah-zadeh, A. Influence of deformation temperature on the ferrite grain refinement in a low carbon Nb-Ti microalloyed steel. J. Mater. Process. Technol. 2006, 180, 44–48. [Google Scholar] [CrossRef]
  4. Jun, H.J.; Kang, J.S.; Seo, D.H.; Kang, K.B.; Park, C.G. Effects of deformation and boron on microstructure and continuous cooling transformation in low carbon HSLA steels. Mater. Sci. Eng. A 2006, 422, 157–162. [Google Scholar] [CrossRef]
  5. Han, F.; Wang, B.C.; Suh, D.W.; Wang, Z.C.; Lee, D.L.; Kim, S.J. Effect of Molybdenum and Chromium on Hardenability of Low-Carbon Boron-Added Steels. Met. Mater. Int. 2008, 14, 667–672. [Google Scholar] [CrossRef]
  6. Wu, B.P.; Li, L.H.; Wu, J.T.; Wang, Z.; Wang, Y.B.; Chen, X.F.; Dong, J.X.; Li, J.T. Effect of boron addition on the microstructure and stress-rupture properties of directionally solidified superalloys. Int. J. Miner. Metall. Mater. 2014, 21, 1120–1126. [Google Scholar] [CrossRef]
  7. Chapman, M.A.V.; Faulkner, R.G. Computer modelling of grain boundary segregation. Acta Metall. 1982, 31, 677–689. [Google Scholar] [CrossRef]
  8. Nishibata, T.; Kojima, N. Effect of quenching rate on hardness and microstructure of hot-stamped steel. J. Alloys Compd. 2013, 577, S549–S557. [Google Scholar] [CrossRef]
  9. Devaa, A.; Jha, B.K.; Mishra, N.S. Influence of boron on strain hardening behavior and ductility of low carbon hot rolled steel. Mater. Sci. Eng. A 2011, 528, 7375–7380. [Google Scholar] [CrossRef]
  10. Terzic, A.; Calcagnotto, M.; Guk, S.; Schulz, T.; Kawalla, R. Influence of Boron on transformation behavior during continuous cooling of low alloyed steels. Mater. Sci. Eng. A 2013, 584, 32–40. [Google Scholar] [CrossRef]
  11. Mun, D.J.; Shin, E.J.; Choi, Y.W.; Lee, J.S.; Koo, Y.M. Effects of cooling rate, austenitizing temperature and austenite deformation on the transformation behavior of high-strength boron steel. Mater. Sci. Eng. A 2012, 545, 214–224. [Google Scholar] [CrossRef]
  12. Shigesato, G.; Fujishiro, T.; Hara, T. Grain Boundary Segregation Behavior of Boron in Low-Alloy Steel. Metall. Mater. Trans. A 2014, 45, 1876–1882. [Google Scholar] [CrossRef]
  13. Mejía, I.; Jacuinde, A.B.; Maldonado, C.; Cabrera, J.M. Determination of the critical conditions for the initiation of dynamic recrystallization in boron microalloyed steels. Mater. Sci. Eng. A 2011, 528, 4133–4140. [Google Scholar] [CrossRef]
  14. Mejía, I.; López-Chipres, E.; Maldonado, C.; Bedolla-Jacuinde, A.; Cabrera, J.M. Modeling of the hot deformation behavior of boron microalloyed steels under uniaxial hot-compression conditions. Int. J. Mater. Res. 2008, 99, 1336–1345. [Google Scholar] [CrossRef]
  15. López-Chipres, E.; Mejía, I.; Maldonado, C.; Bedolla-Jacuinde, A.; El-Wahabi, M.; Cabrera, J.M. Hot flow behavior of boron microalloyed steels. Mater. Sci. Eng. A 2008, 480, 49–55. [Google Scholar] [CrossRef]
  16. Kim, S.I.; Choi, S.H.; Lee, Y. Influence of phosphorous and boron on dynamic recrystallization and microstructures of hot-rolled interstitial free steel. Mater. Sci. Eng. A 2005, 406, 125–133. [Google Scholar] [CrossRef]
  17. Banks, K.; Stumpf, W.; Tuling, A. Inconsistent flow stress in low carbon boron steels during finishing. Mater. Sci. Eng. A 2006, 421, 307–316. [Google Scholar] [CrossRef]
  18. Stumpf, W.; Banks, K. The hot working characteristics of a boron bearing and a conventional low carbon steel. Mater. Sci. Eng. A 2006, 418, 86–94. [Google Scholar] [CrossRef]
  19. Zhang, T.; Zhang, X.M.; Guo, Z.Y.; Wang, Y.Q.; Li, C.G.; Lan, L.Y. AlN Precipitates and Microstructure in Non-oriented Electrical Steels Produced by Twin-roll Casting Process. Acta Metall. Sin. 2013, 26, 483–488. [Google Scholar] [CrossRef]
  20. Liang, Y.J.; Che, Y.C. Thermodynamics Date of Inorganic Matter; Northeastern University Press: Shenyang, China, 1993; p. 449. [Google Scholar]
  21. Li, P.S.; Xiao, L.J.; Xie, Z. Thermodynamic Analysis of AlN and BN Competitive Precipitation in Low Carbon Steel. J. Iron Steel Res. 2009, 21, 16–18. [Google Scholar]
  22. Bao, H.S.; Fu, W.T.; Cheng, S.C.; Liu, Z.D.; Yang, G. An investigation on Boronnitride (BN) Compound in T122 Heat Resistant Steel. Iron Steel 2005, 40, 68–71. [Google Scholar]
  23. Chown, L.H.; Cornish, L.A. Investigation of hot ductility in Al-killed boron steels. Mater. Sci. Eng. A 2008, 494, 263–275. [Google Scholar] [CrossRef]
  24. Meysami, M.; Mousavi, S.A.A.A. Study on the behavior of medium carbon vanadium microalloyed steel by hot compression test. Mater. Sci. Eng. A 2011, 528, 3049–3055. [Google Scholar] [CrossRef]
  25. Wei, H.L.; Liu, G.Q.; Zhao, H.T.; Kang, R.M. Hot deformation behavior of two C-Mn-Si based and C-Mn-Al based microalloyed high-strength steels: A comparative study. Mater. Des. 2013, 50, 484–490. [Google Scholar] [CrossRef]
  26. Jahazi, M.; Jonas, J.J. The non-equilibrium segregation of boron on original and moving austenite grain boundaries. Mater. Sci. Eng. A 2002, 335, 49–61. [Google Scholar] [CrossRef]
  27. Stewart, G.R.; Jonas, J.J.; Montheillet, F. Kinetics and Critical Conditions for the Initiation of Dynamic Recrystallization in 304 Stainless Steel. ISIJ Int. 2004, 44, 1581–1589. [Google Scholar] [CrossRef]
  28. Poliak, E.I.; Jonas, J.J. A one-parameter approach to determining the critical conditions for the initiation of dynamic recrystallization. Acta Mater. 1996, 44, 127–136. [Google Scholar] [CrossRef]
  29. Poliak, E.I.; Jonas, J.J. Initiation of Dynamic Recrystallization in Constant Strain Rate Hot Deformation. ISIJ Int. 2003, 43, 684–691. [Google Scholar] [CrossRef]
  30. Poliak, E.I.; Jonas, J.J. Critical Strain for Dynamic Recrystallization in Variable Strain Rate Hot Deformation. ISIJ Int. 2003, 43, 692–700. [Google Scholar] [CrossRef]
  31. Sherby, O.D. Factors affecting the high temperature strength of polcyrystalline solids. Factors affecting the high temperature strength of polcyrystalline solids. Acta Metall. 1962, 10, 135–147. [Google Scholar] [CrossRef]
  32. Wray, P.J. Effect of carbon content on the plastic flow of plain carbon steels at elevated temperatures. Metall. Mater. Trans. A 1982, 13, 125–134. [Google Scholar] [CrossRef]
  33. Wei, H.L.; Liu, G.Q.; Zhao, H.T.; Zhang, M.H. Effect of carbon content on hot deformation behaviors of vanadium microalloyed steels. Mater. Sci. Eng. A 2014, 596, 112–120. [Google Scholar] [CrossRef]
  34. Wang, X.M.; He, X.L. Effect of Boron Addition on Structure and Properties of Low Carbon Bainitic Steels. ISIJ Int. 2003, 42, S38–S46. [Google Scholar] [CrossRef]
  35. Barnett, M.R.; Kelly, G.L.; Hodgson, P.D. Inferring dynamic recrystallization in ferrite using the kinetics of static recrystallization. Metall. Mater. Trans. A 2002, 33, 1893–1900. [Google Scholar] [CrossRef]
  36. Fernández, A.I.; Uranga, P.; López, B.; Rodriguez-Ibabe, J.M. Dynamic recrystallization behavior covering a wide austenite grain size range in Nb and Nb–Ti microalloyed steels. Mater. Sci. Eng. A. 2003, 361, 367–376. [Google Scholar] [CrossRef]

