Characterization of the Tumor-Microenvironment in Patient-Derived Cervix Xenografts (OCICx)

Abstract
:
1. Introduction
1.1. Cervical Cancer: Epidemiology and Clinical Challenges
1.2. Tumor Microenvironment
1.3. Patient-Derived Xenografts
2. Experimental Section
2.1. Patients and Tissue Samples
2.2. Establishing First-Passage Orthotopic Primary Xenograft
2.3. Tumor Microenvironment Analysis—Xenograft Processing
2.4. Statistical Methods
3. Results

| Nodal Status | Number of Patients | Xenograft Growth/(%) |
|---|---|---|
| Negative | 8 | 4/(50) |
| ≤8 mm | ||
| Equivocal | 6 | 2/(33) |
| >8 mm and equal to or <1 cm | ||
| Positive | 19 | 10/(52) |
| >1 cm | ||
| Total | 33 | 16 (48) |


4. Discussion
5. Conclusions
Acknowledgements
Conflict of Interest
References
- Hu, J.; Bianchi, F.; Ferguson, M.; Cesario, A.; Margaritora, S.; Granone, P.; Goldstraw, P.; Tetlow, M.; Ratcliffe, C.; Nicholson, A.G.; et al. Gene expression signature for angiogenic and nonangiogenic non-small-cell lung cancer. Oncogene 2005, 24, 1212–1219. [Google Scholar] [CrossRef]
- Zagouri, F.; Sergentanis, T.N.; Chrysikos, D.; Filipits, M.; Bartsch, R. Molecularly targeted therapies in cervical cancer. A systematic review. Gynecol. Oncol. 2012, 126, 291–303. [Google Scholar] [CrossRef]
- Anttila, A.; von Karsa, L.; Aasmaa, A.; Fender, M.; Patnick, J.; Rebolj, M.; Nicula, F.; Vass, L.; Valerianova, Z.; Voti, L.; et al. Cervical cancer screening policies and coverage in Europe. Eur. J. Cancer 2009, 45, 2649–2658. [Google Scholar]
- Parkin, D.M.; Bray, F.; Ferlay, J.; Pisani, P. Global cancer statistics, 2002. CA Cancer J. Clin. 2005, 55, 74–108. [Google Scholar] [CrossRef]
- Scholl, S.M.; Kenter, G.; Kurzeder, C.; Beuzeboc, P. Pathway profiling and rational trial design for studies in advanced stage cervical carcinoma: A review and a perspective. ISRN Oncol. 2011, 403098. [Google Scholar]
- Ferlay, J.; Shin, H.R.; Bray, F.; Forman, D.; Mathers, C.; Parkin, D.M. Estimates of worldwide burden of cancer in 2008: GLOBOCAN 2008. Int. J. Cancer 2010, 127, 2893–2917. [Google Scholar] [CrossRef]
- Gius, D.; Funk, M.C.; Chuang, E.Y.; Feng, S.; Huettner, P.C.; Nguyen, L.; Bradbury, C.M.; Mishra, M.; Gao, S.; Buttin, B.M.; et al. Profiling microdissected epithelium and stroma to model genomic signatures for cervical carcinogenesis accommodating for covariates. Cancer Res. 2007, 67, 7113–7123. [Google Scholar]
- Cuzick, J.; Arbyn, M.; Sankaranarayanan, R.; Tsu, V.; Ronco, G.; Mayrand, M.H.; Dillner, J.; Meijer, C.J. Overview of human papillomavirus-based and other novel options for cervical cancer screening in developed and developing countries. Vaccine 2008, 26, K29–K41. [Google Scholar] [CrossRef]
- Tiltman, A.J. The pathology of cervical tumours. Best Pract. Res. Clin. Obstet. Gynaecol. 2005, 19, 485–500. [Google Scholar] [CrossRef]
- Fyles, A.W.; Milosevic, M.; Wong, R.; Kavanagh, M.C.; Pintilie, M.; Sun, A.; Chapman, W.; Levin, W.; Manchul, L.; Keane, T.J.; et al. Oxygenation predicts radiation response and survival in patients with cervix cancer. Radiother. Oncol. 1998, 48, 149–156. [Google Scholar] [CrossRef]
- Fyles, A.; Milosevic, M.; Hedley, D.; Pintilie, M.; Levin, W.; Manchul, L.; Hill, R.P. Tumor hypoxia has independent predictor impact only in patients with node-negative cervix cancer. J. Clin. Oncol. 2002, 20, 680–687. [Google Scholar] [CrossRef]
- Fyles, A.; Keane, T.J.; Barton, M.; Simm, J. The effect of treatment duration in the local control of cervix cancer. Radiother. Oncol. 1992, 25, 273–279. [Google Scholar] [CrossRef]
- Lu, K.H.; Burke, T.W. Early cervical cancer. Curr. Treat. Options Oncol. 2000, 1, 147–155. [Google Scholar] [CrossRef]
- Morris, M.; Eifel, P.J.; Lu, J.; Grigsby, P.W.; Levenback, C.; Stevens, R.E.; Rotman, M.; Gershenson, D.M.; Mutch, D.G. Pelvic radiation with concurrent chemotherapy compared with pelvic and para-aortic radiation for high-risk cervical cancer. New Engl. J. Med. 1999, 340, 1137–1143. [Google Scholar]
- Rose, P.G. Chemoradiotherapy for cervical cancer. Eur. J. Cancer 2002, 38, 270–278. [Google Scholar] [CrossRef]
- Tewari, K.S.; Monk, B.J. Recent achievements and future developments in advanced and recurrent cervical cancer: Trials of the Gynecologic Oncology Group. Semin. Oncol. 2009, 36, 170–180. [Google Scholar] [CrossRef]
- Kesic, V. Management of cervical cancer. Eur. J. Surg. Oncol. 2006, 32, 832–837. [Google Scholar] [CrossRef]
- Ungefroren, H.; Sebens, S.; Seidl, D.; Lehnert, H.; Hass, R. Interaction of tumor cells with the microenvironment. Cell Commun. Signal. 2011, 9, 18. [Google Scholar] [CrossRef]
- Lunt, S.J.; Kalliomaki, T.M.; Brown, A.; Yang, V.X.; Milosevic, M.; Hill, R.P. Interstitial fluid pressure, vascularity and metastasis in ectopic, orthotopic and spontaneous tumours. BMC Cancer 2008, 8, 2. [Google Scholar] [CrossRef]
- Sleeman, J.P.; Christofori, G.; Fodde, R.; Collard, J.G.; Berx, G.; Decraene, C.; Ruegg, C. Concepts of metastasis in flux: The stromal progression model. Semin. Cancer Biol. 2012, 22, 174–186. [Google Scholar] [CrossRef]
- Li, H.; Fan, X.; Houghton, J. Tumor microenvironment: The role of the tumor stroma in cancer. J. Cell. Biochem. 2007, 101, 805–815. [Google Scholar] [CrossRef]
- Noman, M.Z.; Messai, Y.; Carre, T.; Akalay, I.; Meron, M.; Janji, B.; Hasmim, M.; Chouaib, S. Microenvironmental hypoxia orchestrating the cell stroma cross talk, tumor progression and antitumor response. Crit. Rev. Immunol. 2011, 31, 357–377. [Google Scholar] [CrossRef]
- Plzak, J.; Lacina, L.; Chovanec, M.; Dvorankova, B.; Szabo, P.; Cada, Z.; Smetana, K., Jr. Epithelial-stromal interaction in squamous cell epithelium-derived tumors: An important new player in the control of tumor biological properties. Anticancer Res. 2010, 30, 455–462. [Google Scholar]
- Mueller, M.M.; Fusenig, N.E. Friends or foes—Bipolar effects of the tumour stroma in cancer. Nat. Rev. Cancer 2004, 4, 839–849. [Google Scholar] [CrossRef]
- Nordsmark, M.; Loncaster, J.; Aquino-Parsons, C.; Chou, S.C.; Ladekarl, M.; Havsteen, H.; Lindegaard, J.C.; Davidson, S.E.; Varia, M.; West, C.; et al. Measurements of hypoxia using pimonidazole and polarographic oxygen-sensitive electrodes in human cervix carcinomas. Radiother. Oncol. 2003, 67, 35–44. [Google Scholar] [CrossRef]
- Hockel, M.; Schlenger, K.; Hockel, S.; Vaupel, P. Hypoxic cervical cancers with low apoptotic index are highly aggressive. Cancer Res. 1999, 59, 4525–4528. [Google Scholar]
- Fyles, A.; Milosevic, M.; Pintilie, M.; Syed, A.; Levin, W.; Manchul, L.; Hill, R.P. Long-term performance of interstial fluid pressure and hypoxia as prognostic factors in cervix cancer. Radiother. Oncol. 2006, 80, 132–137. [Google Scholar] [CrossRef]
- Milosevic, M.; Fyles, A.; Hedley, D.; Pintilie, M.; Levin, W.; Manchul, L.; Hill, R. Interstitial fluid pressure predicts survival in patients with cervix cancer independent of clinical prognostic factors and tumor oxygen measurements. Cancer Res. 2001, 61, 6400–6405. [Google Scholar]
- Ellingsen, C.; Hompland, T.; Mathiesen, B.; Rofstad, E.K. Microenvironment-associated lymph node metastasis of human cervical carcinoma xenografts. Acta Oncol. 2012, 51, 465–472. [Google Scholar] [CrossRef]
- Bernhard, E.J. Interventions that induce modifications in the tumor microenvironment. Cancer Radiother. 2011, 15, 376–382. [Google Scholar] [CrossRef]
- Milosevic, M.; Fyles, A.; Hedley, D.; Hill, R. The human tumor microenvironment: Invasive (needle) measurement of oxygen and interstitial fluid pressure. Semin. Radiat. Oncol. 2004, 14, 249–258. [Google Scholar] [CrossRef]
- Jain, R.K.; Tong, R.T.; Munn, L.L. Effect of vascular normalization by antiangiogenic therapy on interstitial hypertension, peritumor edema, and lymphatic metastasis: Insights from a mathematical model. Cancer Res. 2007, 67, 2729–2735. [Google Scholar] [CrossRef]
- Rofstad, E.K.; Ruud, E.B.; Mathiesen, B.; Galappathi, K. Associations between radiocurability and interstitial fluid pressure in human tumor xenografts without hypoxic tissue. Clin. Cancer Res. 2010, 16, 936–945. [Google Scholar] [CrossRef]
- John, T.; Kohler, D.; Pintilie, M.; Yanagawa, N.; Pham, N.A.; Li, M.; Panchal, D.; Hui, F.; Meng, F.; Shepherd, F.A.; et al. The ability to form primary tumor xenografts is predictive of increased risk of disease recurrence in early-stage non-small cell lung cancer. Clin. Cancer Res. 2011, 17, 134–141. [Google Scholar]
- Jin, K.; Teng, L.; Shen, Y.; He, K.; Xu, Z.; Li, G. Patient-derived human tumour tissue xenografts in immunodeficient mice: A systematic review. Clin. Transl. Oncol. 2010, 12, 473–480. [Google Scholar] [CrossRef]
- Frapolli, R.; Tamborini, E.; Virdis, E.; Bello, E.; Tarantino, E.; Marchini, S.; Grosso, F.; Sanfilippo, R.; Gronchi, A.; Tercero, J.C.; et al. Novel models of myxoid liposarcoma xenografts mimicking the biological and pharmacologic features of human tumors. Clin. Cancer Res. 2010, 16, 4958–4967. [Google Scholar] [CrossRef]
- Priolo, C.; Agostini, M.; Vena, N.; Ligon, A.H.; Fiorentino, M.; Shin, E.; Farsetti, A.; Pontecorvi, A.; Sicinska, E.; Loda, M. Establishment and genomic characterization of mouse xenografts of human primary prostate tumors. Am. J. Pathol. 2010, 176, 1901–1913. [Google Scholar] [CrossRef]
- Mayordomo, E.; Machado, I.; Giner, F.; Kresse, S.H.; Myklebost, O.; Carda, C.; Navarro, S.; Llombart-Bosch, A. A tissue microarray study of osteosarcoma: Histopathologic and immunohistochemical validation of xenotransplanted tumors as preclinical models. Appl. Immunohistochem. Mol. Morphol. 2010, 18, 453–461. [Google Scholar]
- Grisanzio, C.; Seeley, A.; Chang, M.; Collins, M.; di Napoli, A.; Cheng, S.C.; Percy, A.; Beroukhim, R.; Signoretti, S. Orthotopic xenografts of RCC retain histological, immunophenotypic and genetic features of tumours in patients. J. Pathol. 2011, 225, 212–221. [Google Scholar] [CrossRef]
- Nemati, F.; Sastre-Garau, X.; Laurent, C.; Couturier, J.; Mariani, P.; Desjardins, L.; Piperno-Neumann, S.; Lantz, O.; Asselain, B.; Plancher, C.; et al. Establishment and characterization of a panel of human uveal melanoma xenografts derived from primary and/or metastatic tumors. Clin. Cancer Res. 2010, 16, 2352–2362. [Google Scholar]
- Wang, J.; Daphu, I.; Pedersen, P.H.; Miletic, H.; Hovland, R.; Mork, S.; Bjerkvig, R.; Tiron, C.; McCormack, E.; Micklem, D.; et al. A novel brain metastases model developed in immunodeficient rats closely mimics the growth of metastatic brain tumours in patients. Neuropathol. Appl. Neurobiol. 2011, 37, 189–205. [Google Scholar] [CrossRef]
- Cairns, R.A.; Hill, R.P. Acute hypoxia enhances spontaneous lymph node metastasis in an orthotopic murine model of human cervical carcinoma. Cancer Res. 2004, 64, 2054–2061. [Google Scholar] [CrossRef]
- Chaudary, N.; Hedley, D.W.; Hill, R.P. Orthotopic xenograft model of cervical cancer for studying microenvironmental effects on metastasis formation and response to drug treatment. Curr. Protoc. Pharmacol. 2011. [Google Scholar] [CrossRef]
- Evans, S.M.; Hahn, S.M.; Magarelli, D.P.; Koch, C.J. Hypoxic heterogeneity in human tumors: EF5 binding, vasculature, necrosis, and proliferation. Am. J. Clin. Oncol. 2001, 24, 467–472. [Google Scholar] [CrossRef]
- Mayer, A.; Hockel, M.; Vaupel, P. Endogenous hypoxia markers in locally advanced cancers of the uterine cervix: Reality or wishful thinking? Strahlenther. Onkol. 2006, 182, 501–510. [Google Scholar] [CrossRef]
- Hedley, D.; Pintilie, M.; Woo, J.; Morrison, A.; Birle, D.; Fyles, A.; Milosevic, M.; Hill, R. Carbonic anhydrase IX expression, hypoxia, and prognosis in patients with uterine cervical carcinomas. Clin. Cancer Res. 2003, 9, 5666–5674. [Google Scholar]
- Ludwig, J.A.; Weinstein, J.N. Biomarkers in cancer staging, prognosis and treatment selection. Nat. Rev. 2005, 5, 845–856. [Google Scholar] [CrossRef]
- Iakovlev, V.V.; Pintilie, M.; Morrison, A.; Fyles, A.W.; Hill, R.P.; Hedley, D.W. Effect of distributional heterogeneity on the analysis of tumor hypoxia based on carbonic anhydrase IX. Lab. Invest. 2007, 87, 1206–1217. [Google Scholar] [CrossRef]
- Loukopoulos, P.; Kanetaka, K.; Takamura, M.; Shibata, T.; Sakamoto, M.; Hirohashi, S. Orthotopic transplantation models of pancreatic adenocarcinoma derived from cell lines and primary tumors and displaying varying metastatic activity. Pancreas 2004, 29, 193–203. [Google Scholar] [CrossRef]
- Cutz, J.C.; Guan, J.; Bayani, J.; Yoshimoto, M.; Xue, H.; Sutcliffe, M.; English, J.; Flint, J.; LeRiche, J.; Yee, J.; et al. Establishment in severe combined immunodeficiency mice of subrenal capsule xenografts and transplantable tumor lines from a variety of primary human lung cancers: Potential models for studying tumor progression-related changes. Clin. Cancer Res. 2006, 12, 4043–4054. [Google Scholar]
- Tentler, J.J.; Tan, A.C.; Weekes, C.D.; Jimeno, A.; Leong, S.; Pitts, T.M.; Arcaroli, J.J.; Messersmith, W.A.; Eckhardt, S.G. Patient-derived tumour xenografts as models for oncology drug development. Nat. Rev. Clin. Oncol. 2012, 9, 338–350. [Google Scholar] [CrossRef]
- Lee, C.H.; Xue, H.; Sutcliffe, M.; Gout, P.W.; Huntsman, D.G.; Miller, D.M.; Gilks, C.B.; Wang, Y.Z. Establishment of subrenal capsule xenografts of primary human ovarian tumors in SCID mice: potential models. Gynecol. Oncol. 2005, 96, 48–55. [Google Scholar] [CrossRef]
- Rubio-Viqueira, B.; Jimeno, A.; Cusatis, G.; Zhang, X.; Iacobuzio-Donahue, C.; Karikari, C.; Shi, C.; Danenberg, K.; Danenberg, P.V.; Kuramochi, H.; et al. An in vivo platform for translational drug development in pancreatic cancer. Clin. Cancer Res. 2006, 12, 4652–4661. [Google Scholar]
- DeRose, Y.S.; Wang, G.; Lin, Y.C.; Bernard, P.S.; Buys, S.S.; Ebbert, M.T.; Factor, R.; Matsen, C.; Milash, B.A.; Nelson, E.; et al. Tumor grafts derived from women with breast cancer authentically reflect tumor pathology, growth, metastasis and disease outcomes. Nat. Med. 2011, 17, 1514–1520. [Google Scholar]
- Jin, K.; Li, G.; Cui, B.; Zhang, J.; Lan, H.; Han, N.; Xie, B.; Cao, F.; He, K.; Wang, H.; et al. Assessment of a novel VEGF targeted agent using patient-derived tumor tissue xenograft models of colon carcinoma with lymphatic and hepatic metastases. PloS One 2011, 6, e28384. [Google Scholar]
- Pocard, M.; Muleris, M.; Hamelin, R.; Salmon, R.J.; Dutrillaux, B.; Poupon, M.F. Growth dependency of human colon cancer xenograft on organ environment is related with their original clinical stage. Anticancer Res. 1998, 18, 2743–2747. [Google Scholar]
- Chang, Q.; Jurisica, I.; Do, T.; Hedley, D.W. Hypoxia predicts aggressive growth and spontaneous metastasis formation from orthotopically grown primary xenografts of human pancreatic cancer. Cancer Res. 2011, 71, 3110–3120. [Google Scholar] [CrossRef]
- Wilson, W.R.; Hay, M.P. Targeting hypoxia in cancer therapy. Nat. Rev. 2011, 11, 393–410. [Google Scholar] [CrossRef]
Supplementary Materials
| OCICx xenografts | ||||||||||||||||||
|---|---|---|---|---|---|---|---|---|---|---|---|---|---|---|---|---|---|---|
| Biopsy | 1 | 3 | 8 | 11 | 13 | 15 | 16 | 18 | 20 | 21 | 22 | 23 | 26 | 28 | 29 | 30 | ||
| Passage | IIB; SCC | IIA; SCC | IIB; AD | IB; SCC | IIA; AD | IIA; AD | IIIB; SCC | IIB; SCC | IIIB; SCC | IIIB; SCC | IIB; * other | IIB; SCC | IIB; clear cell | IIB; SCC | IB; SCC | IIB; SCC | ||
| 1 | 2 | 6 | 2 | 1 | 2 | 1 | 5 | 3 | 2 | 3 | 3 | 2 | 4 | 1 | 4 | 1 | ||
| 2 | 8 | 11 | 6 | 2 | 2 | 1 | 12 | 2 | 3 | 5 | 2 | 3 | 1 | 4 | 3 | NA | ||
| 3 | 21 | 9 | 11 | 3 | 3 | 2 | 12 | 4 | 7 | 4 | 4 | 4 | NA | NA | NA | NA | ||
| 4 | 25 | 13 | 8 | 4 | 1 | 4 | 12 | 6 | 7 | 5 | 1 | 3 | NA | NA | NA | NA | ||
| 5 | 14 | 4 | 7 | 4 | 2 | 5 | 14 | 7 | 3 | 7 | 3 | 3 | NA | NA | NA | NA | ||
| Tumor type | Engraftment site | Take rate % | References |
|---|---|---|---|
| Lung | subcutaneous | 40 | John et al. [34] |
| Breast | mammary fat pad | 37 | DeRose et al. [54] |
| Ovary | subrenal capsule | 95 | Lee et al. [52] |
| Pancreas | subcutaneous | 80 | Rubio-Viqueira et al. [53] |
| Prostate | subrenal capsule | 56 | Priolo et al. [37] |
| Colon | subcutaneous | 60 | Jin et al. [55] |
| Renal | kidney capsule | 95 | Grisanzio et al. [39] |
| Osteosarcoma | subcutaneous | 20 | Mayordomo et al. [38] |
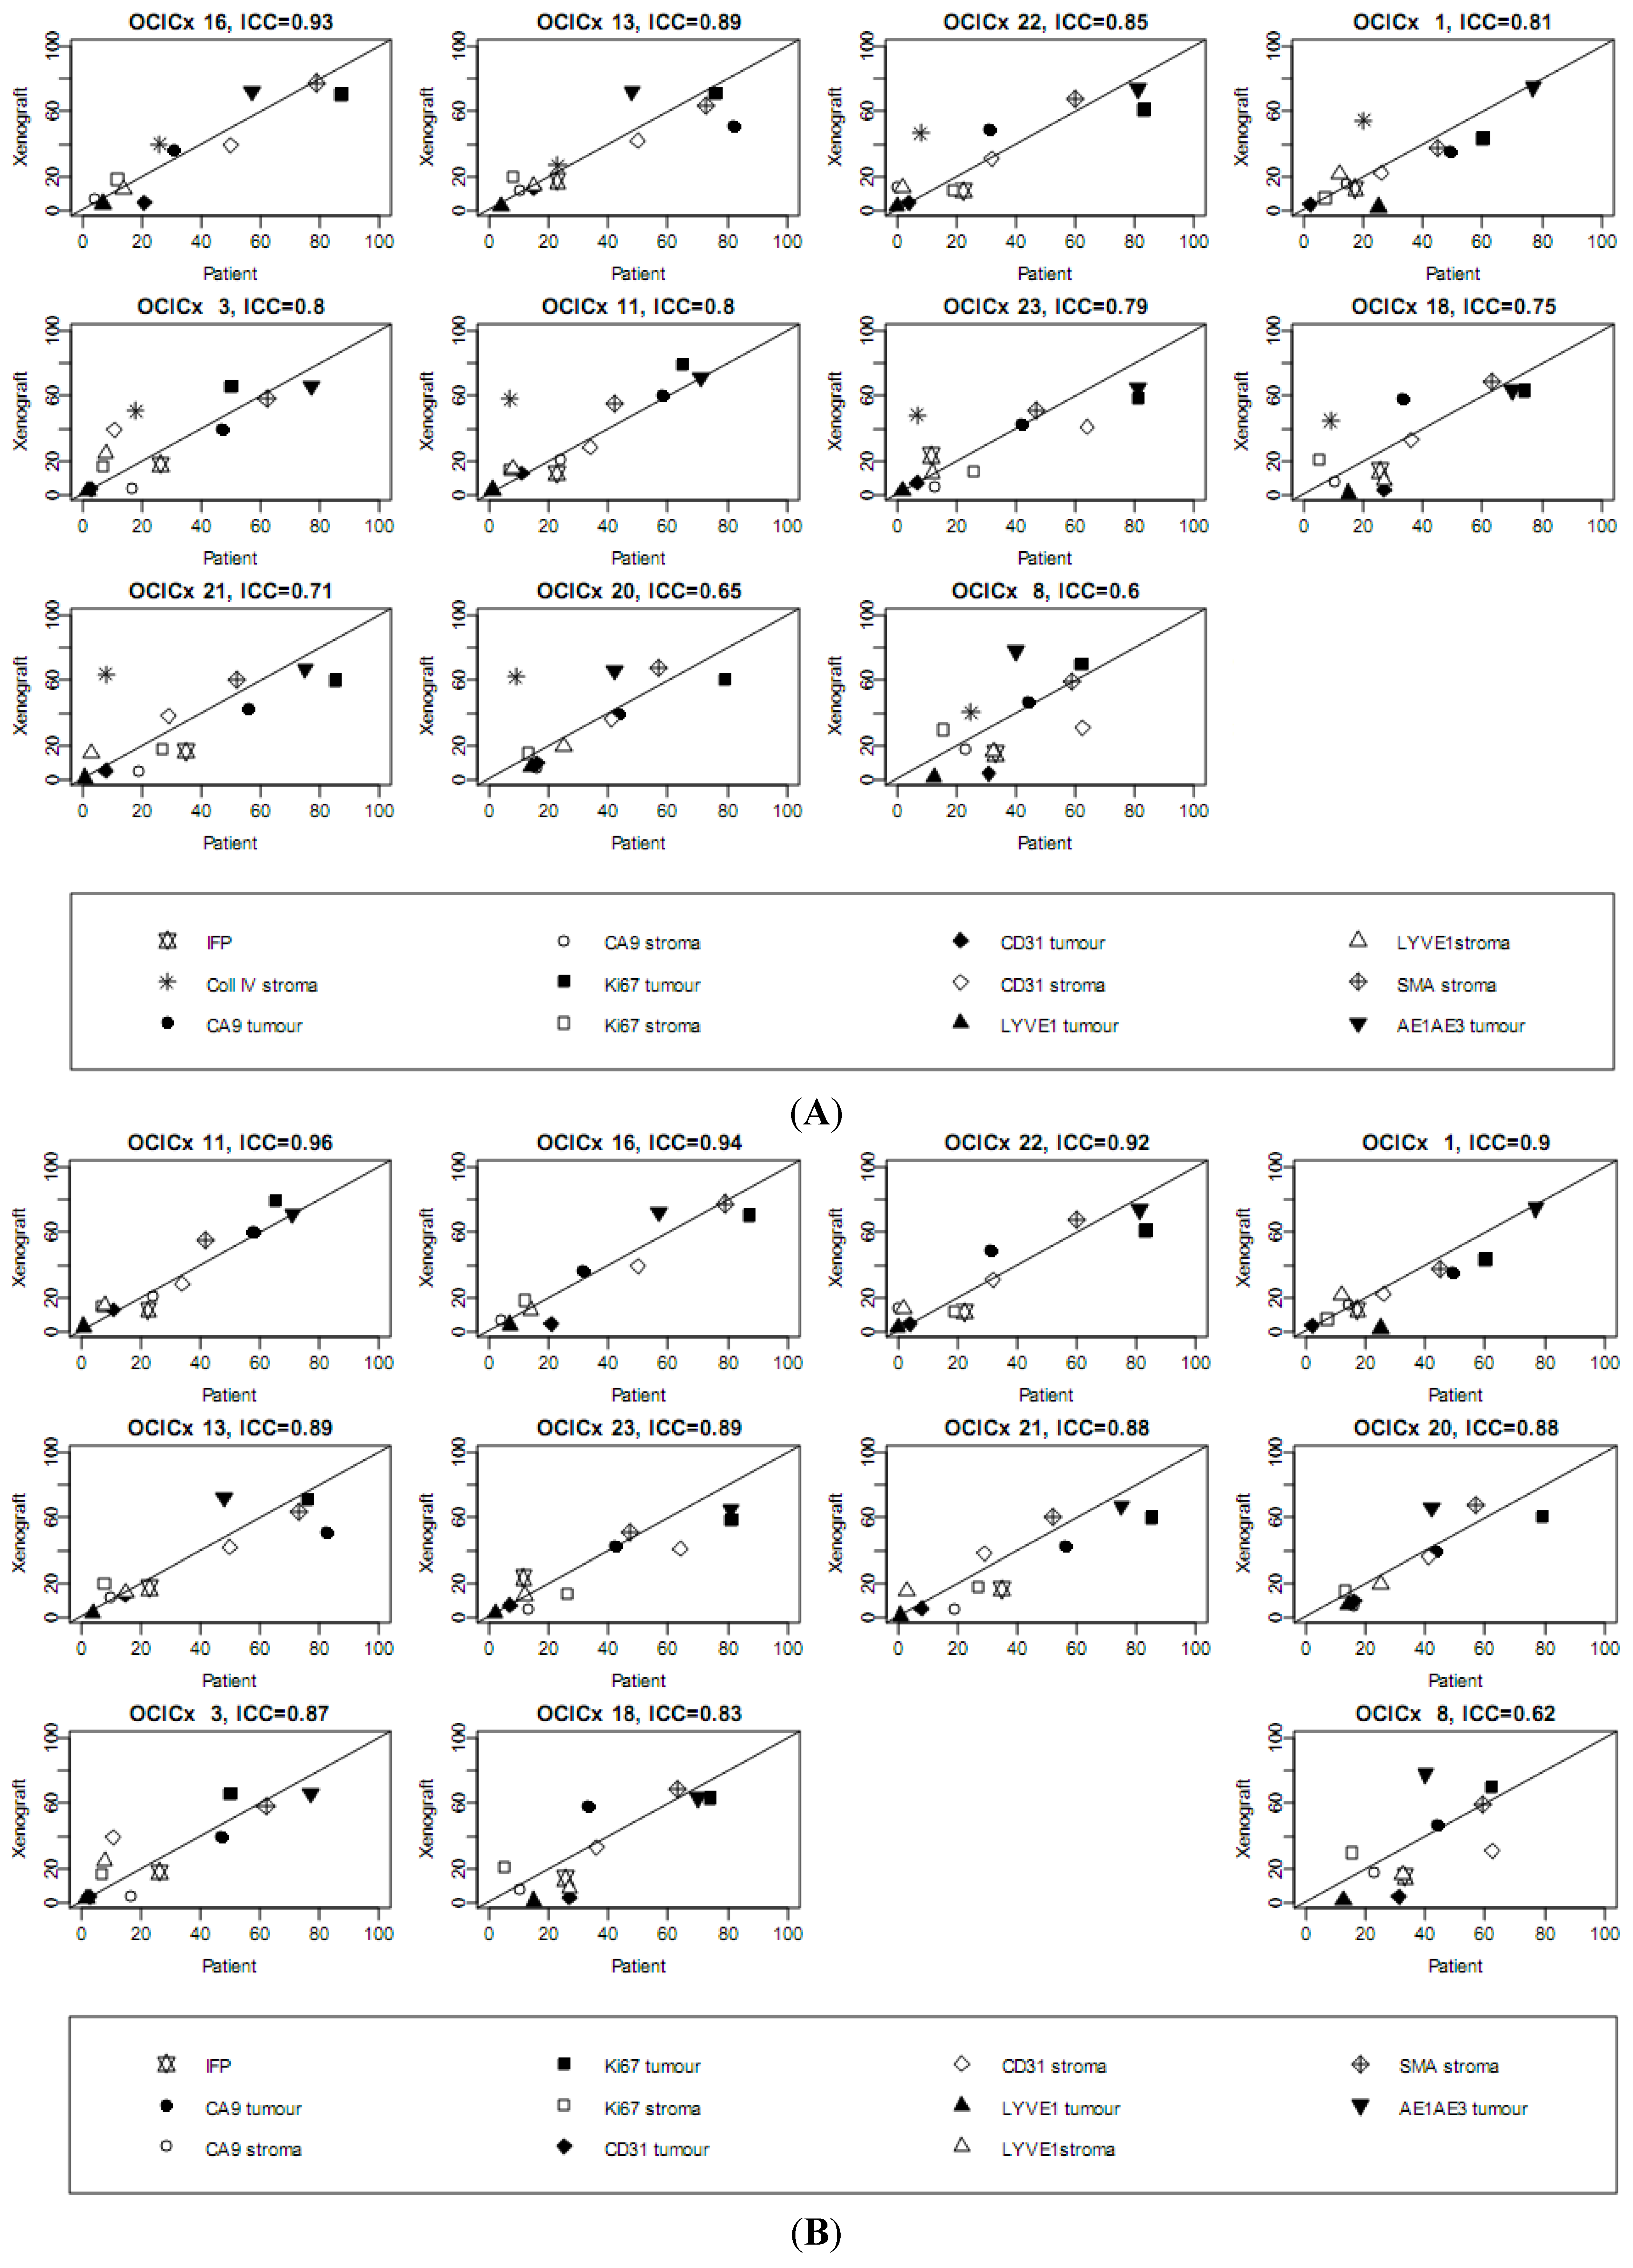
| Marker | IFP | CollIV stroma | CA9 stroma | CD31 stroma | Ki67 stroma | LYVE1 stroma | SMA stroma | |||||||
|---|---|---|---|---|---|---|---|---|---|---|---|---|---|---|
| OCICx | Pt | Xeno | Pt | Xeno | Pt | Xeno | Pt | Xeno | Pt | Xeno | Pt | Xeno | Pt | Xeno |
| 1 | 17.3 | 13.3 (10.9–15.6) | 20 | 54.7 (52.9–56.4) | 14 | 15.3 (13.5–17.1) | 26 | 24.3 (22.7–25.9) | 7 | 7 (4.6–9.3) | 12.0 | 24.8 (21.6–28.1) | 45.0 | 37.8 (36.7–38.9) |
| 3 | 26.5 | 16.1 (12.5–19.6) | 18 | 51 (43–59) | 17 | 3.7 (2.6–4.8) | 11 | 41.7 (37.9–45.5) | 7 | 16.4 (14.9–17.9) | 8.0 | 24.2 (22.2–26.3) | 62.0 | 58.5 (50.9–66.1) |
| 8 | 33.2 | 14 (9.4–18.7) | 25 | 40.8 (38.1–43.4) | 23 | 17.6 (14.5–20.8) | 62.5 | 32.5 (27.5–37.5) | 16 | 30.4 (18.6–42.2) | 32.5 | 13.6 (7.5–19.8) | 59.0 | 59.2 (56.4–62.1) |
| 11 | 22.7 | 12.9 (7.4–18.4) | 7 | 58 (46.1–69.9) | 24 | 21 (6.2–35.8) | 34 | 28.7 (24.7–32.6) | 7 | 15.3 (12.5–18.2) | 8.0 | 16 (11.1–20.9) | 42.0 | 55.7 (49.4–61.9) |
| 13 | 23 | 17.7 (14.3–21) | 23 | 27.3 (13–41.7) | 10 | 11.7 (11–12.3) | 50 | 42.3 (33.3–51.4) | 8 | 20.3 (11.3–29.4) | 15.0 | 15 (12.7–17.3) | 73.0 | 64 (56.6–71.4) |
| 15 | NA | 9 (7.6–10.4) | 27 | 63 (59.1–66.9) | 0 | 12.5 (7.6–17.4) | 54 | 30 (16.3–43.7) | 3 | 13.5 (12.5–14.5) | 16.0 | 10 (10–10) | 59.0 | 53 (27.5–78.5) |
| 16 | NA | 15.5 (13.1–17.8) | 26 | 40.2 (31–49.5) | 4 | 6.4 (4.2–8.6) | 50 | 39.6 (37.1–42) | 12 | 18.5 (15.8–21.3) | 14.0 | 12.8 (9.9–15.8) | 79.0 | 77.5 (71.9–83.1) |
| 18 | 25.5 | 14.5 (10.2–18.8) | 9 | 45 (29.5–60.5) | 10 | 8 (−0.9 to 16.9) | 36 | 33.2 (28.5–38) | 5 | 21 (13.2–28.8) | 27.0 | 8.2 (3–13.5) | 63.0 | 68.5 (62.9–74.1) |
| 20 | NA | 19.5 (16.3–22.7) | 9 | 62.3 (60–64.5) | 16 | 6 (0.6–11.4) | 41 | 37.8 (32.4–43.1) | 13 | 16.1 (11.6–20.6) | 25.0 | 19 (15.4–22.6) | 57.0 | 67.5 (61.9–73.1) |
| 21 | 34.9 | 17.8 (15.3–20.3) | 8 | 61 (55.8–66.2) | 19 | 6.7 (3.1–10.2) | 29 | 35 (26.2–43.8) | 27 | 19.8 (13–26.7) | 3.0 | 15.8 (13.1–18.6) | 52.0 | 60.2 (56.6–63.9) |
| 22 | 22.4 | 11.8 (9.9–13.6) | 8 | 46.8 (41–52.5) | 0 | 13.8 (9.1–18.4) | 32 | 31.2 (26.6–35.9) | 19 | 12.2 (10.4–14.1) | 2.0 | 14 (9.2–18.8) | 60.0 | 68 (64.5–71.5) |
| 23 | 11.6 | 23.9 (13.5–34.4) | 7 | 48.3 (39.5–57) | 13 | 5.3 (1.7–8.8) | 64 | 41.2 (34.8–47.7) | 26 | 13.8 (9.1–18.4) | 12.0 | 13.2 (8.8–17.7) | 47.0 | 51.2 (42–60.5) |
| (A) | ||||||||||||||
| Marker | CA9 tumor | CD31 tumor | Ki67 tumor | LYVE1 tumor | AE1AE3 tumor | |||||||||
| OCICx | Pt | Xeno | Pt | Xeno | Pt | Xeno | Pt | Xeno | Pt | Xeno | ||||
| 1 | 49 | 34.8 (32.2–37.3) | 2 | 3.4 (2.8–4) | 60 | 43.5 (41–46.1) | 25 | 1.9 (1.1–2.6) | 77 | 74.7 (74.1–75.2) | ||||
| 3 | 47 | 39.8 (36.1–43.6) | 3 | 3.9 (2.5–5.4) | 50 | 65.2 (62.3–68) | 2 | 2.2 (1.6–2.9) | 77 | 66.2 (63.3–69.2) | ||||
| 8 | 44 | 47.6 (40.5–54.8) | 31 | 3.4 (2.4–4.4) | 62 | 71.5 (63.5–79.5) | 13 | 1.1 (0.7–1.4) | 40 | 78 (74.1–81.9) | ||||
| 11 | 58 | 60.3 (55.8–64.9) | 11 | 13 (−1.4 to 27.4) | 65 | 79 (75.6–82.4) | 1 | 2.7 (2–3.3) | 71 | 71.3 (62.7–80) | ||||
| 13 | 82 | 51.7 (43–60.3) | 15 | 13.3 (7.8–18.9) | 76 | 71 (61.1–80.9) | 4 | 2 (−1 to 5) | 48 | 72 (60.5–83.5) | ||||
| 15 | 50 | 48.5 (41.6–55.4) | 32 | 9.5 (8.5–10.5) | 57 | 73.5 (72.5–74.5) | 4 | 1 (1–1) | 22 | 74 (68.1–79.9) | ||||
| 16 | 31 | 36.5 (31.8–41.2) | 21 | 4.5 (2.8–6.2) | 87 | 70.5 (65.5–75.4) | 7 | 3.8 (2–5.5) | 57 | 72 (68.1–75.9) | ||||
| 18 | 33 | 58.5 (52.6–64.4) | 27 | 2.8 (1.1–4.4) | 74 | 63 (50.3–75.7) | 15 | 0.8 (−0.2 to 1.7) | 70 | 63.3 (56.1–70.6) | ||||
| 20 | 43 | 39 (28.8–49.2) | 16 | 8.8 (3.8–13.7) | 79 | 62.8 (54–71.5) | 14 | 7.8 (5.5–10) | 42 | 66 (63.2–68.8) | ||||
| 21 | 56 | 48.7 (38.2–59.1) | 8 | 4.2 (2.5–5.8) | 85 | 62.7 (56.5–68.8) | 1 | 1.2 (0–2.3) | 75 | 66.8 (60–73.5) | ||||
| 22 | 31 | 48.8 (36.5–61) | 4 | 4.2 (3.3–5.2) | 83 | 61 (46.7–75.3) | 0 | 2 (0.6–3.4) | 81 | 73.8 (64.1–83.4) | ||||
| 23 | 42 | 43.2 (35.2–51.3) | 7 | 7 (3.5–10.5) | 81 | 58.2 (51.3–65.2) | 2 | 2.2 (0.1–4.4) | 81 | 65 (59.5–70.5) | ||||
| (B) | ||||||||||||||

© 2012 by the authors; licensee MDPI, Basel, Switzerland. This article is an open access article distributed under the terms and conditions of the Creative Commons Attribution license (http://creativecommons.org/licenses/by/3.0/).
Share and Cite
Chaudary, N.; Pintilie, M.; Schwock, J.; Dhani, N.; Clarke, B.; Milosevic, M.; Fyles, A.; Hill, R.P. Characterization of the Tumor-Microenvironment in Patient-Derived Cervix Xenografts (OCICx). Cancers 2012, 4, 821-845. https://doi.org/10.3390/cancers4030821
Chaudary N, Pintilie M, Schwock J, Dhani N, Clarke B, Milosevic M, Fyles A, Hill RP. Characterization of the Tumor-Microenvironment in Patient-Derived Cervix Xenografts (OCICx). Cancers. 2012; 4(3):821-845. https://doi.org/10.3390/cancers4030821
Chicago/Turabian StyleChaudary, Naz, Melania Pintilie, Joerg Schwock, Neesha Dhani, Blaise Clarke, Michael Milosevic, Anthony Fyles, and Richard P. Hill. 2012. "Characterization of the Tumor-Microenvironment in Patient-Derived Cervix Xenografts (OCICx)" Cancers 4, no. 3: 821-845. https://doi.org/10.3390/cancers4030821
APA StyleChaudary, N., Pintilie, M., Schwock, J., Dhani, N., Clarke, B., Milosevic, M., Fyles, A., & Hill, R. P. (2012). Characterization of the Tumor-Microenvironment in Patient-Derived Cervix Xenografts (OCICx). Cancers, 4(3), 821-845. https://doi.org/10.3390/cancers4030821