
Deep Learning Methods in Medical Image-Based Hepatocellular Carcinoma Diagnosis: A Systematic Review and Meta-Analysis
Abstract
:Simple Summary
Abstract
1. Introduction
2. Methods
2.1. Protocol Registration and Study Design
2.2. Search Strategy and Eligibility Criteria
2.3. Data Extraction
2.4. Study Quality Assessment
2.5. Statistical Analysis
3. Result
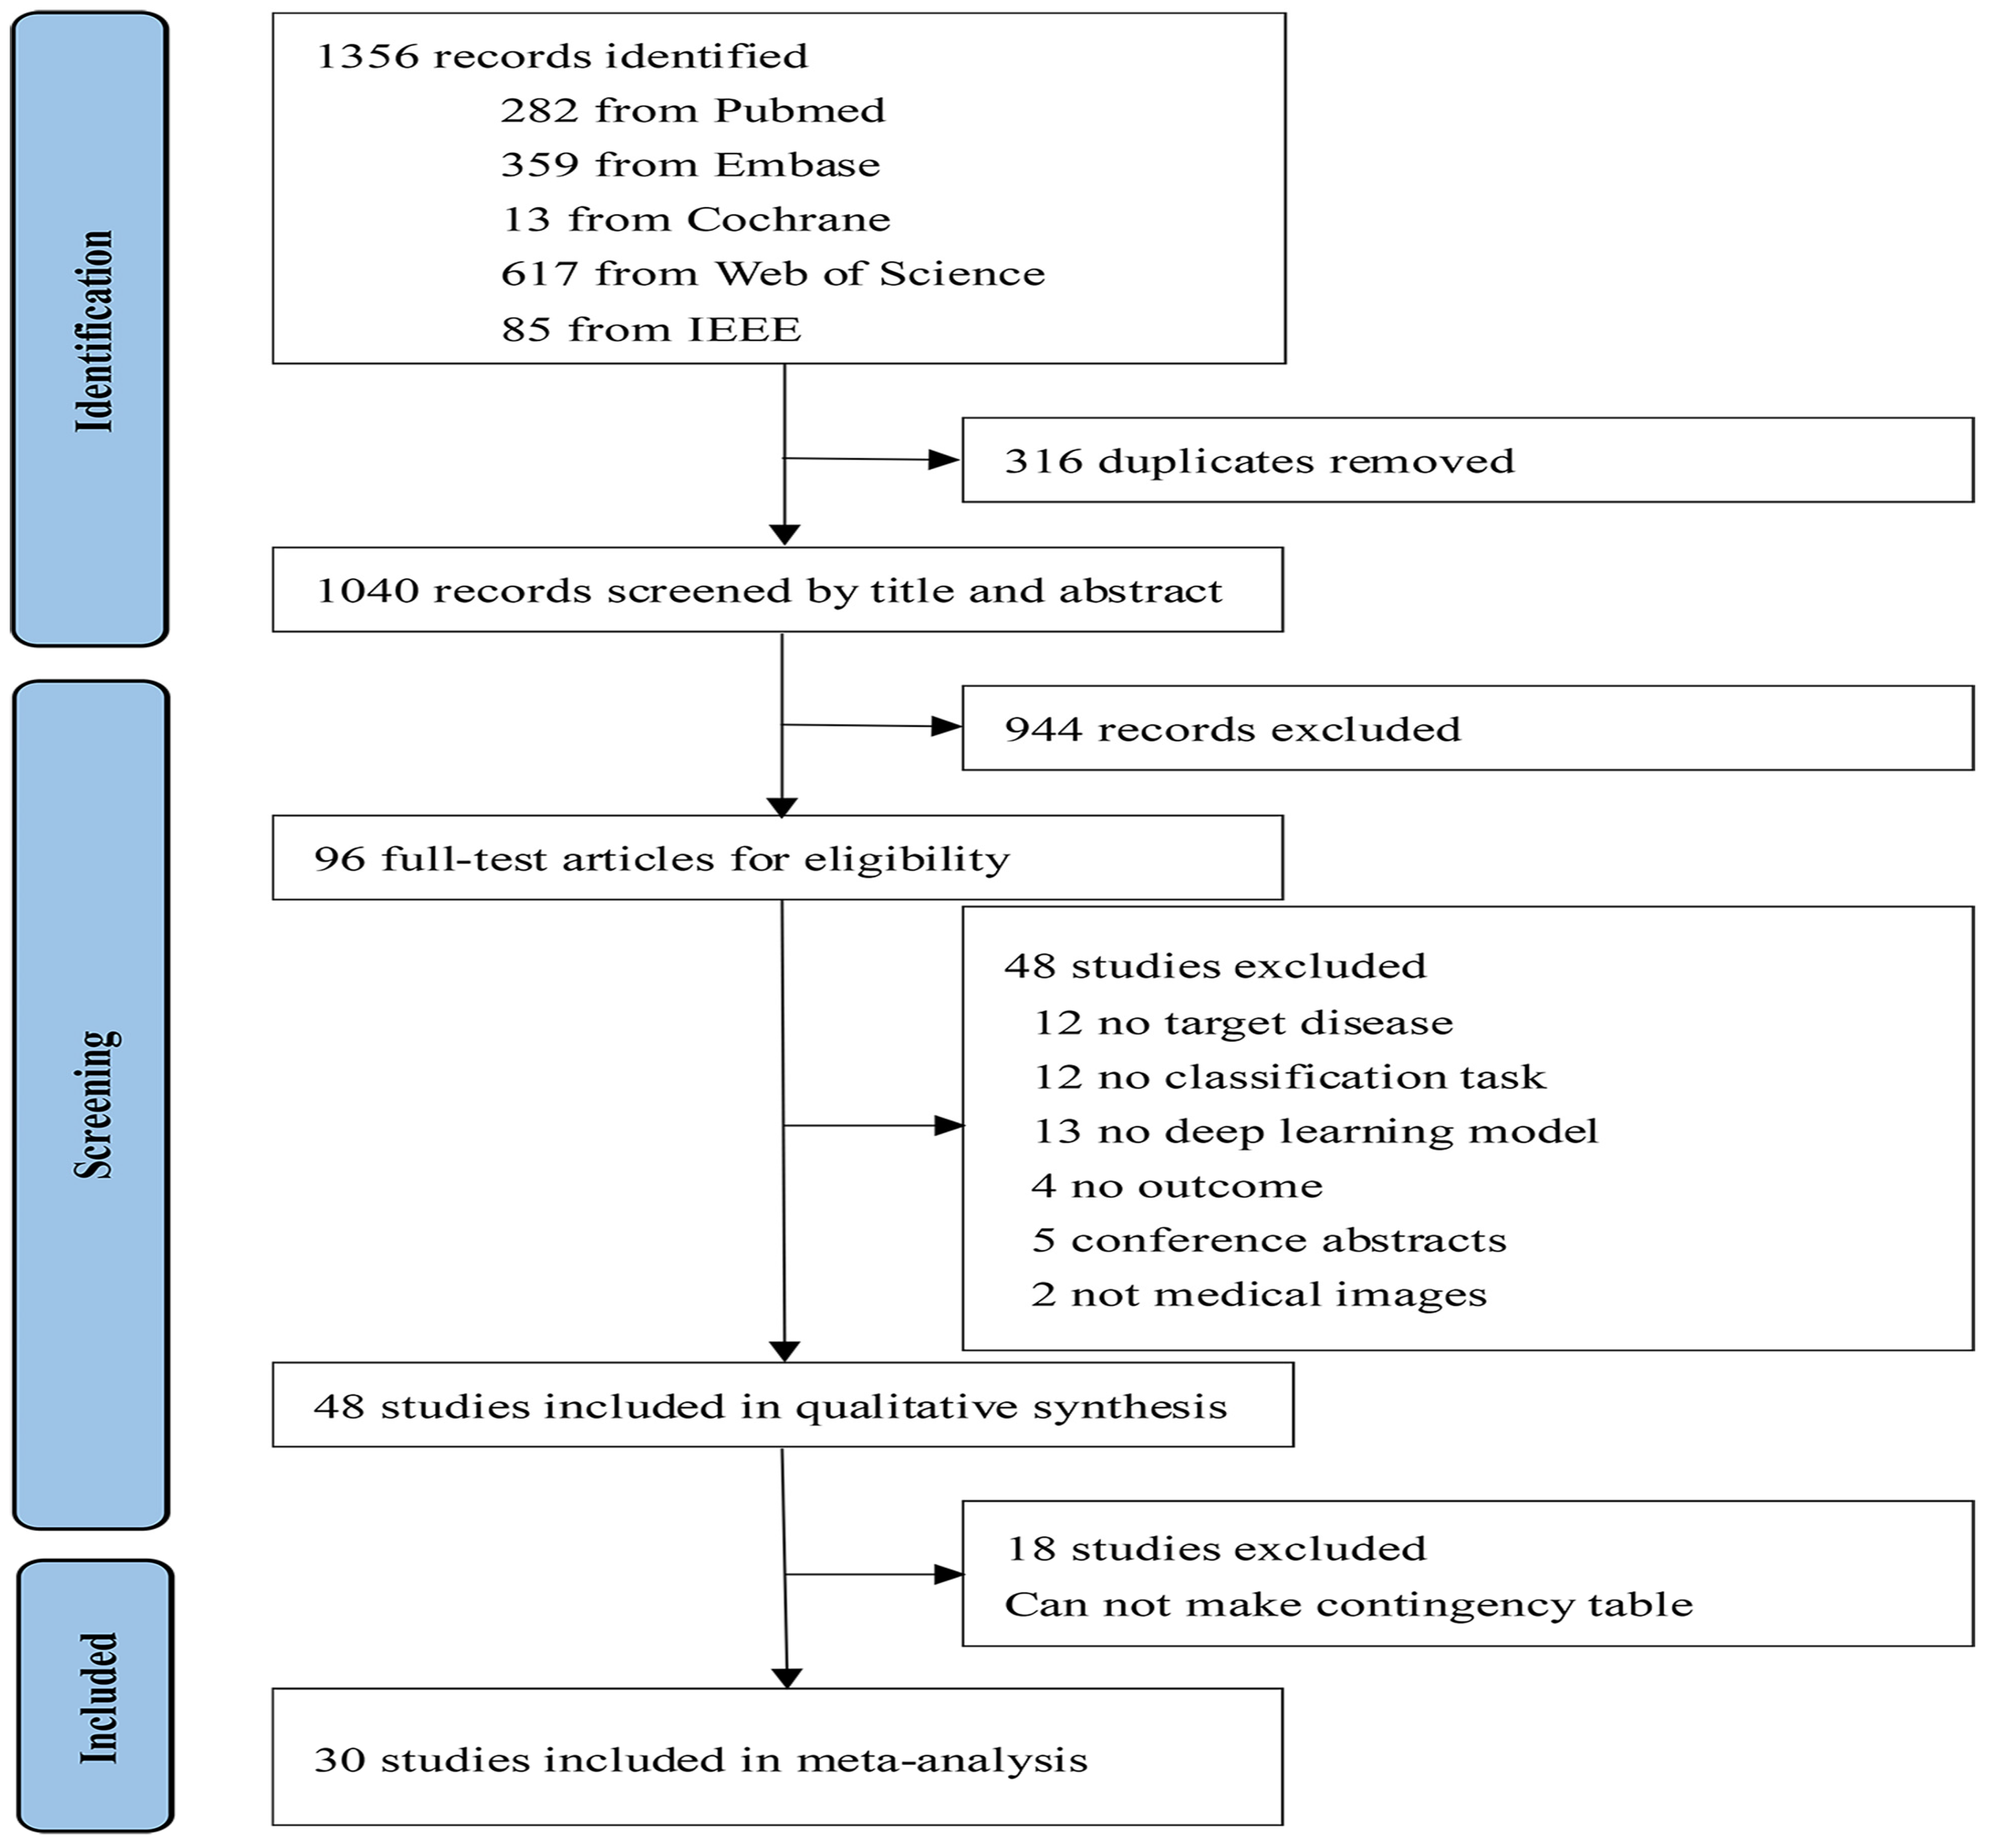
3.1. Study Selection and Characteristics
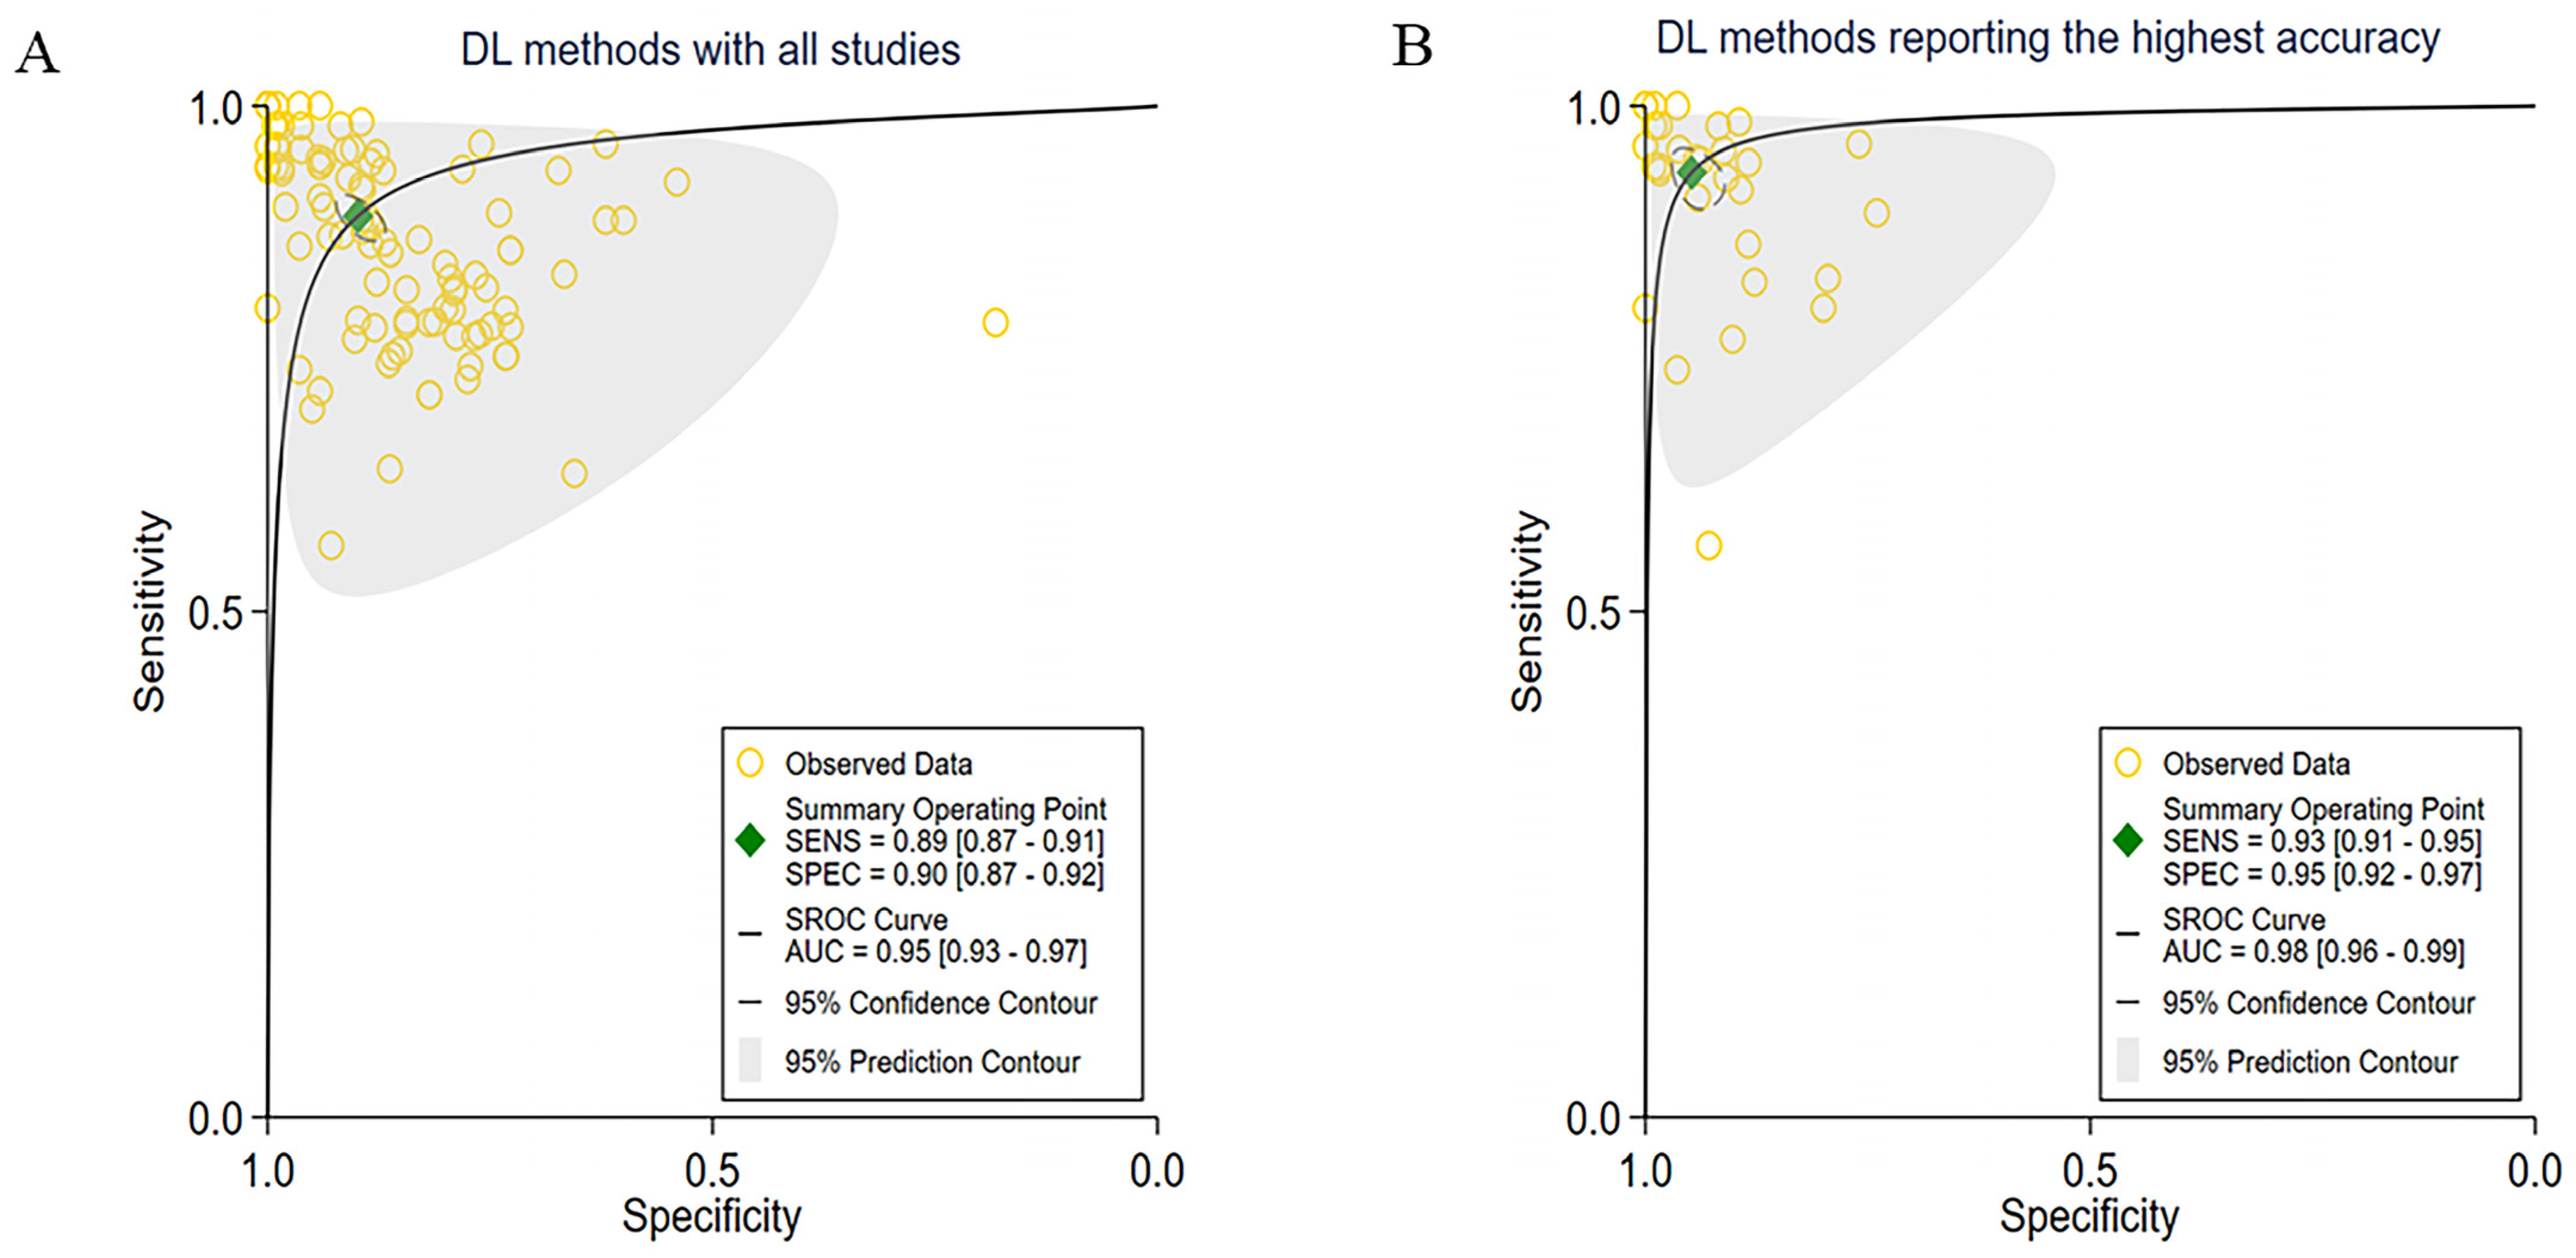
3.2. Overall Performance of the DL Methods
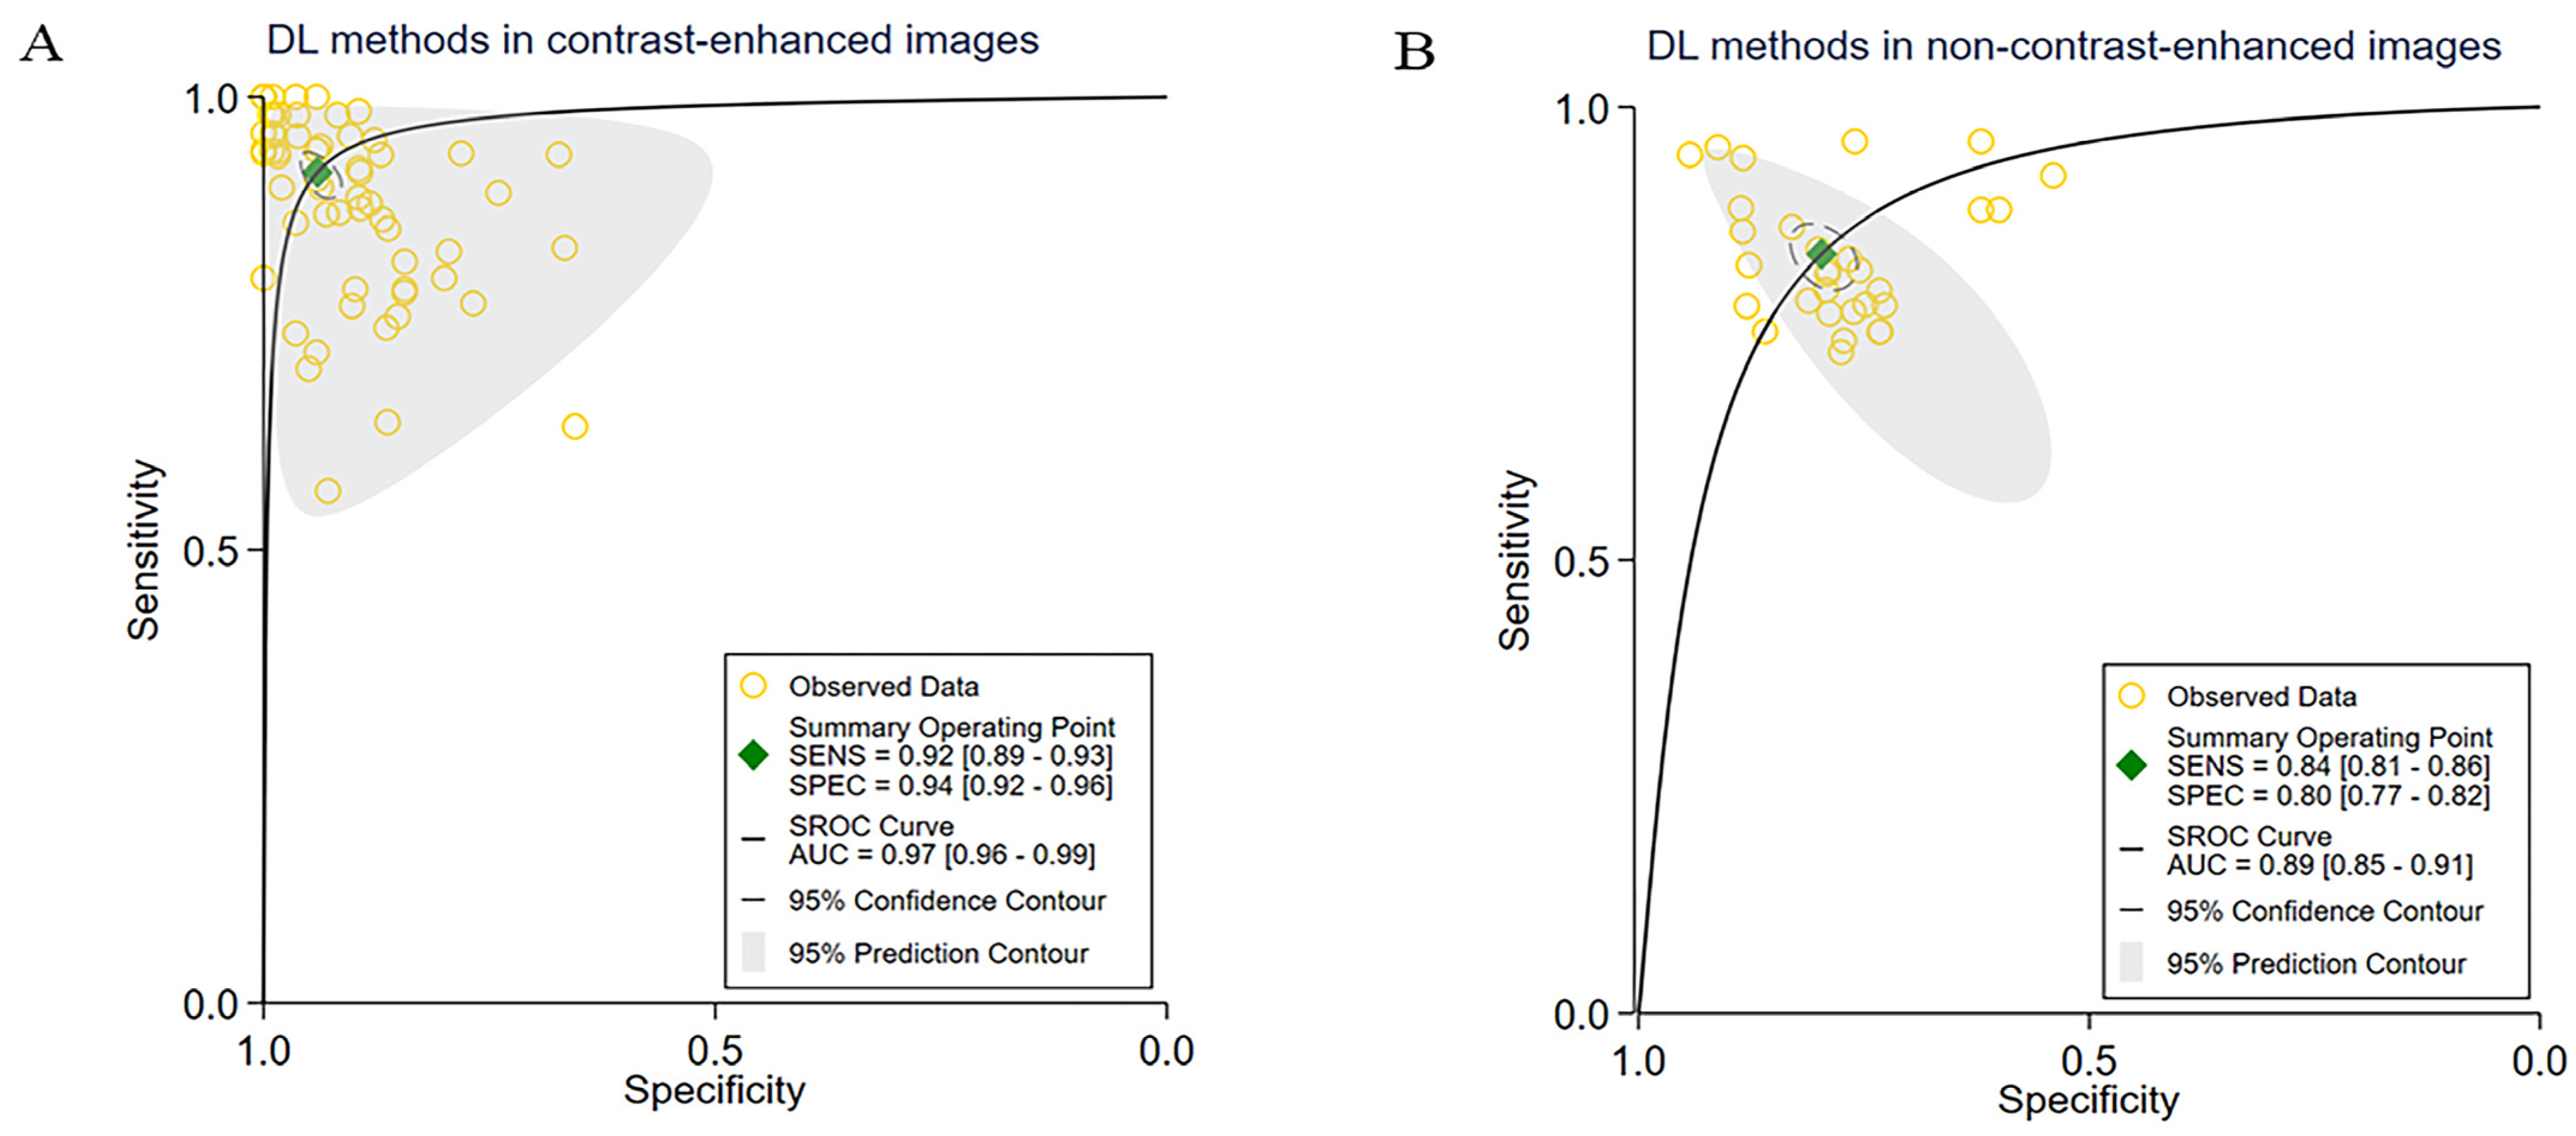
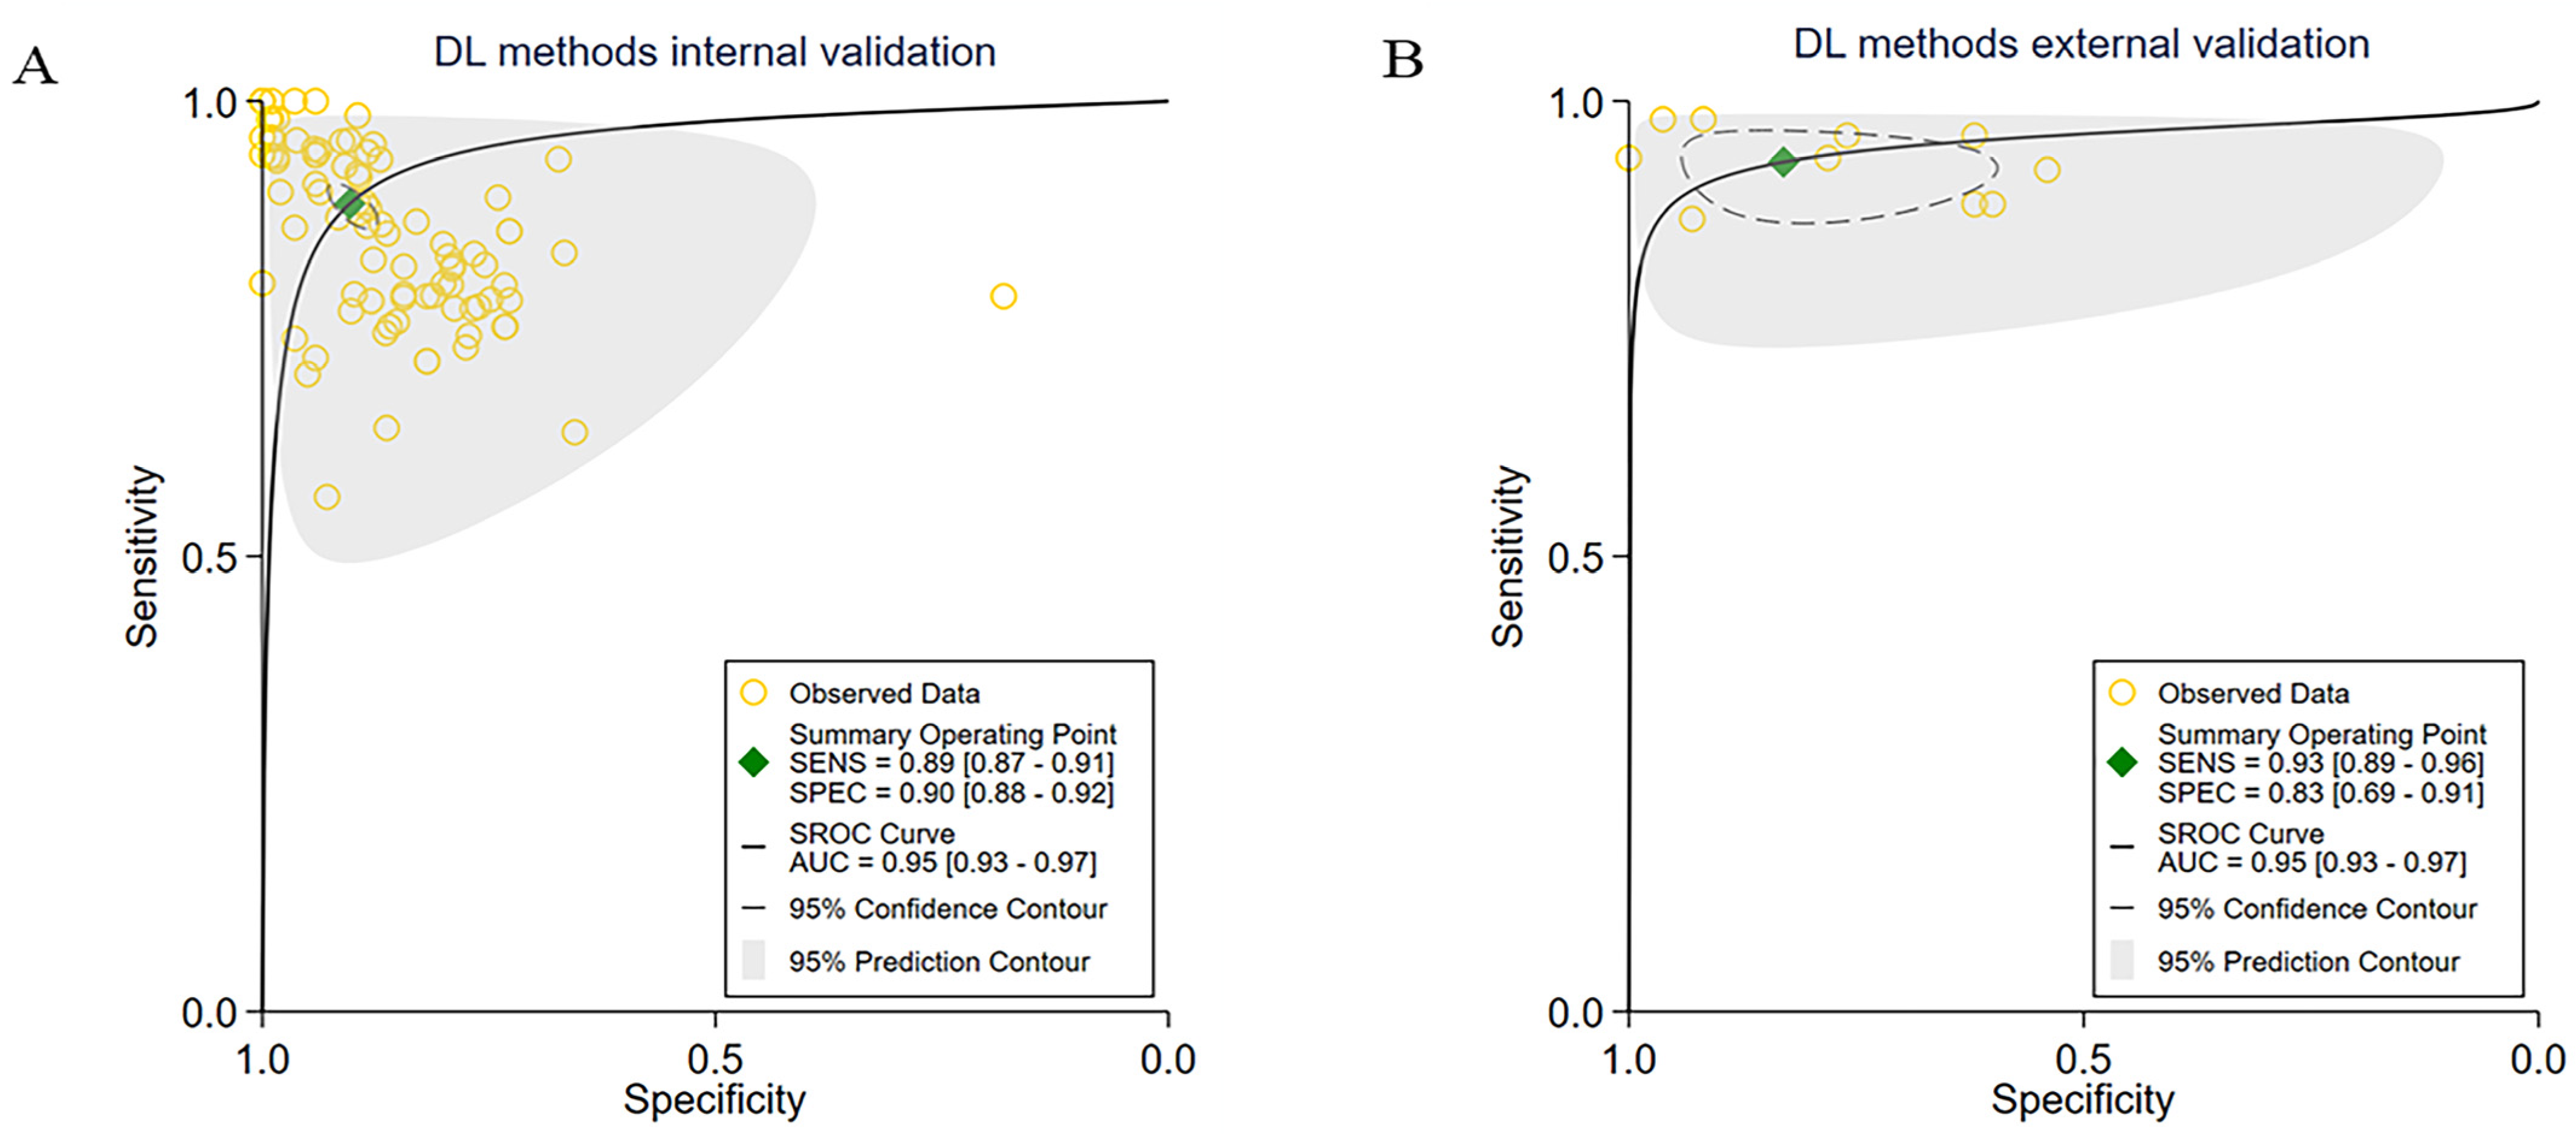
3.3. Subgroup Meta-Analyses
3.4. Heterogeneity Analysis
3.5. Quality Assessment
4. Discussion
5. Conclusions
Supplementary Materials
Author Contributions
Funding
Data Availability Statement
Conflicts of Interest
References
- Sung, H.; Ferlay, J.; Siegel, R.L.; Laversanne, M.; Soerjomataram, I.; Jemal, A.; Bray, F. Global Cancer Statistics 2020: GLOBOCAN Estimates of Incidence and Mortality Worldwide for 36 Cancers in 185 Countries. CA Cancer J. Clin. 2021, 71, 209–249. [Google Scholar] [CrossRef] [PubMed]
- Vogel, A.; Meyer, T.; Sapisochin, G.; Salem, R.; Saborowski, A. Hepatocellular carcinoma. Lancet 2022, 400, 1345–1362. [Google Scholar] [CrossRef]
- Lovet, J.M.; Kelley, R.K.; Villanueva, A.; Singal, A.G.; Pikarsky, E.; Roayaie, S.; Lencioni, R.; Koike, K.; Zucman-Rossi, J.; Finn, R.S. Hepatocellular carcinoma. Nat. Rev. Dis. Primers 2021, 7, 6. [Google Scholar] [CrossRef] [PubMed]
- Zhang, Q.; Lou, Y.; Yang, J.; Wang, J.; Feng, J.; Zhao, Y.; Wang, L.; Huang, X.; Fu, Q.; Ye, M.; et al. Integrated multi-omic analysis reveals comprehensive tumor heterogeneity and novel immunophenotypic classification in hepatocellular carcinomas. Gut 2019, 68, 2019–2031. [Google Scholar] [CrossRef] [PubMed]
- Yang, J.D.; Heimbach, J.K. New advances in the diagnosis and management of hepatocellular carcinoma. BMJ 2020, 371, m3544. [Google Scholar] [CrossRef] [PubMed]
- Kitao, A.; Matsui, O.; Zhang, Y.; Ogi, T.; Nakada, S.; Sato, Y.; Harada, K.; Yoneda, N.; Kozaka, K.; Inoue, D.; et al. Dynamic CT and Gadoxetic Acid-enhanced MRI Characteristics of P53-mutated Hepatocellular Carcinoma. Radiology 2023, 306, e220531. [Google Scholar] [CrossRef] [PubMed]
- Singal, A.G.; Lampertico, P.; Nahon, P. Epidemiology and surveillance for hepatocellular carcinoma: New trends. J. Hepatol. 2020, 72, 250–261. [Google Scholar] [CrossRef]
- Zhang, S.; Zhang, J.; Tian, B.; Lukasiewicz, T.; Xu, Z. Multi-modal contrastive mutual learning and pseudo-label re-learning for semi-supervised medical image segmentation. Med. Image Anal. 2023, 83, 102656. [Google Scholar] [CrossRef]
- Kim, D.H.; Hong, S.B.; Choi, S.H.; Kim, S.Y.; Shim, J.H.; Lee, J.S.; Choi, J.I.; Kim, S. Surveillance failure in ultrasound for hepatocellular carcinoma: A systematic review and meta-analysis. Gut 2022, 71, 212–213. [Google Scholar] [CrossRef] [PubMed]
- Chen, R.J.; Lu, M.Y.; Williamson, D.F.K.; Chen, T.Y.; Lipkova, J.; Noor, Z.; Shaban, M.; Shady, M.; Williams, M.; Joo, B.; et al. Pan-cancer integrative histology-genomic analysis via multimodal deep learning. Cancer Cell 2022, 40, 865–878.e6. [Google Scholar] [CrossRef]
- Bera, K.; Braman, N.; Gupta, A.; Velcheti, V.; Madabhushi, A. Predicting cancer outcomes with radionics and artificial intelligence in radiology. Nat. Rev. Clin. Oncol. 2022, 19, 132–146. [Google Scholar] [CrossRef]
- Kleppe, A.; Skrede, O.J.; De Raedt, S.; Hveem, T.S.; Askautrud, H.A.; Jacobsen, J.E.; Church, D.N.; Nesbakken, A.; Shepherd, N.A.; Novelli, M.; et al. A clinical decision support system optimizing adjuvant chemotherapy for colorectal cancers by integrating deep learning and pathological staging markers: A development and validation study. Lancet Oncol. 2022, 23, 1221–1232. [Google Scholar] [CrossRef]
- Hosny, A.; Parmar, C.; Quackenbush, J.; Schwartz, L.H.; Aerts, H.J.W.L. Artificial intelligence in radiology. Nat. Rev. Cancer 2018, 18, 500–510. [Google Scholar] [CrossRef] [PubMed]
- Wang, F.; Casalino, L.P.; Khullar, D. Deep Learning in Medicine-Promise, Progress, and Challenges. JAMA Intern. Med. 2019, 179, 293–294. [Google Scholar] [CrossRef] [PubMed]
- Liu, X.; Rivera, S.C.; Moher, D.; Calvert, M.J.; Denniston, A.K. SPIRIT-AI and CONSORT-AI Working Group. Reporting guidelines for clinical trial reports for interventions involving artificial intelligence: The CONSORT-AI Extension. BMJ 2020, 370, m3164. [Google Scholar] [CrossRef] [PubMed]
- Page, M.J.; McKenzie, J.E.; Bossuyt, P.M.; Boutron, I.; Hoffmann, T.C.; Mulrow, C.D.; Shamseer, L.; Tetzlaff, J.M.; Akl, E.A.; Brennan, S.E.; et al. The PRISMA 2020 statement: An updated guideline for reporting systematic reviews. Int. J. Surg. 2021, 88, 105906. [Google Scholar] [CrossRef] [PubMed]
- Shea, B.J.; Reeves, B.C.; Wells, G.; Thuku, M.; Hamel, C.; Moran, J.; Moher, D.; Tugwell, P.; Welch, V.; Kristjansson, E.; et al. Amstar 2: A critical appraisal tool for systematic reviews that include randomized or non-randomized studies of healthcare interventions, or both. BMJ 2017, 358, j4008. [Google Scholar] [CrossRef]
- Whiting, P.F.; Rutjes, A.W.; Westwood, M.E.; Mallett, S.; Deeks, J.J.; Reitsma, J.B.; Leeflang, M.M.; Sterne, J.A.; Bossuyt, P.M.; QUADAS-2 Group. QUADAS-2: A revised tool for the quality assessment of diagnostic accuracy studies. Ann. Intern. Med. 2011, 155, 529–536. [Google Scholar] [CrossRef]
- Kutlu, H.; Avcı, E. A Novel Method for Classifying Liver and Brain Tumors Using Convolutional Neural Networks, Discrete Wavelet Transform and Long Short-Term Memory Networks. Sensors 2019, 19, 1992. [Google Scholar] [CrossRef]
- Pan, F.; Huang, Q.; Li, X. Classification of liver tumors with CEUS based on 3D-CNN. In Proceedings of the 2019 IEEE 4th international conference on advanced robotics and mechatronics (ICARM), Toyonaka, Japan, 3–5 July 2019; IEEE: Picataway, NY, USA, 2019; pp. 845–849. [Google Scholar]
- Yamakawa, M.; Shiina, T.; Nishida, N. Computer-aided diagnosis system developed for ultrasound diagnosis of liver lesions using deep learning. In Proceedings of the 2019 IEEE International Ultrasonics Symposium (IUS), Glasgow, UK, 6–9 October 2019; IEEE: Picataway, NY, USA, 2019; pp. 2330–2333. [Google Scholar]
- Das, A.; Acharya, U.R.; Panda, S.S. Deep learning based liver cancer detection using watershed transform and Gaussian mixture model techniques. Cogn. Syst. Res. 2019, 54, 165–175. [Google Scholar] [CrossRef]
- Hamm, C.A.; Wang, C.J.; Savic, L.J. Deep learning for liver tumor diagnosis part I: Development of a convolutional neural network classifier for multi-phasic MRI. Eur. Radiol. 2019, 29, 3338–3347. [Google Scholar] [CrossRef]
- Jia, X.; Xiao, Y.; Yang, D. Multi-parametric MRIs based assessment of hepatocellular carcinoma differentiation with multi-scale ResNet. KSII Trans. Internet Inf. Syst. TIIS 2019, 13, 5179–5196. [Google Scholar]
- Zhen, S.H.; Cheng, M.; Tao, Y.B.; Wang, Y.F.; Juengpanich, S.; Jiang, Z.Y.; Jiang, Y.K.; Yan, Y.Y.; Lu, W.; Lue, J.M.; et al. Deep Learning for Accurate Diagnosis of Liver Tumor Based on Magnetic Resonance Imaging and Clinical Data. Front. Oncol. 2020, 10, 680. [Google Scholar] [CrossRef] [PubMed]
- Brehar, R.; Mitrea, D.A.; Vancea, F.; Marita, T.; Nedevschi, S.; Lupsor-Platon, M.; Rotaru, M.; Badea, R.I. Comparison of Deep-Learning and Conventional Machine-Learning Methods for the Automatic Recognition of the Hepatocellular Carcinoma Areas from Ultrasound Images. Sensors 2020, 20, 3085. [Google Scholar] [CrossRef] [PubMed]
- Shi, W.; Kuang, S.; Cao, S.; Hu, B.; Xie, S.; Chen, S.; Chen, Y.; Gao, D.; Chen, Y.; Zhu, Y.; et al. Deep learning assisted differentiation of hepatocellular carcinoma from focal liver lesions: Choice of four-phase and three-phase CT imaging protocol. Abdom. Radiol. 2020, 45, 2688–2697. [Google Scholar] [CrossRef]
- Kim, J.; Min, J.H.; Kim, S.K.; Shin, S.Y.; Lee, M.W. Detection of Hepatocellular Carcinoma in Contrast-Enhanced Magnetic Resonance Imaging Using Deep Learning Classifier: A Multi-Center Retrospective Study. Sci. Rep. 2020, 10, 9458. [Google Scholar] [CrossRef] [PubMed]
- Cao, S.E.; Zhang, L.Q.; Kuang, S.C.; Shi, W.Q.; Hu, B.; Xie, S.D.; Chen, Y.N.; Liu, H.; Chen, S.M.; Jiang, T.; et al. Multiphase convolutional dense network for the classification of focal liver lesions on dynamic contrast-enhanced computed tomography. World J. Gastroenterol. 2020, 26, 3660–3672. [Google Scholar] [CrossRef] [PubMed]
- Gao, R.; Zhao, S.; Aishanjiang, K.; Cai, H.; Wei, T.; Zhang, Y.; Liu, Z.; Zhou, J.; Han, B.; Wang, J.; et al. Deep learning for differential diagnosis of malignant hepatic tumors based on multi-phase contrast-enhanced CT and clinical data. J. Hematol. Oncol. 2021, 14, 154. [Google Scholar] [CrossRef] [PubMed]
- Wang, M.; Fu, F.; Zheng, B.; Bai, Y.; Wu, Q.; Wu, J.; Sun, L.; Liu, Q.; Liu, M.; Yang, Y.; et al. Development of an AI system for accurately diagnosing hepatocellular carcinoma from computed tomography imaging data. Br. J. Cancer 2021, 125, 1111–1121. [Google Scholar] [CrossRef]
- Zhou, H.; Jiang, T.; Li, Q.; Zhang, C.; Zhang, C.; Liu, Y.; Cao, J.; Sun, Y.; Jin, P.; Luo, J.; et al. US-Based Deep Learning Model for Differentiating Hepatocellular Carcinoma (HCC) From Other Malignancy in Cirrhotic Patients. Front. Oncol. 2021, 11, 672055. [Google Scholar] [CrossRef]
- Wang, P.; Wu, Y.; Lai, B. A deep learning pipeline for localization, differentiation, and uncertainty estimation of liver lesions using multi-phasic and multi-sequence MRI. arXiv 2021, arXiv:2110.08817. [Google Scholar]
- Oestmann, P.M.; Wang, C.J.; Savic, L.J.; Hamm, C.A.; Stark, S.; Schobert, I.; Gebauer, B.; Schlachter, T.; Lin, M.; Weinreb, J.C.; et al. Deep learning-assisted differentiation of pathologically proven atypical and typical hepatocellular carcinoma (HCC) versus non-HCC on contrast-enhanced MRI of the liver. Eur. Radiol. 2021, 31, 4981–4990. [Google Scholar] [CrossRef]
- Stollmayer, R.; Budai, B.K.; Tóth, A.; Kalina, I.; Hartmann, E.; Szoldán, P.; Bérczi, V.; Maurovich-Horvat, P.; Kaposi, P.N. Diagnosis of focal liver lesions with deep learning-based multi-channel analysis of hepatocyte-specific contrast-enhanced magnetic resonance imaging. World J. Gastroenterol. 2021, 27, 5978–5988. [Google Scholar] [CrossRef]
- Zheng, R.; Wang, L.; Wang, C.; Yu, X.; Chen, W.; Li, Y.; Li, W.; Yan, F.; Wang, H.; Li, R. Feasibility of automatic detection of small hepatocellular carcinoma (≤2 cm) in cirrhotic liver based on pattern matching and deep learning. Phys. Med. Biol. 2021, 66, 085014. [Google Scholar] [CrossRef]
- Wang, S.H.; Han, X.J.; Du, J.; Wang, Z.C.; Yuan, C.; Chen, Y.; Zhu, Y.; Dou, X.; Xu, X.W.; Xu, H.; et al. Saliency-based 3D convolutional neural network for categorizing common focal liver lesions on multisequence MRI. Insights Imaging 2021, 12, 173. [Google Scholar] [CrossRef] [PubMed]
- Ling, Y.; Ying, S.; Xu, L.; Peng, Z.; Mao, X.; Chen, Z.; Ni, J.; Liu, Q.; Gong, S.; Kong, D. Automatic volumetric diagnosis of hepatocellular carcinoma based on four-phase CT scans with minimum extra information. Front. Oncol. 2022, 12, 960178. [Google Scholar] [CrossRef] [PubMed]
- Cao, Y.; Yu, J.; Zhang, H.; Xiong, J.; Luo, Z. Classification of hepatic cavernous hemangioma or hepatocellular carcinoma using a convolutional neural network model. J. Gastrointest. Oncol. 2022, 13, 787–791. [Google Scholar] [CrossRef] [PubMed]
- Zhang, W.B.; Hou, S.Z.; Chen, Y.L.; Mao, F.; Dong, Y.; Chen, J.G.; Wang, W.P. Deep Learning for Approaching Hepatocellular Carcinoma Ultrasound Screening Dilemma: Identification of α-Fetoprotein-Negative Hepatocellular Carcinoma From Focal Liver Lesion Found in High-Risk Patients. Front. Oncol. 2022, 12, 862297. [Google Scholar] [CrossRef] [PubMed]
- Liu, Y.; Wang, B.; Mo, X.; Tang, K.; He, J.; Hao, J. A Deep Learning Workflow for Mass-Forming Intrahepatic Cholangiocarcinoma and Hepatocellular Carcinoma Classification Based on MRI. Curr. Oncol. 2022, 30, 529–544. [Google Scholar] [CrossRef]
- Elbashir, M.K.; Mahmoud, A.; Mostafa, A.M. A Transfer Learning Approach Based on Ultrasound Images for Liver Cancer Detection. Comput. Mater. Contin. 2023, 75, 3. [Google Scholar] [CrossRef]
- Midya, A.; Chakraborty, J.; Srouji, R. Computerized Diagnosis of Liver Tumors from CT Scans Using a Deep Neural Network Approach. IEEE J. Biomed. Health Inform. 2023, 27, 2456–2464. [Google Scholar] [CrossRef]
- Anisha, A.; Jiji, G.; Ajith, B.; Raj, T. Deep feature fusion and optimized feature selection based ensemble classification of liver lesions. Imaging Sci. J. 2023, 71, 518–536. [Google Scholar] [CrossRef]
- Huang, J.L.; Sun, Y.; Wu, Z.H.; Zhu, H.J.; Xia, G.J.; Zhu, X.S.; Wu, J.H.; Zhang, K.H. Differential diagnosis of hepatocellular carcinoma and intrahepatic cholangiocarcinoma based on spatial and channel attention mechanisms. J. Cancer Res. Clin. Oncol. 2023, 149, 10161–10168. [Google Scholar] [CrossRef]
- Mitrea, D.A.; Brehar, R.; Nedevschi, S.; Lupsor-Platon, M.; Socaciu, M.; Badea, R. Hepatocellular Carcinoma Recognition from Ultrasound Images Using Combinations of Conventional and Deep Learning Techniques. Sensors 2023, 23, 2520. [Google Scholar] [CrossRef]
- Zhang, X.; Jia, N.; Wang, Y. Multi-input dense convolutional network for classification of hepatocellular carcinoma and intrahepatic cholangiocarcinoma. Biomed. Signal Process. Control 2023, 80, 104226. [Google Scholar] [CrossRef]
- Wang, X.; Li, N.; Yin, X.; Xing, L.; Zheng, Y. Classification of metastatic hepatic carcinoma and hepatocellular carcinoma lesions using contrast-enhanced CT based on EI-CNNet. Med. Phys. 2023, 50, 5630–5642. [Google Scholar] [CrossRef] [PubMed]
- Hassan, T.M.; Elmogy, M.; Sallam, E.S. Diagnosis of focal liver diseases based on deep learning technique for ultrasound images. Arab. J. Sci. Eng. 2017, 42, 3127–3140. [Google Scholar] [CrossRef]
- Yasaka, K.; Akai, H.; Abe, O.; Kiryu, S. Deep Learning with Convolutional Neural Network for Differentiation of Liver Masses at Dynamic Contrast-enhanced CT: A Preliminary Study. Radiology 2018, 286, 887–896. [Google Scholar] [CrossRef] [PubMed]
- Bharti, P.; Mittal, D.; Ananthasivan, R. Preliminary Study of Chronic Liver Classification on Ultrasound Images Using an Ensemble Model. Ultrason. Imaging 2018, 40, 357–379. [Google Scholar] [CrossRef] [PubMed]
- Schmauch, B.; Herent, P.; Jehanno, P.; Dehaene, O.; Saillard, C.; Aubé, C.; Luciani, A.; Lassau, N.; Jégou, S. Diagnosis of focal liver lesions from ultrasound using deep learning. Diagn. Interv. Imaging 2019, 100, 227–233. [Google Scholar] [CrossRef] [PubMed]
- Mitrea, D.; Nedevschi, S.; Mitrea, P.; Lupşor, M.P.; Badea, R. HCC Recognition Within Ultrasound Images Employing Advanced Textural Features with Deep. Learning Techniques. In Proceedings of the 2019 12th International Congress on Image and Signal Processing, BioMedical Engineering and Informatics (CISP-BMEI), Suzhou, China, 19–21 October 2019; IEEE: Piscataway, NY, USA, 2019; pp. 1–6. [Google Scholar]
- Wang, Q.; Wang, Z.; Sun, X.; Zhang, W.; Li, Y.; Ge, X.; Huang, Y.; Liu, Y.; Chen, Y. SCCNN: A diagnosis method for hepatocellular carcinoma and intrahepatic cholangiocarcinoma based on siamese cross contrast neural network. IEEE Access 2020, 8, 85271–85283. [Google Scholar] [CrossRef]
- Kim, D.W.; Lee, G.; Kim, S.Y.; Ahn, G.; Lee, J.G.; Lee, S.S.; Kim, K.W.; Park, S.H.; Lee, Y.J.; Kim, N. Deep learning-based methods to detect primary hepatic malignancy in multiphase CT of patients at high risk for HCC. Eur. Radiol. 2021, 31, 7047–7057. [Google Scholar] [CrossRef] [PubMed]
- Căleanu, C.D.; Sîrbu, C.L.; Simion, G. Deep Neural Architectures for Contrast Enhanced Ultrasound (CEUS) Focal Liver Lesions Automated Diagnosis. Sensors 2021, 21, 4126. [Google Scholar] [CrossRef] [PubMed]
- Chen, W.F.; Ou, H.Y.; Liu, K.H.; Li, Z.Y.; Liao, C.C.; Wang, S.Y.; Huang, W.; Cheng, Y.F.; Pan, C.T. In-Series U-Net Network to 3D Tumor Image Reconstruction for Liver Hepatocellular Carcinoma Recognition. Diagnostics 2020, 11, 11. [Google Scholar] [CrossRef] [PubMed]
- Chen, Q.; Zhu, Y.; Chen, Y.; Wang, F.; Hu, X.; Ye, Y.; Dou, X.; Huang, Y.; Deng, L.; Zhou, W.; et al. Applicability of multidimensional convolutional neural networks on automated detection of diverse focal liver lesions in multiphase CT images. Med. Phys. 2023, 50, 2872–2883. [Google Scholar] [CrossRef] [PubMed]
- Xiao, X.; Zhao, J.; Li, S. Task relevance driven adversarial learning for simultaneous detection, size grading, and quantification of hepatocellular carcinoma via integrating multi-modality MRI. Med. Image Anal. 2022, 81, 102554. [Google Scholar] [CrossRef] [PubMed]
- Phan, A.C.; Cao, H.P.; Le, T.N.; Trieu, T.N.; Phan, T.C. Improving liver lesions classification on CT/MRI images based on Hounsfield Units attenuation and deep learning. Gene Expr. Patterns 2023, 47, 119289. [Google Scholar] [CrossRef]
- Khan, R.A.; Fu, M.; Burbridge, B.; Luo, Y.; Wu, F.X. A multi-modal deep neural network for multi-class liver cancer diagnosis. Neural Netw. 2023, 165, 553–561. [Google Scholar] [CrossRef]
- Feng, X.; Cai, W.; Zheng, R.; Tang, L.; Zhou, J.; Wang, H.; Huang, Q. Diagnosis of hepatocellular carcinoma using a deep network with multi-view enhanced patterns mined in contrast-enhanced ultrasound data. Eng. Appl. Artif. Intell. 2023, 118, 105635. [Google Scholar] [CrossRef]
- Xu, X.; Zhu, Q.; Ying, H.; Li, J.; Cai, X.; Li, S.; Liu, X.; Yu, Y. A Knowledge-Guided Framework for Fine-Grained Classification of Liver Lesions Based on Multi-Phase CT Images. IEEE J. Biomed. Health Inform. 2023, 27, 386–396. [Google Scholar] [CrossRef]
- Kim, N.; Lee, W.J.; Lee, H.J. Deep learning classification of focal liver lesions with contrast-enhanced ultrasound from arterial phase recordings. In Proceedings of the International Conference on Electronics, Information, and Communication (ICEIC), Singapore, 5–8 February 2023; IEEE: Piscataway, NY, USA, 2023; pp. 1–3. [Google Scholar]
- Roy, S.S.; Roy, S.; Mukherjee, P.; Roy, S.S. An automated liver tumor segmentation and classification model by deep learning based approaches. Comput. Methods Biomech. Biomed. Eng. Imaging Vis. 2023, 11, 638–650. [Google Scholar]
- Balasubramanian, P.K.; Lai, W.C.; Seng, G.H.; Selvaraj, J. APESTNet with Mask R-CNN for Liver Tumor Segmentation and Classification. Cancers 2023, 15, 330. [Google Scholar] [CrossRef] [PubMed]
- Chou, R.; Cuevas, C.; Fu, R.; Devine, B.; Wasson, N.; Ginsburg, A.; Sullivan, S.D. Imaging Techniques for the Diagnosis of Hepatocellular Carcinoma: A Systematic Review and Meta-analysis. Ann. Intern. Med. 2015, 162, 697–711. [Google Scholar] [CrossRef] [PubMed]
- Lai, Q.; Spoletini, G.; Mennini, G.; Laureiro, Z.L.; Tsilimigras, D.I.; Pawlik, T.M.; Rossi, M. Prognostic role of artificial intelligence among patients with hepatocellular cancer: A systematic review. World J. Gastroenterol. 2020, 26, 6679–6688. [Google Scholar] [CrossRef] [PubMed]
- Martinino, A.; Aloulou, M.; Chatterjee, S.; Scarano Pereira, J.P.; Singhal, S.; Patel, T.; Giovinazzo, F. Artificial Intelligence in the Diagnosis of Hepatocellular Carcinoma: A Systematic Review. J. Clin. Med. 2022, 11, 6368. [Google Scholar] [CrossRef]
- Zhang, J.; Huang, S.; Xu, Y.; Wu, J. Diagnostic Accuracy of Artificial Intelligence Based on Imaging Data for Preoperative Prediction of Microvascular Invasion in Hepatocellular Carcinoma: A Systematic Review and Meta-Analysis. Front. Oncol. 2022, 12, 763842. [Google Scholar] [CrossRef] [PubMed]
- Ravì, D.; Wong, C.; Deligianni, F.; Berthelot, M.; Andreu-Perez, J.; Lo, B.; Yang, G.Z. Deep Learning for Health Informatics. IEEE J. Biomed. Health Inform. 2017, 21, 4–21. [Google Scholar] [CrossRef]
- Zhou, D.; Tian, F.; Tian, X.; Sun, L.; Huang, X.; Zhao, F.; Li, X. Diagnostic evaluation of a deep learning model for optical diagnosis of colorectal cancer. Nat. Commun. 2020, 11, 2961. [Google Scholar] [CrossRef] [PubMed]
- Xue, P.; Wang, J.; Qin, D.; Yan, H.; Qu, Y.; Seery, S.; Qiao, Y. Deep learning in image-based breast and cervical cancer detection: A systematic review and meta-analysis. NPJ Digit. Med. 2022, 5, 19. [Google Scholar] [CrossRef]
- Havaei, M.; Davy, A.; Warde-Farley, D.; Biard, A.; Courville, A.; Bengio, Y.; Larochelle, H. Brain tumor segmentation with Deep Neural Networks. Med. Image Anal. 2017, 35, 18–31. [Google Scholar] [CrossRef]
- Greenspan, H.; Van Ginneken, B.; Summers, R.M. Guest editorial deep learning in medical imaging: Overview and future promise of an exciting new technique. IEEE Trans. Med. Imaging 2016, 35, 1153–1159. [Google Scholar] [CrossRef]
- Zhou, L.Q.; Wang, J.Y.; Yu, S.Y.; Wu, G.G.; Wei, Q.; Deng, Y.B.; Dietrich, C.F. Artificial intelligence in medical imaging of the liver. World J. Gastroenterol. 2019, 25, 672–682. [Google Scholar] [CrossRef] [PubMed]
- Wang, C.J.; Hamm, C.A.; Savic, L.J.; Ferrante, M.; Schobert, I.; Schlachter, T.; Letzen, B. Deep learning for liver tumor diagnosis part II: Convolutional neural network interpretation using radiologic imaging features. Eur. Radiol. 2019, 29, 3348–3357. [Google Scholar] [CrossRef] [PubMed]
- Esteva, A.; Kuprel, B.; Novoa, R.A.; Ko, J.; Swetter, S.M.; Blau, H.M.; Thrun, S. Dermatologist-level classification of skin cancer with deep neural networks. Nature 2017, 542, 115–118. [Google Scholar] [CrossRef]
- Xu, H.L.; Gong, T.T.; Liu, F.H.; Chen, H.Y.; Xiao, Q.; Hou, Y.; Huang, Y.; Sun, H.Z.; Shi, Y.; Gao, S.; et al. Artificial intelligence performance in image-based ovarian cancer identification: A systematic review and meta-analysis. EClinicalMedicine 2022, 53, 101662. [Google Scholar] [CrossRef]
- Soffer, S.; Ben-Cohen, A.; Shimon, O.; Amitai, M.M.; Greenspan, H.; Klang, E. Convolutional Neural Networks for Radiologic Images: A Radiologist’s Guide. Radiology 2019, 290, 590–606. [Google Scholar] [CrossRef]


| First Author and Year | Participants Inclusion Criteria | Participants Exclusion Criteria | Reference Standard | Patients (Number) |
|---|---|---|---|---|
| Liu et al. 2023 [41] | Patients who (1) underwent a preoperative MRI examination; (2) had no history of treatment for hepatic tumor prior to the study; (3) pathologically confirmed HCC or MF-ICC | Patients with (1) image quality were insufficient for further analysis; (2) T2WI-MRI was incomplete | Histopathology | 112 |
| Murtada et al. 2023 [42] | NA | NA | NA | 59 |
| Abhishek et al. 2023 [43] | Patients who had abdominal CT scans within three months of operation with a routine clinical imaging protocol of contrast-enhanced portal venous phase CT | Patients who had (1) no contrast-enhanced CT scans; (2) metal artifacts infiltrating the tumor on CT imaging; (3) prior ablation, embolization, resection, or transplantation, as these prior treatments would alter the appearance of the tumors on imaging and compromise the quantitative image analysis; (4) tumors that were ruptured; (5) tumors with a diffuse infiltrative pattern (as tumor borders were challenging to determine for analysis) | Histopathology | 814 |
| Anisha et al. 2023 [44] | NA | NA | NA | 320 |
| Huang et al. 2023 [45] | Patients with pathologically confirmed HCC or ICC who underwent hepatectomy | Patients with pathologically confirmed HCC or ICC who underwent hepatectomy | Histopathology | 1042 |
| Zhang et al. 2023 [47] | NA | NA | NA | 317 |
| Mitrea et al. 2023 [46] | NA | NA | Histopathology | 296 |
| Wang et al. 2023 [48] | Patients who (1) were at least 18 years old; (2) had clear CT image with lesion location being analyzed easily; (3) had no other genetic history in the family | Patients who (1) take related prohibited drugs before CT image acquisition; (2) during hospital examination, the patient had a severe malignant tumor and other systemic diseases | NA | 102 |
| Ling et al. 2022 [38] | NA | NA | Histopathology | 479 |
| Cao et al. 2022 [39] | Patients who (1) were diagnosed with HCC or HCH based on liver biopsy or clinical findings; (2) had no contraindications to contrast medium and had undergone upper abdominal contrast-enhanced CT scans | NA | Histopathology | 50 |
| Zhang et al. 2022 [40] | Patients who were pathologically confirmed as HCC or FNH after surgical resection | Patients who (1) have complicated clinical conditions such as pregnancy and taking medication for collagen diseases; (2) received additional treatment before examination such as chemotherapy, radiofrequency ablation (RFA), or transcatheter arterial chemoembolization (TACE) | Histopathology | 407 |
| Gao et al. 2021 [30] | Patients who were (1) pathologically confirmed with one of the following malignant hepatic tumors: HCC, ICC, and metastasis; (2) with preoperative multi-phase contrast-enhanced CT available | Patients (1) who were ≤18 years old; (2) who had a prior liver resection or transplantation; (3) whose interval between the pathologic examination and the preoperative CT > 100 days; (4) whose image quality was poor | Histopathology | 723 |
| Oestmann et al. 2021 [34] | Patients had histopathological diagnosis and were older than 18 years | NA | Histopathology | 118 |
| Wang et al. 2021 [31] | The HCC group consisted of patients not only treated by surgical resection but also treated by intervention, radiofrequency ablation, cryoablation, microwave therapy, or any other invasive treatment therapy. Both solitary and multiple HCC tumor nodules were enrolled. Patients diagnosed with malignant lesions other than HCC such as hemangioendothelioma, sarcoma, intrahepatic cholangiocarcinoma, and metastatic tumor were included in the control group. Patients diagnosed with benign lesions such as leiomyolipoma, hemangioma, cyst, abscess, adenoma, and focal nodular hyperplasia were also included in the control group | NA | Histopathology | 9741 |
| Wang et al. 2021 [33] | Patients who (1) had liver surgical resection or biopsy in the period between 2006 and 2019; (2) were diagnosed with HCC, ICC, or secondary metastasis lesion | Patients who (1) lost images or stored images in other hospitals; (2) only had other types of scans | Histopathology | 400 |
| Wang et al. 2021 [37] | Patients who (1) didn’t have MRI inspection; (2) had one of the following common FLLs, including liver cyst, HEM, HEP, FNH, HCC, ICC, and MET; (3) had up to one imaging study per patient and up to six lesions being used in each study | Patients (1) with MRI studies of insufficient image quality; (2) had received treatment related to the lesion before MRI inspection; and (3) had diffuse lesions for which the boundary could not be delineated or malignancies involving the portal vein, hepatic vein, or adjacent organs | NA | 445 |
| Zhou et al. 2021 [32] | Patients with definite pathological results of non-cystic FLL were registered | Patients with (1) benign lesions; (2) without cirrhosis; (3) with previous treatment; (4) without US images; (5) lesion size < 1.0 cm; (6) unsatisfied US image quality | Histopathology | 172 |
| Shi et al. 2020 [27] | Patients (age ≥ 18 years) with FLLs other than cysts underwent four-phase CT exams | Patients with (1) lesions that could not be reliably classified by the best available reference standard as HCC or non-HCC; (2) lesion sizes below 1 cm; (3) CT exams with fewer than four phases or with severe image artifacts; (4) previous transcatheter arterial chemoembolization or other previous locoregional therapy; (5) loss to follow-up (n = 13) | Histopathology, clinical diagnosis, and follow-up | 915 |
| Zhen et al. 2020 [25] | Patients with (1) liver tumors and (2) enhanced MRI inspection | Patients with (1) treatment related to the lesion before MRI inspection, including surgery, transcatheter arterial chemoembolization (TACE), radiofrequency ablation, chemotherapy, radiotherapy, targeted drug therapy, etc.; (2) inflammatory lesions; (3) a clinically diagnosed malignancy (without pathology confirmed); (4) any missing important medical records or laboratory results of the malignancy individuals; and (5) unqualified image quality | Histopathology, clinical diagnosis, and follow-up | 1411 |
| Kim et al. 2020 [28] | Patients who were diagnosed as HCC after surgical resection | Patients with (1) severe motion artifacts; (2) missing images; (3) low image quality; (4) absence of preoperative MR images | Histopathology | 549 |
| Cao et al. 2020 [29] | Patients with (1) the images of a four-phase DCE-CT examination; (2) FLLs confirmed by histopathological evaluation; (3) a diagnosis based on a combination of clinical and radiological findings with follow-up were collected for further screening | Patients with (1) lesions larger than 10 cm; (2) images with prominent artifacts; (3) prior local-regional therapy prior to the CT examination. | Histopathology, clinical diagnosis, and follow-up | 15,680 |
| Pan et al. 2019 [20] | NA | NA | Histopathology | 242 |
| Yamakawa et al. 2019 [21] | NA | NA | NA | 980 |
| Hamm et al. 2019 [23] | Patients who (1) were untreated; (2) underwent locoregional therapy more than one year ago and now presented with a residual tumor | Patients younger than 18 years | Histopathology | 296 |
| Brehar et al. 2020 [26] | NA | NA | NA | 268 |
| Stollmaye et al. 2021 [35] | Patients who were either histologically confirmed or exhibited typical characteristics of the given lesion type with MRI | Patients younger than 18 years | NA | 69 |
| Kutlu et al. 2019 [19] | NA | NA | NA | 345 |
| Amita et al. 2019 [22] | NA | NA | NA | 225 |
| Zheng et al. 2021 [36] | Patients with (1) the presence of cirrhosis; (2) lesion size ≤ 2 cm; (3) <1-month interval between MRI and pathological examination | Patients whose (1) examinations had not been performed using Philips Ingenia equipment; (2) had a history of extrahepatic malignant tumors; (3) a history of local treatment for HCC; (4) severe motion artifacts detected between DCE-MRI and DWI (>5 slices of misalignment). | Histopathology, imaging features | 120 |
| Jia et al. 2019 [24] | Patients who were diagnosed as HCC by pathology examination | NA | Histopathology | 99 |
| Hassan et al. 2017 [49] | NA | NA | NA | 110 |
| Yasaka et al. 2017 [50] | Patients with five categories of liver masses or mass-like lesions (hereafter, we will refer to these as liver masses unless otherwise specified) of any size that were diagnosed based on the criteria described in the next subsection: HCCs; malignant liver tumors other than classic and early HCCs; indeterminate masses or mass-like lesions; liver hem-angiomas; cysts | Patients who (1) had CT image sets with prominent artifacts; (2) had those liver masses treated with transarterial chemoembolization therapy or systemic chemotherapy, and those liver masses; (3) were younger than 20 years | Histopathology | 560 |
| Bharti et al. 2018 [51] | NA | NA | NA | 94 |
| Schmauch et al.2019 [52] | NA | NA | NA | 117 |
| Mitrea et al. 2019 [53] | NA | NA | NA | 300 |
| Wang et al. 2020 [54] | NA | NA | Histopathology | 235 |
| Kim et al. 2021 [55] | Patients who (1) had chronic hepatitis B or liver cirrhosis; (2) underwent multiphase CT, consisting of late arterial, portal venous, and delayed phases; (3) underwent liver MRI within four months of CT scans; and (4) had available standard references, including pathologic evaluation or follow-up images | NA | Histopathology and follow-up | 1086 |
| Căleanu et al. 2021 [56] | NA | NA | NA | 596 |
| Chen et al. 2021 [57] | NA | NA | NA | NA |
| Chen et al. 2022 [58] | NA | patients with (1) a history of previous treatment such as surgery or interventional therapy; (2) diffuse liver disease such as diffuse cirrhosis, diffuse-type HCC, or diffuse metastatic tumor; (3) images with severe artifacts or incomplete scanning | Histopathology and follow-up | 2189 |
| Xiao et al. 2022 [59] | NA | NA | NA | 135 |
| Phan et al. 2023 [60] | NA | NA | NA | 2000 |
| Khan et al. 2023 [61] | NA | NA | Histopathology | 68 |
| Feng et al. 2023 [62] | NA | NA | NA | 1241 |
| Xu et al. 2023 [63] | NA | NA | NA | 2333 |
| Kim et al. 2023 [64] | NA | NA | NA | 1062 |
| Roy et al. 2023 [65] | NA | NA | NA | 1080 |
| Balasubramanian et al. 2023 [66] | NA | NA | NA | NA |
| First Author and Year | Device | Exclusion of Poor Quality Imaging | Heatmap Provided | Methods Architecture | Type of Internal | External Validation | DL Versus Clinicians |
|---|---|---|---|---|---|---|---|
| Validation | |||||||
| Liu et al. 2023 [41] | MRI | NA | No | CNN-Oestmann, Inception v3, Densenet169, EfficientNet, VGG19, AlexNet, SFFNet | NA | No | No |
| Murtada et al. 2023 [42] | US | NO | No | ResNet152V2-559-Dense(128), densnet169-590-Dense(4096), densnet201-692-Dense(128) | cross-validation | No | No |
| Abhishek et al. 2023 [43] | CT | Yes | Yes | VGG, ResNet, DensNet, Inception v3, modified Inception v3 | NA | No | Yes |
| Anisha et al.2023 [44] | CT | Yes | No | densenet201, InceptionResnetV2 | NA | yes | No |
| Huang et al. 2023 [45] | CT | Yes | No | CSAM-Net, SE-Net | ten-fold cross-validation | No | No |
| Zhang et al. 2023 [47] | CT | Yes | No | MIDC-net | NA | No | No |
| Mitrea et al. 2023 [46] | US | No | No | ResNet101, InceptionV3, EfficientNet_b0, EfficientNet_ASPP, ConvNext_base | NA | No | No |
| Wang et al. 2023 [48] | CT | Yes | No | VGG16, VGG19, EI-CNNet, Inception V3, Xception, CNN | NA | No | No |
| Ling et al. 2022 [38] | CT | Yes | Yes | 3D ResNet | five-fold cross-validation | No | Yes |
| Cao et al. 2022 [39] | CT | No | No | CNN | NA | No | No |
| Zhang et al. 2022 [40] | US | No | No | Xception, MobileNet, Resnet50, DenseNet121, InceptionV3 | five-fold cross-validation | Yes | No |
| Gao et al. 2021 [30] | CT | Yes | No | CNN, RNN | five-fold cross-validation | Yes | Yes |
| Oestmann et al. 2021 [34] | MRI | Yes | No | CNN | Monte Carlo cross-validation | No | No |
| Wang et al. 2021 [31] | CT | Yes | Yes | HCCNet | NA | Yes | Yes |
| Wang et al. 2021 [33] | MRI | Yes | No | 2D Densent121 | five-fold cross-validation | No | No |
| Wang et al. 2021 [37] | MRI | Yes | Yes | 3D ResNet-18 | five-fold cross-validation | No | Yes |
| Zhou et al. 2021 [32] | US | Yes | Yes | Resnet 18 | NA | No | No |
| Shi et al. 2020 [27] | CT | NA | No | MP-CDNs | NA | No | No |
| Zhen et al. 2020 [25] | MRI | Yes | Yes | Google Inception-ResNet V2 | five-fold cross-validation | Yes | Yes |
| Kim et al. 2020 [28] | MRI | Yes | No | CNN | NA | Yes | Yes |
| Cao et al. 2020 [29] | CT | NA | Yes | MP-CDN | NA | No | No |
| Pan et al. 2019 [20] | US | NA | No | 3D-CNN, DCCA-MKL | ten-fold cross-validation | No | No |
| Yamakawa et al. 2019 [21] | US | NA | No | VGGNet | cross-validation | No | No |
| Hamm et al. 2019 [23] | MRI | Yes | No | CNN | Monte Carlo cross-validation | No | Yes |
| Brehar et al. 2020 [26] | US | NA | No | VGGNet, ResNet, InceptionNet, DenseNet, SqueezeNet, Multi-Resolution CNN | NA | No | No |
| Stollmaye et al. 2021 [35] | MRI | NA | Yes | DenseNet264 | five-fold cross-validation | No | No |
| Kutlu et al. 2019 [19] | CT | NA | No | CNN-DWT-LSTM | three-fold cross-validation | No | No |
| Amita et al. 2019 [22] | CT | NA | Yes | DNN | Monte Carlo cross-validation | No | Yes |
| Zheng et al. 2021 [36] | MRI | NA | No | PM-DL | NA | No | No |
| Jia et al. 2019 [24] | MRI | NA | Yes | ResNet | NA | No | No |
| Hassan et al. 2017 [49] | US | Yes | No | SSAE | ten-fold cross-validation | No | No |
| Yasaka et al. 2017 [50] | CT | No | No | CNN | NA | No | No |
| Bharti et al. 2018 [51] | US | No | No | CNN | cross-validation | No | No |
| Schmauch et al.2019 [52] | US | No | Yes | ResNet50 | three-fold cross-validation | No | No |
| Mitrea et al. 2019 [53] | US | No | No | CNN | five-fold cross-validation | No | No |
| Wang et al. 2020 [54] | CT | No | Yes | SCCNN | NA | No | No |
| Kim et al. 2021 [55] | CT | Yes | Yes | R-CNN | NA | No | No |
| Căleanu et al. 2021 [56] | US | Yes | No | CNN | five-fold LOPO cross-validation | No | No |
| Chen et al. 2021 [57] | CT | NA | No | SED | NA | No | No |
| Chen et al. 2022 [58] | CT | NA | No | CNN | NA | No | No |
| Xiao et al. 2022 [59] | MRI | NA | No | CNN | five-fold cross-validation | No | No |
| Phan et al. 2023 [60] | CT | NA | No | R-CNN | cross-validation | No | No |
| Khan et al. 2023 [61] | CT | No | Yes | CNN | NA | No | No |
| Feng et al. 2023 [62] | US | No | No | Resnet50 | five-fold cross-validation | No | No |
| Xu et al. 2023 [63] | CT | No | Yes | MCCNet | NA | No | No |
| Kim et al. 2023 [64] | US | No | No | 3D-CNN, CNN-LSTM | ten/five-fold cross-validation | No | No |
| Roy et al. 2023 [65] | CT | Yes | No | CNN | ten-fold cross-validation | No | No |
| Balasubram-anian et al. 2023 [66] | CT | No | No | R-CNN | NA | No | No |
Disclaimer/Publisher’s Note: The statements, opinions and data contained in all publications are solely those of the individual author(s) and contributor(s) and not of MDPI and/or the editor(s). MDPI and/or the editor(s) disclaim responsibility for any injury to people or property resulting from any ideas, methods, instructions or products referred to in the content. |
© 2023 by the authors. Licensee MDPI, Basel, Switzerland. This article is an open access article distributed under the terms and conditions of the Creative Commons Attribution (CC BY) license (https://creativecommons.org/licenses/by/4.0/).
Share and Cite
Wei, Q.; Tan, N.; Xiong, S.; Luo, W.; Xia, H.; Luo, B. Deep Learning Methods in Medical Image-Based Hepatocellular Carcinoma Diagnosis: A Systematic Review and Meta-Analysis. Cancers 2023, 15, 5701. https://doi.org/10.3390/cancers15235701
Wei Q, Tan N, Xiong S, Luo W, Xia H, Luo B. Deep Learning Methods in Medical Image-Based Hepatocellular Carcinoma Diagnosis: A Systematic Review and Meta-Analysis. Cancers. 2023; 15(23):5701. https://doi.org/10.3390/cancers15235701
Chicago/Turabian StyleWei, Qiuxia, Nengren Tan, Shiyu Xiong, Wanrong Luo, Haiying Xia, and Baoming Luo. 2023. "Deep Learning Methods in Medical Image-Based Hepatocellular Carcinoma Diagnosis: A Systematic Review and Meta-Analysis" Cancers 15, no. 23: 5701. https://doi.org/10.3390/cancers15235701