A Novel Approach to Droplet’s 3D Shape Recovery Based on Mask R-CNN and Improved Lambert–Phong Model


1
School of Mechanical, Electrical &Information Engineering, Shandong University at Weihai, Weihai 264209, China
2
School of Mechatronics Engineering, Shanghai Jiao Tong University, Shanghai 201100, China
*
Author to whom correspondence should be addressed.
Micromachines 2018, 9(9), 462; https://doi.org/10.3390/mi9090462
Submission received: 25 August 2018
/
Revised: 10 September 2018
/
Accepted: 11 September 2018
/
Published: 13 September 2018
(This article belongs to the Section A:Physics)
Abstract
:Aiming at the demand for extracting the three-dimensional shapes of droplets in microelectronic packaging, life science, and some related fields, as well as the problems of complex calculation and slow running speed of conventional shape from shading (SFS) illumination reflection models, this paper proposes a Lambert–Phong hybrid model algorithm to recover the 3D shapes of micro-droplets based on the mask regions with convolutional neural network features (R-CNN) method to extract the highlight region of the droplet surface. This method fully integrates the advantages of the Lambertian model’s fast running speed and the Phong model’s high accuracy for reconstruction of the highlight region. First, the Mask R-CNN network is used to realize the segmentation of the highlight region of the droplet and obtain its coordinate information. Then, different reflection models are constructed for the different reflection regions of the droplet, and the Taylor expansion and Newton iteration method are used for the reflection model to get the final height of all positions. Finally, a three-dimensional reconstruction experimental platform is built to analyze the accuracy and speed of the algorithm on the synthesized hemisphere image and the actual droplet image. The experimental results show that the proposed algorithm based on mask R-CNN had better precision and shorter running time. Hence, this paper provides a new approach for real-time measurement of 3D droplet shape in the dispensing state.
1. Introduction
In the process of microelectronic high-speed dispensing, detecting the 3D shape of droplets online is a necessary precondition for studying the micro-jetting effect and realizing adaptive control of the dispensing process [1,2,3,4]. There is also a huge demand for detecting the 3D shapes of droplets online in many other areas. For example, it is also useful for the droplets formed by microfluidic chips for biological and biomedical applications [5,6,7,8]. 3D shape detection enables the microfluidic chip to control the volume of the droplets more precisely, thereby improving the accuracy of the entire system. However, due to the high viscosity and non-Newtonian behavior of most types of adhesives, the tipping, tailing, and unevenness of the substrate leads to irregular shapes. For the conventional stereo vision method and the structured light approach, problems such as poor real-time performance, low precision, and difficulty in compatibility arise [9,10]. In this context, the use of three-dimensional vision to reconstruct the 3D shape of droplets emerges as a reliable method. The three-dimensional reconstruction method based on monocular vision can be used to derive depth information according to the two-dimensional features of single or multiple images [11]. For example, shape from shading (SFS), proposed by Horn, can be used to reconstruct a three-dimensional model of the object using a single gray image [12]. In comparison with binocular or multi vision, it has the advantages of small calculation, high efficiency, simple operation, and low hardware requirement. Hence, it provides a new approach to solve the problem of the online detection of high-viscosity micro-droplet surface topography. However, for this method, choosing an appropriate illumination reflection model is a problem that must be solved first.
Conventional SFS technology usually adopts a Lambertian model. However, while methods based on the Lambertian model have a high solution speed, the Lambertian model only considers the diffuse reflection component and does not consider the influence of the specular component. Therefore, a large error arises in describing the highlight region, which is not effective for the reconstruction of the 3D shape of droplets. In recent years, some scholars have studied many non-Lambert surfaces for SFS. For example, Phong established a hybrid model which takes specular reflection into account. Although the model has higher recovery accuracy, it runs more slowly [13]. Lee and Kuo suggested a generalized reflectance map model, which is a linear combination of a Lambertian model and a Torrance–Sparrow model for the diffuse reflection and specular reflection [14]. Ahmed and Farag used the Ward model to describe the SFS problem of hybrid surfaces [15]. Oren and Nayar proposed a more accurate Oren–Nayar reflection model based on the Lambertian reflection model, which is closer to the actual reflection characteristics [16]. Based on the Phong model, Breuß proposed the perspective Phong-based SFS (P2SFS) model, which is more in line with the camera's perspective imaging characteristics [17]. Yang replaced the ideal Lambertian model with a radial basis function (RBF) reflection model and used neural networks to solve the problem of nonlinear equations [18]. Wang linearly combined the Oren–Nayar model with the Ward model as the final hybrid reflection model, and used the numerical Hamiltonian and first-order and high-order fixed-point iterative sweeping method to solve the static Hamilton–Jacobi equation [19]. The above-mentioned hybrid illumination models effectively improve the Lambertian model’s low accuracy in the recovery of the specular reflection region. However, these models do not effectively deal with the difference between the diffuse reflection component and the specular reflection component in different regions. Besides, using the same algorithm to reconstruct the shape may lead to complexity of the calculation and slow convergence rate. Therefore, from the perspective of combinatorial optimization, combining the characteristics of each algorithm, this paper proposes a Lambert–Phong combination model that uses the Lambertian model and the Phong model to reconstruct the shape of the diffuse and highlight regions, respectively. The first step of this method is to identify the highlight regions.
In recent years, the popular highlight detection methods mainly include analysis based on chromaticity or polarization analysis of light. For example, Wolff used the difference between specular and diffuse reflection characteristics for highlight region detection [20]. Nayar used color information and polarization information to estimate highlight regions. However, many of these methods cannot be applied to the SFS algorithm [21]. In addition, Alsalsh applied a hybrid color attributes and wavelet-based edge projection approach to accurately identify the affected regions [22]. However, the detection of the highlight region is still incomplete, and reconstructing highlight region’s 3D shape still lacks accuracy.
Recently, more and more researchers have applied improved convolutional neural networks (CNNs) to classify and predict objects at the pixel level [23,24,25]. From fully convolutional networks (FCNs), Fast R-CNN (regions with convolutional neural network features), to Faster R-CNN [26,27,28], the running time and accuracy have been continuously improved. However, they are yet to be further improved. In this context, the latest Mask R-CNN combines the existing Faster R-CNN and FCN technologies to add a parallel branch for predicting the target mask on its existing branch for border recognition [29]. It greatly improves the accuracy of recognition and classification at pixel-level.
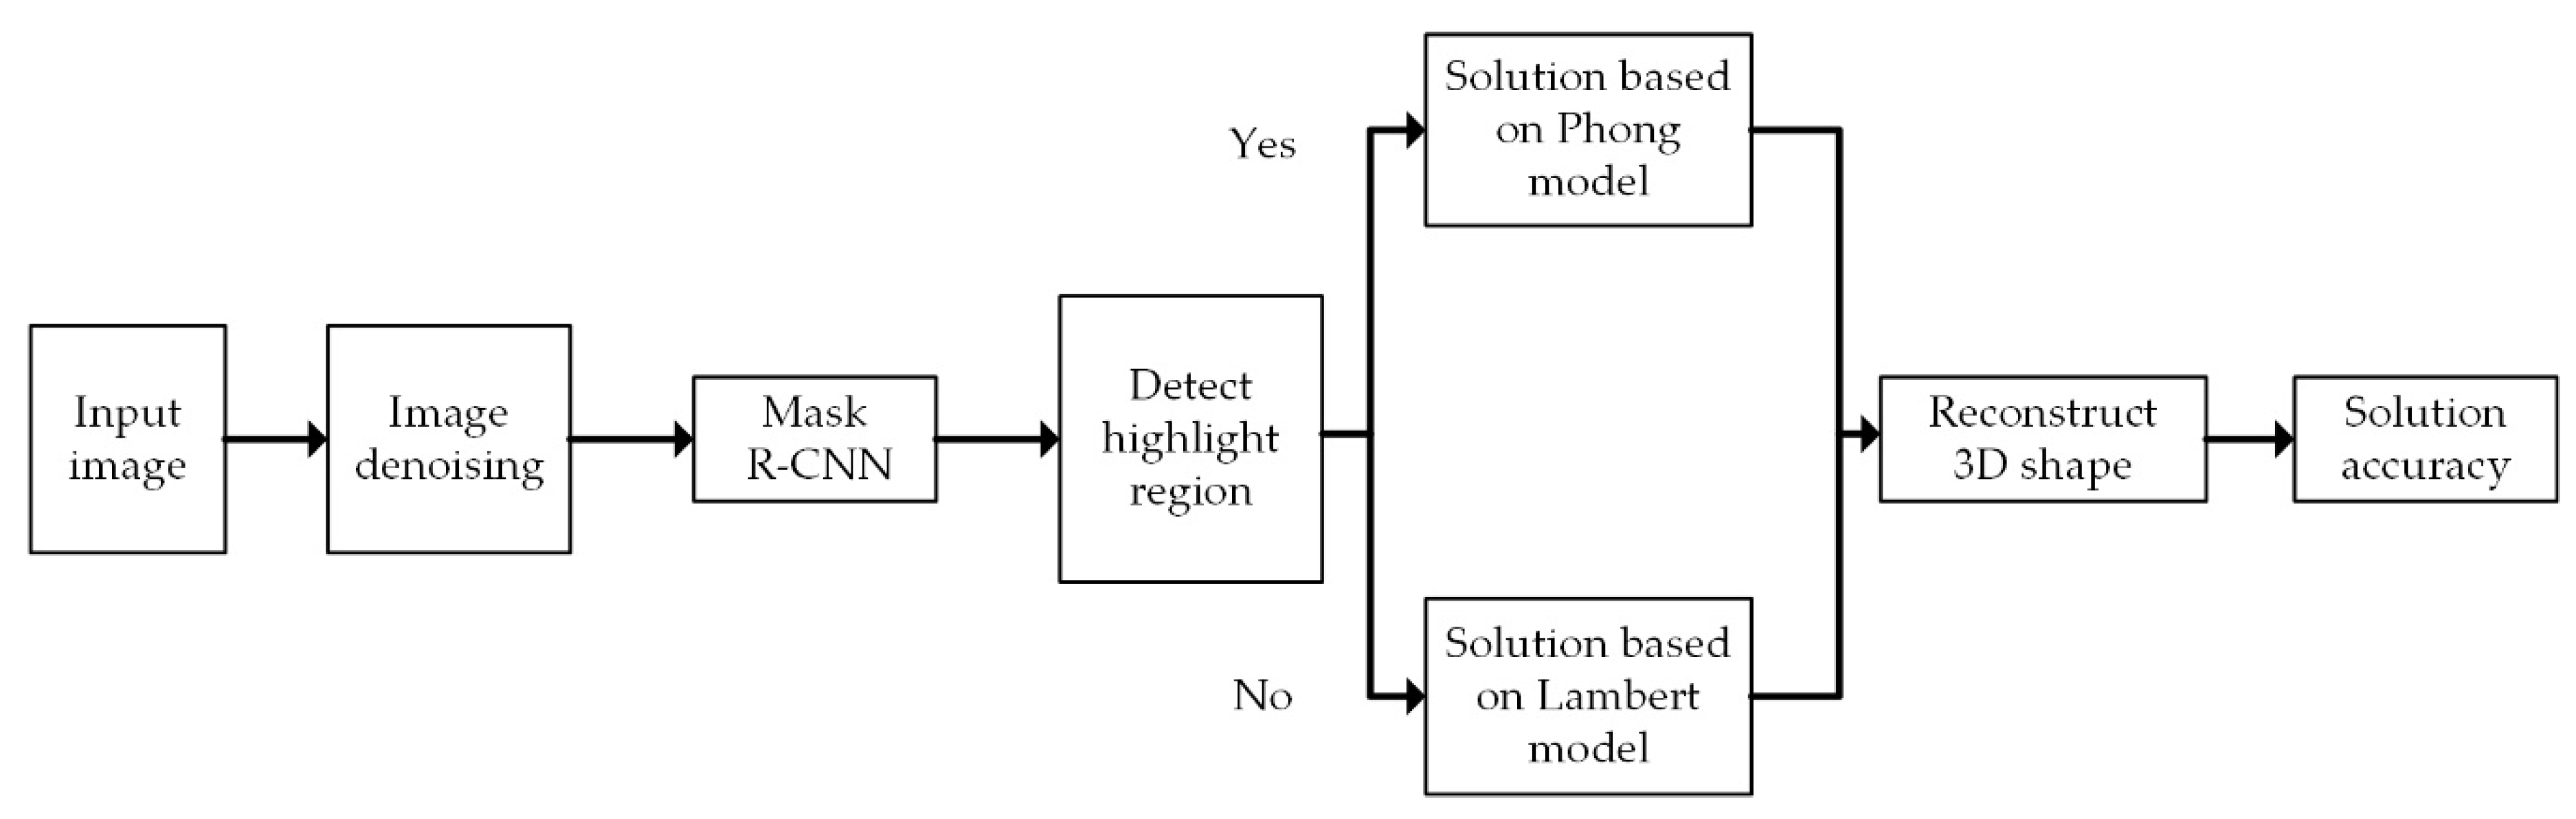
Therefore, according to the demand of 3D shape recovery of droplets in the field of microelectronic packaging, the Mask R-CNN method is applied for highlight region segmentation in this paper by considering the problem of slow speed in calculation in the conventional SFS hybrid reflection method. The Lambert–Phong hybrid reflection model is proposed, combining the advantages of the fast solution speed of the Lambertian method and the high accuracy of the Phong method at the highlight region. First, the algorithm denoises the input droplets image. Then, the Mask R-CNN depth learning neural network is used to perform highlight area segmentation, so as to obtain the highlight area coordinates for the next step. Next, the optimization algorithm is linearized to the highlight region and non-highlight region at the pixel level. Then, the two parts are combined to realize the 3D shape reconstruction of the droplet. Finally, the precision and running speed of the composite image and the real image are analyzed, respectively. The algorithm flow is shown in Figure 1.
2. Highlight Region Segmentation Based on Mask R-CNN
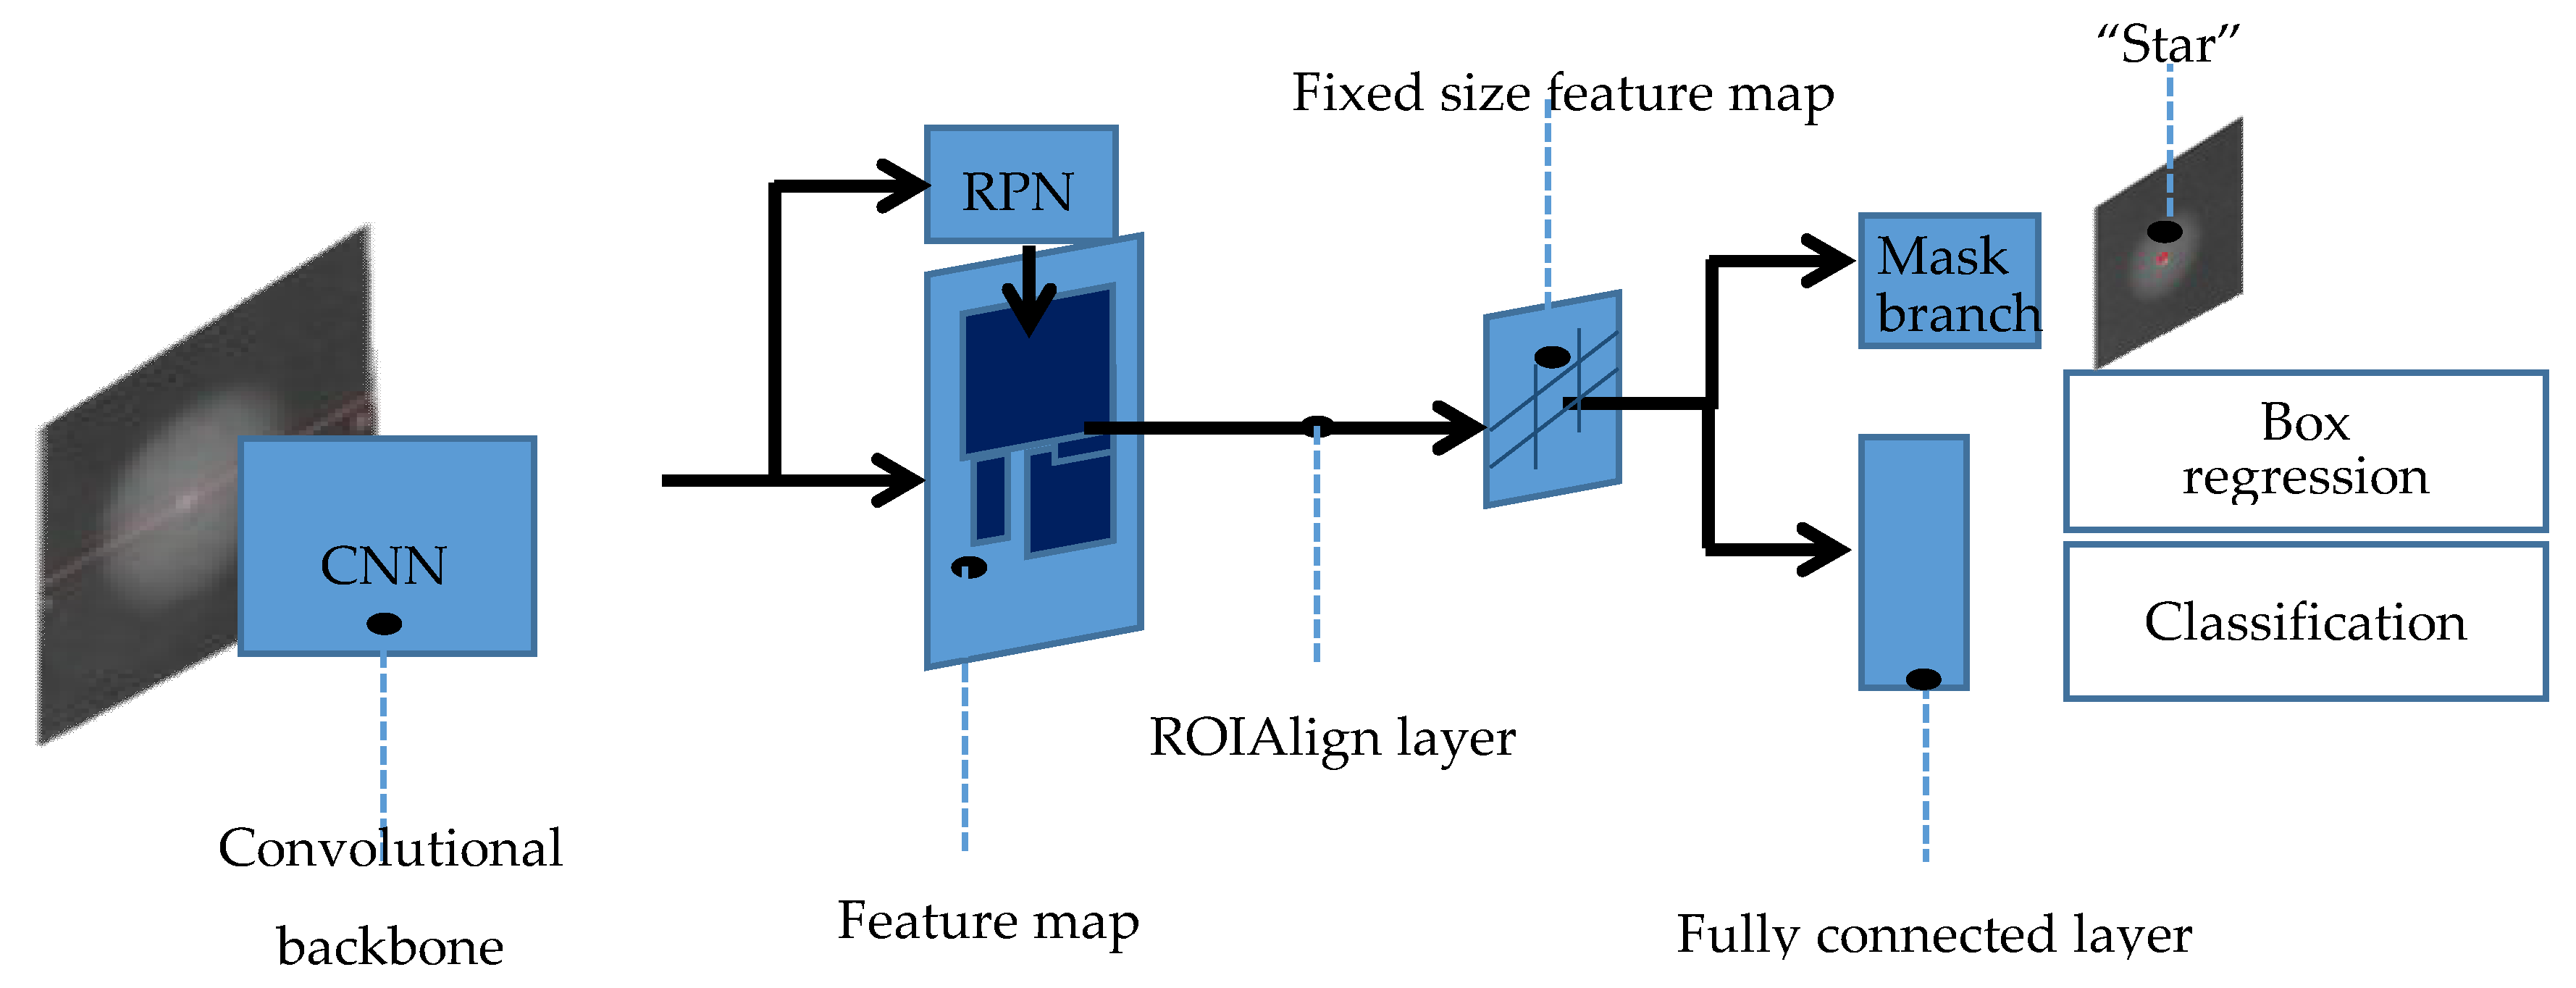
Mask R-CNN is a conceptually simple and flexible method for object instance segmentation that uses the same first half portion of the program as Faster R-CNN: a region proposal network (RPN) is utilized for region of interest extraction [30]. While predicting the box offset and class for each region of interest, it outputs a binary mask. This method does not require a compression operation as Faster R-CNN does. Note that the FCN can be applied to each region of interest (ROI) for the prediction of a segmentation mask, since the mask directly represents the correspondence between pixels by convolution. Figure 2 shows the specific flow of this method:
- Input of the normalized image into the main networkTo facilitate the generation of the mask, the fixed 512 × 512 images are input into the network [31], which have undergone median filtering and normalization.
- Feature extraction and generation of regions of interestThe image is sent to the main network to extract the data, and then the region proposal network is used to find the region of interest. Subsequently, a layer called ROIAlign is adopted that accurately aligns the extracted features with the input to improve the accuracy of the object mask.
- Proposing the box offset, the class, and the maskA n × n sliding window is used to generate a one-dimensional fully connected feature in the fifth convolutional layer of the network. Ultimately there are three branches generated [32], which contain the information to predict: reg-layer, cls-layer, and object mask. Thence, the first two branches are used for bounding-box classification and regression in parallel. The third branch is used to output the binary mask of the highlight feature called “Star”.
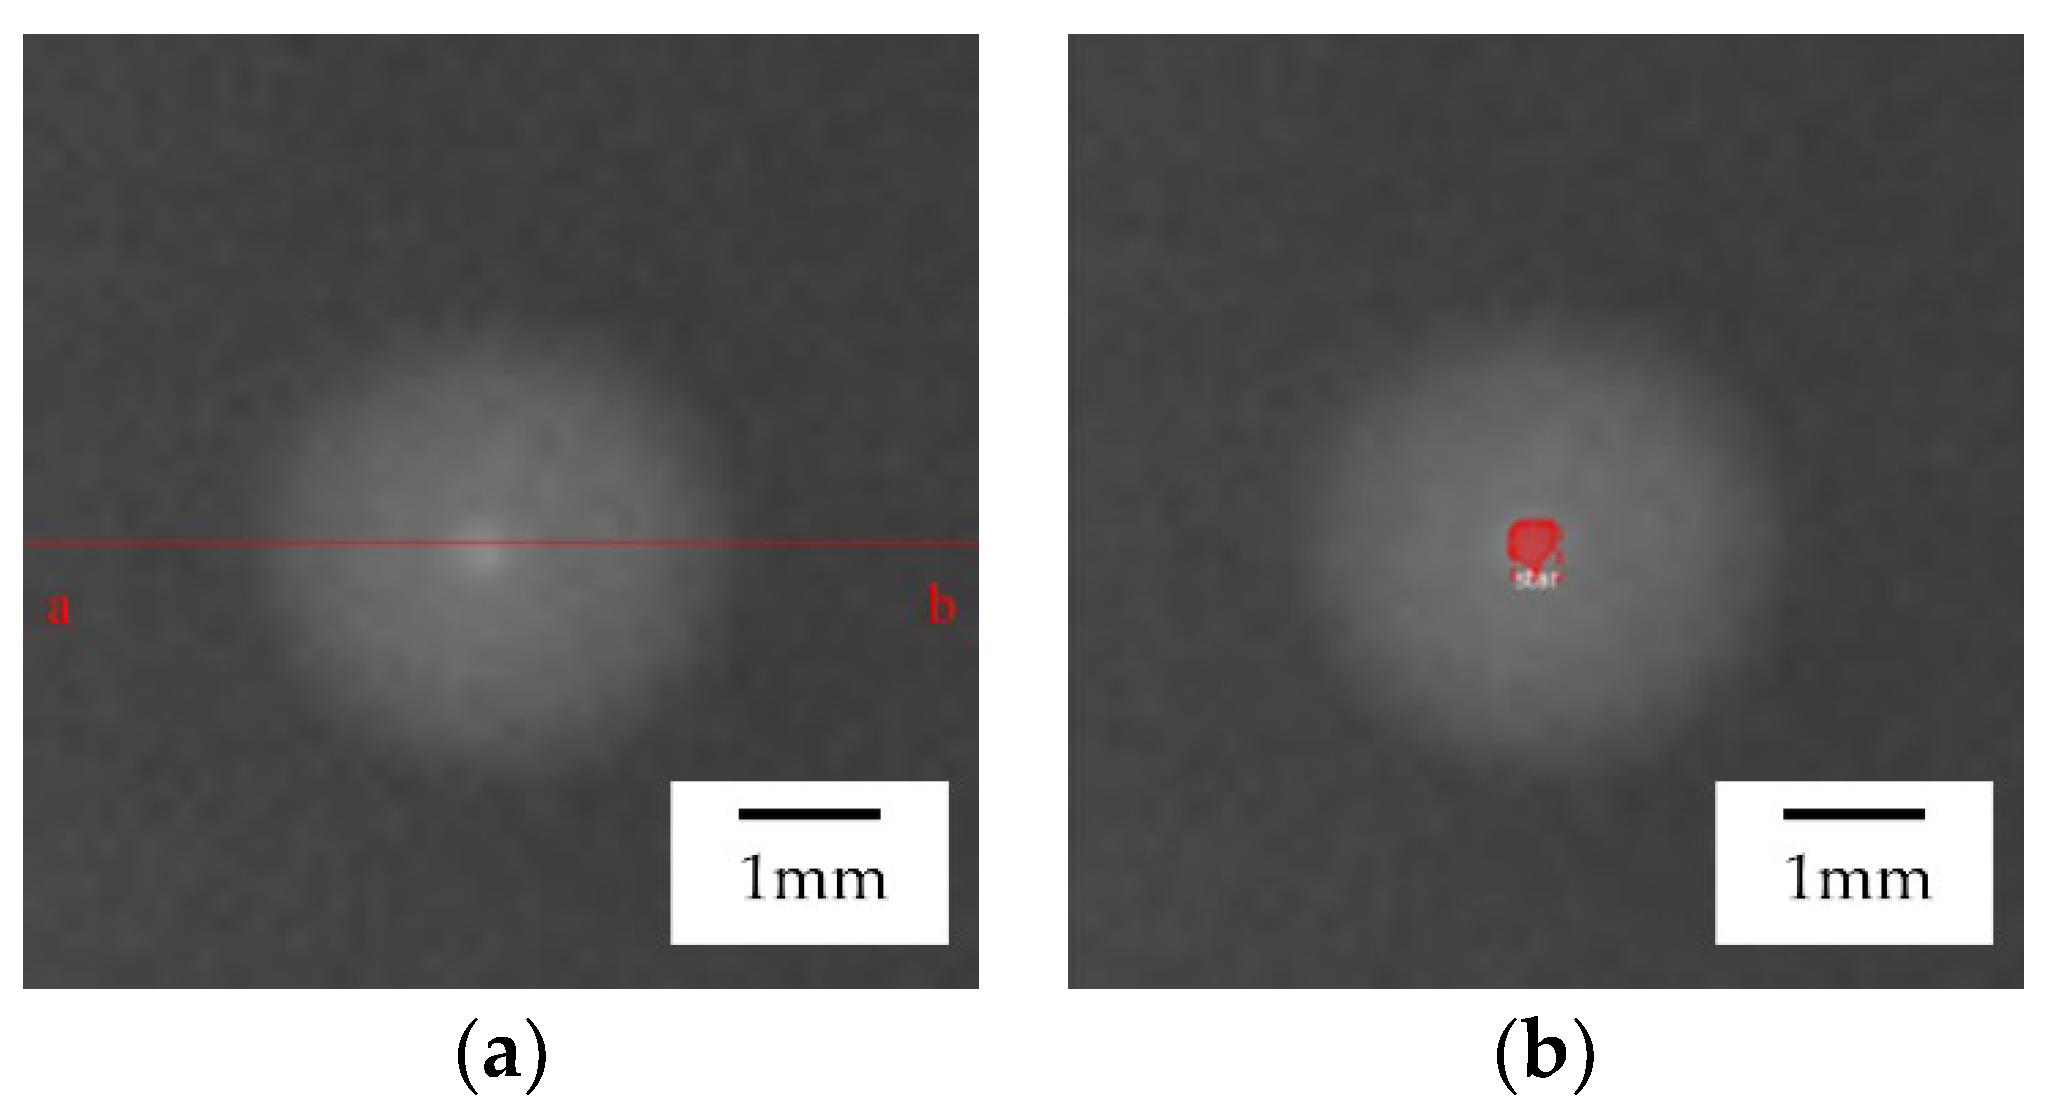
With completion of the Mask R-CNN training, the test image is input into the network, and then it is feasible to obtain and output the highlight position information. Finally, the diffuse reflection area and the highlight area of the droplet to be tested can be spotted. Clearly, the red area in Figure 3 is the highlight area identified by the experiment.
3. 3D Shape Recovery Based on Combined Optimization Model
In the case of an ideal diffuse reflector, the effects of diffuse reflection components are idealistically considered. The reflection model is as follows [33]:
where is the position of the corresponding pixel, is the gradient information of the image pixels, is the Lambertian model reflection function, is the luminance information of the image after normalization, and is the surface reflection coefficient of the diffuse reflection component.
In fact, most object surface reflections can be considered as a linear combination of diffuse and specular components, since they both exist on the surface of the object. This relationship is precisely described by the Phong model:
where and are the surface reflection coefficients of the diffuse and specular components, respectively, is the smoothing factor, is the specular reflection factor, is the direction vector of the light source, and is the source direction vector—the direction vector on the intersection of the light source and the camera.
It is obvious that the equation adds the specular component compared with the Lambertian reflection model. Then, we combine the two models and propose in the model as a highlight factor to obtain an optimized model:
where corresponds to the highlight region, and then Phong model is used. corresponds to the diffuse reflection region, and then the Lambertian reflection model is used.
Therefore, Equation (3) is used to calculate and identify different regions of the Lambert–Phong hybrid model. It is applicable to solve the Lambertian model by using the linearization method in the diffuse reflection region:
Then, Taylor expansion is applied:
Therefore, the following equation can be obtained:
Therefore, when given the initial value, iterative calculation can be performed to obtain the final iteration result called , which is the height of each point in the images. Similarly, the Phong hybrid model is used to solve the highlight region.
Because , , , the original equation is corrected by introducing the image gradient weighting coefficient: .
Then, the following equation is obtained:
where
A new expression of the objective function can be obtained based on the central difference of the discretization of the target equation.
With the acquisition of this equation, the Newton iteration method is used to solve the value of the height z, and its equation structure is similar to the Lambertian linear method.
Finally, the following equation is established:
where is the harmonic coefficient of the pixel, which is generally set as 1/13. With the completion of the Newton iteration, the convergence value is obtained, which is the final height of the 3D contour solved based on the Phong hybrid reflection model.
Finally, the height value solved by the optimization algorithm of this paper is obtained by combining the height values obtained by the two models:
4. Three-Dimensional Shape Recovery Based on Combined Optimization Model
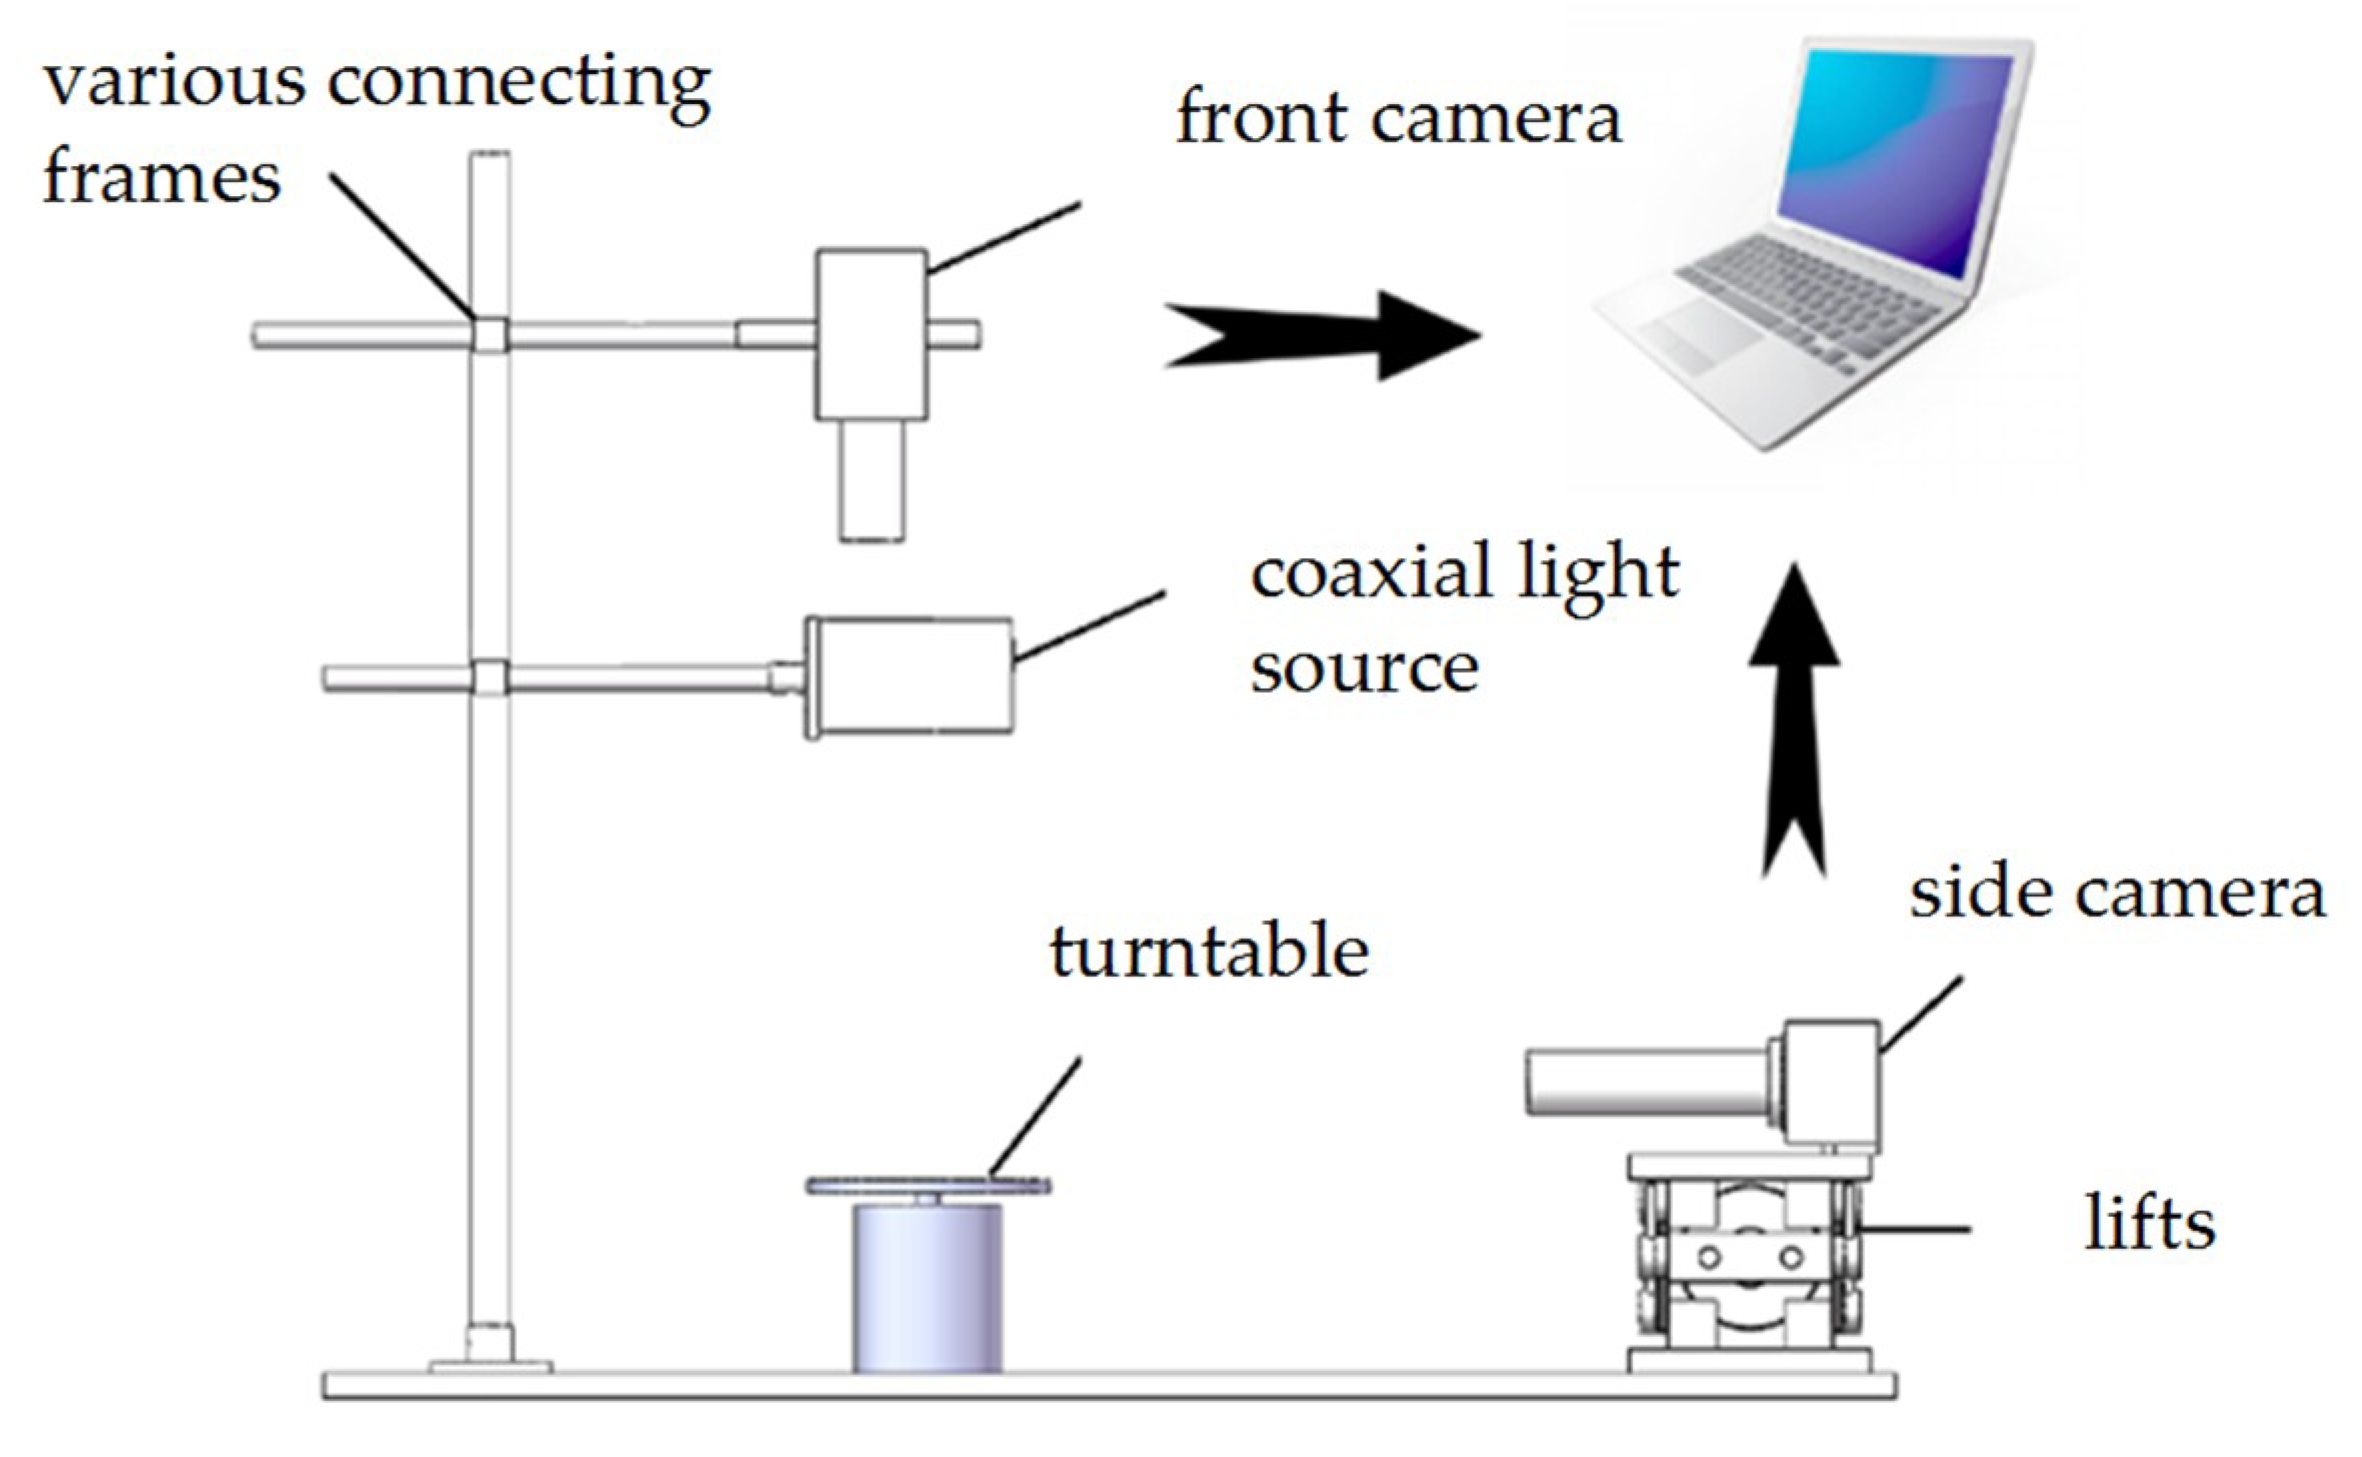
As shown in Figure 4, the droplet image acquisition experimental platform designed in this paper was mainly composed of a front camera, a coaxial light source, a turntable, and a side camera for precision calibration, power supply, computer, and various connecting frames.
In order to facilitate the experiment, the droplet was placed on the center of the turntable, and the positions of the light source and the camera were adjusted to make it perpendicular to the turntable. Meanwhile the position of the side camera was adjusted to make it parallel to the turntable. The side camera was used to collect the positive side image of the droplet, and it was assumed to be the theoretical height data for the side view of the droplet. The theoretical height data of the side view of the droplet were used for comparison with the height data reconstructed by the algorithm and as the final experimental data accuracy evaluation standard.
4.1. Precision Analysis of Synthetic Image
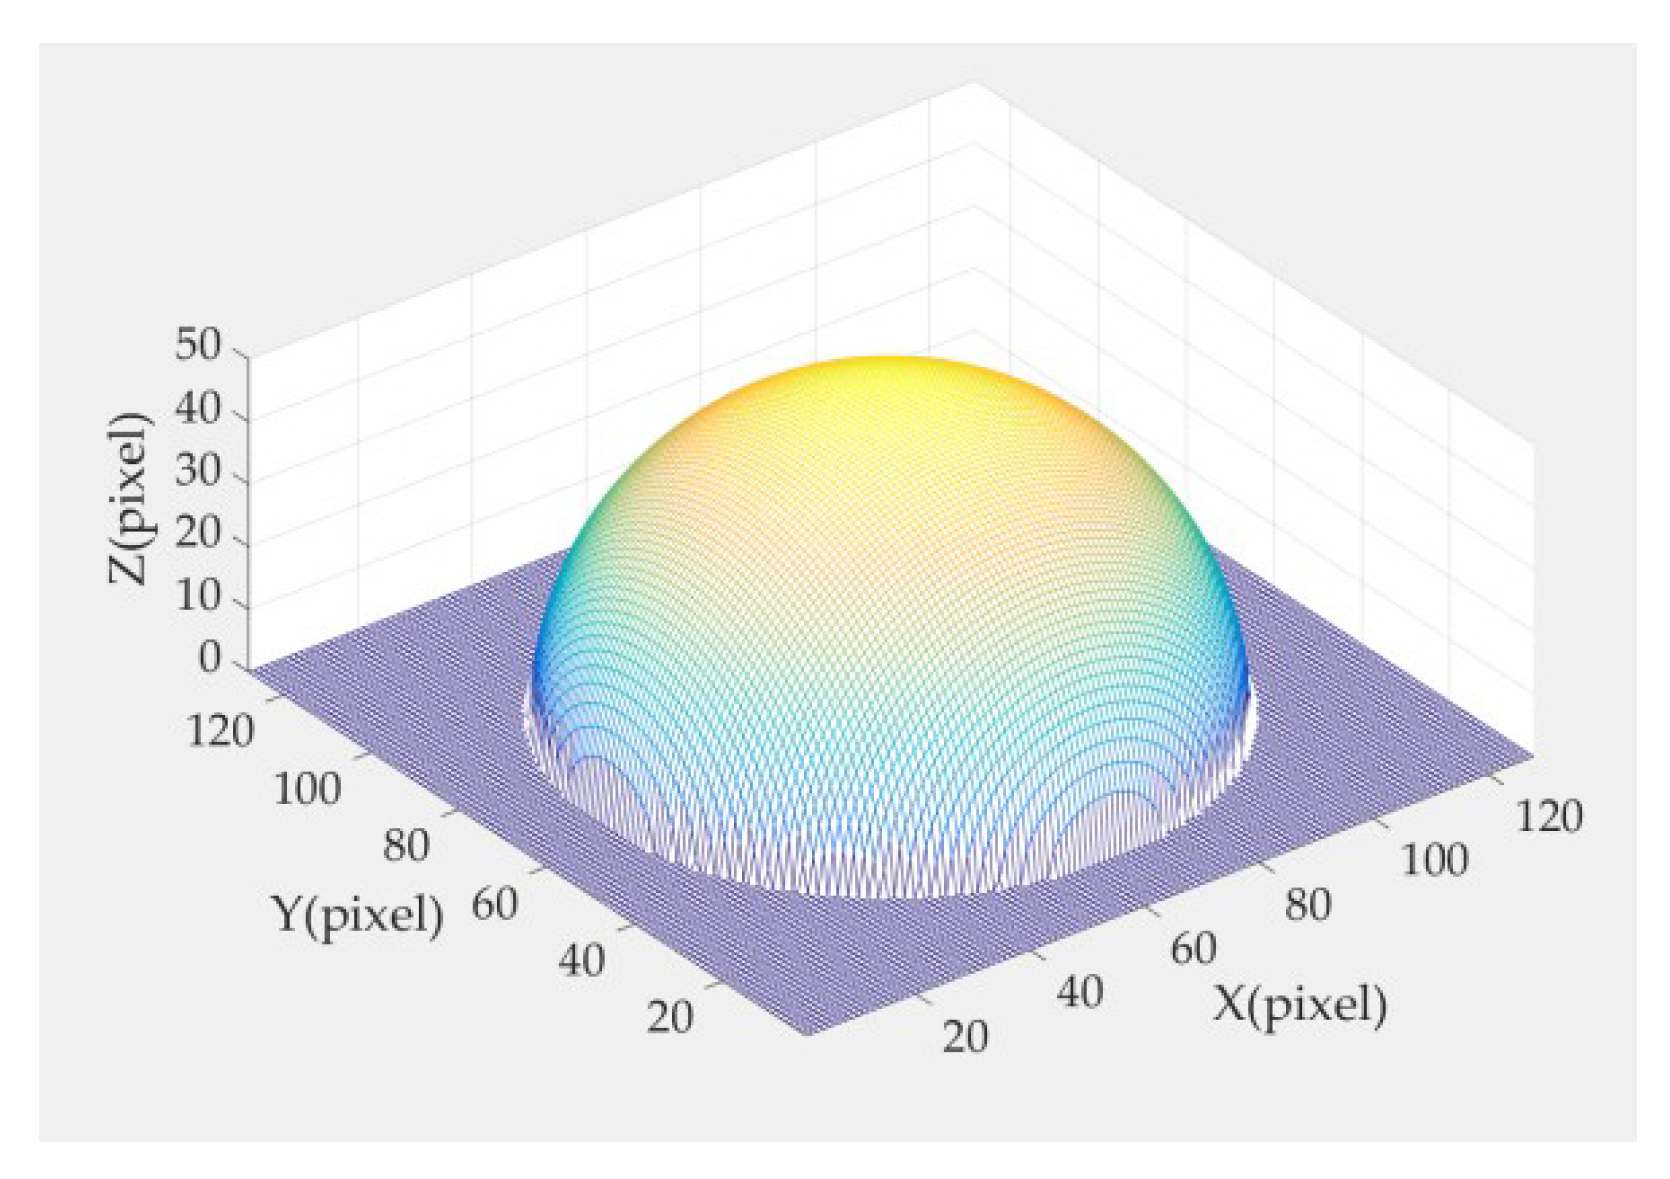
It is difficult to detect the 3D shape of a real image. Therefore, the composite image was first to be tested. In this section, the composite hemisphere is used for 3D reconstruction. The equation for the hemisphere is as follows:
where is the position coordinate of the center of the ball, z is the height of the corresponding position , and r is the radius. Here, we assign r = 50 pix. The composite hemisphere is shown in Figure 5.
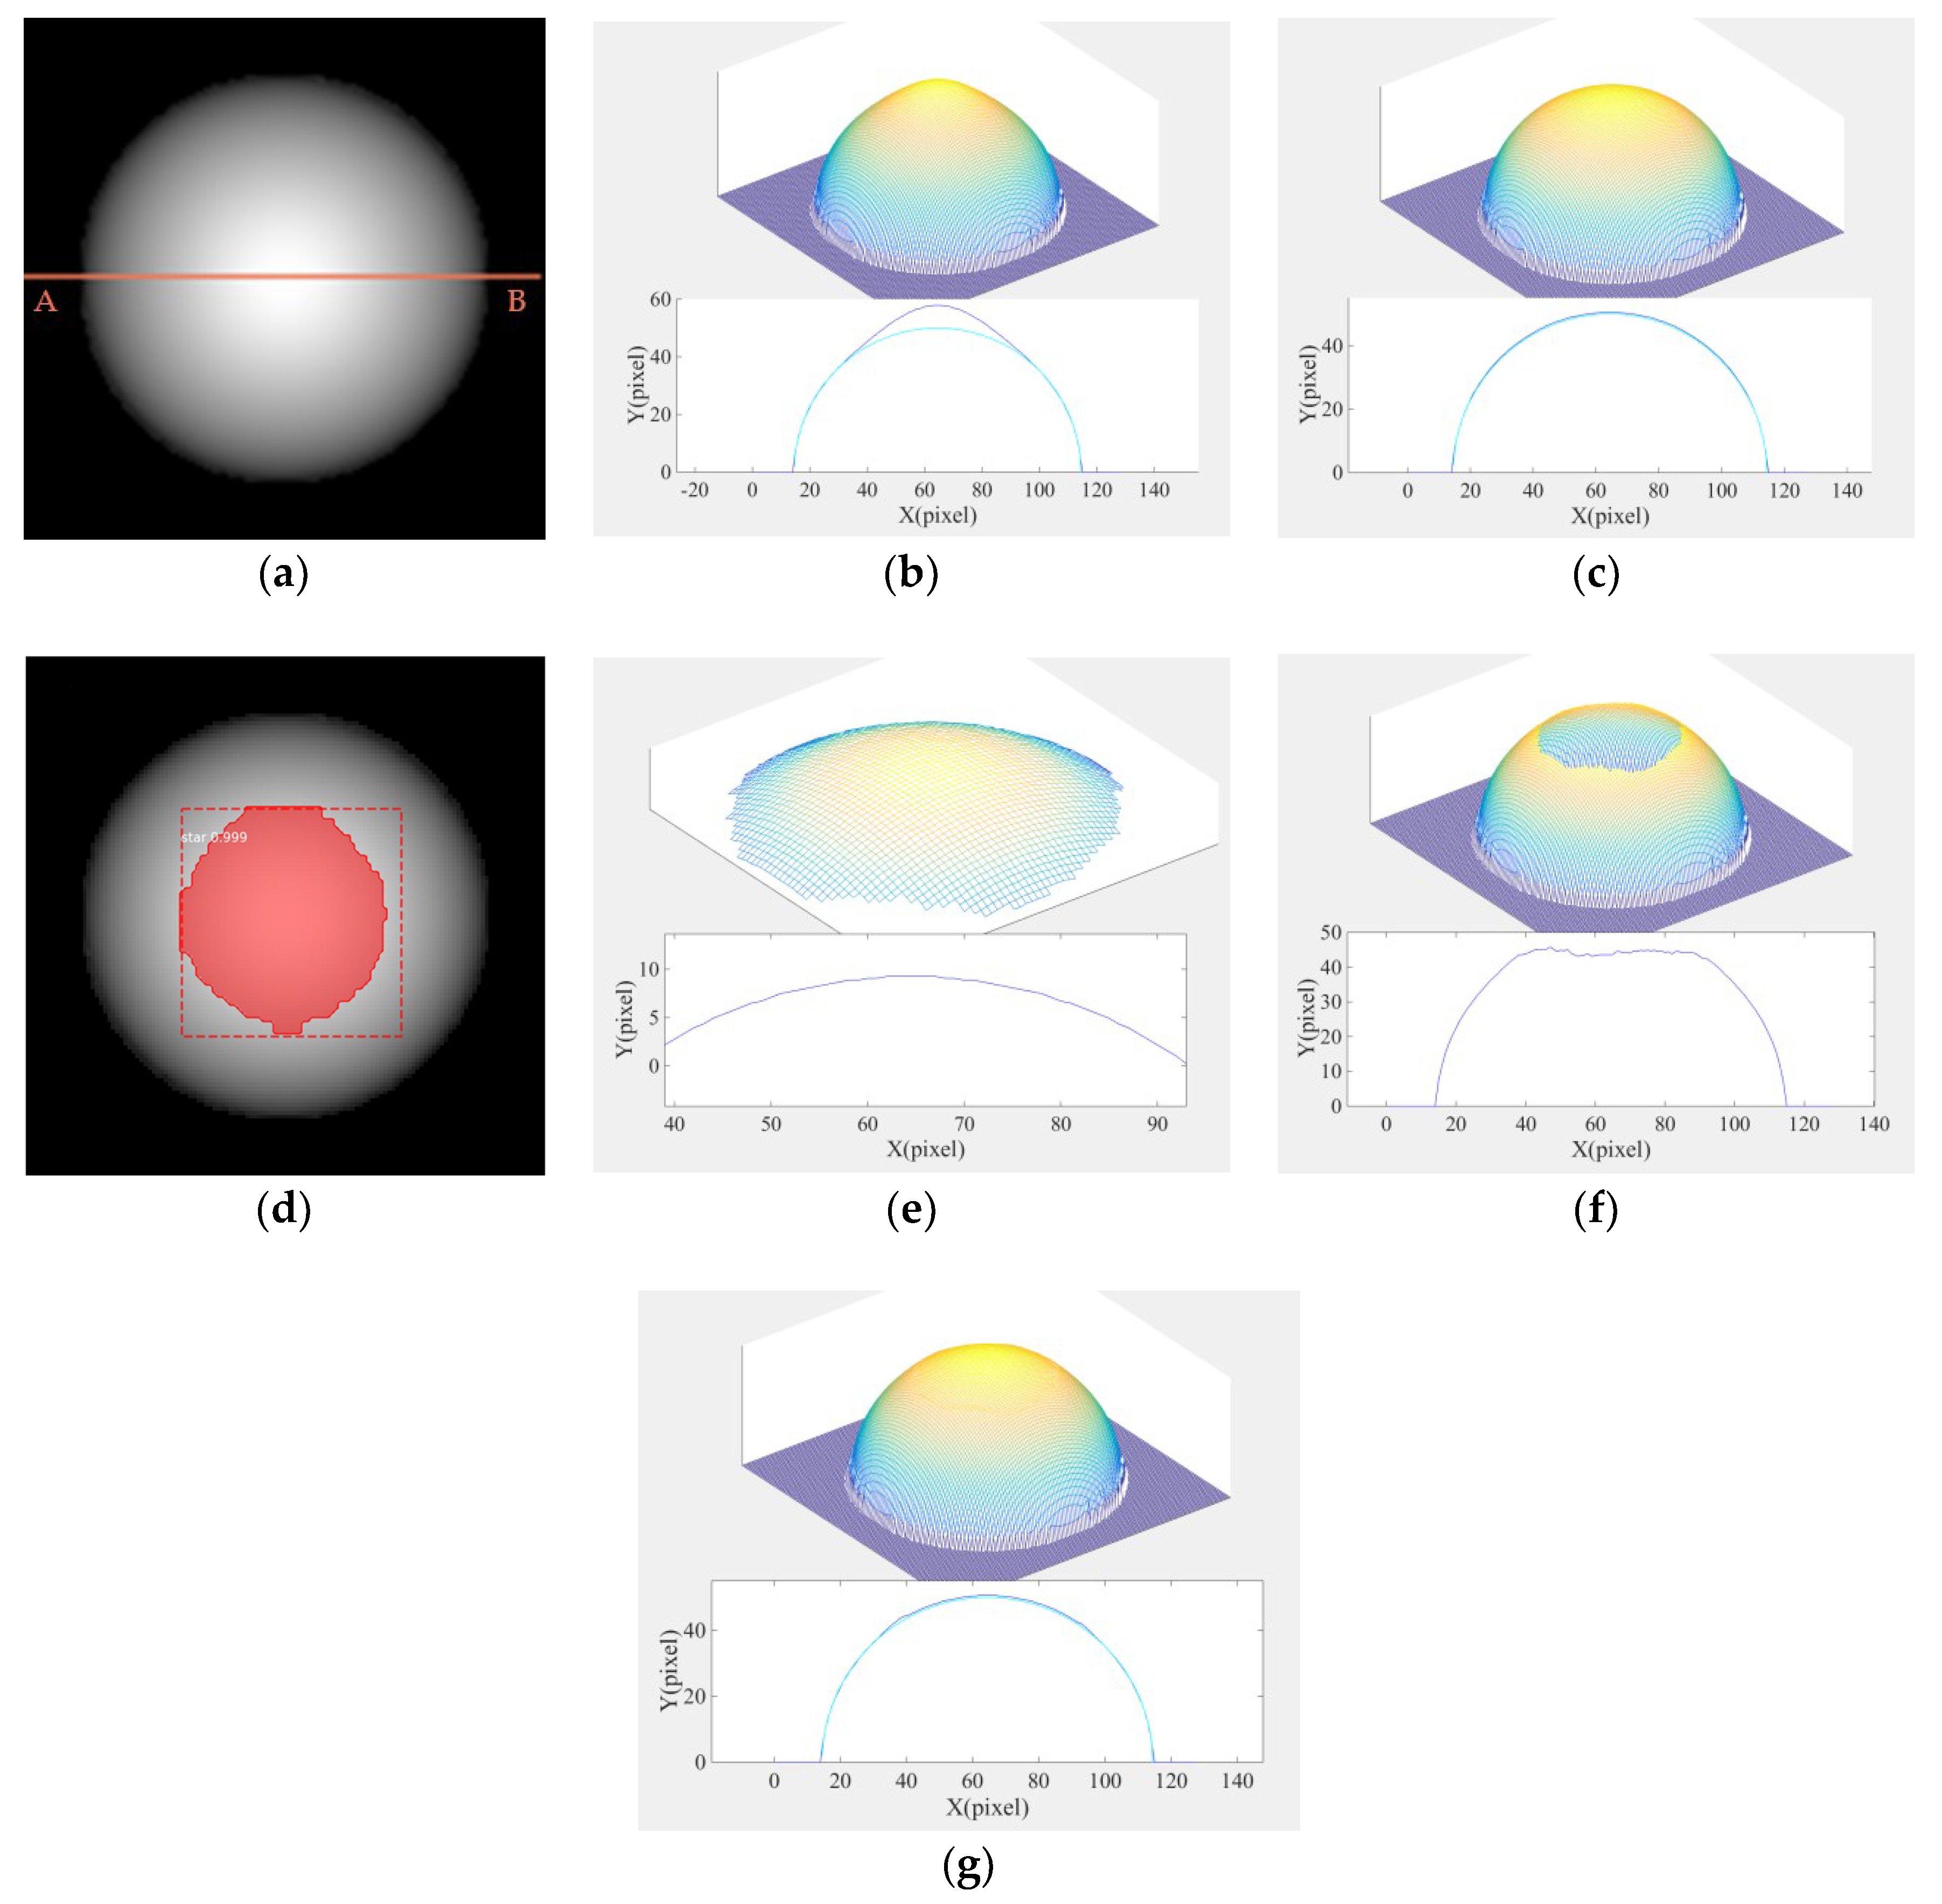
Figure 6a is a grayscale image corresponding to 14.3% high gloss. The parameters were as follows: , w = 0.5, , , . The direction of the light source was (0, 0, −1).
As shown in Figure 6b, the Lambertian reflection model was sensitive to highlight regions—even in the composite map there was a distortion district. However, the reconstruction effect was better in the diffuse reflection region. Figure 6c illustrates that the linearization of the Phong model was effective, and therefore could effectively deal with the highlight regions. However, it consumed too much time. Therefore, in this paper, based on the combination optimization, Mask R-CNN was used to segment the highlight region of the composite image as shown in Figure 6d. The coordinate information after segmentation can be used by the 3D shape reconstruction algorithm to improve the accuracy of reconstruction.
We solved the linearization of the Phong model for the highlight region and the linearization of the Lambertian model for the non-highlight region, respectively. The results of the three-dimensional reconstruction are shown in Figure 6e,f. We combined these two results to bring out the final experimental data of the algorithm.
Figure 6g shows the best solution, as there was no distortion in both highlight and non-highlight regions, and the calculation speed was relatively faster. In this paper, the maximum cross-sectional height average relative error and height root mean square error of the composite image were solved respectively. The formulas are as follows:
where ARE is the height average relative error, RMSE is the height root mean square error, n is the total number of processed images, m is the total number of pixels of the largest cross section of the composite sphere, is the height value after the reconstruction, and z is the actual height value. The running time and accuracy are shown in Table 1.
Table 1 indicates that the Lambert–Phong model had the smallest ARE value among the three compared models, and a slightly larger RMSE value than the Phong model. The CPU time was only 0.73761 s, which is much shorter than the Phong model. Thus, we conclude that the proposed Lambert–Phong model inherits the advantages of high efficiency from the Lambertian model and high accuracy from the Phong model.
From the above experimental data, there was a large error using the diffuse reflection model in the highlight region because it ignores the specular reflection components of the highlight region, whereas the Lambert–Phong optimization model developed in this study solves the distortion and time problems of the two algorithms, and the reconstruction effect was better than that of the single algorithm.
4.2. Precision Analysis of Real Image
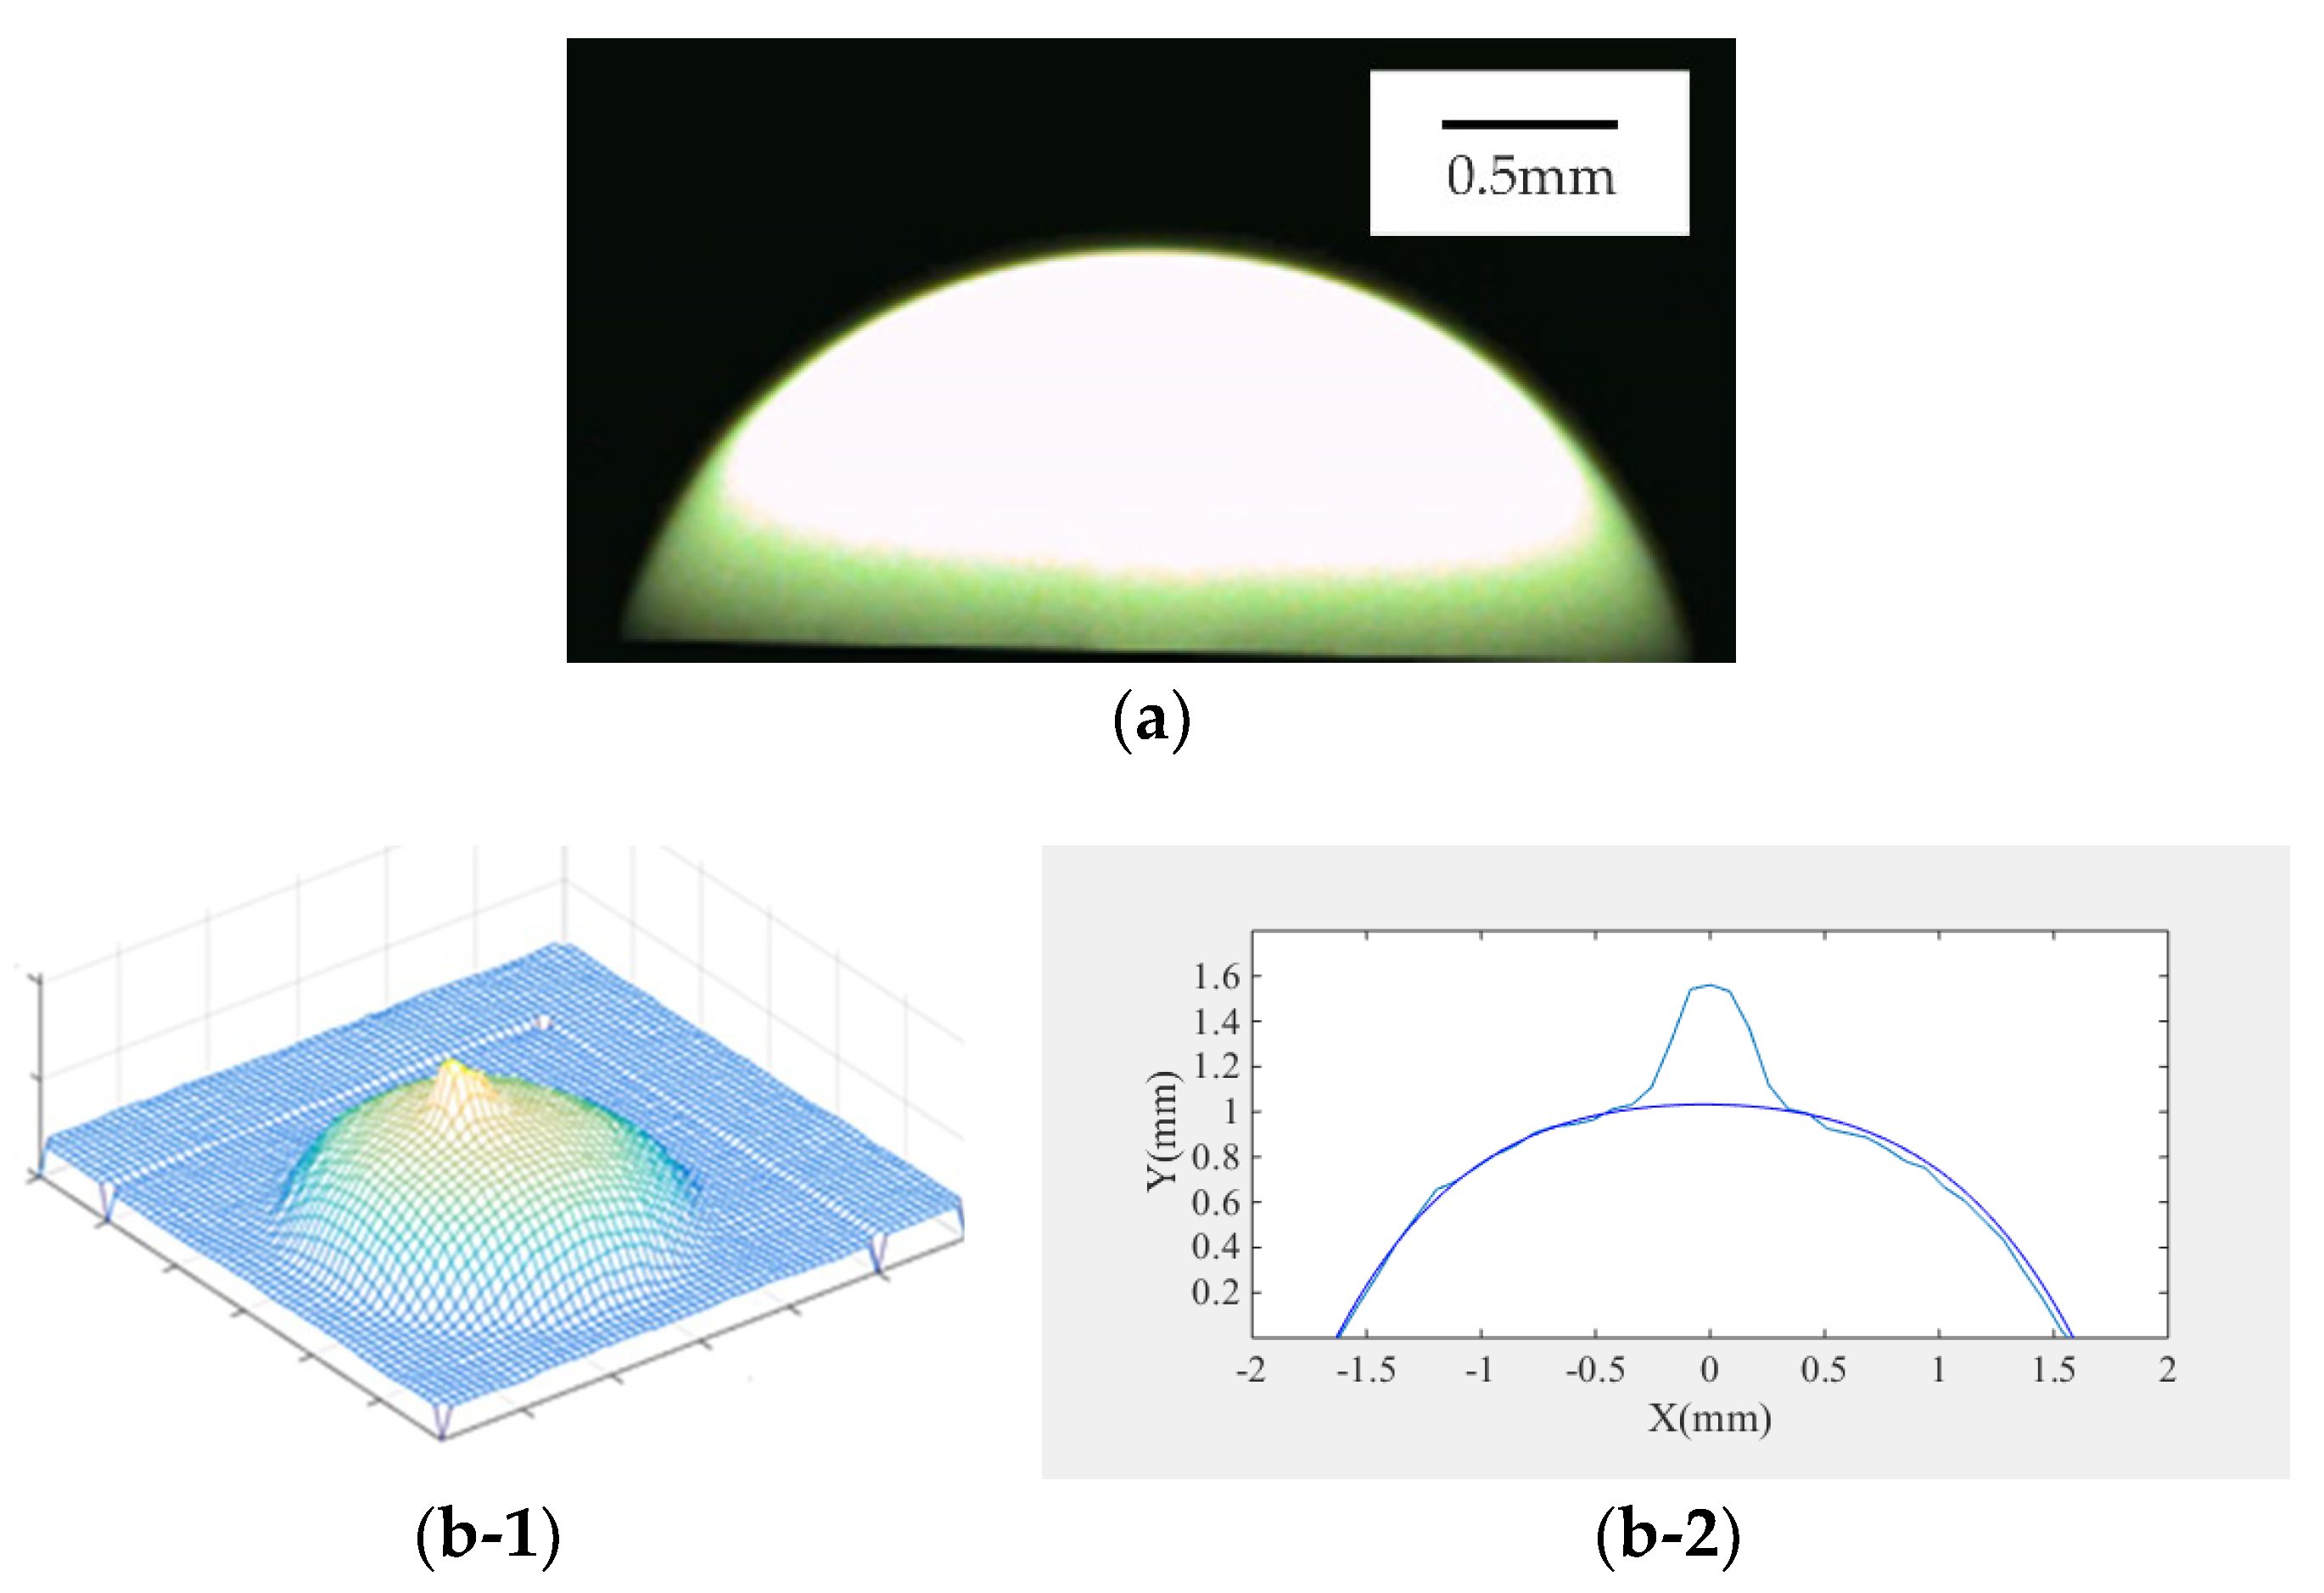
In this section, the above algorithm is applied to the 3D shape reconstruction experiment of the droplets, and the experimental results are compared with different algorithms. Since the 3D shape of the real tiny droplets is difficult to detect accurately, this paper calculates the accuracy through the maximum external contour of the side image.
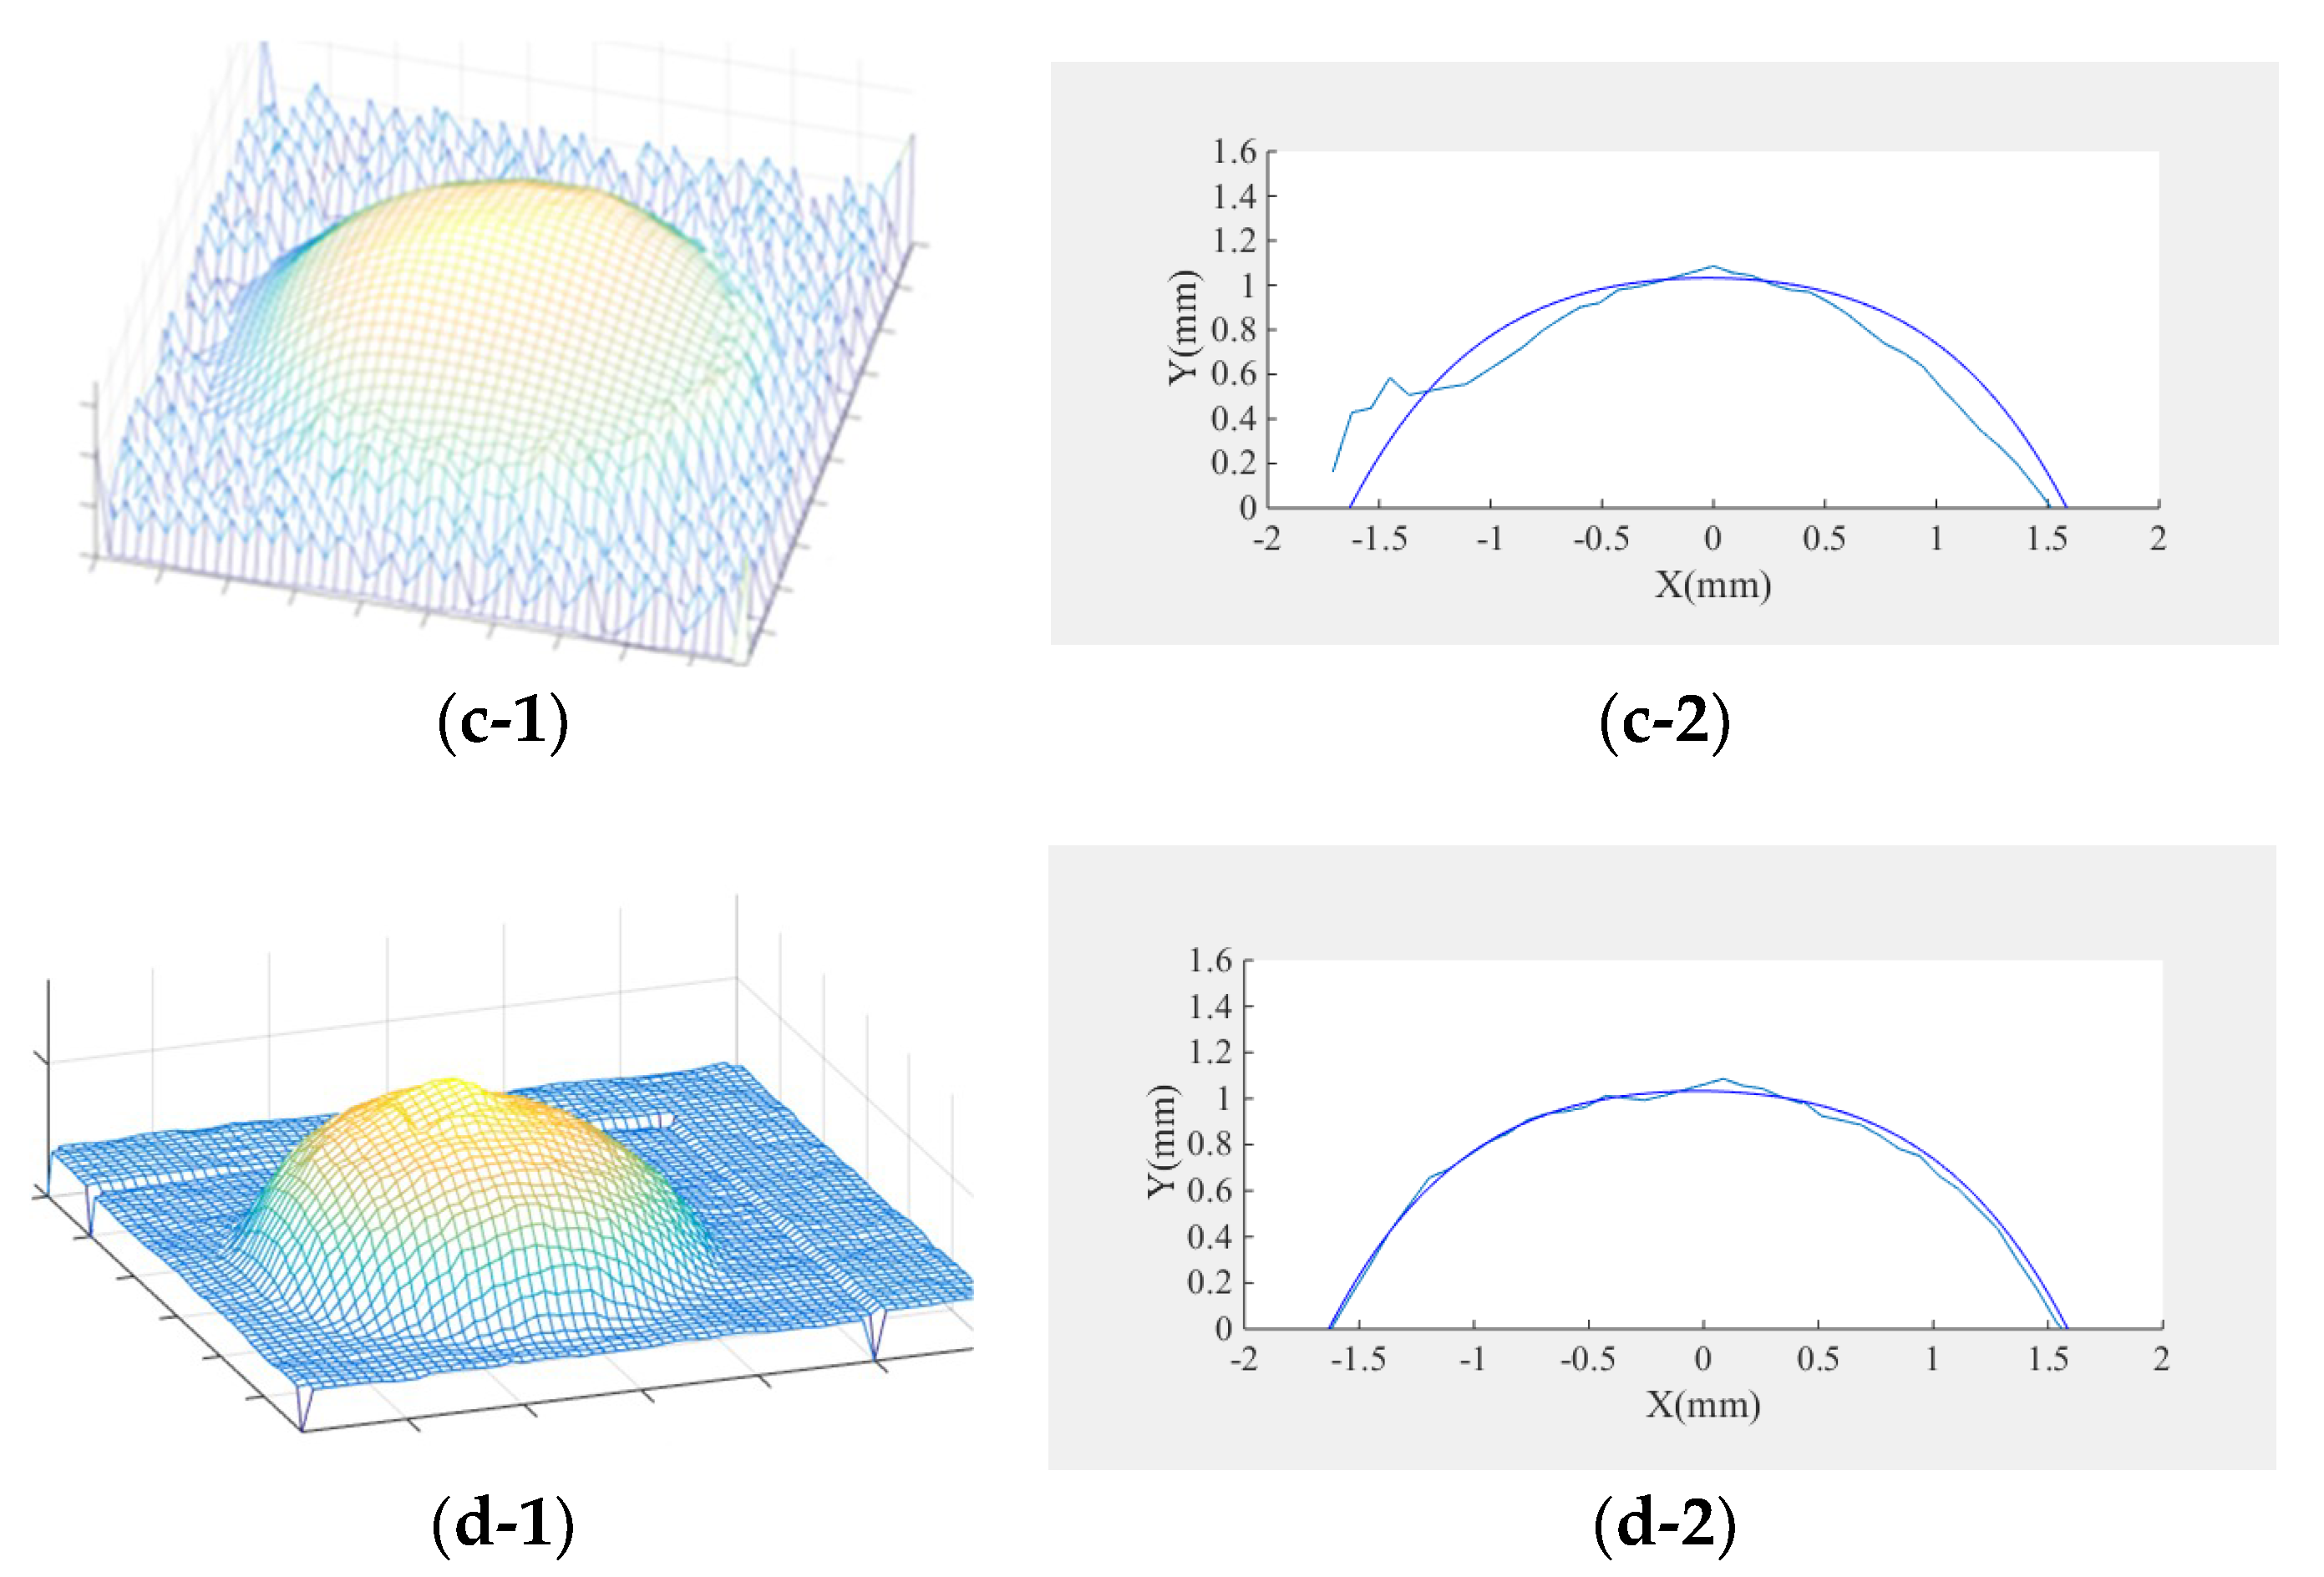
The experimental results of the 3D shape in Figure 7b demonstrate that the diffuse reflection model solved by linearization could not accurately describe the specular component of the surface of the object. Therefore, a large distortion occurred in the highlight region, which affected the accuracy of reconstruction greatly. Comparison with the experimental results of the Phong hybrid model shown in Figure 6c and Figure 7c demonstrates that although the reconstruction effect of the highlight region and the non-highlight region was better in the composite image, the distortion phenomenon appeared in the droplet’s boundary in the real image, which reduced the accuracy to a certain extent. The results of the combined Lambert–Phong optimization model proposed in this paper are shown in Figure 7d. It is clear that the experimental result was more accurate, the reflection characteristics of the droplet surface could be expressed more accurately, and the reconstruction error was also well-solved. Hence, it can be concluded that the Lambert–Phong model was applicable for the droplet in this case.
In this section, the data of the three algorithms are compared and the maximum cross-sectional height average relative error and height root mean square error are calculated. As shown in Figure 3a, the cross section of the real image was taken with a–b as the cross-sectional line. The cross section contrast diagrams of the three algorithms are shown in Figure 7b-2, Figure 7c-2, and Figure 7d-2. Based on the above-mentioned formulas, the error values of the three models are listed in Table 2. It can be seen from the error table that the accuracy of the algorithm proposed in this paper was higher than that of the diffuse reflection model and Phong hybrid model, and therefore it is suitable for the three-dimensional reconstruction of industrial droplets. In the real image, the solution speed of this model was still faster than other models, so the model is applicable for the droplets’ experimental environment.
5. Conclusions and Prospect
In this paper, a novel approach based on Mask R-CNN and improved Lambert–Phong model is carried out to reconstruct the micro-droplet’s 3D shape with the advantages of high accuracy and efficiency. Firstly, Mask R-CNN is used to segment the highlight region and diffuse reflectance region of the droplets, and then the Lambert and Phong models are combined to reconstruct the 3D shapes of diffuse reflectance region and highlight region, respectively. Finally, the above two results are combined to get the final 3D shape of the droplets. In the experiment, the reconstruction errors of 3.81% and 8.06% in the composite image and the actual droplet image based on Lambert–Phong model proposed in this paper were both smaller than the other algorithms based on a single model, which shows that the algorithm in this paper had good experimental precision and running speed. This study provides an effective way for monitoring the volume and shape of droplets in the microelectronic dispensing area in real-time. In the future, studies about the 3D shape recovery of some irregularly shaped droplets and a droplet jetting volume control method based on the proposed shape recovery algorithm will be explored deeply.
Author Contributions
Data curation—J.Z. and W.L.; Formal analysis—C.R.; Methodology—S.L. and Q.Z.; Project administration—S.L.; Software—J.Z. and W.L.; Writing original draft—C.R. and Q.Z.; Writing review & editing—S.L.
Acknowledgments
This work is supported by the National Natural Science Foundation of China (No. 51605261).
Conflicts of Interest
The authors declare no conflict of interest.
References
- Rajiv, L.I.; Dary, L.S. Experimental analysis of a voice-coil-driven jetting system for micrograms fluid depositions in electronics assembly. J. Microelectron. Electron. Packag. 2017, 14, 108–121. [Google Scholar]
- Zhou, C.; Duan, H.; Deng, G.L.; Li, J.H. A novel high-speed jet dispenser driven by double piezoelectric stacks. IEEE Trans. Ind. Electron. 2017, 64, 412–419. [Google Scholar] [CrossRef]
- Lu, S.; Cao, G.; Zheng, H.; Li, D.; Shi, M.; Qi, J. Simulation and experiment on droplet formation and separation for needle-type micro-liquid jetting dispenser. Micromachines 2018, 9, 330. [Google Scholar] [CrossRef]
- Zhou, M.; Fan, Z.; Ma, Z.; Zhao, H.; Guo, Y.; Hong, K.; Li, Y.; Liu, H.; Wu, D. Design and experimental research of a novel stick-slip type piezoelectric actuator. Micromachines 2017, 8, 150. [Google Scholar] [CrossRef]
- Park, Y.; Tuan, A.P.; Carl, B.; Mario, C.; Robin, O.C.; Jon, O.N.; Joyce, Y.W. Monodisperse micro-oil droplets stabilized by polymerizable phospholipid coatings as potential drug carriers. Langmuir 2015, 31, 9762–9770. [Google Scholar] [CrossRef] [PubMed]
- Che, X.; Nuhn, J.A.M.; Ian, C.S.; Long, Q. High throughput studies of cell migration in 3D microtissues fabricated by a droplet microfluidic chip. Micromachines 2016, 7, 84. [Google Scholar] [CrossRef]
- Jang, M.; Seungwon, Y.; Pilnam, K. Microdroplet-based cell culture models and their application. BioChip J. 2016, 10, 310–317. [Google Scholar] [CrossRef]
- Sontti, S.G.; Arnab, A. CFD analysis of microfluidic droplet formation in non–Newtonian liquid. Chem. Eng. J. 2017, 330, 245–261. [Google Scholar] [CrossRef]
- Koyama, K.; Takakura, M.; Furukawa, T.; Maruo, S. 3D shape reconstruction of 3D printed transparent microscopic objects from multiple photographic images using ultraviolet illumination. Micromachines 2018, 9, 216. [Google Scholar] [CrossRef]
- Wang, W.; Yan, J.; Xu, N.; Wang, Y.; Hsu, F.H. Real-time high-quality stereo vision system in FPGA. IEEE Trans. Circuits Syst. Video Technol. 2015, 25, 1696–1708. [Google Scholar] [CrossRef]
- Yang, K.; Peng, J.; Jiang, C.; Jiang, X.; Xiao, L.; Wang, B.; Gao, X.; Xie, L.; Peng, H. Design of the fall-block sensing of the railway line pantograph based on 3D machine vision sensors. Sensors 2018, 18, 2305. [Google Scholar] [CrossRef] [PubMed]
- Horn, B.K.P. Shape from Shading: A Method for Obtaining the Shape of a Smooth Opaque Object from One View. Ph.D. Thesis, Massachusetts Institute of Technology, Cambridge, MA, USA, November 1970. [Google Scholar]
- Phong, B.T. Illumination for computer generated pictures. Commun. ACM 1975, 18, 311–317. [Google Scholar] [CrossRef] [Green Version]
- Lee, K.M.; Kuo, C.-C.J. Shape from shading with a generalized reflectance map model. Comput. Vis. Image Underst. 1997, 67, 143–160. [Google Scholar] [CrossRef]
- Ahmed, A.H.; Farag, A.A. Shape from shading for hybrid surfaces. In Proceedings of the 2007 IEEE International Conference on Image Processing, San Antonio, TX, USA, 16–19 September 2007; pp. 525–528. [Google Scholar]
- Oren, M.; Nayar, S.K. Generalization of the Lambertian model and implications for machine vision. Int. J. Comput. Vis. 1995, 14, 227–251. [Google Scholar] [CrossRef] [Green Version]
- Breuß, M.; Ju, Y.C. Shape from shading with specular highlights: Analysis of the Phong model. In Proceedings of the 2011 18th IEEE International Conference on Image Processing (ICIP), Brussels, Belgium, 11–14 September 2011; pp. 9–12. [Google Scholar]
- Yang, Z.M.; Zhao, H.D. A new RBF reflection model for shape from shading. 3D Res. 2017, 24, 8–33. [Google Scholar] [CrossRef]
- Wang, G.H.; Cheng, J. Three-dimensional reconstruction of hybrid surfaces using perspective shape from shading. Opt. Int. J. Light Electron Opt. 2016, 127, 7740–7751. [Google Scholar] [CrossRef]
- Wolff, L.B. Using polarization to separate reflection components. In Proceedings of the 2002 IEEE Conference on Computer Vision and Pattern Recognition (CVPR), San Diego, CA, USA, 4–8 June 1989; pp. 311–317. [Google Scholar]
- Nayar, S.K.; Fang, X.S.; Boult, T. Removal of specularities using color and polarization. In Proceedings of the 1993 IEEE Conference on Computer Vision and Pattern Recognition (CVPR), New York, NY, USA, 15–17 June 1993; pp. 583–590. [Google Scholar]
- Alsaleh, S.M.; Aviles, A.I.; Sobrevilla, P.; Casals, A.; Hahn, J.K. Automatic and robust single-camera specular highlight removal in cardiac images. In Proceedings of the 2015 37th Annual International Conference of the IEEE Engineering in Medicine and Biology Society (EMBC), Milan, Italy, 25–29 August 2015. [Google Scholar]
- Girshick, R.; Donahue, J.; Darrell, T.; Malik, J. Rich feature hierarchies for accurate object detection and semantic segmentation. In Proceedings of the 2014 IEEE Conference on Computer Vision and Pattern Recognition (CVPR), Columbus, OH, USA, 24–27 June 2014; pp. 580–587. [Google Scholar]
- Badrinarayanan, V.; Kendall, A.; Cipolla, R. SegNet: A deep convolutional encoder-decoder architecture for image segmentation. IEEE Trans. Pattern Anal. Mach. Intell. 2017, 39, 2481–2495. [Google Scholar] [CrossRef] [PubMed]
- Long, J.; Shelhamer, E.; Darrell, T. Fully convolutional networks for semantic segmentation. In Proceedings of the 2015 IEEE Conference on Computer Vision and Pattern Recognition (CVPR), Boston, MA, USA, 8–10 June 2015; pp. 3431–3440. [Google Scholar]
- Krizhevsky, A.; Sutskever, I.; Hinton, G.E. ImageNet classification with deep convolutional neural networks. In Proceedings of the 25th International Conference on Neural Information Processing Systems, Lake Tahoe, NV, USA, 3–6 December 2012; pp. 1097–1105. [Google Scholar]
- Girshick, R. Fast R-CNN. In Proceedings of the 2015 IEEE International Conference on Computer Vision (ICCV), Santiago, Chile, 7–13 December 2015. [Google Scholar]
- Ren, S.; He, K.; Girshick, R.; Sun, J. Faster R-CNN: Towards real-time object detection with region proposal networks. In Proceedings of the 28th International Conference on Neural Information Processing Systems, Montreal, QC, Canada, 7–12 December 2015; pp. 1137–1149. [Google Scholar]
- He, K.; Gkioxari, G.; Dollar, P.; Girshick, R.B. Mask R-CNN. In Proceedings of the 2017 IEEE International Conference on Computer Vision, Venice, Italy, 22–29 October 2017. [Google Scholar]
- Uijlings, J.R.; van de Sande, K.E.A.; Gevers, T.; Smeulders, A.W. Selective search for object recognition. Int. J. Comput. Vis. 2013, 104, 154–171. [Google Scholar] [CrossRef]
- LeCun, Y.; Boser, B.; Denker, J.S.; Henderson, D.; Howard, R.E.; Hubbard, W.; Jackel, L.D. Backpropagation applied to handwritten zip code recognition. Neural Comput. 1989, 1, 541–551. [Google Scholar] [CrossRef]
- Lin, T.Y.; Dollár, P.; Girshick, R.B.; He, K.; Hariharan, B.; Belongie, S.J. Feature pyramid networks for object detection. In Proceedings of the 2017 IEEE Conference on Computer Vision and Pattern Recognition (CVPR), Honolulu, HI, USA, 21–26 July 2017; pp. 936–944. [Google Scholar]
- Yang, L.; Han, J. 3D shape reconstruction of medical images using a perspective shape-from-shading method. Meas. Sci. Technol. 2008, 19, 065502. [Google Scholar] [CrossRef]
Figure 1.
Algorithm flow chart.

Figure 2.
Mask R-CNN flow chart. CNN: convolutional neural network; ROI: region of interest; RPN: region proposal network.
Figure 2.
Mask R-CNN flow chart. CNN: convolutional neural network; ROI: region of interest; RPN: region proposal network.

Figure 3.
(a) Binary droplet image of feature to be extracted. (b) Experimental image after detection by Mask R-CNN (where the red area is the highlight area and the feature area is called “star”).
Figure 3.
(a) Binary droplet image of feature to be extracted. (b) Experimental image after detection by Mask R-CNN (where the red area is the highlight area and the feature area is called “star”).

Figure 4.
Schematic diagram of experimental equipment.

Figure 5.
Composite hemisphere.

Figure 6.
(a) Original grayscale composite image (A–B is the cut line for the cross section); (b) 3D shape of the composite image and the side cross section contrast diagram using the Lambertian model algorithm (dark blue is the cross section of reconstruction, light blue is the cross section of the real shape); (c) 3D shape of the composite image and the side cross section contrast diagram using the Phong hybrid model algorithm; (d) highlight detection’s results of the composite image; (e) 3D shape of the composite image at the highlight region using the Phong hybrid model algorithm; (f) 3D shape of the composite image at the non-highlight region using the Lambertian model algorithm; (g) 3D shape of the composite image and the side cross section contrast diagram using the Lambert–Phong model algorithm.

Figure 7.
(a) Real profile of the droplet; (b-1) 3D shape reconstruction of the real image using the Lambertian model algorithm; (b-2) 3D shape of the real image and the side cross section contrast diagram using the Lambertian model algorithm; (c-1) 3D shape reconstruction of the real image using the Phong hybrid model algorithm; (c-2) 3D shape of the real image and the side cross section contrast diagram using the Phong hybrid model algorithm; (d-1) 3D shape reconstruction of the real image using the Lambert–Phong model algorithm; (d-2) 3D shape of the real image and the side cross section contrast diagram using the Lambert–Phong model algorithm.


Table 1.
Comparison of height average relative error (ARE), height root mean square error (RMSE), and operational speed of the three algorithms for a composite image.
Table 1.
Comparison of height average relative error (ARE), height root mean square error (RMSE), and operational speed of the three algorithms for a composite image.
| Method | ARE (%) | RMSE (pix) | CPU Time (s) |
|---|---|---|---|
| Lambertian model | 5.66 | 3.983 | 0.13396 |
| Phong model | 3.95 | 0.403 | 7.44460 |
| Lambert–Phong model | 3.81 | 0.475 | 0.73761 |
Table 2.
Comparison of height average relative error, height root mean square error, and operational speed of three algorithms for the real image.
Table 2.
Comparison of height average relative error, height root mean square error, and operational speed of three algorithms for the real image.
| Method | ARE (%) | RMSE (pix) | CPU Time (s) |
|---|---|---|---|
| Lambertian model | 8.99 | 0.162 | 0.00089 |
| Phong model | 17.00 | 0.145 | 0.14126 |
| Lambert–Phong model | 8.06 | 0.032 | 0.01525 |
© 2018 by the authors. Licensee MDPI, Basel, Switzerland. This article is an open access article distributed under the terms and conditions of the Creative Commons Attribution (CC BY) license (http://creativecommons.org/licenses/by/4.0/).
Share and Cite
MDPI and ACS Style
Lu, S.; Ren, C.; Zhang, J.; Zhai, Q.; Liu, W. A Novel Approach to Droplet’s 3D Shape Recovery Based on Mask R-CNN and Improved Lambert–Phong Model. Micromachines 2018, 9, 462. https://doi.org/10.3390/mi9090462
AMA Style
Lu S, Ren C, Zhang J, Zhai Q, Liu W. A Novel Approach to Droplet’s 3D Shape Recovery Based on Mask R-CNN and Improved Lambert–Phong Model. Micromachines. 2018; 9(9):462. https://doi.org/10.3390/mi9090462
Chicago/Turabian StyleLu, Shizhou, Chenliang Ren, Jiexin Zhang, Qiang Zhai, and Wei Liu. 2018. "A Novel Approach to Droplet’s 3D Shape Recovery Based on Mask R-CNN and Improved Lambert–Phong Model" Micromachines 9, no. 9: 462. https://doi.org/10.3390/mi9090462
Note that from the first issue of 2016, this journal uses article numbers instead of page numbers. See further details here.