Acoustic Manipulation of Bio-Particles at High Frequencies: An Analytical and Simulation Approach

Abstract
:1. Introduction
2. Methods
2.1. Theory
2.2. FEM Approach
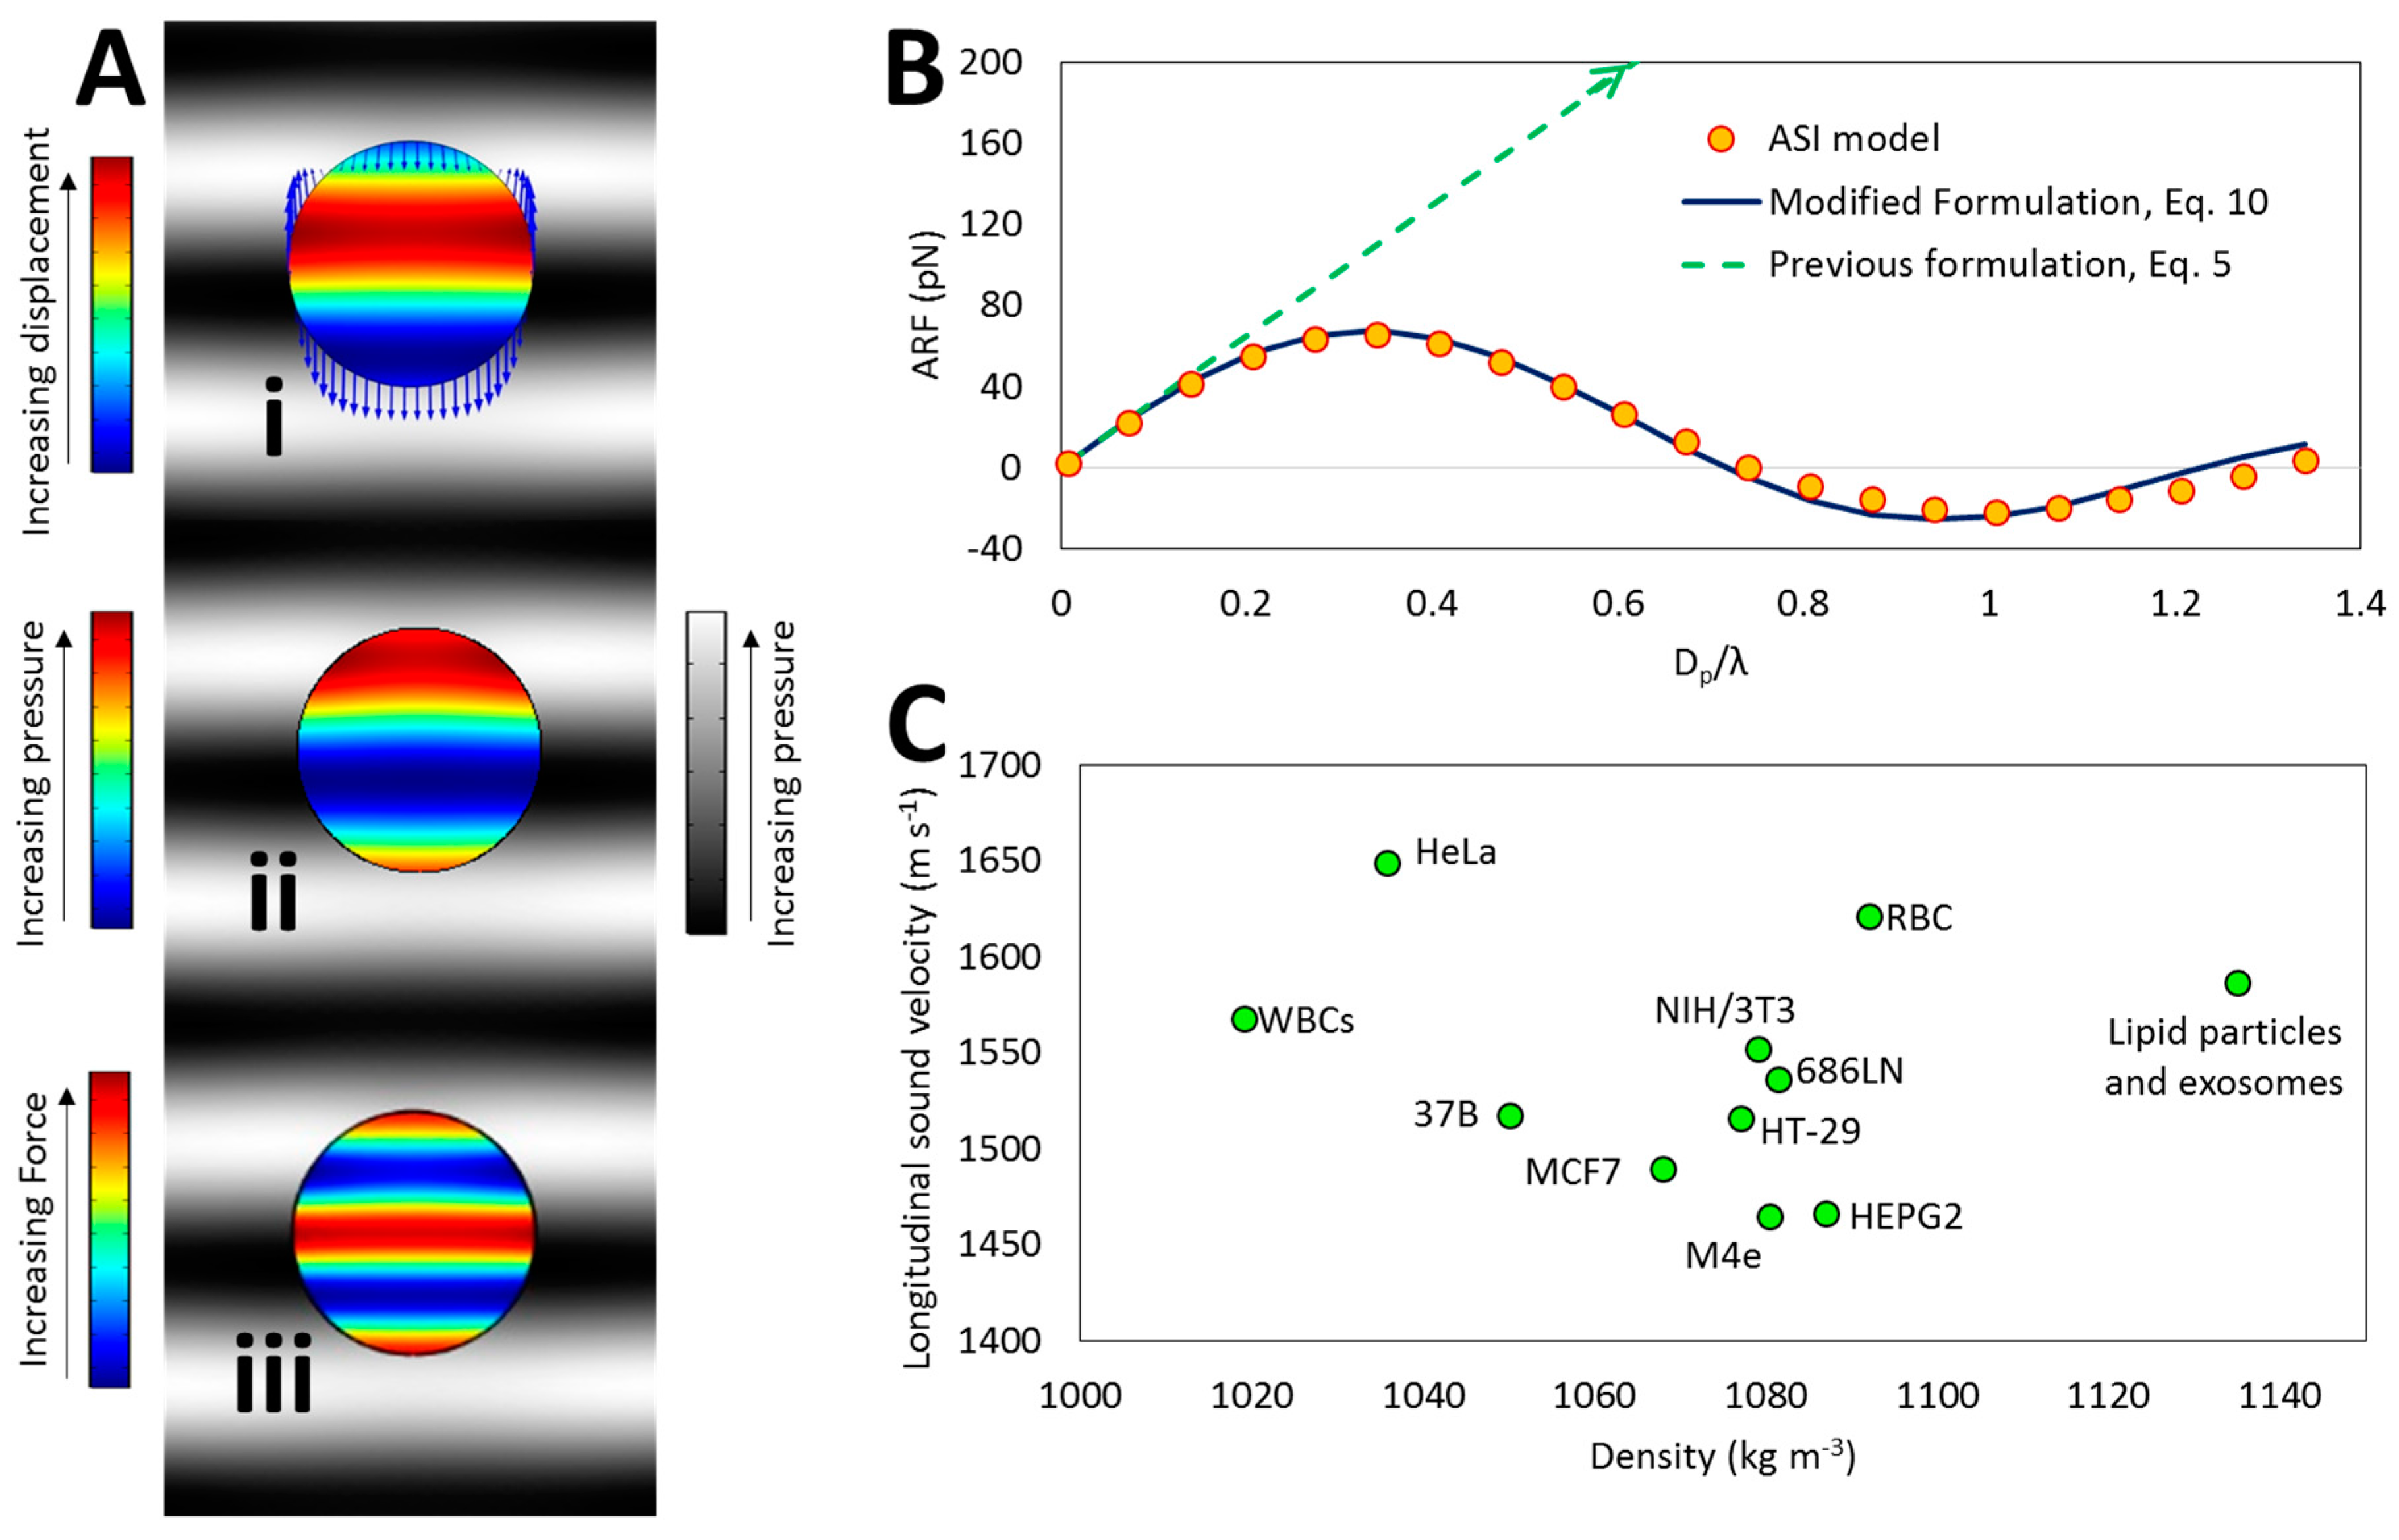
2.3. Material Model
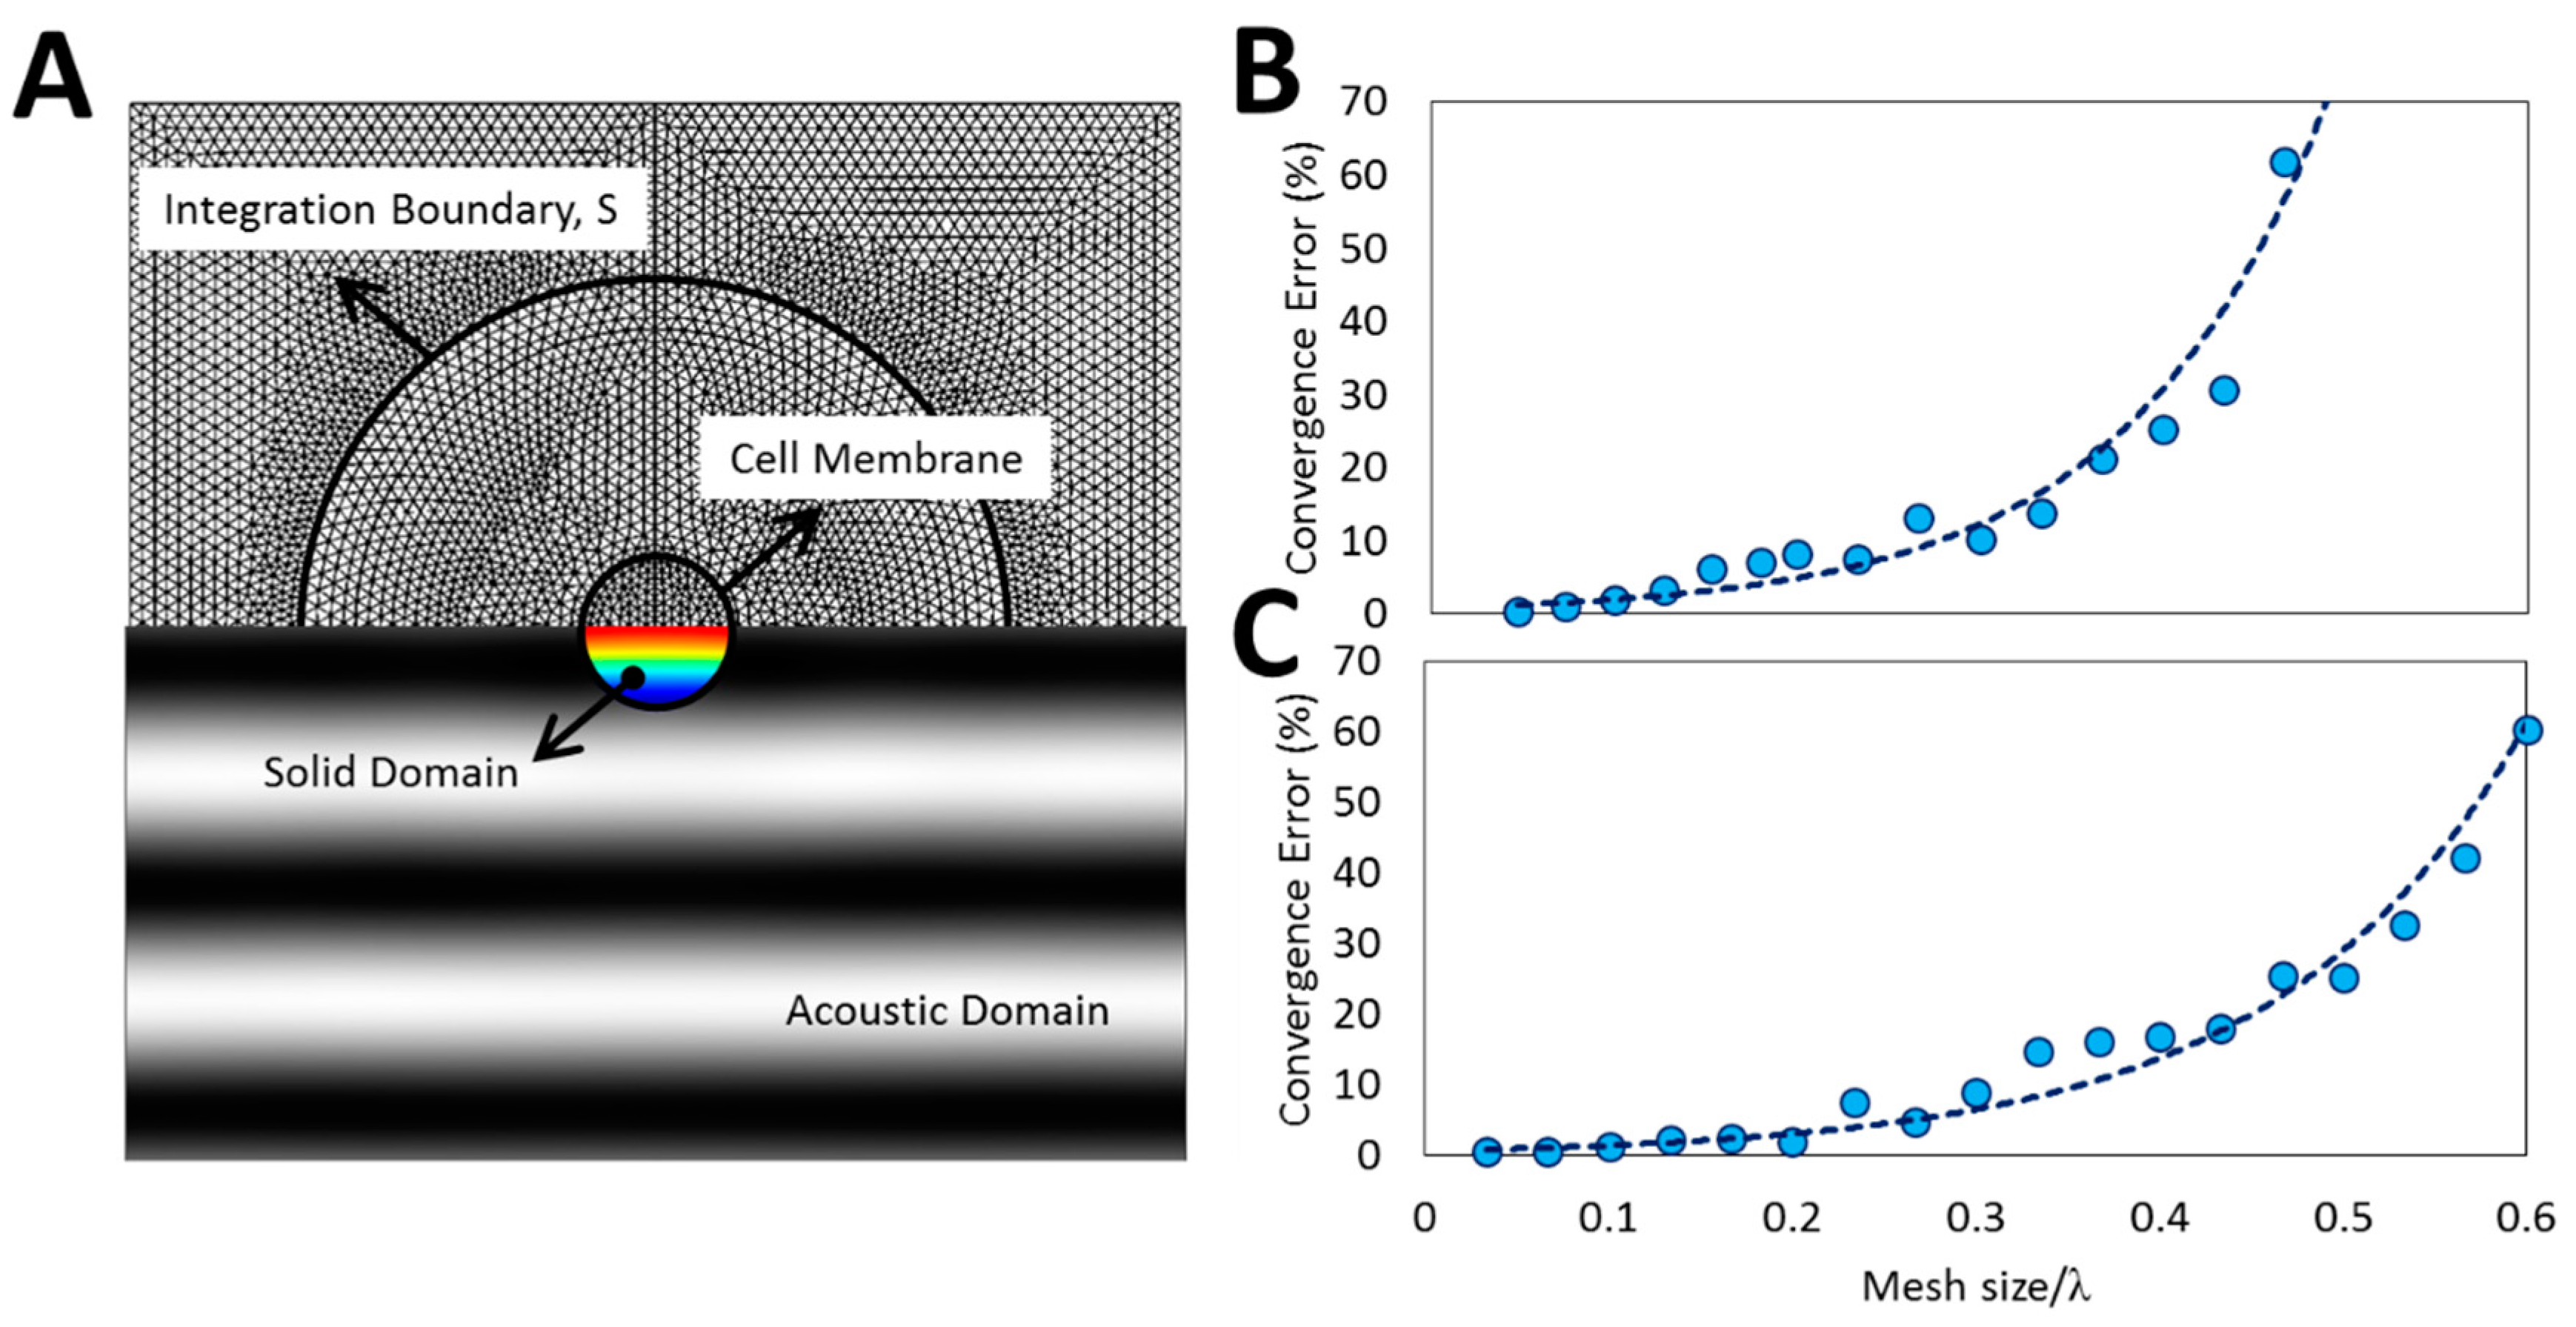
2.4. Convergence and Validation
3. Results and Discussion
3.1. ARF Exerted on BPs in High Frequencies
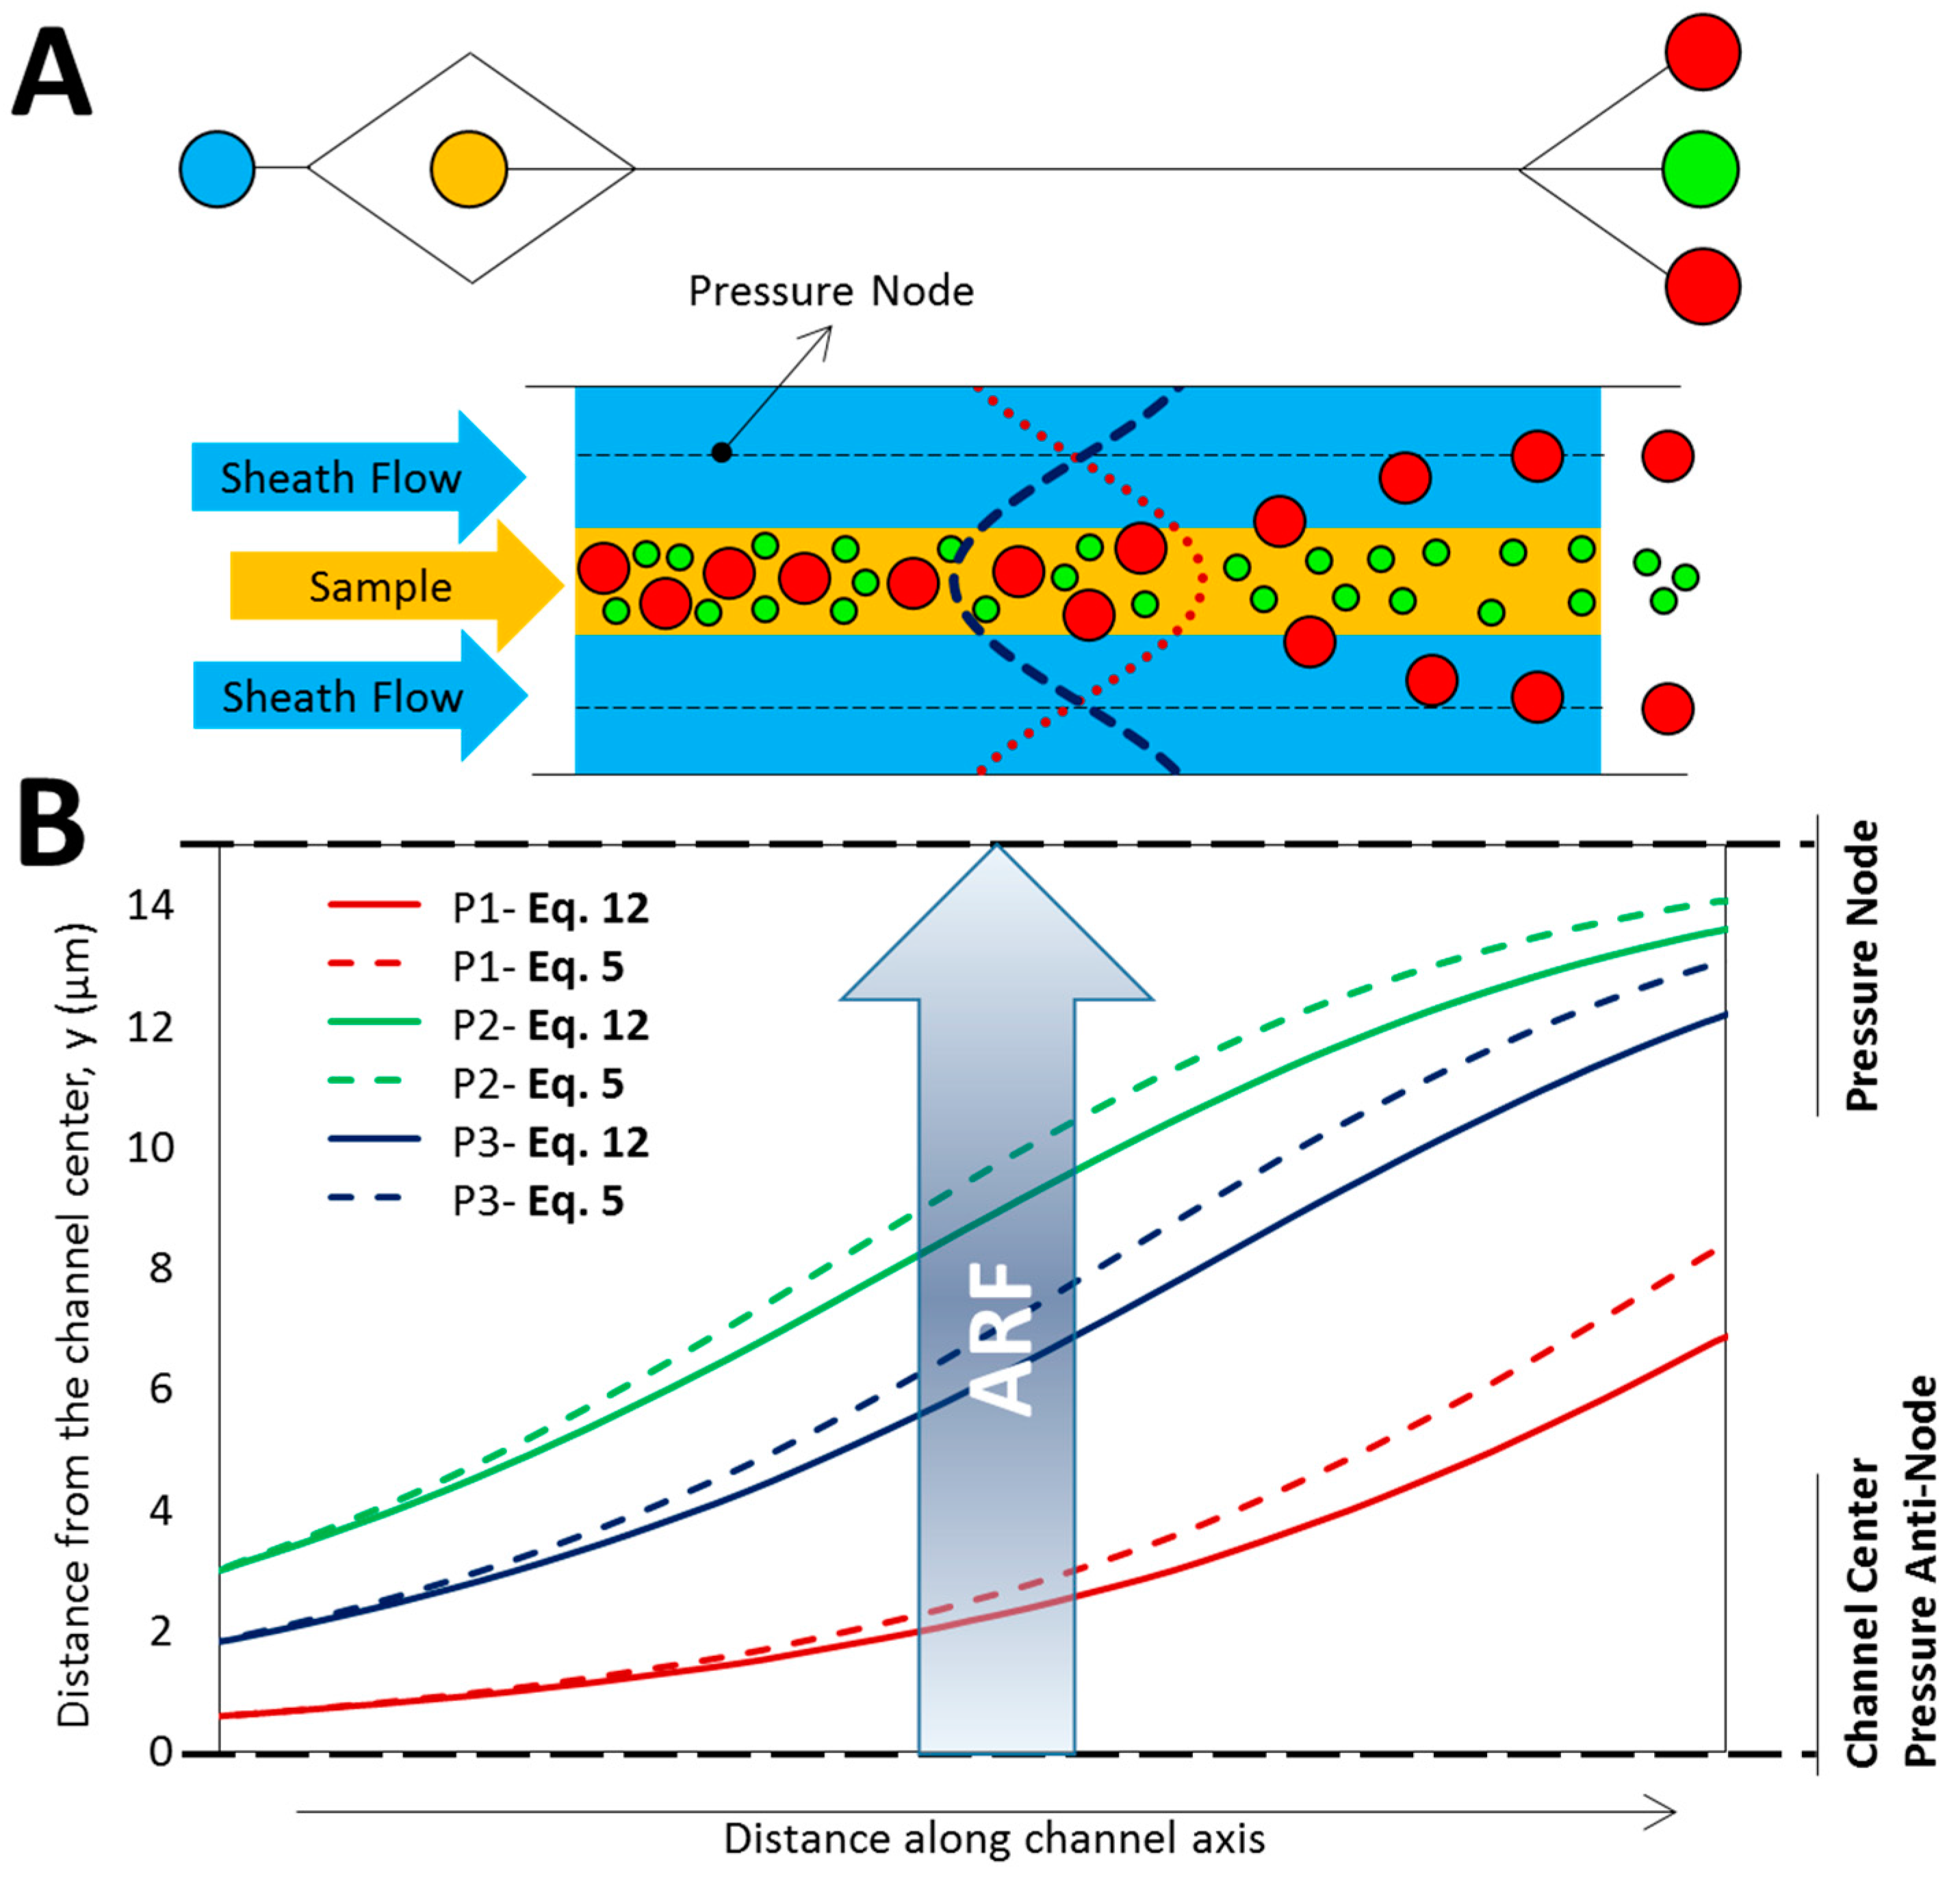
3.2. One-Directional Standing Acoustic Waves
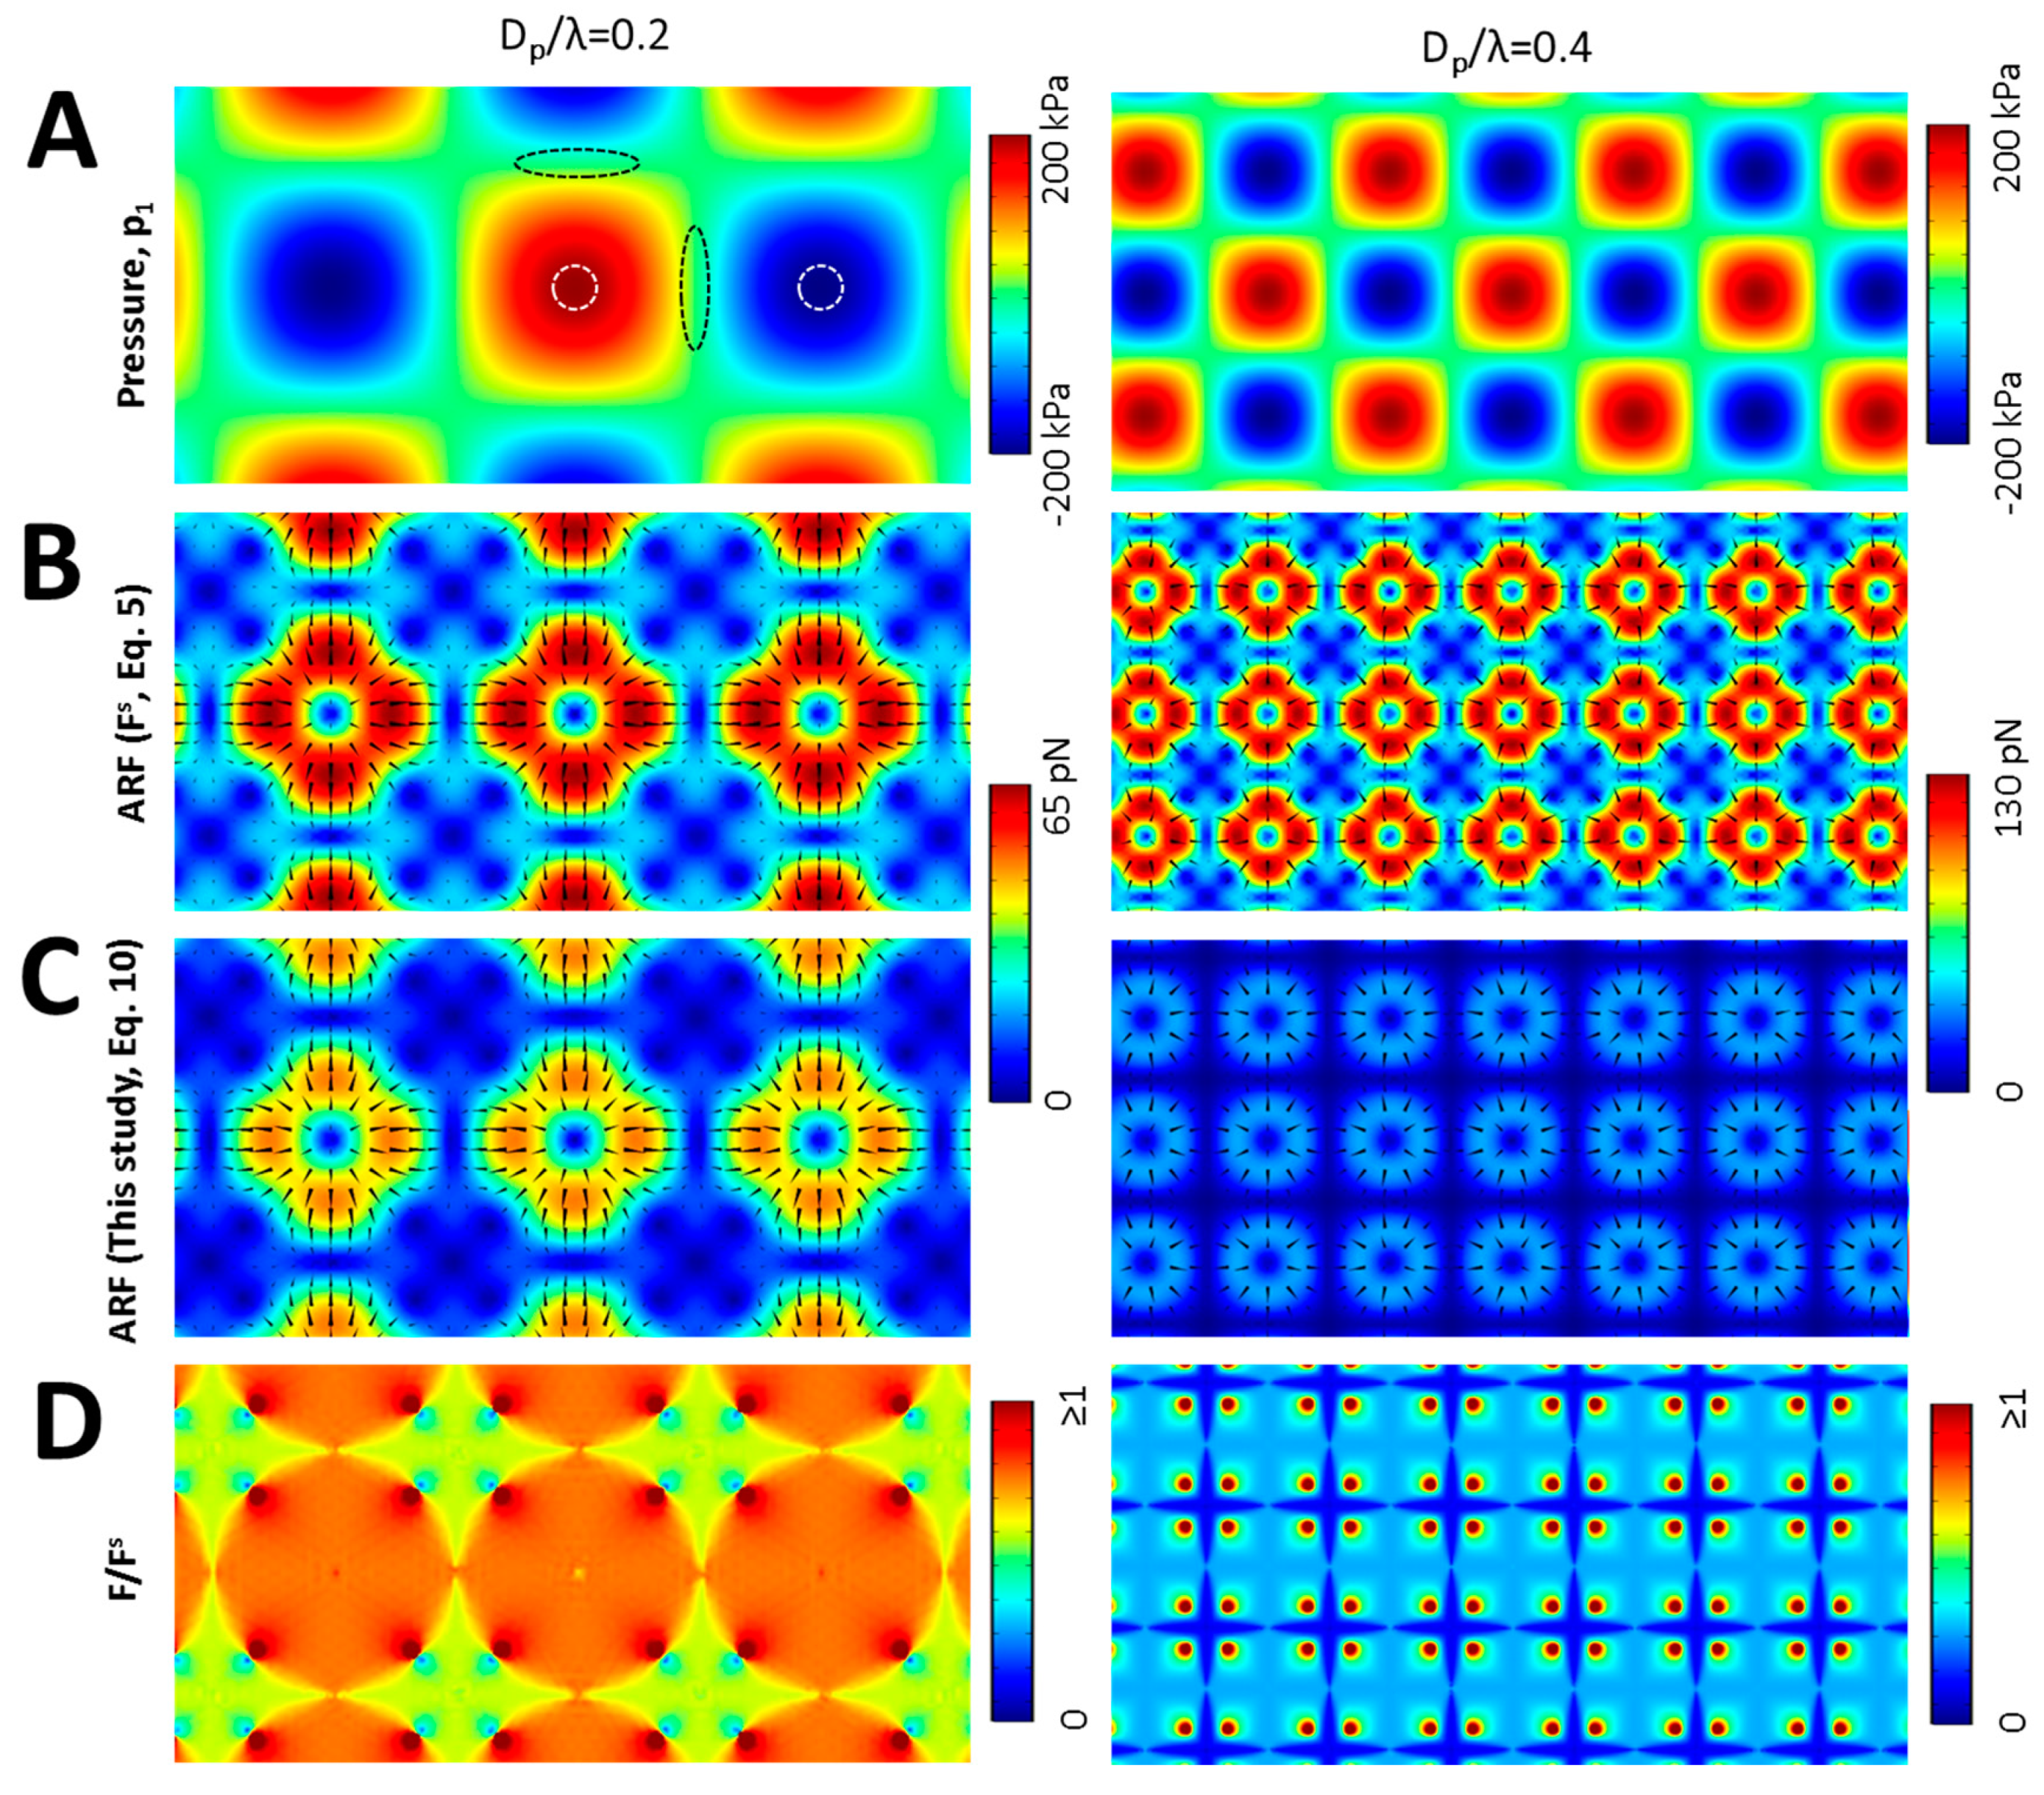
3.3. Multidirectional Standing Acoustic Waves
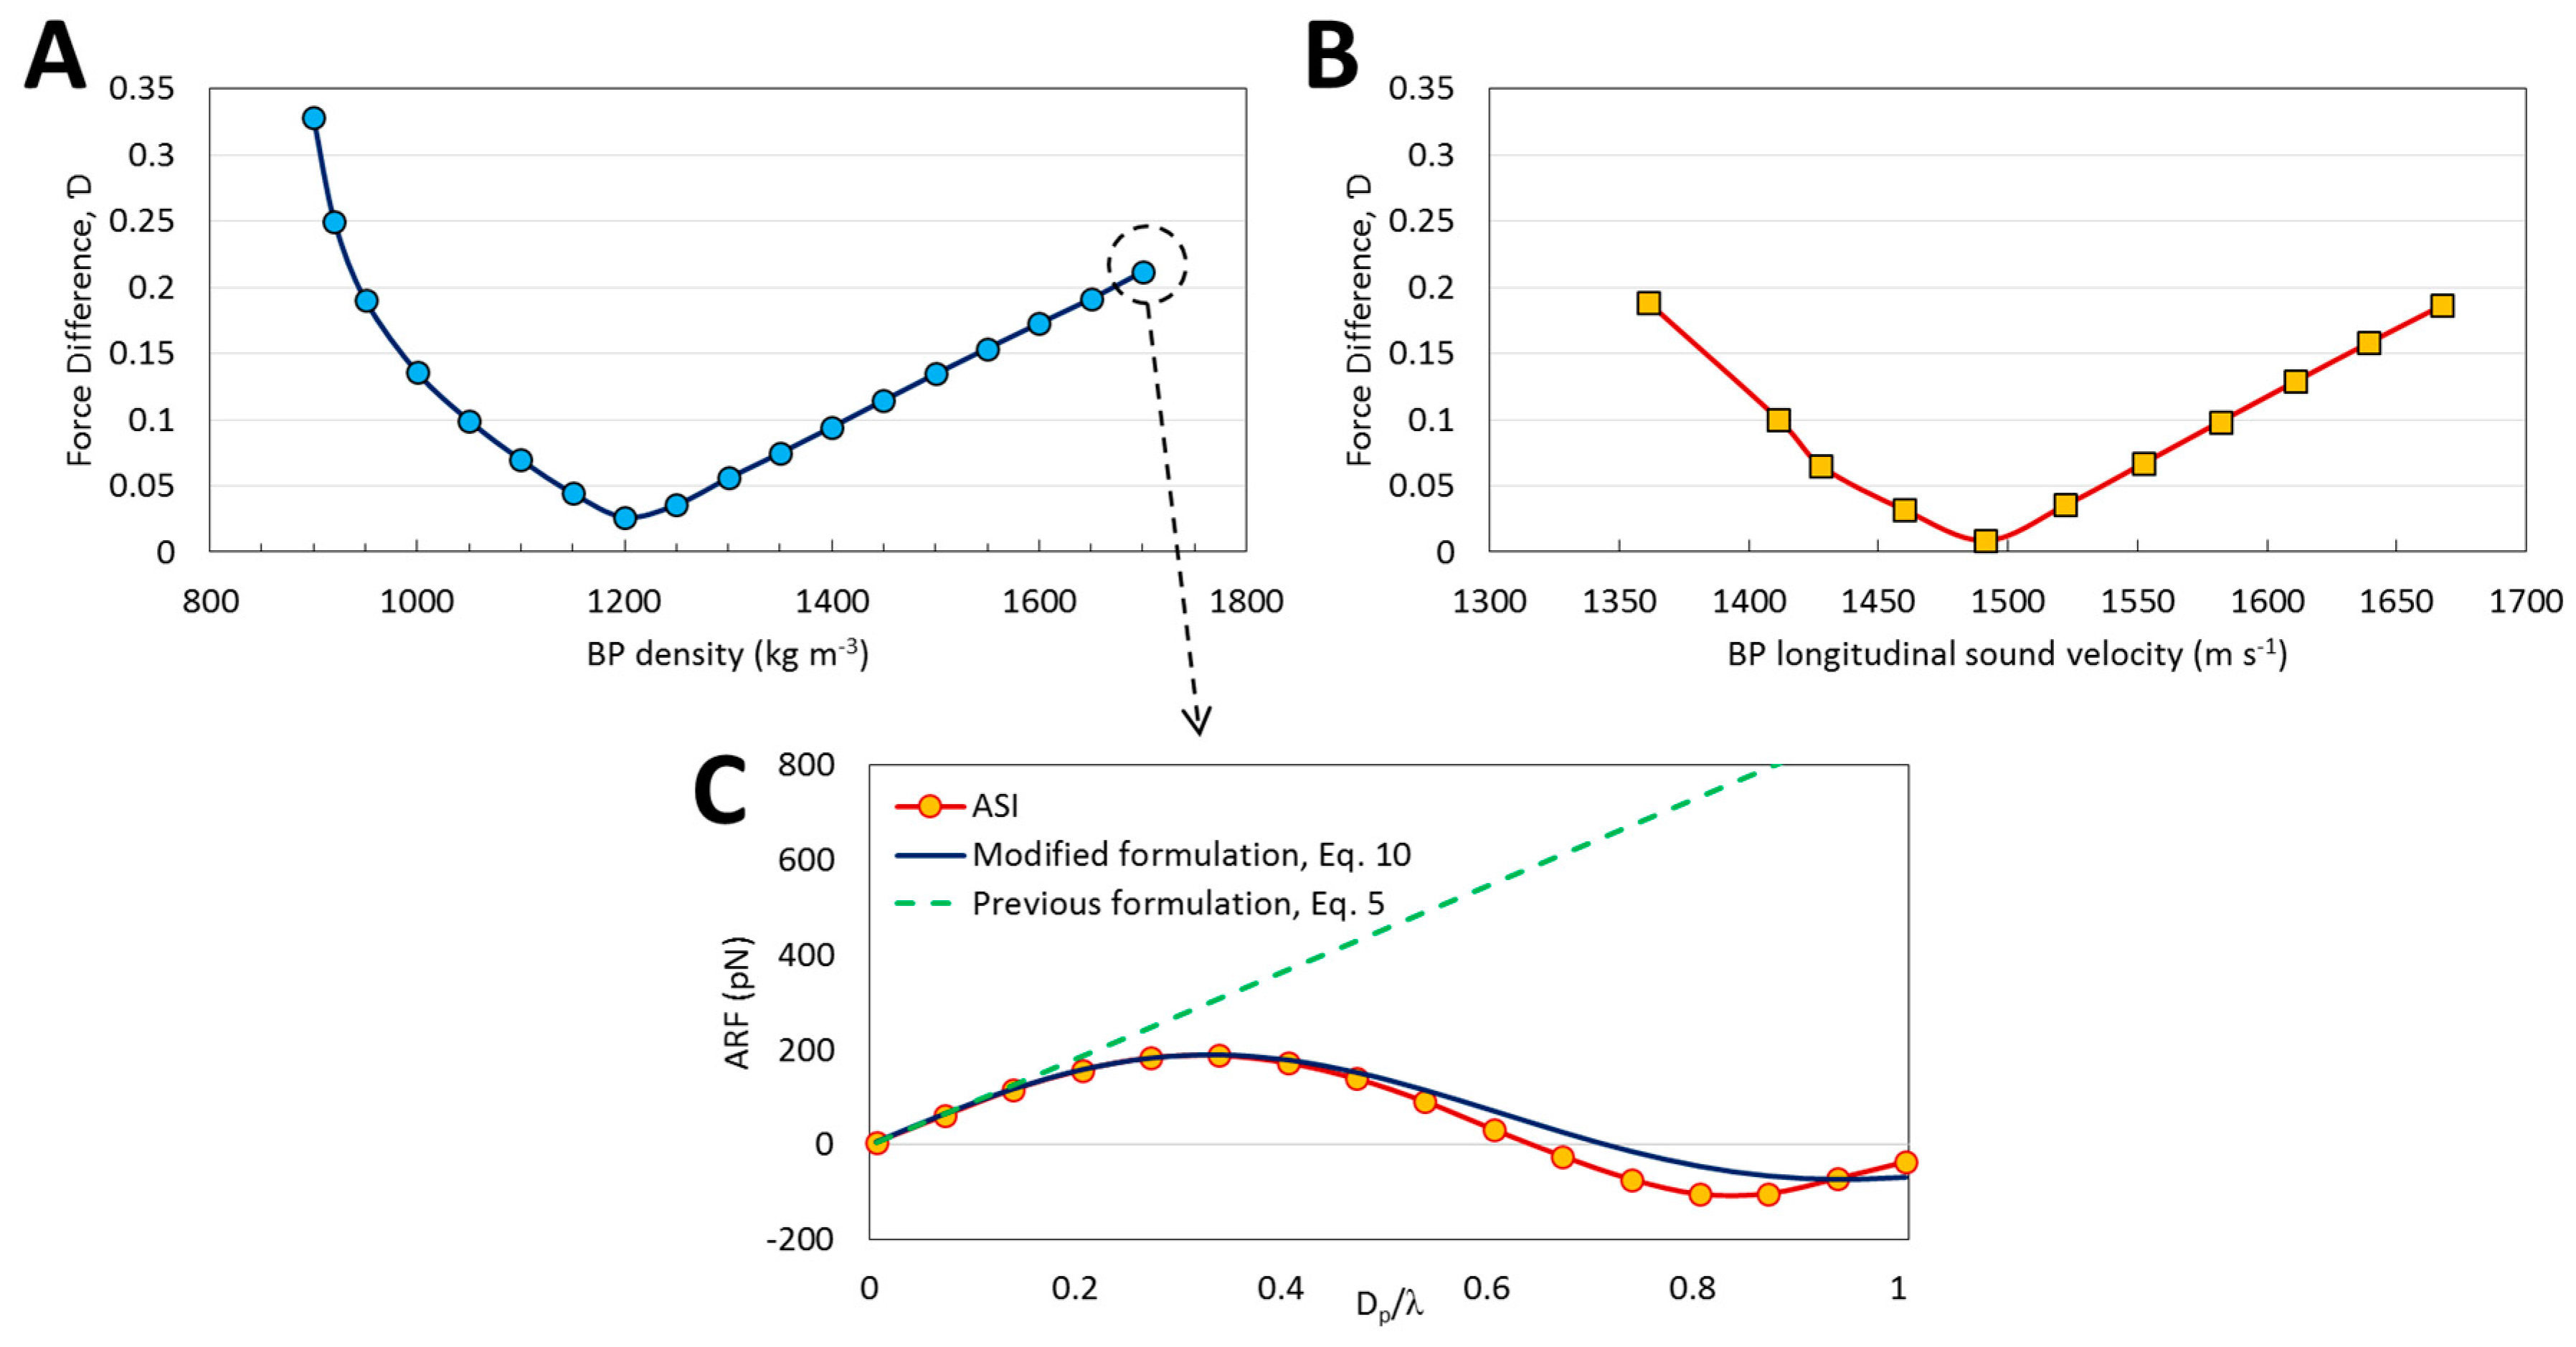
3.4. Range of Validity
4. Conclusions
Supplementary Materials
Acknowledgments
Author Contributions
Conflicts of interest
References
- Antfolk, M.; Laurell, T. Continuous flow microfluidic separation and processing of rare cells and bioparticles found in blood—A review. Anal. Chim. Acta 2017, 965, 9–35. [Google Scholar] [CrossRef] [PubMed]
- Jubery, T.Z.; Srivastava, S.K.; Dutta, P. Dielectrophoretic separation of bioparticles in microdevices: A review. Electrophoresis 2014, 35, 691–713. [Google Scholar] [CrossRef] [PubMed]
- Gholizadeh, S.; Draz, M.S.; Zarghooni, M.; Sanati-Nezhad, A.; Ghavami, S.; Shafiee, H.; Akbari, M. Microfluidic approaches for isolation, detection, and characterization of extracellular vesicles: Current status and future directions. Biosens. Bioelectron. 2017, 91, 588–605. [Google Scholar] [CrossRef] [PubMed]
- Lee, K.; Shao, H.; Weissleder, R.; Lee, H. Acoustic purification of extracellular microvesicles. ACS Nano 2015, 9, 2321–2327. [Google Scholar] [CrossRef] [PubMed]
- Shao, H.; Chung, J.; Balaj, L.; Charest, A.; Bigner, D.D.; Carter, B.S.; Hochberg, F.H.; Breakefield, X.O.; Weissleder, R.; Lee, H. Protein typing of circulating microvesicles allows real-time monitoring of glioblastoma therapy. Nat. Med. 2012, 18, 1835–1840. [Google Scholar] [CrossRef] [PubMed]
- Li, P.; Mao, Z.; Peng, Z.; Zhou, L.; Chen, Y.; Huang, P.-H.; Truica, C.I.; Drabick, J.J.; El-Deiry, W.S.; Dao, M. Acoustic separation of circulating tumor cells. Proc. Natl. Acad. Sci. USA 2015, 112, 4970–4975. [Google Scholar] [CrossRef] [PubMed]
- Xia, Y.; Tang, Y.; Yu, X.; Wan, Y.; Chen, Y.; Lu, H.; Zheng, S.-Y. Label-free virus capture and release by a microfluidic device integrated with porous silicon nanowire forest. Small 2017, 13, 1603135. [Google Scholar] [CrossRef] [PubMed]
- Barani, A.; Paktinat, H.; Janmaleki, M.; Mohammadi, A.; Mosaddegh, P.; Fadaei-Tehrani, A.; Sanati-Nezhad, A. Microfluidic integrated acoustic waving for manipulation of cells and molecules. Biosens. Bioelectron. 2016, 85, 714–725. [Google Scholar] [CrossRef] [PubMed]
- Guven, S.; Chen, P.; Inci, F.; Tasoglu, S.; Erkmen, B.; Demirci, U. Multiscale assembly for tissue engineering and regenerative medicine. Trends Biotechnol. 2015, 33, 269–279. [Google Scholar] [CrossRef] [PubMed]
- Hasan, A.; Saliba, J.; Modarres, H.P.; Bakhaty, A.; Nasajpour, A.; Mofrad, M.R.; Sanati-Nezhad, A. Micro and nanotechnologies in heart valve tissue engineering. Biomaterials 2016, 103, 278–292. [Google Scholar] [CrossRef] [PubMed]
- Maltsev, V.P.; Semyanov, K.A. Characterisation of Bio-Particles from Light Scattering; De Gruyter: Berlin, Germany, 2004; Volume 6, pp. 5779–5787. [Google Scholar]
- Chen, G.D.; Alberts, C.J.; Rodriguez, W.; Toner, M. Concentration and purification of human immunodeficiency virus type 1 virions by microfluidic separation of superparamagnetic nanoparticles. Anal. Chem. 2009, 82, 723–728. [Google Scholar] [CrossRef] [PubMed]
- Ding, X.; Li, P.; Lin, S.-C.S.; Stratton, Z.S.; Nama, N.; Guo, F.; Slotcavage, D.; Mao, X.; Shi, J.; Costanzo, F. Surface acoustic wave microfluidics. Lab Chip 2013, 13, 3626–3649. [Google Scholar] [CrossRef] [PubMed]
- Ding, X.; Lin, S.-C.S.; Kiraly, B.; Yue, H.; Li, S.; Chiang, I.-K.; Shi, J.; Benkovic, S.J.; Huang, T.J. On-chip manipulation of single microparticles, cells, and organisms using surface acoustic waves. Proc. Natl. Acad. Sci. USA 2012, 109, 11105–11109. [Google Scholar] [CrossRef] [PubMed]
- Guo, F.; Mao, Z.; Chen, Y.; Xie, Z.; Lata, J.P.; Li, P.; Ren, L.; Liu, J.; Yang, J.; Dao, M. Three-dimensional manipulation of single cells using surface acoustic waves. Proc. Natl. Acad. Sci. USA 2016, 113, 1522–1527. [Google Scholar] [CrossRef] [PubMed]
- Bouyer, C.; Chen, P.; Güven, S.; Demirtaş, T.T.; Nieland, T.J.; Padilla, F.; Demirci, U. A bio-acoustic levitational (BAL) assembly method for engineering of multilayered, 3d brain-like constructs, using human embryonic stem cell derived neuro-progenitors. Adv. Mater. 2016, 28, 161–167. [Google Scholar] [CrossRef] [PubMed]
- Garvin, K.A.; Dalecki, D.; Yousefhussien, M.; Helguera, M.; Hocking, D.C. Spatial patterning of endothelial cells and vascular network formation using ultrasound standing wave fields. J. Acoust. Soc. Am. 2013, 134, 1483–1490. [Google Scholar] [CrossRef] [PubMed]
- Naseer, S.M.; Manbachi, A.; Samandari, M.; Walch, P.; Gao, Y.; Zhang, Y.S.; Davoudi, F.; Wang, W.; Abrinia, K.; Cooper, J.M.; et al. Surface acoustic waves induced micropatterning of cells in gelatin methacryloyl (gelma) hydrogels. Biofabrication 2017, 9, 015020. [Google Scholar] [CrossRef] [PubMed]
- Wu, M.; Mao, Z.; Chen, K.; Bachman, H.; Chen, Y.; Rufo, J.; Ren, L.; Li, P.; Wang, L.; Huang, T.J. Acoustic separation of nanoparticles in continuous flow. Adv. Funct. Mater. 2017, 27. [Google Scholar] [CrossRef]
- Collins, D.J.; Morahan, B.; Garcia-Bustos, J.; Doerig, C.; Plebanski, M.; Neild, A. Two-dimensional single-cell patterning with one cell per well driven by surface acoustic waves. Nat. Commun. 2015, 6, 8686. [Google Scholar] [CrossRef] [PubMed]
- King, L.V. On the acoustic radiation pressure on spheres. In Proceedings of the Royal Society of London A: Mathematical, Physical and Engineering Sciences; The Royal Society: London, UK, 1934; Volume 147, pp. 212–240. [Google Scholar]
- Yosioka, K.; Kawasima, Y. Acoustic radiation pressure on a compressible sphere. Acta Acust. United Acust. 1955, 5, 167–173. [Google Scholar]
- Gor’Kov, L. On the forces acting on a small particle in an acoustical field in an ideal fluid. Sov. Phys. Dokl. 1962, 6, 773. [Google Scholar]
- Muller, P.B.; Barnkob, R.; Jensen, M.J.H.; Bruus, H. A numerical study of microparticle acoustophoresis driven by acoustic radiation forces and streaming-induced drag forces. Lab Chip 2012, 12, 4617–4627. [Google Scholar] [CrossRef] [PubMed] [Green Version]
- Karlsen, J.T.; Bruus, H. Forces acting on a small particle in an acoustical field in a thermoviscous fluid. Phys. Rev. E 2015, 92, 043010. [Google Scholar] [CrossRef] [PubMed]
- Settnes, M.; Bruus, H. Forces acting on a small particle in an acoustical field in a viscous fluid. Phys. Rev. E 2012, 85, 016327. [Google Scholar] [CrossRef] [PubMed]
- Hasegawa, T.; Yosioka, K. Acoustic-radiation force on a solid elastic sphere. J. Acoust. Soc. Am. 1969, 46, 1139–1143. [Google Scholar] [CrossRef]
- Hasegawa, T. Acoustic radiation force on a sphere in a quasistationary wave field—Theory. J. Acoust. Soc. Am. 1979, 65, 32–40. [Google Scholar] [CrossRef]
- Glynne-Jones, P.; Mishra, P.P.; Boltryk, R.J.; Hill, M. Efficient finite element modeling of radiation forces on elastic particles of arbitrary size and geometry. J. Acoust. Soc. Am. 2013, 133, 1885–1893. [Google Scholar] [CrossRef] [PubMed]
- Drinkwater, B.W. Dynamic-field devices for the ultrasonic manipulation of microparticles. Lab Chip 2016, 16, 2360–2375. [Google Scholar] [CrossRef] [PubMed]
- Cai, F.; Meng, L.; Jiang, C.; Pan, Y.; Zheng, H. Computation of the acoustic radiation force using the finite-difference time-domain method. J. Acoust. Soc. Am. 2010, 128, 1617–1622. [Google Scholar] [CrossRef] [PubMed]
- Grinenko, A.; Wilcox, P.; Courtney, C.; Drinkwater, B. Acoustic radiation force analysis using finite difference time domain method. J. Acoust. Soc. Am. 2012, 131, 3664–3670. [Google Scholar] [CrossRef] [PubMed]
- Bruus, H. Acoustofluidics 2: Perturbation theory and ultrasound resonance modes. Lab Chip 2012, 12, 20–28. [Google Scholar] [CrossRef] [PubMed]
- Ai, Y.; Sanders, C.K.; Marrone, B.L. Separation of escherichia coli bacteria from peripheral blood mononuclear cells using standing surface acoustic waves. Anal. Chem. 2013, 85, 9126–9134. [Google Scholar] [CrossRef] [PubMed]
- Muller, P.B.; Bruus, H. Numerical study of thermoviscous effects in ultrasound-induced acoustic streaming in microchannels. Phys. Rev. E 2014, 90, 043016. [Google Scholar] [CrossRef] [PubMed]
- Bruus, H. Acoustofluidics 7: The acoustic radiation force on small particles. Lab Chip 2012, 12, 1014–1021. [Google Scholar] [CrossRef] [PubMed]
- Samandari, M.; Abrinia, K.; Mokhtari-Dizaji, M.; Tamayol, A. Ultrasound induced strain cytoskeleton rearrangement: An experimental and simulation study. J. Biomech. 2017, 60, 39–47. [Google Scholar] [CrossRef] [PubMed]
- Hartono, D.; Liu, Y.; Tan, P.L.; Then, X.Y.S.; Yung, L.-Y.L.; Lim, K.-M. On-chip measurements of cell compressibility via acoustic radiation. Lab Chip 2011, 11, 4072–4080. [Google Scholar] [CrossRef] [PubMed]
- Nama, N.; Barnkob, R.; Mao, Z.; Kähler, C.J.; Costanzo, F.; Huang, T.J. Numerical study of acoustophoretic motion of particles in a pdms microchannel driven by surface acoustic waves. Lab Chip 2015, 15, 2700–2709. [Google Scholar] [CrossRef] [PubMed]
- Morley, M.J. Derivation of physical properties of muscle tissue from adiabatic pressure-induced temperature measurements. Int. J. Food Sci. Technol. 1986, 21, 269–277. [Google Scholar] [CrossRef]
- Rabin, Y.; Plitz, J. Thermal expansion of blood vessels and muscle specimens permeated with dmso, dp6, and vs55 at cryogenic temperatures. Ann. Biomed. Eng. 2005, 33, 1213–1228. [Google Scholar] [CrossRef] [PubMed]
- Rodrigues, D.B.; Maccarini, P.F.; Salahi, S.; Colebeck, E.; Topsakal, E.; Pereira, P.J.S.; Limão-Vieira, P.; Stauffer, P.R. Numerical 3d modeling of heat transfer in human tissues for microwave radiometry monitoring of brown fat metabolism. Proc. SPIE 2013, 8584. [Google Scholar] [CrossRef]
- O’Brien, W.D. Ultrasound—biophysics mechanisms. Prog. Biophys. Mol. Biol. 2007, 93, 212–255. [Google Scholar] [PubMed]
- Ding, X.; Peng, Z.; Lin, S.-C.S.; Geri, M.; Li, S.; Li, P.; Chen, Y.; Dao, M.; Suresh, S.; Huang, T.J. Cell separation using tilted-angle standing surface acoustic waves. Proc. Natl. Acad. Sci. USA 2014, 111, 12992–12997. [Google Scholar] [CrossRef] [PubMed]
- Wang, H.; Liu, Z.; Shin, D.M.; Chen, Z.; Cho, Y.; Jang, D.-Y.; Kim, Y.-J.; Han, A. Acoustophoretic force-based compressibility measurement of cancer cells having different metastatic potential. In Proceedings of the Meetings on Acoustics ICA2013, Montreal, QC, Canada, 2–7 June 2013; ASA: Monroe, MI, USA, 2013. [Google Scholar]
- Gesellchen, F.; Bernassau, A.; Dejardin, T.; Cumming, D.; Riehle, M. Cell patterning with a heptagon acoustic tweezer–application in neurite guidance. Lab Chip 2014, 14, 2266–2275. [Google Scholar] [CrossRef] [PubMed] [Green Version]
- Guo, F.; Li, P.; French, J.B.; Mao, Z.; Zhao, H.; Li, S.; Nama, N.; Fick, J.R.; Benkovic, S.J.; Huang, T.J. Controlling cell–cell interactions using surface acoustic waves. Proc. Natl. Acad. Sci. USA 2015, 112, 43–48. [Google Scholar] [CrossRef] [PubMed]
- Kinsler, L.E. Fundamentals of Acoustics, 4th ed.; Wiley: Hoboken, NJ, USA, 2000; ISBN 978-0-471-84789-2. [Google Scholar]


| Property | Fluid (a) | BP | Symbol | Unit |
|---|---|---|---|---|
| Density | 1.0 × 10³ | 1.079 × 10³ (c) | kg m−3 | |
| Shear modulus | - | 1.67 × 10³ (c) | G | Pa |
| Isentropic compressibility | 4.433 × 10⁻¹⁰ (b) | 3.78 × 10⁻¹⁰ (c) | β | Pa−1 |
| Thermal expansion | 2.748 × 10⁻⁴ | 2.0 × 10⁻⁴ (d) | α | K−1 |
| Specific heat capacity at constant pressure | 4.181 × 10³ | 3.421 × 10³ (e) | hc | J kg−1K−1 |
| Ratio of specific heats | 1.012 | 1.012 (f) | γ | 1 |
| Thermal conductivity | 6.095 × 10⁻¹ | 4.9 × 10⁻¹ (e) | kt | Wm−1K−1 |
| Longitudinal (compressional) wave speed | 1.502 × 10³ | 1.566 × 10³ (g) | c | m s−1 |
| Transvers (shear) wave speed | - | 1.244 × 10³ (h) | cs | m s−1 |
| Shear viscosity | 8.538 × 10⁻⁴ | - | μ | Pa s |
| Bulk viscosity | 2.4 × 10⁻³ | - | μb | Pa s |
© 2017 by the authors. Licensee MDPI, Basel, Switzerland. This article is an open access article distributed under the terms and conditions of the Creative Commons Attribution (CC BY) license (http://creativecommons.org/licenses/by/4.0/).
Share and Cite
Samandari, M.; Abrinia, K.; Sanati-Nezhad, A. Acoustic Manipulation of Bio-Particles at High Frequencies: An Analytical and Simulation Approach. Micromachines 2017, 8, 290. https://doi.org/10.3390/mi8100290
Samandari M, Abrinia K, Sanati-Nezhad A. Acoustic Manipulation of Bio-Particles at High Frequencies: An Analytical and Simulation Approach. Micromachines. 2017; 8(10):290. https://doi.org/10.3390/mi8100290
Chicago/Turabian StyleSamandari, Mohamadmahdi, Karen Abrinia, and Amir Sanati-Nezhad. 2017. "Acoustic Manipulation of Bio-Particles at High Frequencies: An Analytical and Simulation Approach" Micromachines 8, no. 10: 290. https://doi.org/10.3390/mi8100290
APA StyleSamandari, M., Abrinia, K., & Sanati-Nezhad, A. (2017). Acoustic Manipulation of Bio-Particles at High Frequencies: An Analytical and Simulation Approach. Micromachines, 8(10), 290. https://doi.org/10.3390/mi8100290