
Optofluidic Fabry-Pérot Micro-Cavities Comprising Curved Surfaces for Homogeneous Liquid Refractometry—Design, Simulation, and Experimental Performance Assessment


Abstract
:
1. Introduction
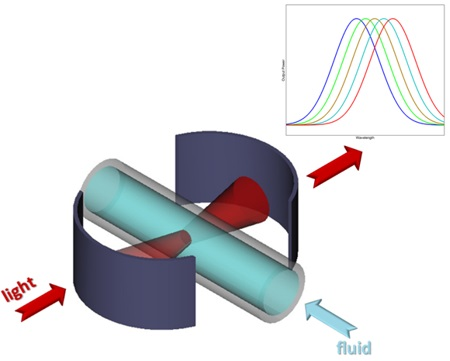
2. Design
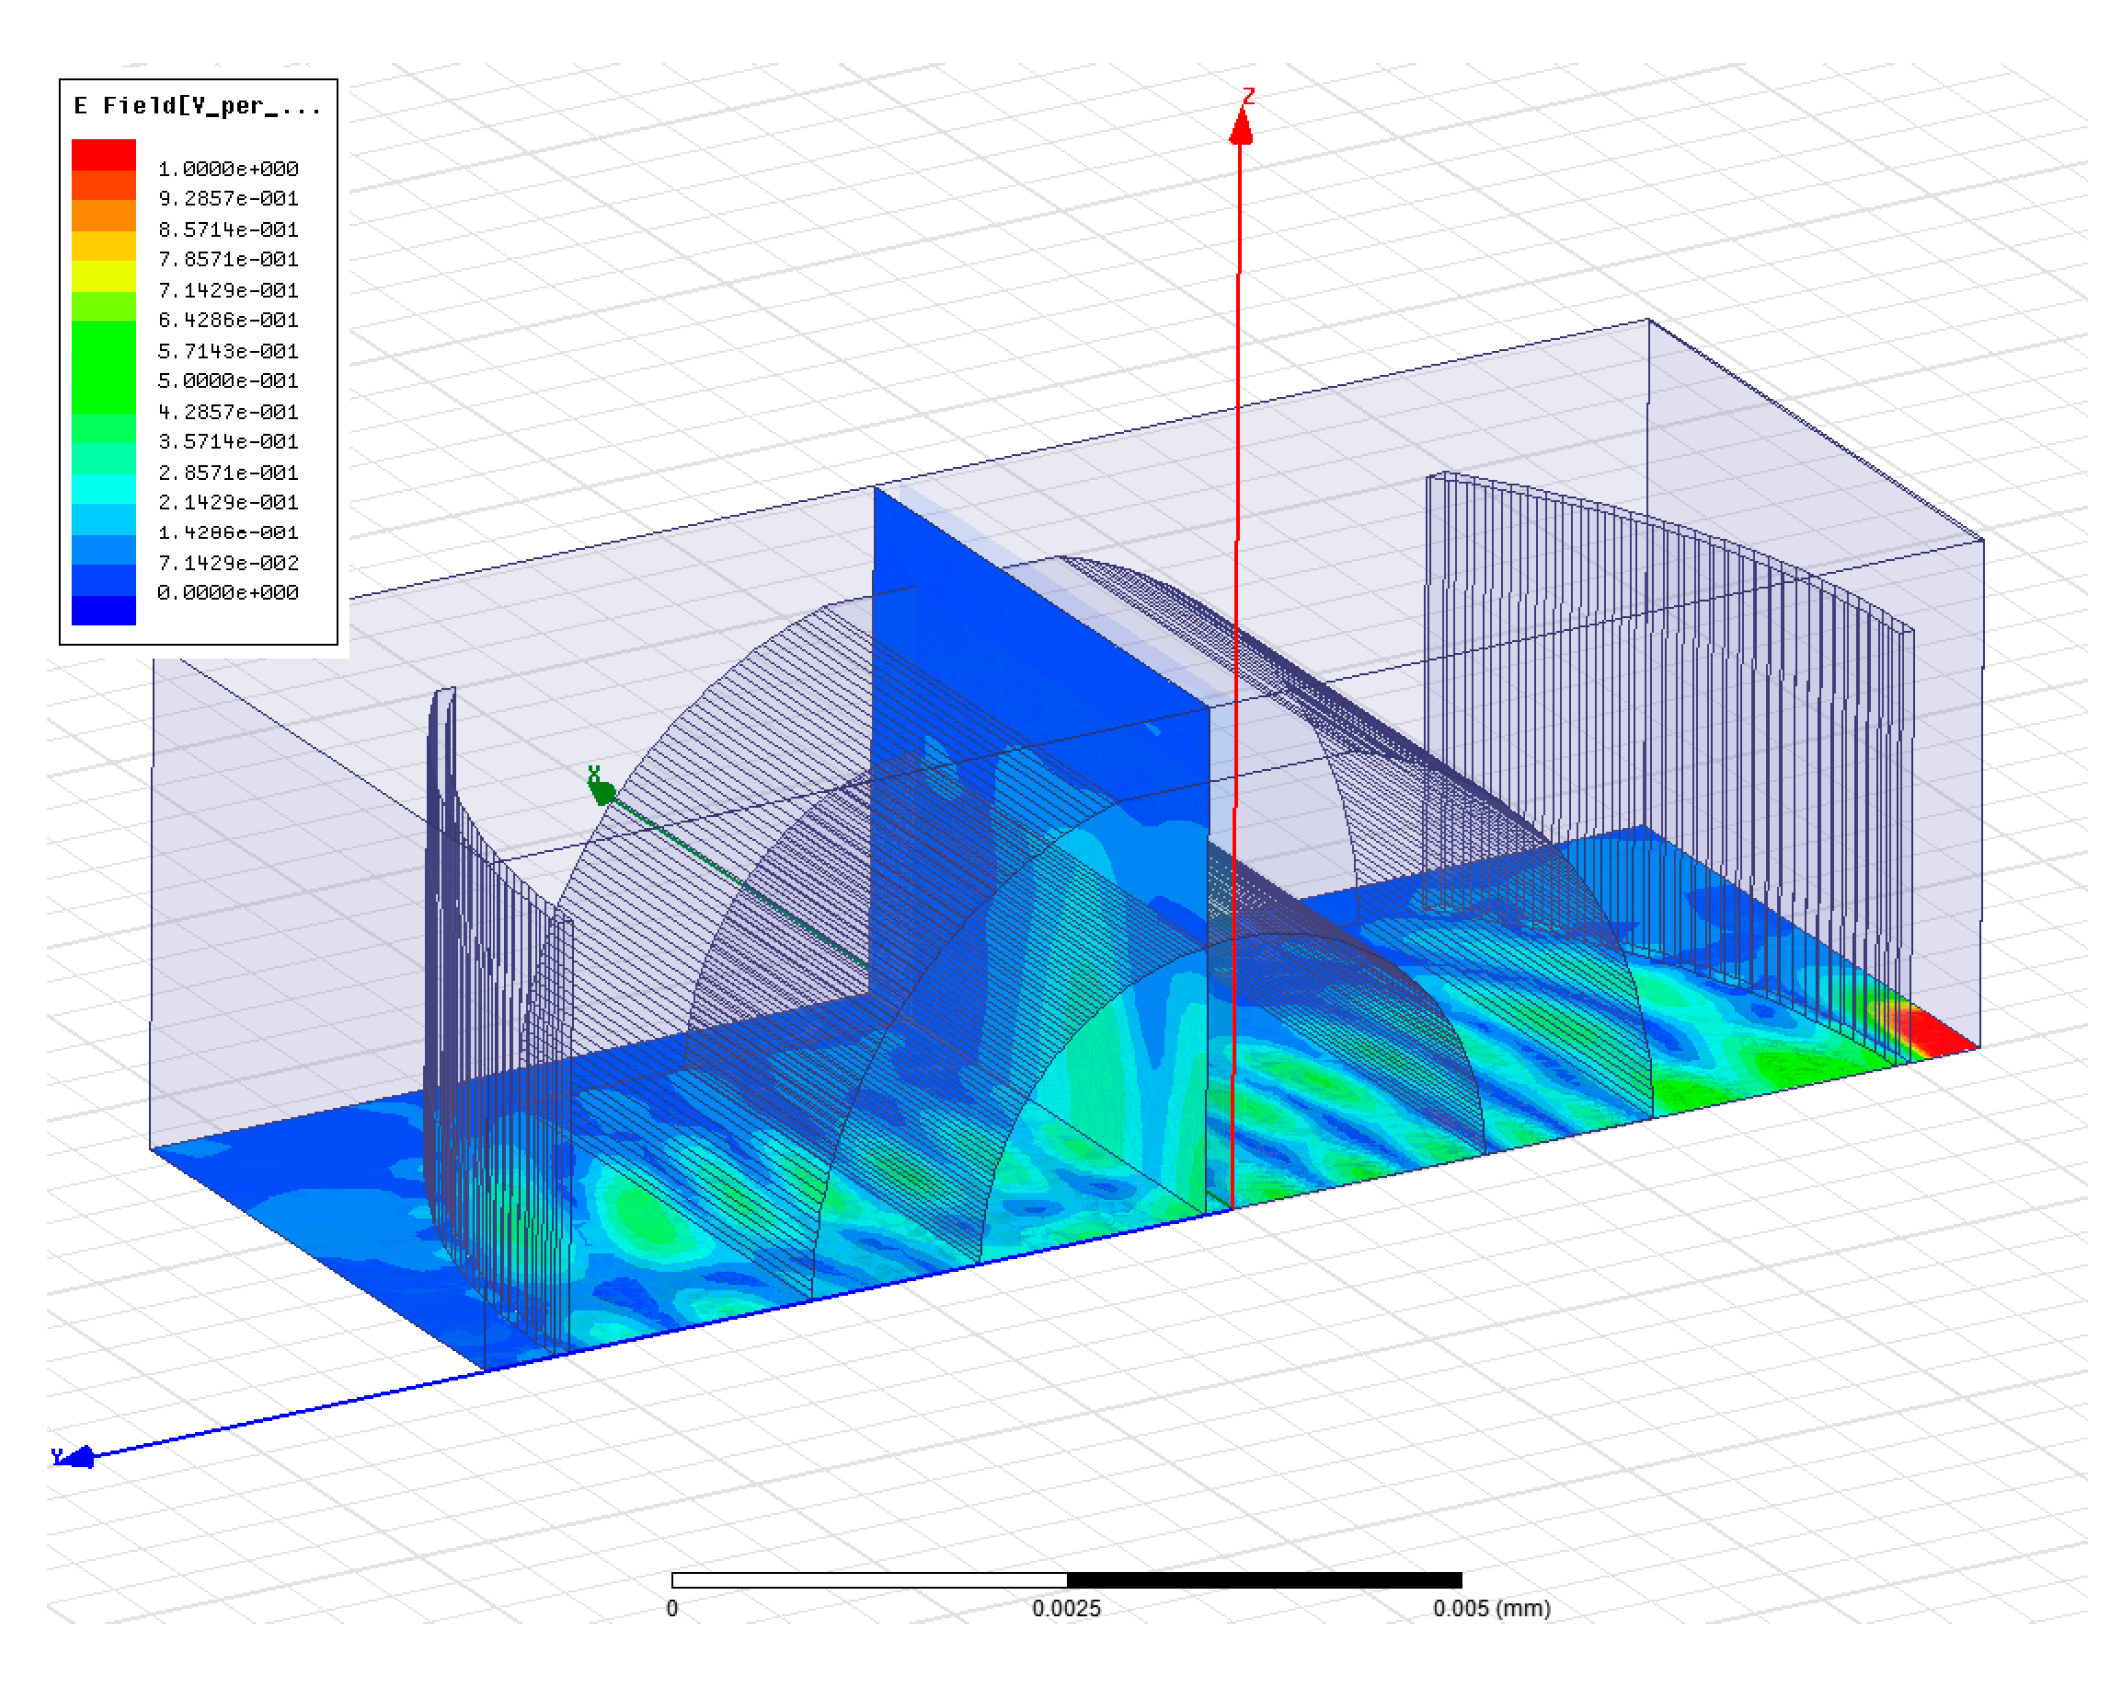
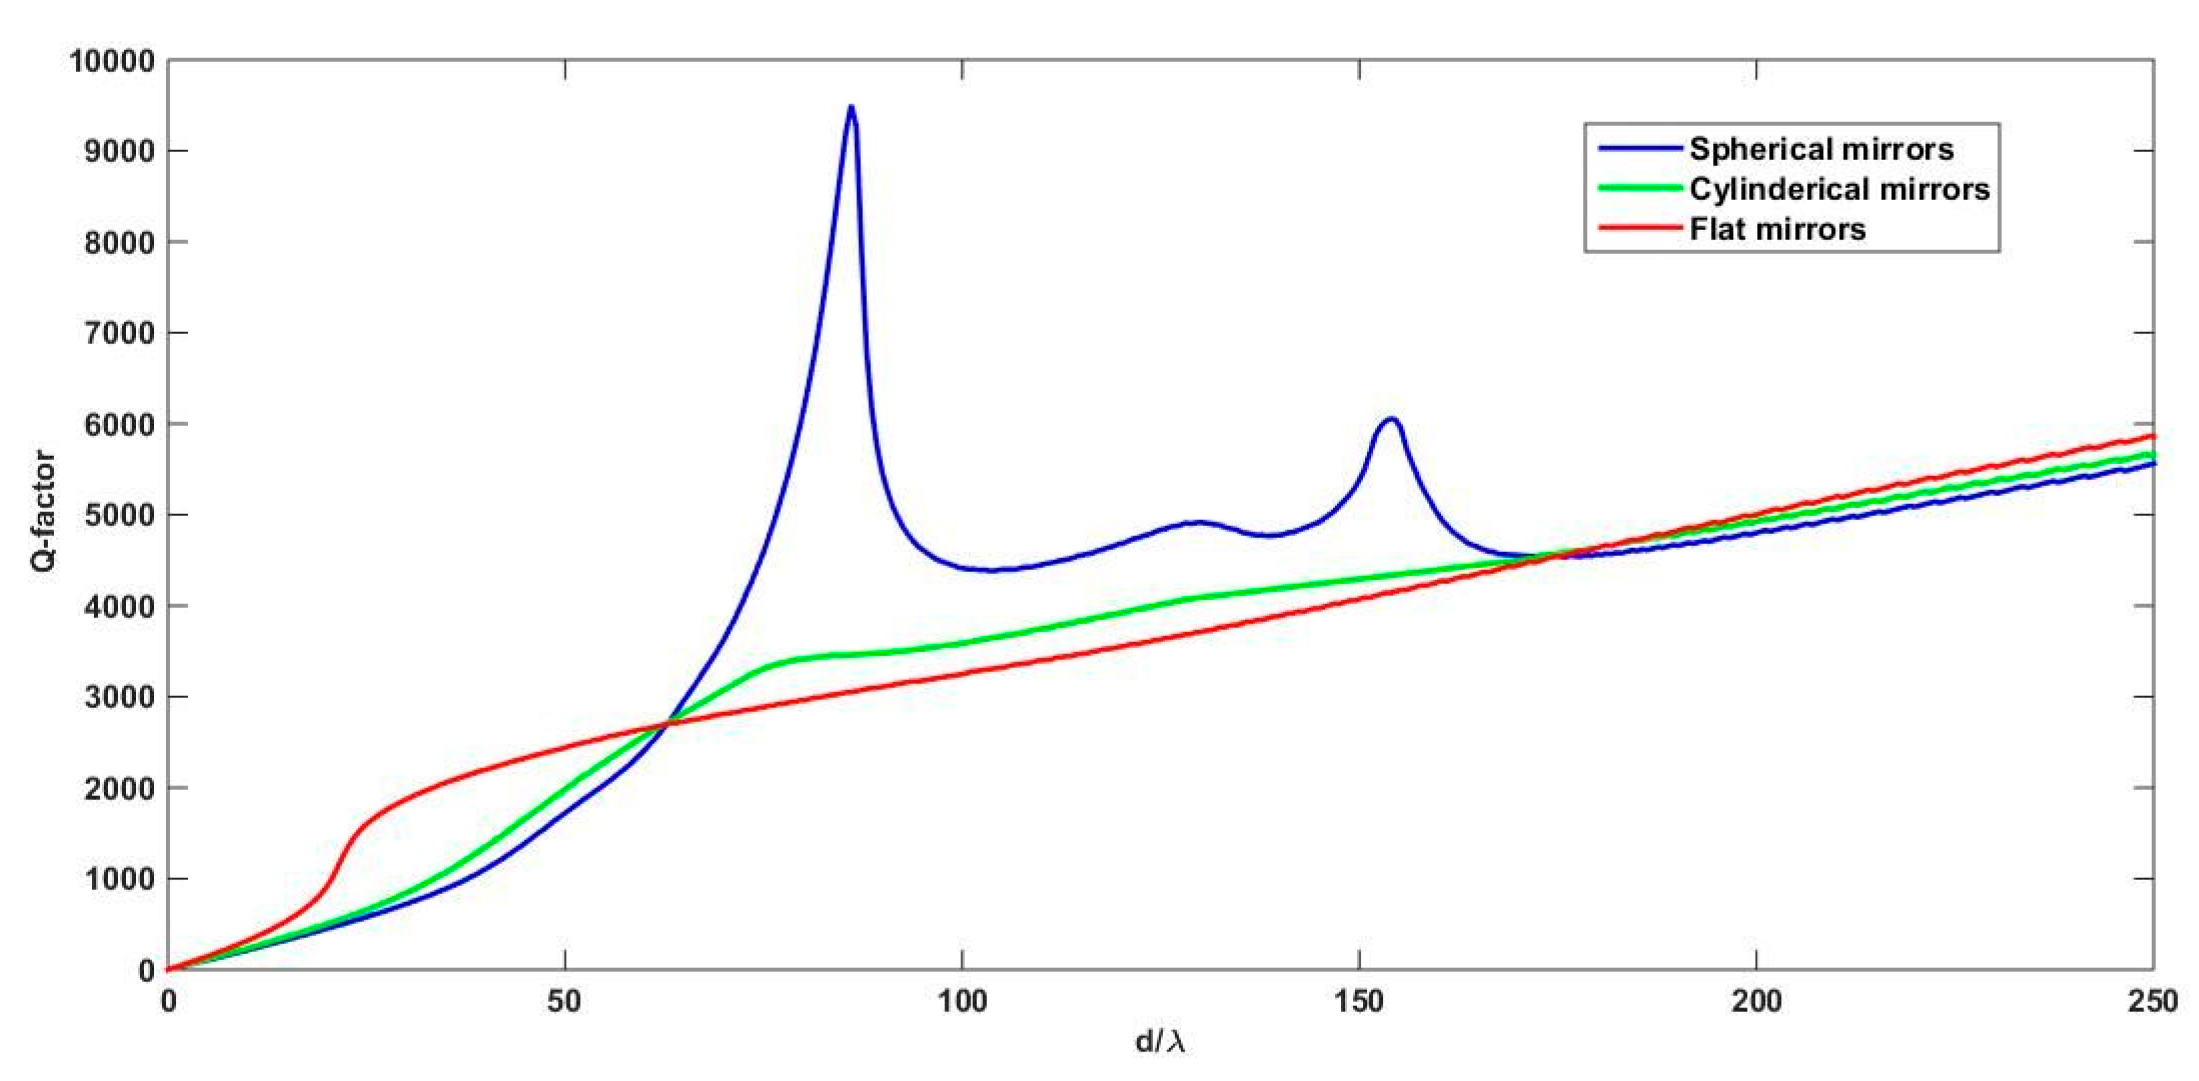
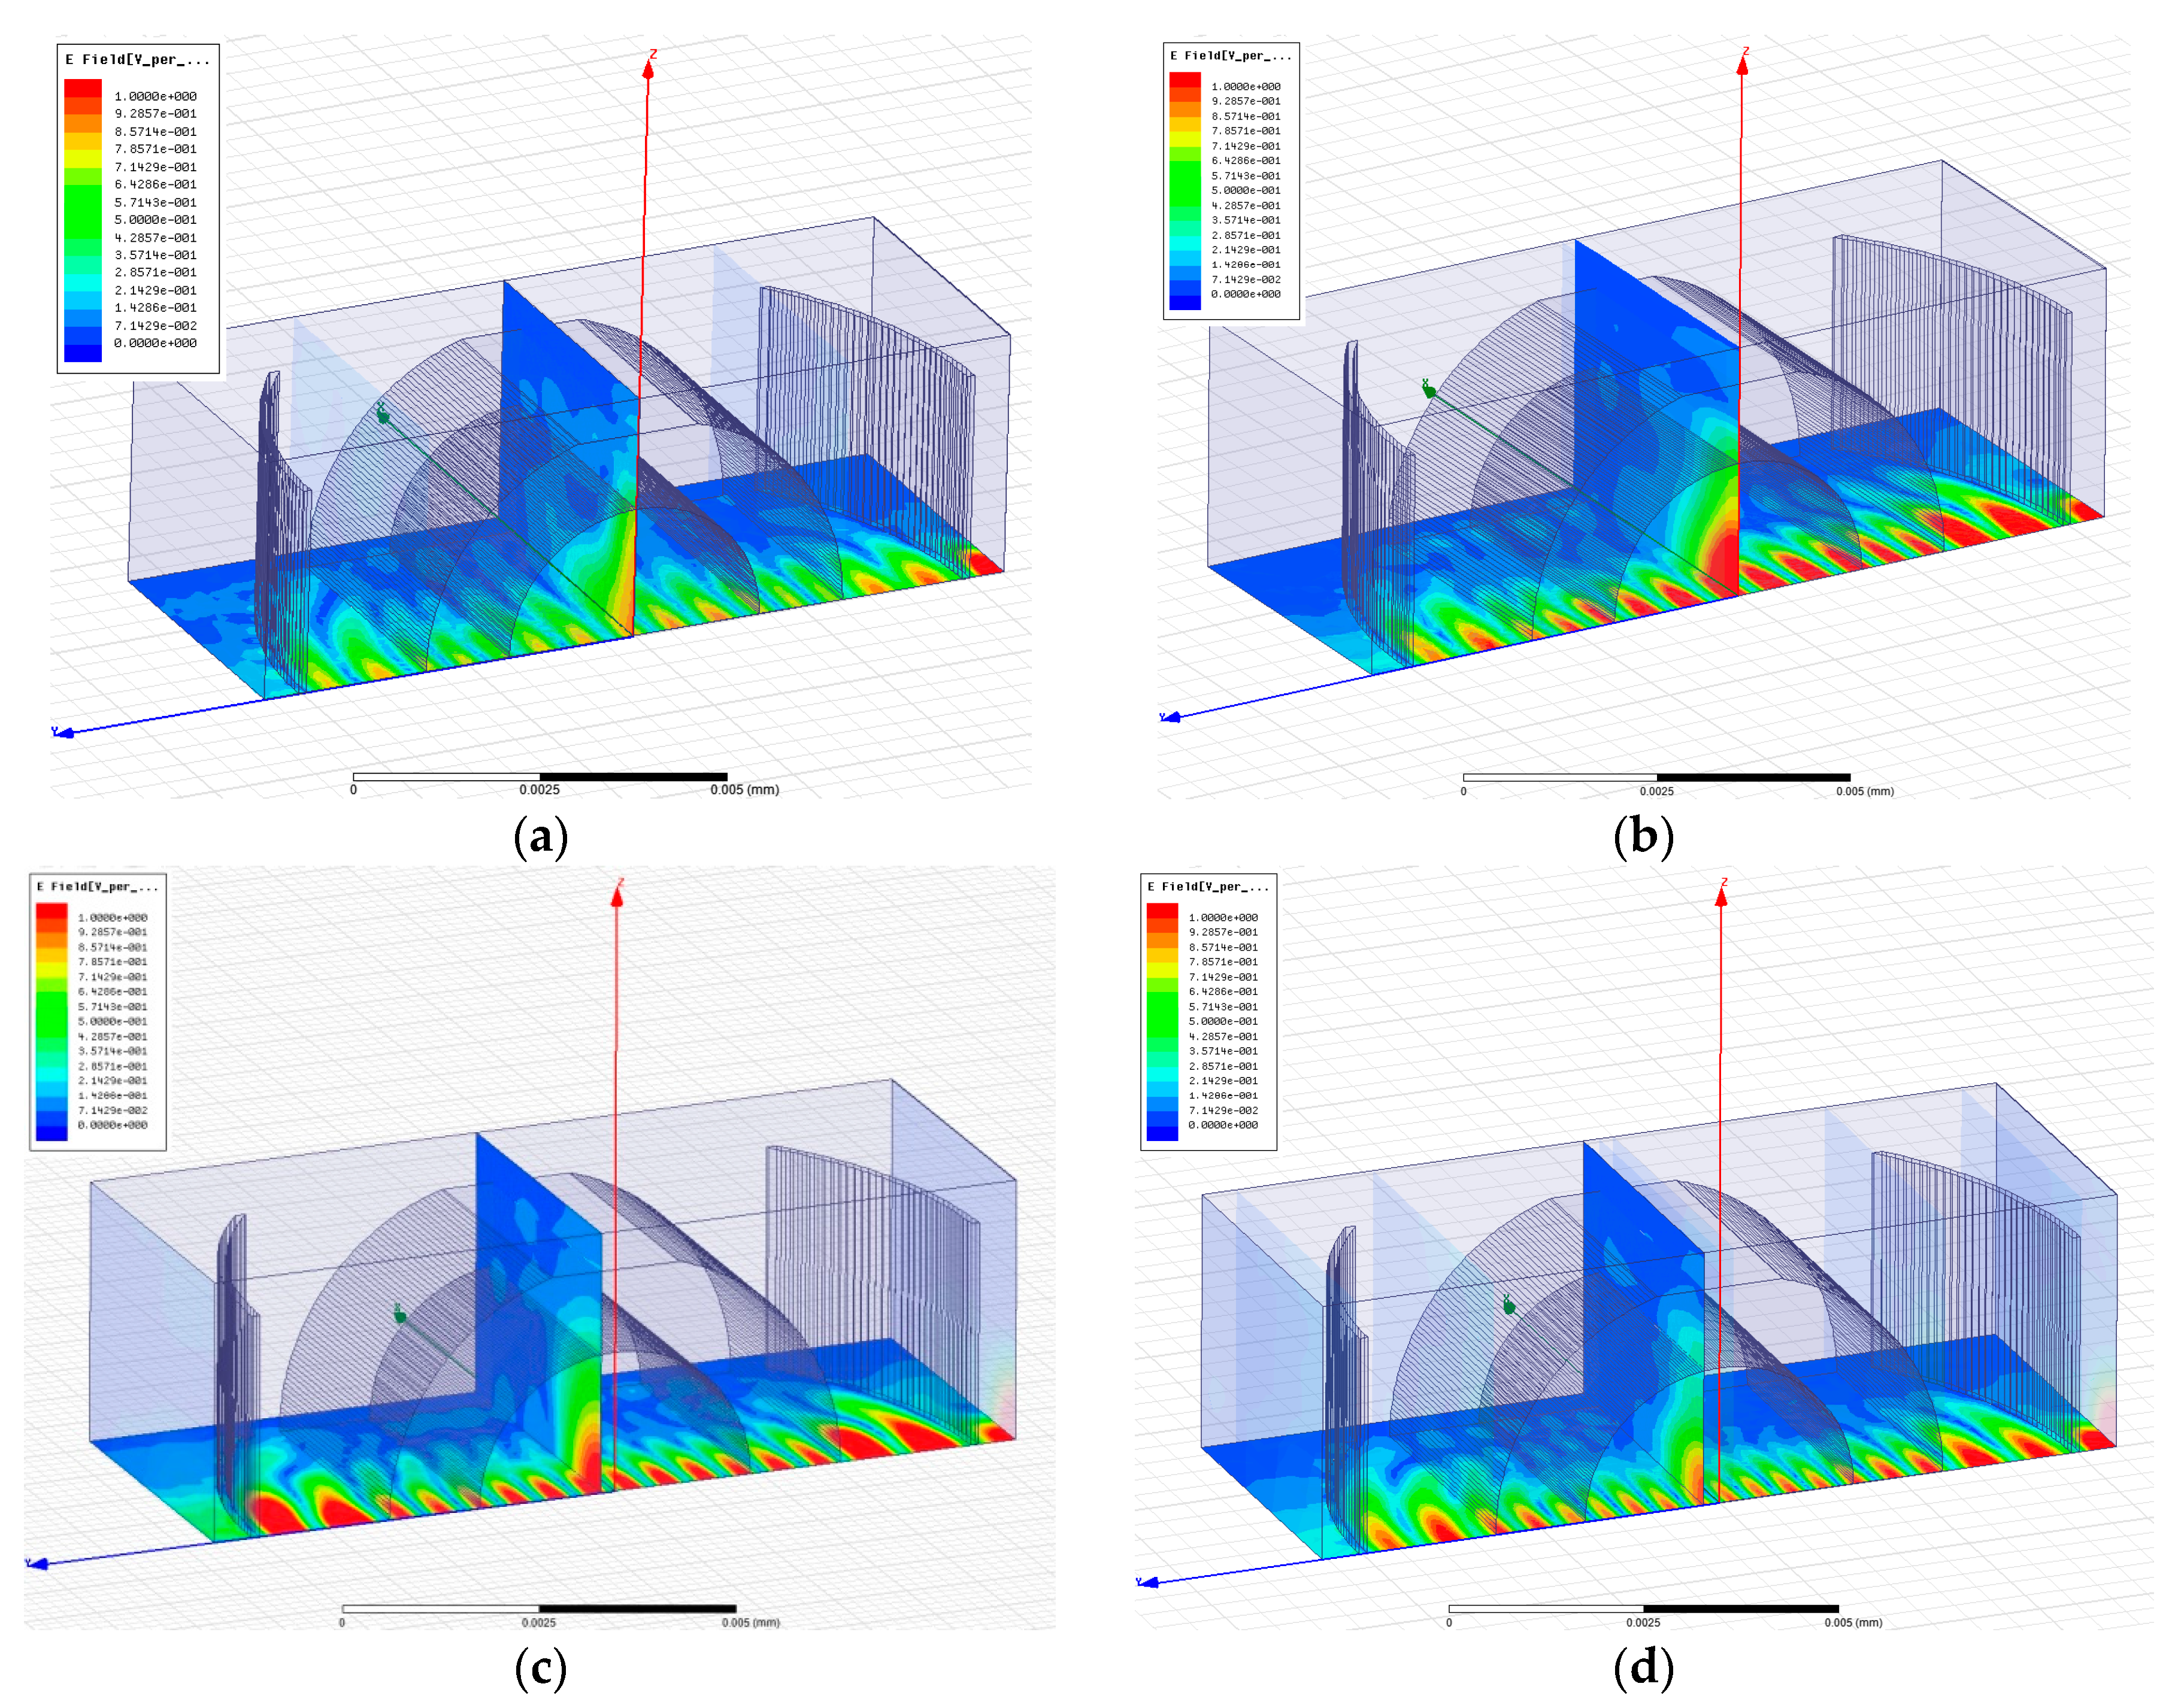
3. Simulation
4. Materials and Methods
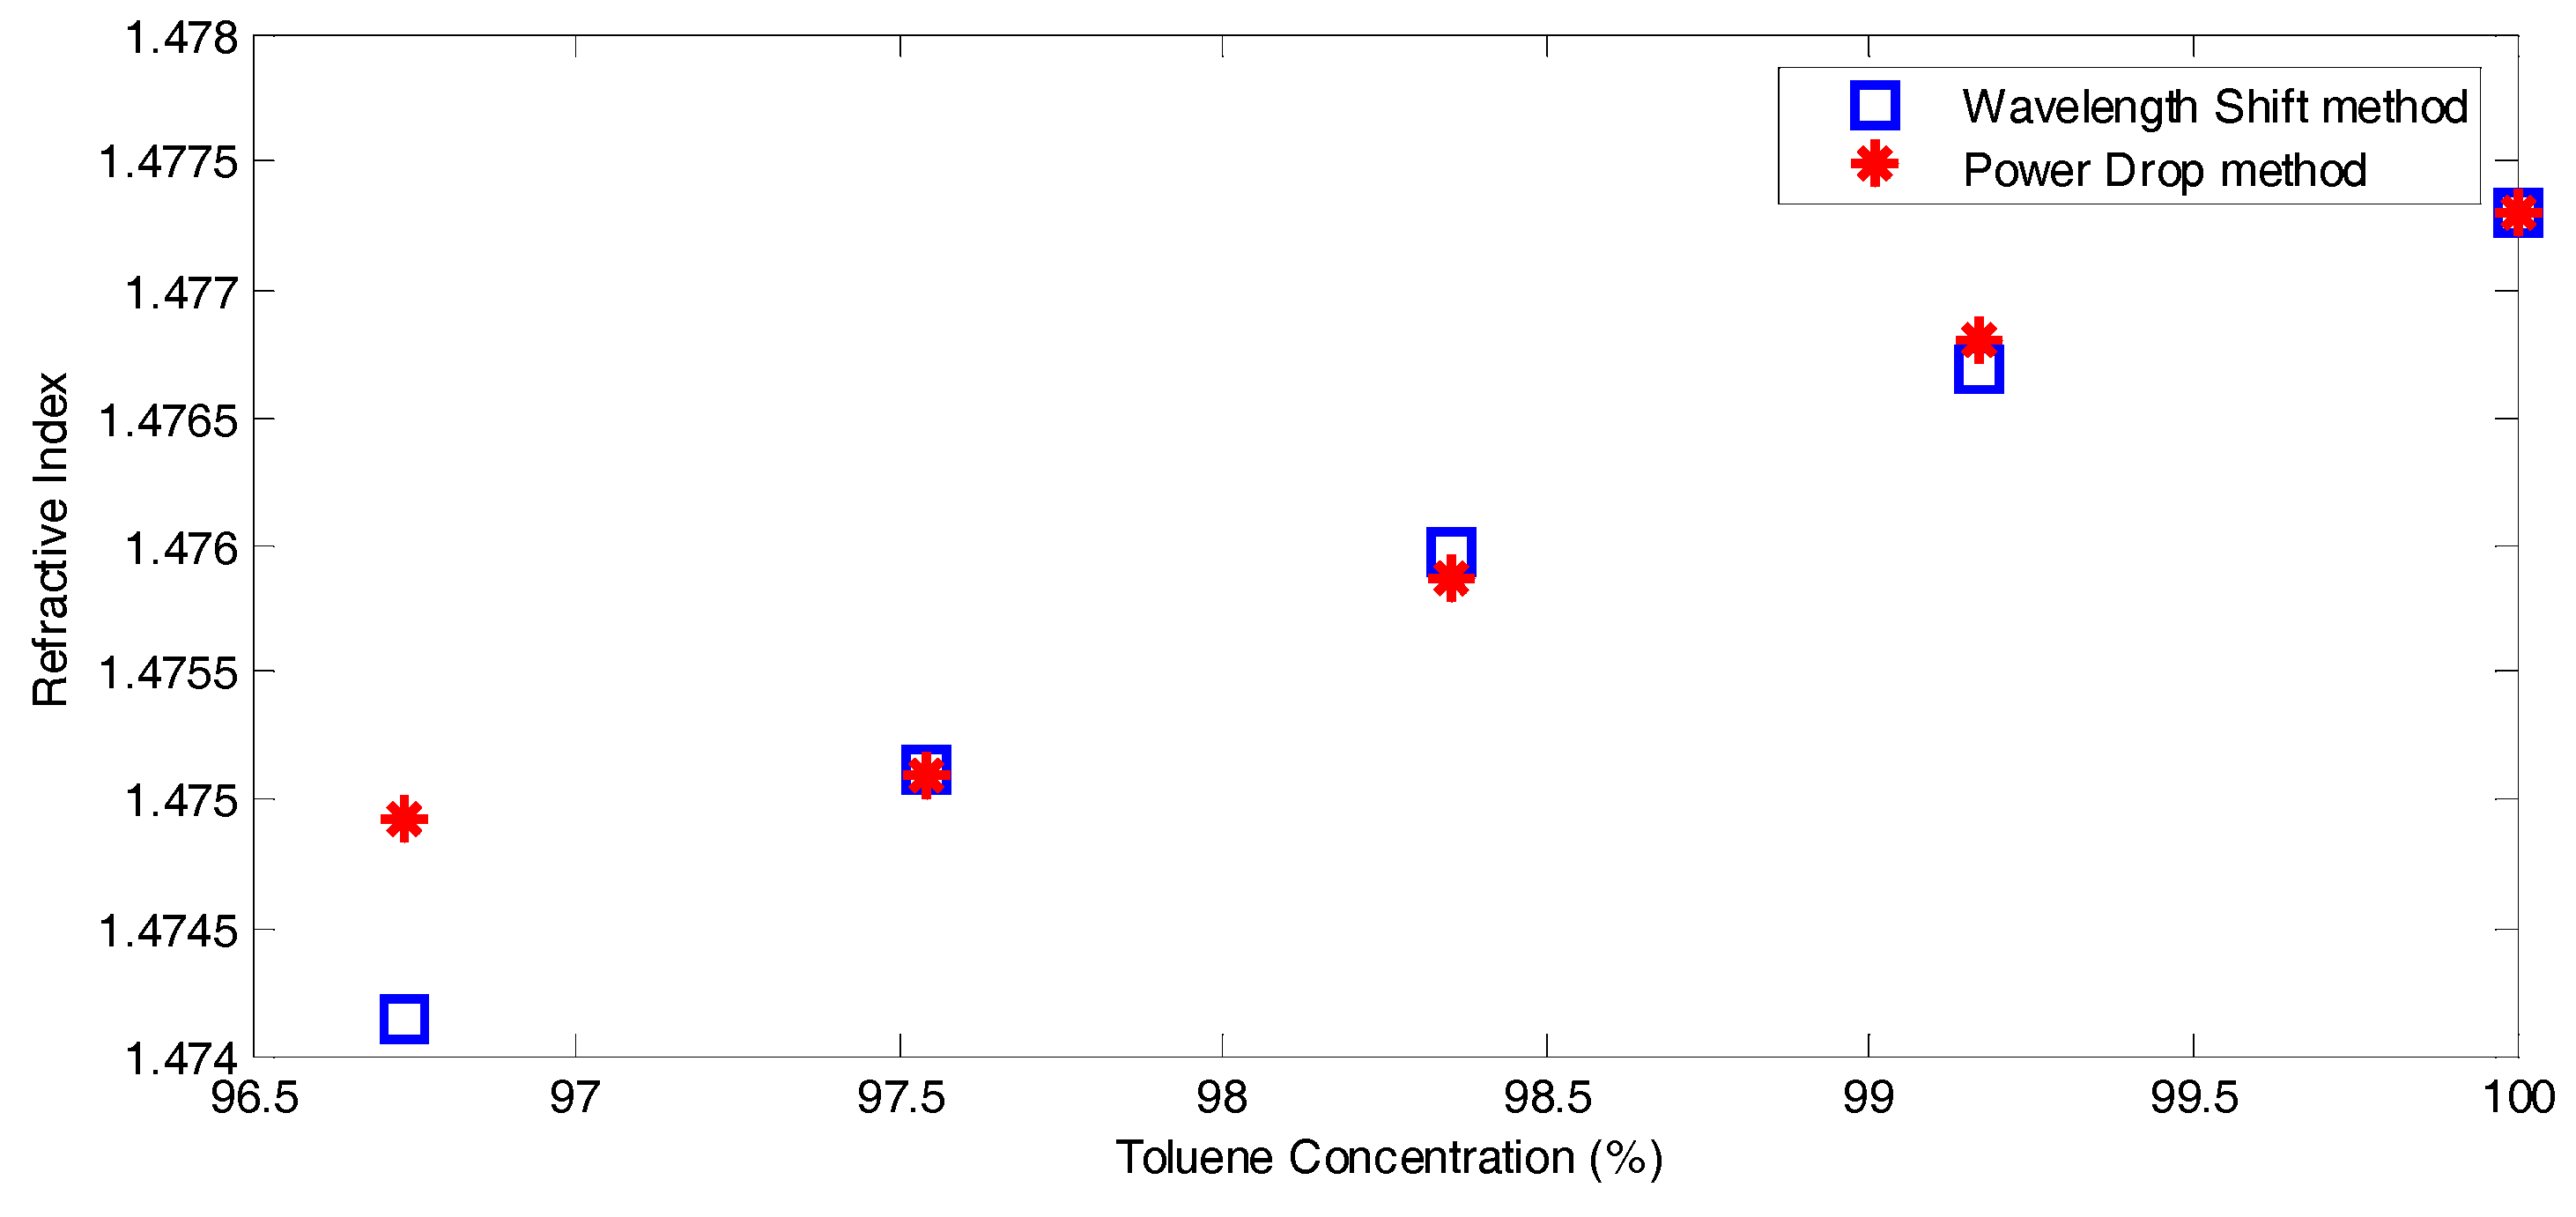
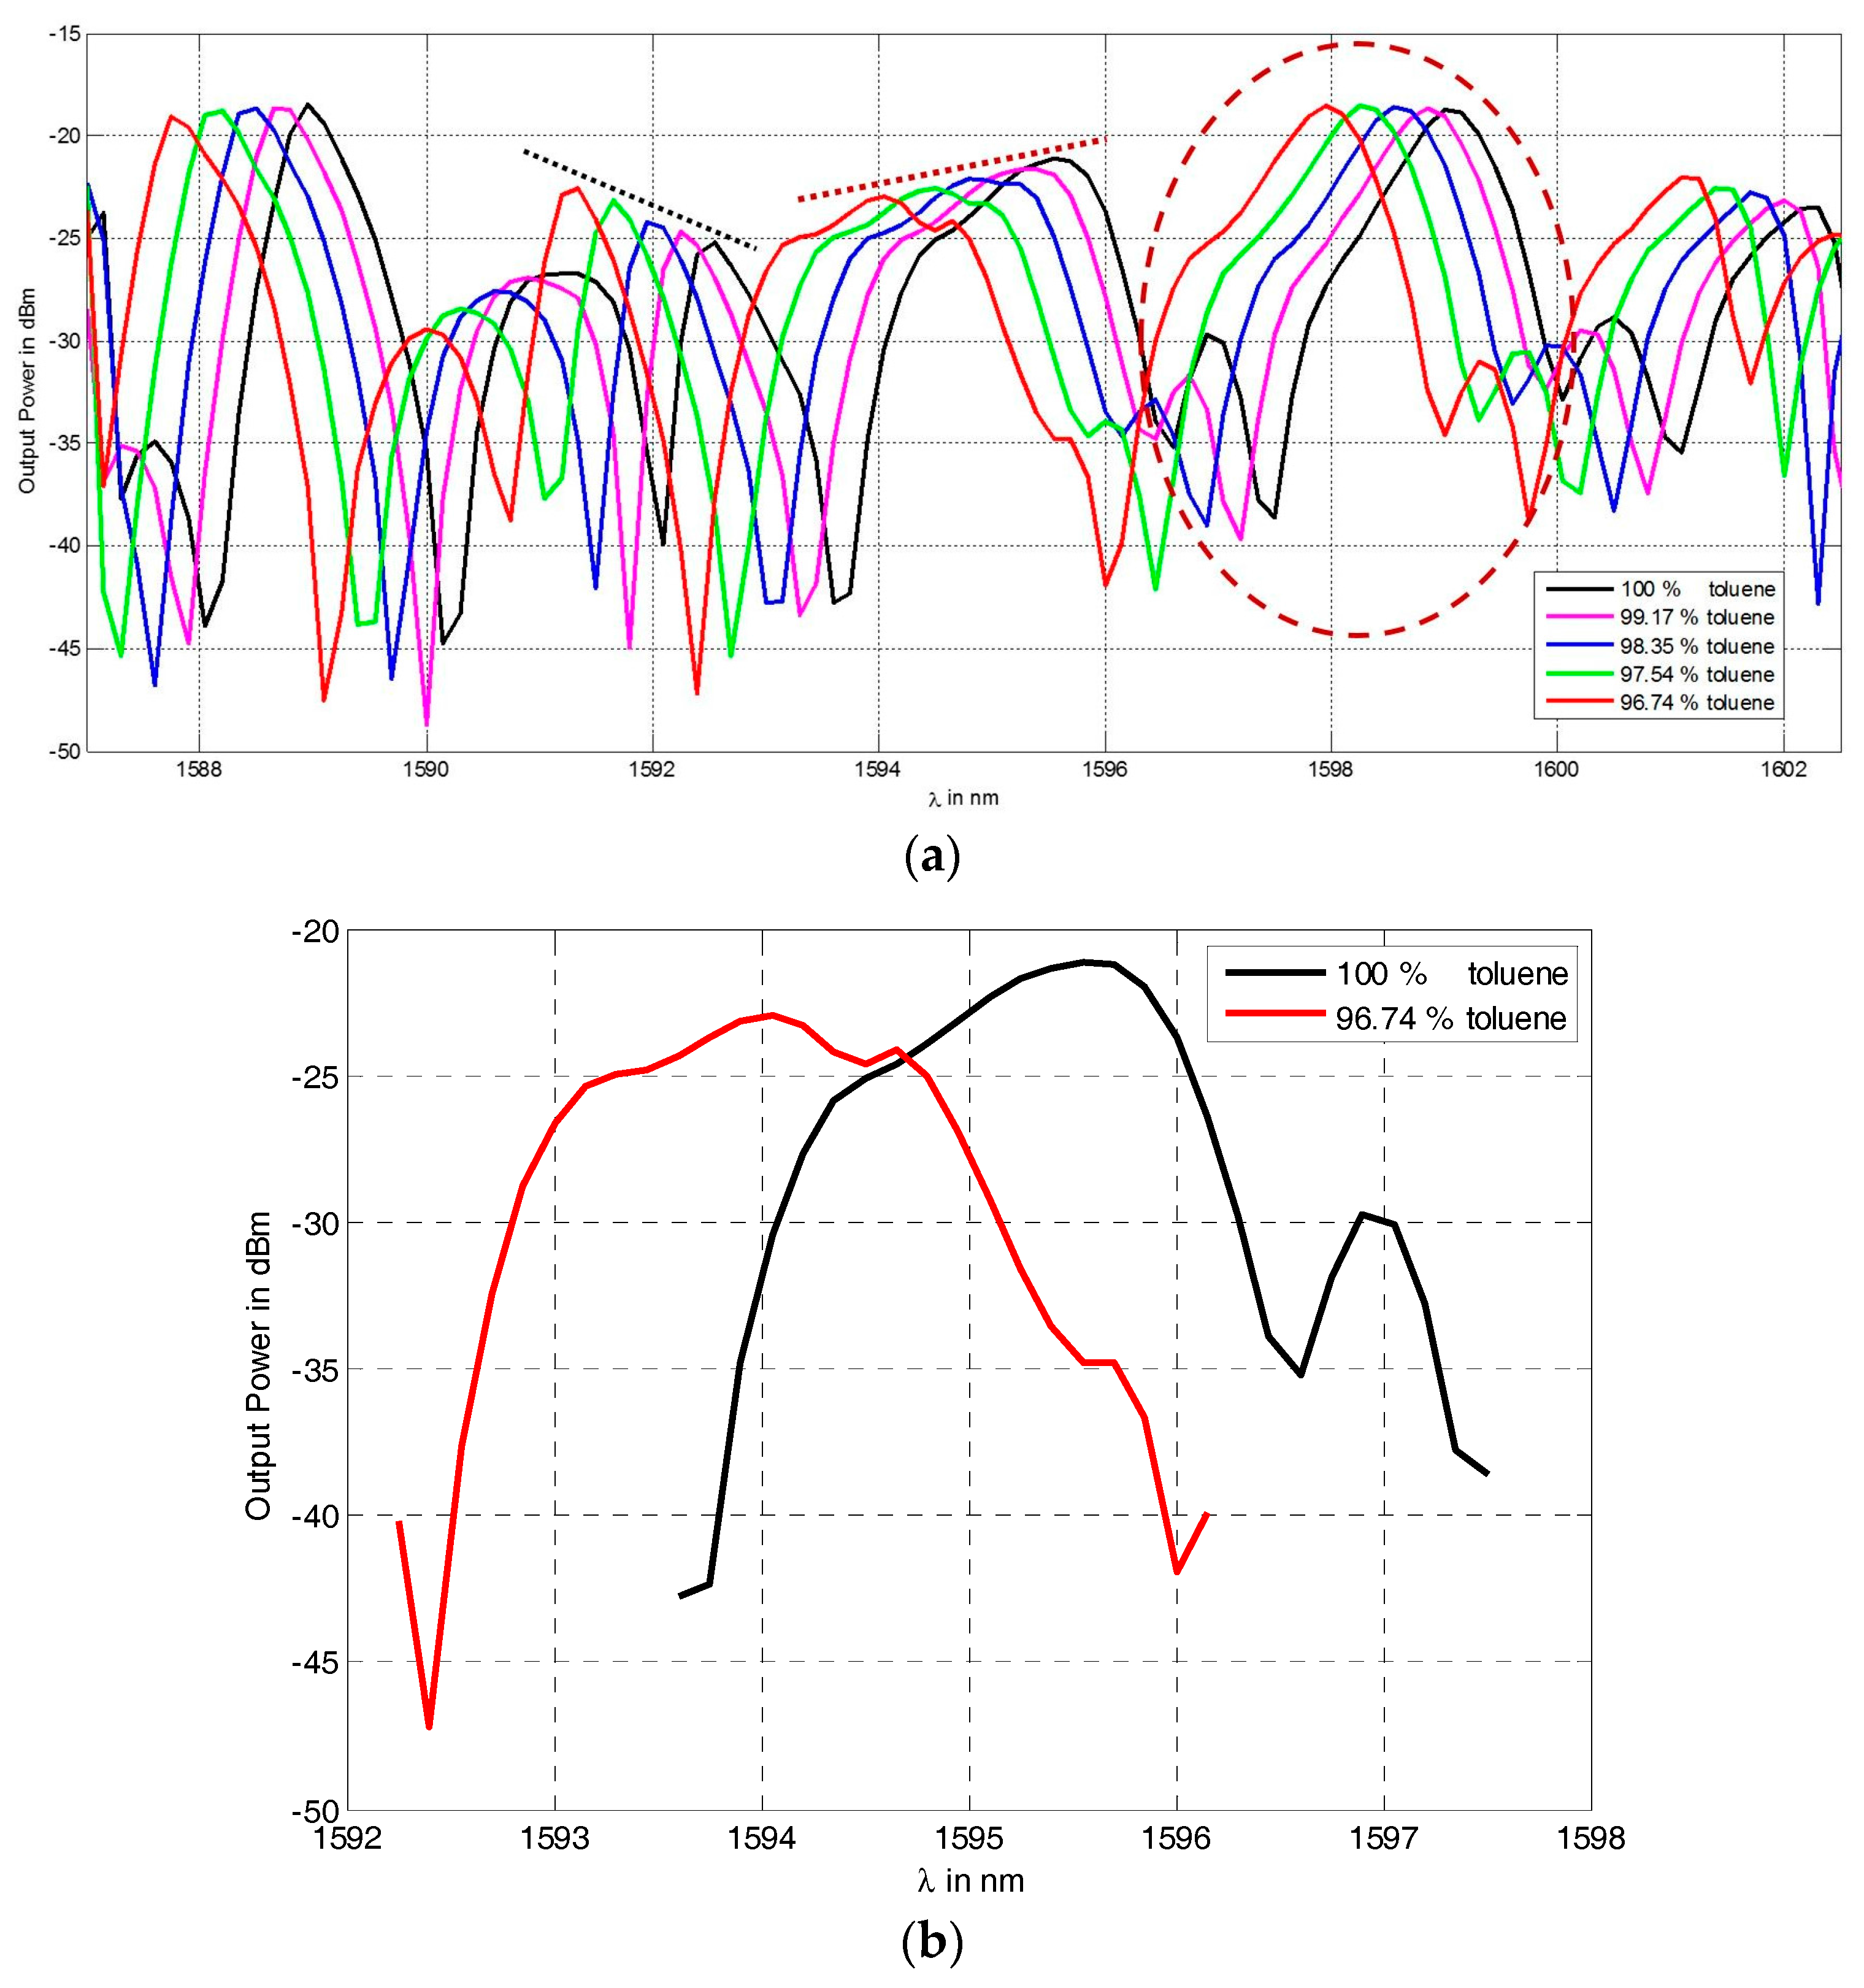
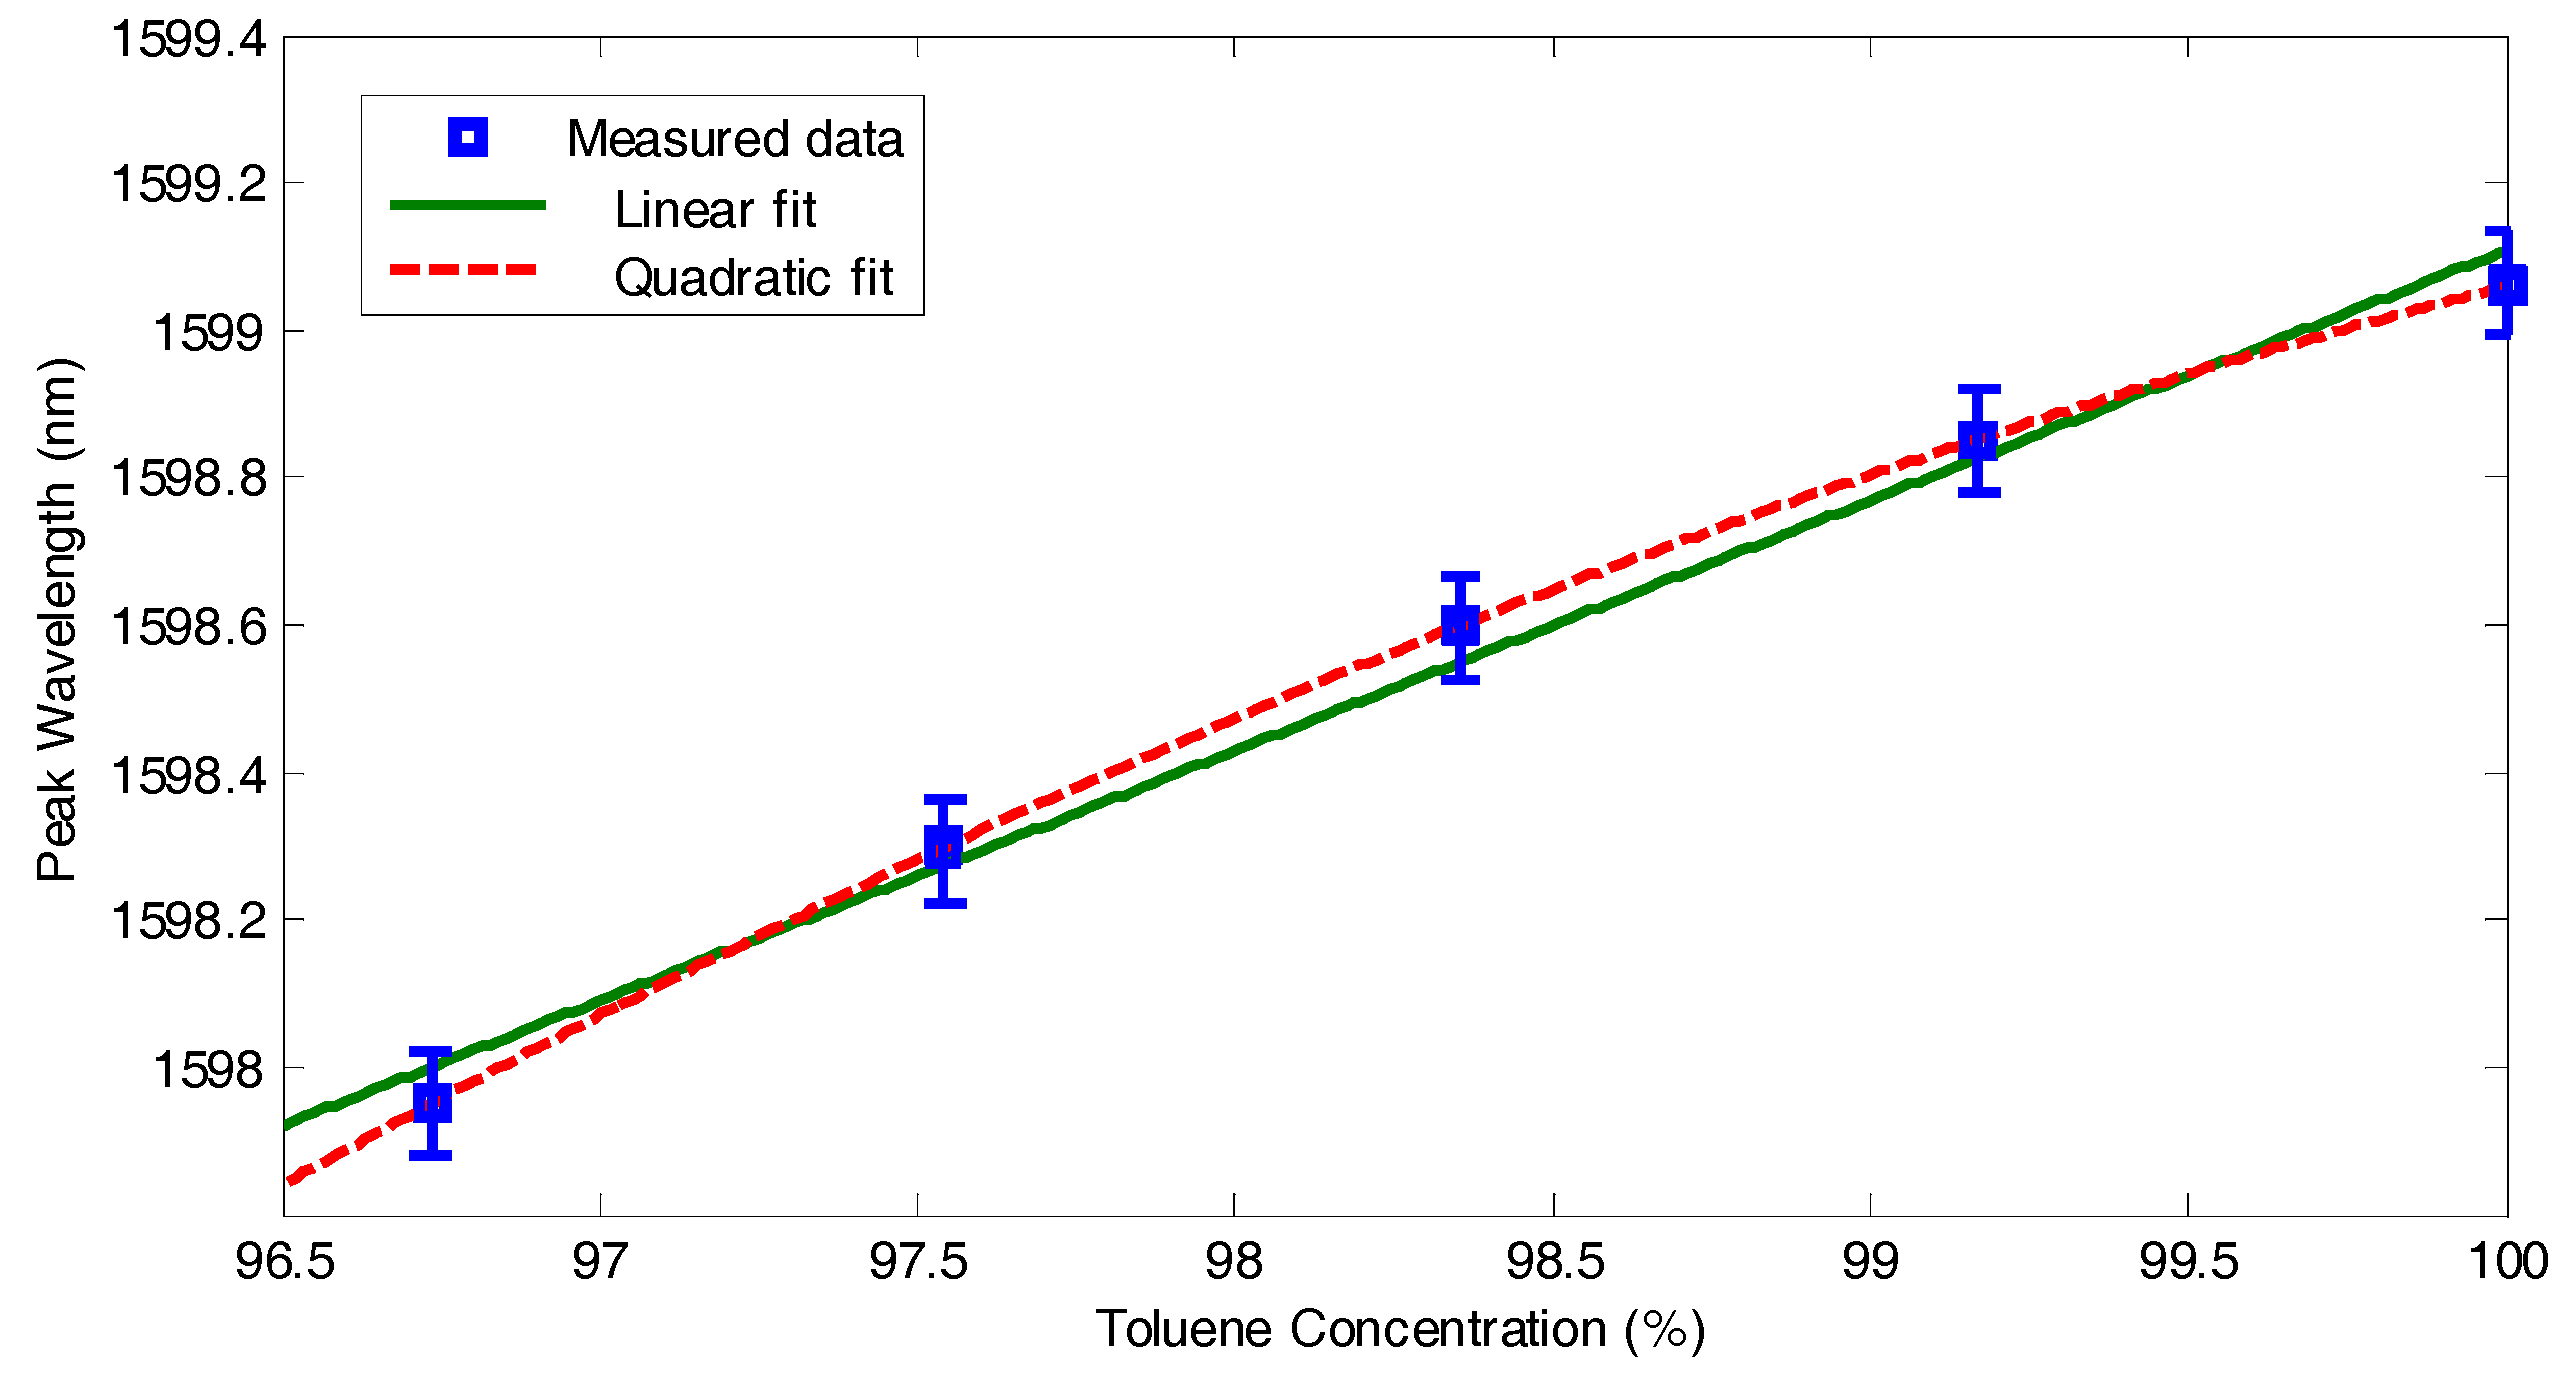
5. Results and Discussion
6. Conclusions
Acknowledgments
Author Contributions
Conflicts of Interest
References
- Liu, P.Y.; Chin, L.K.; Ser, W.; Chen, H.F.; Hsieh, C.-M.; Lee, C.-H.; Sung, K.-B.; Ayi, T.C.; Yap, P.H.; Liedberg, B.; et al. Cell refractive index for cell biology and disease diagnosis: Past, present and future. Lab Chip 2016, 16, 634–644. [Google Scholar] [CrossRef] [PubMed]
- Shelton, D.P. Refractive index measured by laser beam displacement at λ = 1064 nm for solvents and deuterated solvents. Appl. Opt. 2011, 50, 4091–4098. [Google Scholar] [CrossRef] [PubMed]
- Chaitavon, K.; Sumriddetchkajorn, S.; Nukeaw, J. Highly sensitive refractive index measurement with a sandwiched single-flow-channel crofluidic chip. RSC Adv. 2013, 3, 6981–6984. [Google Scholar] [CrossRef]
- Chao, C.-Y.; Fung, W.; Guo, L.J. Polymer microring resonators for biochemical sensing applications. IEEE J. Sel. Top. Quantum Electron. 2006, 12, 134–142. [Google Scholar] [CrossRef]
- Gaber, N.; Takemura, Y.; Marty, F.; Khalil, D.; Angelescu, D.; Richalot, E.; Bourouina, T. Volume refractometry of liquids using stable optofluidic Fabry-Pérot resonator with curved surfaces. J. Micro/Nanolithgr. MEMS MOEMS 2015, 14, 045501. [Google Scholar] [CrossRef]
- Homola, J.; Yee, S.S.; Gauglitz, G. Surface plasmon resonance sensors: Review. Sens. Actuators B Chem. 1999, 54, 3–15. [Google Scholar] [CrossRef]
- Schmitt, K.; Schirmer, B.; Hoffmann, C.; Brandenburg, A.; Meyrueis, P. Interferometric biosensor based on planar optical waveguide sensor chips for label-free detection of surface bound bioreactions. Biosens. Bioelectron. 2007, 22, 2591–2597. [Google Scholar] [CrossRef] [PubMed]
- Madani, A.; Kleinert, M.; Stolarek, D.; Zimmermann, L.; Ma, L.; Schmidt, O.G. Vertical optical ring resonators fully integrated with nanophotonic waveguides on silicon-on-insulator substrates. Opt. Lett. 2015, 40, 3826–3829. [Google Scholar] [CrossRef] [PubMed]
- Bernardi, A.; Kiravittaya, S.; Rastelli, A.; Songmuang, R.; Thurmer, D.J.; Benyoucef, M.; Schmidt, O.G. On-chip Si/SiOx microtube refractometer. Appl. Phys. Lett. 2008, 93, 094106. [Google Scholar] [CrossRef]
- Böttner, S.; Li, S.; Trommer, J.; Kiravittaya, S.; Schmidt, O.G. Sharp whispering-gallery modes in rolled-up vertical SiO2 microcavities with quality factors exceeding 5000. Opt. Lett. 2012, 37, 5136–5138. [Google Scholar]
- Harazim, S.M.; Quiñones, V.A.B.; Kiravittaya, S.; Sanchez, S.; Schmidt, O.G. Lab-in-a-tube: On-chip integration of glass optofluidic ring resonators for label-free sensing applications. Lab Chip 2012, 12, 2649–2655. [Google Scholar] [CrossRef] [PubMed]
- Zhang, X.; Ren, L.; Wu, X.; Li, H.; Liu, L.; Xu, L. Coupled optofluidic ring laser for ultrahigh sensitive sensing. Opt. Express 2011, 19, 22242–22247. [Google Scholar] [CrossRef] [PubMed]
- Domachuk, P.; Littler, I.; Cronin-Golomb, M.; Eggleton, B. Compact Resonant Integrated Microfluidic Refractometer. Appl. Phys. Lett. 2006, 88, 093513. [Google Scholar] [CrossRef]
- Song, W.; Zhang, X.; Liu, A.; Lim, C.; Yap, P.; Hosseini, H. Refractive index measurement of single living cells using on-chip Fabry-Pérot cavity. Appl. Phys. Lett. 2006, 89, 203–901. [Google Scholar] [CrossRef]
- St-Gelais, R.; Masson, J.; Peter, Y.-A. All-silicon integrated Fabry-Pérot cavity for volume refractive index measurement in microfluidic systems. Appl. Phys. Lett. 2009, 94, 243905. [Google Scholar] [CrossRef]
- Sabry, Y.M.; Saadany, B.; Khalil, D.; Bourouina, T. Silicon micromirrors with three-dimensional curvature enabling lens-less efficient coupling of free-space light. Light Sci. Appl. 2013, 2, e94. [Google Scholar] [CrossRef]
- Sabry, Y.M.; Khalil, D.; Saadany, B.; Bourouina, T. In-plane external fiber Fabry-Pérot cavity comprising silicon micromachined concave mirror. J. Micro/Nanolithgr. MEMS MOEMS 2014, 13, 011110. [Google Scholar] [CrossRef]
- Saleh, B.E.A.; Teich, M.C. Fundamentals of Photonics; John Wiley & Sons, Inc.: New York, NY, USA, 1991; pp. 327–330. [Google Scholar]
- Yariv, A. Quantum Electronics, 3rd ed.; Wiley: New York, NY, USA, 1989; pp. 136–147. [Google Scholar]
- Malak, M.; Gaber, N.; Marty, F.; Pavy, N.; Richalot, E.; Bourouina, T. Analysis of Fabry-Pérot optical micro-cavities based on coating-free all-Silicon cylindrical Bragg reflectors. Opt. Express 2013, 21, 2378–2392. [Google Scholar] [CrossRef] [PubMed]
- Mita, Y.; Sugiyama, M.; Kubota, M.; Marty, F.; Bourouina, T.; Shibata, T. Aspect Ratio Dependent Scalloping Attenuation in DRIE and an Application to Low-Loss Fiber-Optical Switches. In Proceedings of the 19th IEEE International Conference on Micro Electro Mechanical Systems (MEMS 2006), Istanbul, Turkey, 22–26 January 2006; pp. 114–117.
- Kurtz, S.S.; Wikingsson, A.E.; Camin, D.L.; Thompson, A.R. Refractive Index and Density of Acetone-Water Solutions. J. Chem. Eng. Data 1965, 10, 330–334. [Google Scholar] [CrossRef]
- Wei, T.; Han, Y.; Li, Y.; Tsai, H.-L.; Xiao, H. Temperature-insensitive miniaturized fiber inline Fabry-Pérot interferometer for highly sensitive refractive index measurement. Opt. Express 2008, 16, 5764–5769. [Google Scholar] [CrossRef] [PubMed]
- Liu, P.; Huang, H.; Cao, T.; Tang, Z.; Liu, X.; Qi, Z.; Ren, M.; Wu, H. An optofluidics biosensor consisted of high-finesse Fabry-Pérot resonator and micro-fluidic channel. Appl. Phys. Lett. 2012, 100, 233705. [Google Scholar] [CrossRef]


| RI of Test Liquid | nt = 1.18 | nt = 1.3 | nt = 1.6 | nt = 1.8 |
|---|---|---|---|---|
| Qpeak | 70 | 129.5 | 128 | 55 |
| Confinement distance | 1.88 μm | 1.34 μm | 1.24 μm | 1.11 μm |
© 2016 by the authors. Licensee MDPI, Basel, Switzerland. This article is an open access article distributed under the terms and conditions of the Creative Commons by Attribution (CC-BY) license ( http://creativecommons.org/licenses/by/4.0/).
Share and Cite
Gaber, N.; Sabry, Y.M.; Marty, F.; Bourouina, T. Optofluidic Fabry-Pérot Micro-Cavities Comprising Curved Surfaces for Homogeneous Liquid Refractometry—Design, Simulation, and Experimental Performance Assessment. Micromachines 2016, 7, 62. https://doi.org/10.3390/mi7040062
Gaber N, Sabry YM, Marty F, Bourouina T. Optofluidic Fabry-Pérot Micro-Cavities Comprising Curved Surfaces for Homogeneous Liquid Refractometry—Design, Simulation, and Experimental Performance Assessment. Micromachines. 2016; 7(4):62. https://doi.org/10.3390/mi7040062
Chicago/Turabian StyleGaber, Noha, Yasser M. Sabry, Frédéric Marty, and Tarik Bourouina. 2016. "Optofluidic Fabry-Pérot Micro-Cavities Comprising Curved Surfaces for Homogeneous Liquid Refractometry—Design, Simulation, and Experimental Performance Assessment" Micromachines 7, no. 4: 62. https://doi.org/10.3390/mi7040062
APA StyleGaber, N., Sabry, Y. M., Marty, F., & Bourouina, T. (2016). Optofluidic Fabry-Pérot Micro-Cavities Comprising Curved Surfaces for Homogeneous Liquid Refractometry—Design, Simulation, and Experimental Performance Assessment. Micromachines, 7(4), 62. https://doi.org/10.3390/mi7040062