Article

A New Concept of a Drug Delivery System with Improved Precision and Patient Safety Features

Design of Microsystems, Department of Microsystems Engineering (IMTEK), University of Freiburg, Georges-Koehler-Allee 103, 79110 Freiburg, Germany
*
Author to whom correspondence should be addressed.
Micromachines 2015, 6(1), 80-95; https://doi.org/10.3390/mi6010080
Submission received: 4 August 2014 / Accepted: 5 December 2014 / Published: 24 December 2014
(This article belongs to the Special Issue Micropumps: Design, Fabrication and Applications)

Abstract

:
This paper presents a novel dosing concept for drug delivery based on a peristaltic piezo-electrically actuated micro membrane pump. The design of the silicon micropump itself is straight-forward, using two piezoelectrically actuated membrane valves as inlet and outlet, and a pump chamber with a piezoelectrically actuated pump membrane in-between. To achieve a precise dosing, this micropump is used to fill a metering unit placed at its outlet. In the final design this metering unit will be made from a piezoelectrically actuated inlet valve, a storage chamber with an elastic cover membrane and a piezoelectrically actuated outlet valve, which are connected in series. During a dosing cycle the metering unit is used to adjust the drug volume to be dispensed before delivery and to control the actually dispensed volume. To simulate the new drug delivery concept, a lumped parameter model has been developed to find the decisive design parameters. With the knowledge taken from the model a drug delivery system is designed that includes a silicon micro pump and, in a first step, a silicon chip with the storage chamber and two commercial microvalves as a metering unit. The lumped parameter model is capable to simulate the maximum flow, the frequency response created by the micropump, and also the delivered volume of the drug delivery system.

1. Introduction

Modern medical treatments should ensure a defined level of a drug in the blood stream. This defined level may vary in a narrow therapeutic window [1,2,3,4,5]. Therefore conventional injections start with a higher concentration cmax to keep the drug in the therapeutic window over a certain time [3]. This high concentration may lead to adverse side effects. Implantable drug delivery systems open new possibilities, by frequently dosing a defined volume to enhance the healing process and to minimize undesirable side effects, by keeping the drug level permanently inside the therapeutic window. Besides frequent and defined dosing, patient safety is an essential requirement. Pump based drug delivery systems lack in accuracy of flow rate, showing dosing errors of at least 10%, see Table 1. In order to satisfy the requirements of modern therapy, the delivered drug should be measured before release and a possibility to verify the correct measurement should be implemented.
In this paper a drug delivery system is shown, which extends a silicon micropump by a storage chamber, delimited by a membrane, and an outlet valve. While the outlet valve is closed, the pump can pressurize the storage chamber, see Figure 1. This pressure deflects the membrane on top of the storage chamber. The deflection can be measured and thereby the stored volume can be calculated very precisely. These two parts permit a measurement of the drug volume and a frequent delivery of the drug, by opening and closing the outlet valve. This concept of a dosing unit add-on, see Figure 1, can be used for every pump based drug delivery system, which is established at the market.
Table 1. Commercial drug infusion pumps for clinical applications [4].
Manufactor’s DataMedtronicMedtronicCodman
Device nameSynchromed IIIsoMedMedstream
Flow rate48–1000 μL/h20.8–62.5 μL/h4–167 μL/h
Flow rate accuracy14.5% error15% error10% error
Figure 1. Working principle of the drug delivery system. The storage chamber is filled by the micro-pump. During the filling procedure the outlet valve is closed. The membrane, which caps the storage chamber, bends due to the increased pressure. The outlet valve can be opened on demand, so that the bended membrane relaxes.
Micromachines 06 00080 g001

2. Experimental Section

In this section, the concept of the storage chamber will be explained along with the working principle of the whole system. The improvement in the dosing accuracy compared to commonly used micropumps will be discussed. After that a lumped parameter model of the drug delivery system is introduced and the measurement setup is shown.

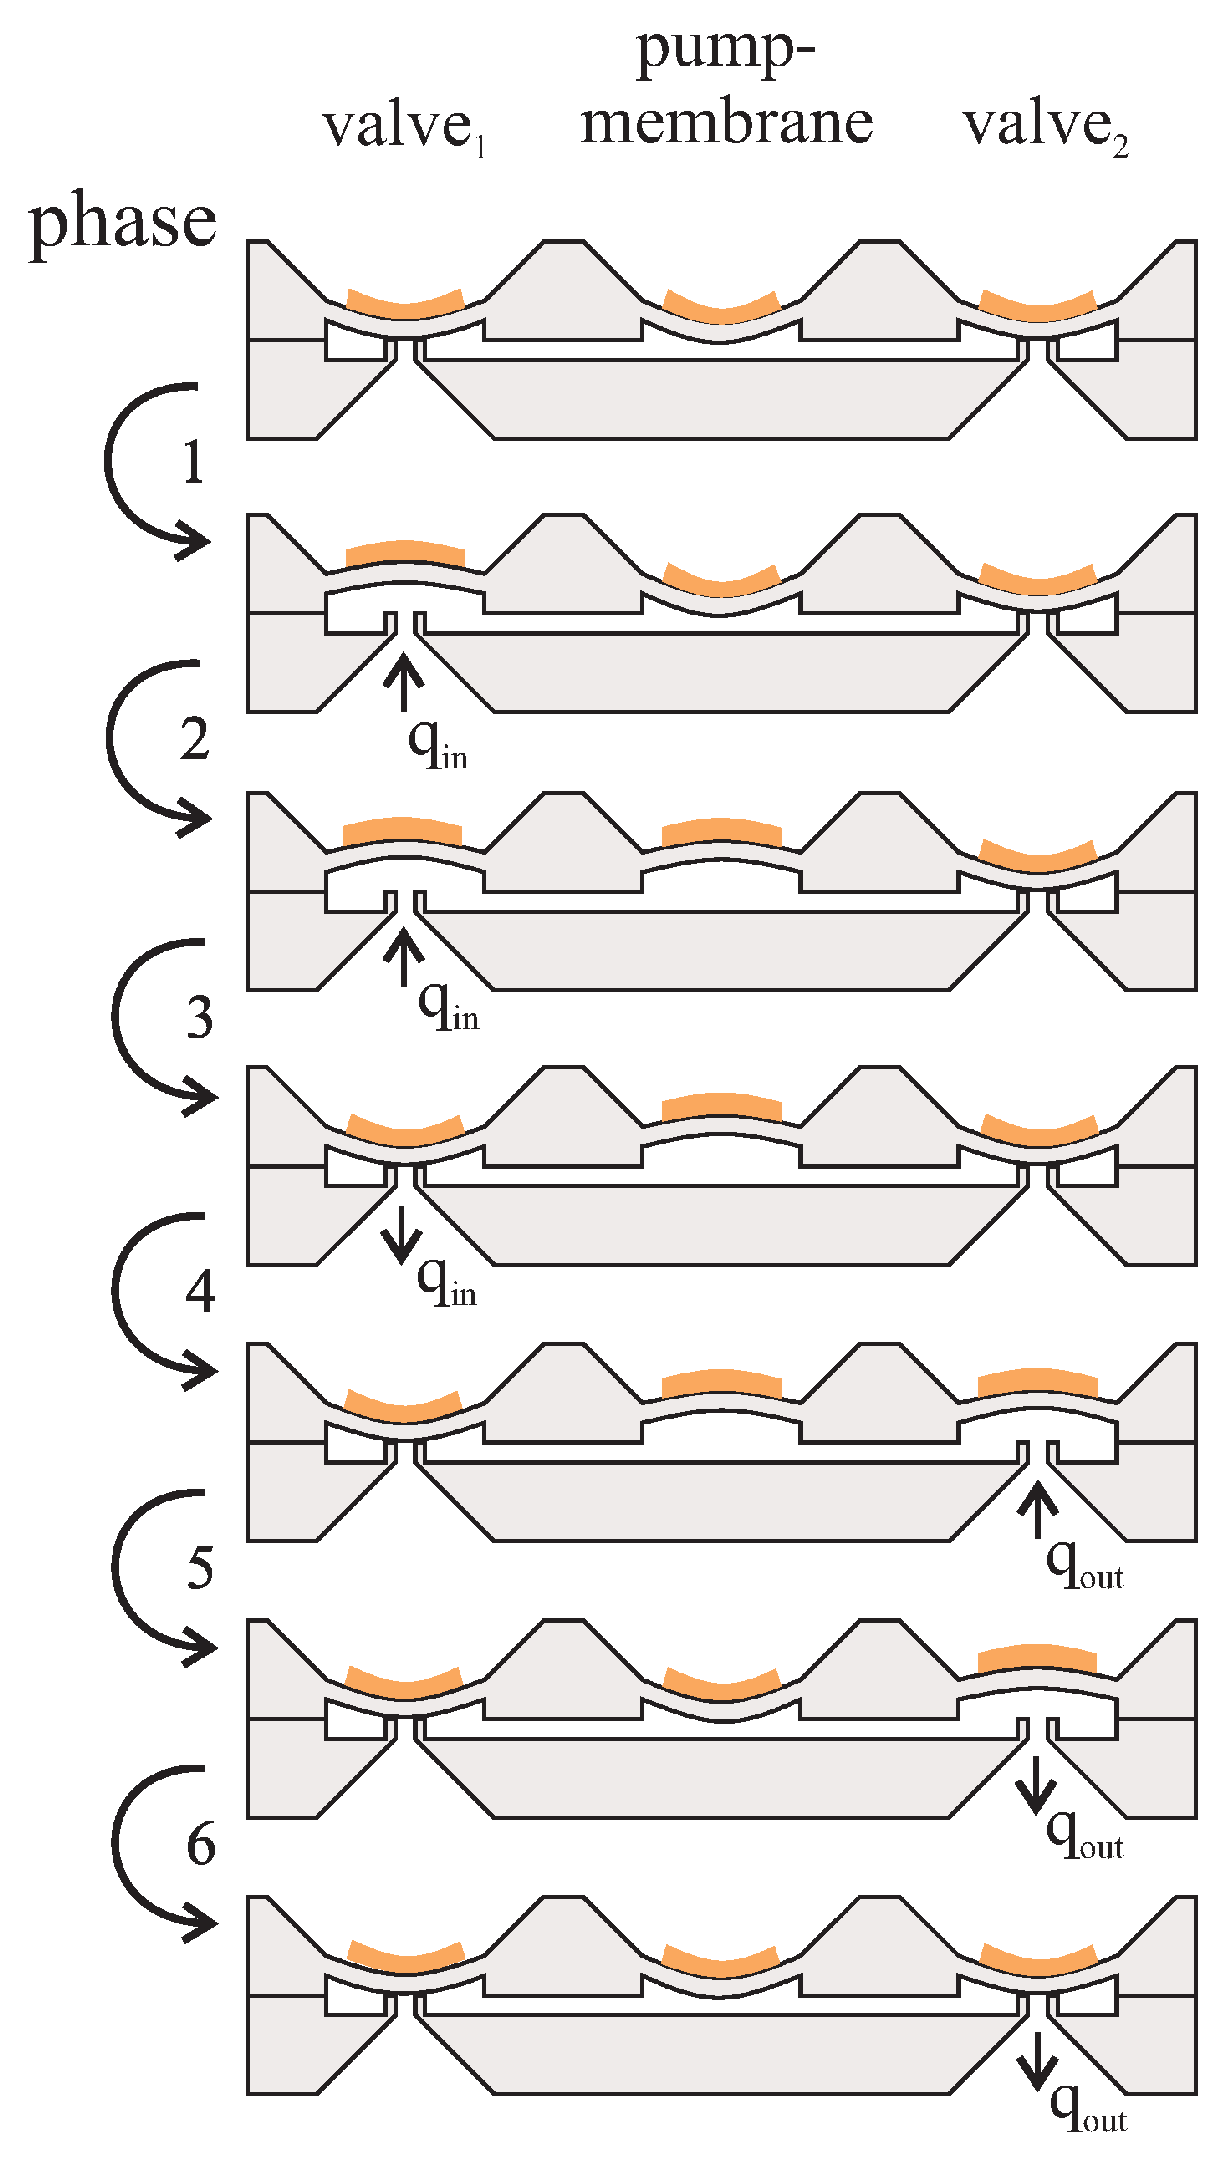
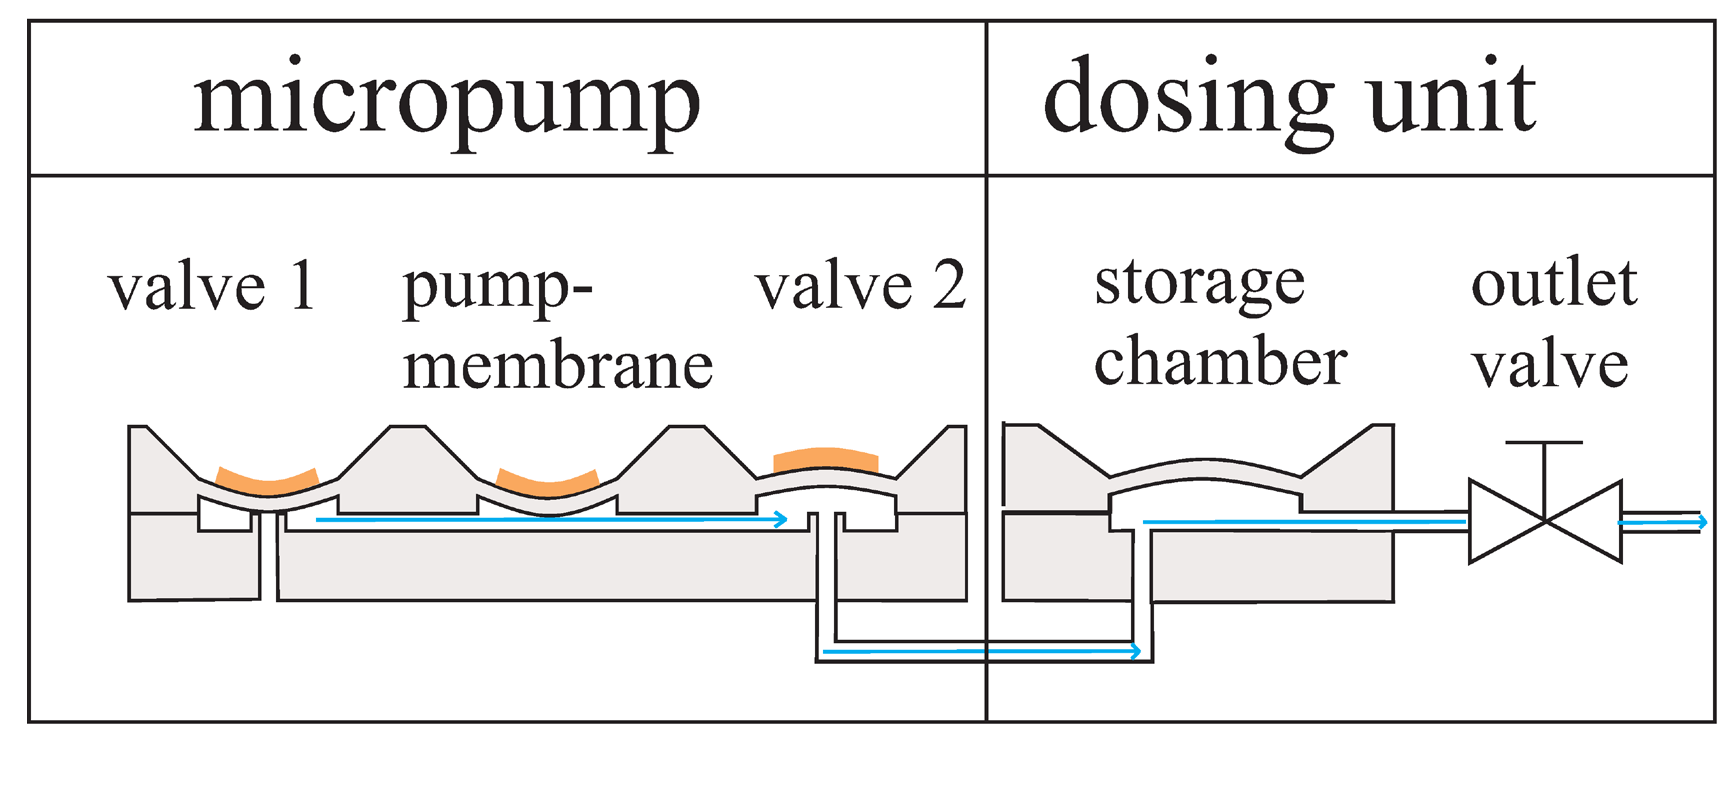
2.1. Working Principle

The drug delivery system consists of a silicon micropump a storage chamber and an outlet valve (see Figure 1). The piezoelectrically actuated micropump is a displacement pump [6,7]. A detailed description of the fabrication process for the pump can be found in [6]. The working principle of the micropump is shown in Figure 2. The piezoelectric actuators are mounted on top of the membranes and ensure a maximum positive and negative displacement of the membranes. The volume change under the pump-membrane defines the volume flow per cycle [8,9,10].
If the piezoelectric actuators follow a certain sequence, a positive flow, from the inlet to the outlet of the micropump, can be generated.
To prevent a strong variation of the flow rate generated by the micropump, the storage chamber and the outlet valve were added. At the beginning of a dosing cycle, the pump pressurizes the storage chamber, while the outlet valve is closed, see Figure 1. The thin membrane which delimits the storage chamber is deflected by the pressure generated by the micropump. This deflection can be used to measure the additional volume stored in the chamber. The time-dependent deflection of the membrane during filling and delivery process can be used to double check the correct measurement of the deflection and to detect parasitic capacitances like air bubbles, see Figure 3. In this state the deformed membrane exerts a certain pressure onto the stored drug. After opening of the outlet valve, a defined volume of the drug is squeezed out by the preloaded membrane of the storage chamber. A second measurement of the membrane deflection at the end of the dosing cycle will allow calculating the amount of the dispensed drug. With the additional storage chamber, variations in the flow rate generated by the micropump are not an issue. Due to the time-dependent displacement during filling and release of the drug, these unwanted effects can be detected and compensated.
Figure 2. Working principle of the micropump: To create a fluidic flow from the left to the right side the membranes have to be driven in the depicted order. The manufacturing process of the pump can be found in [11].
Micromachines 06 00080 g002
Figure 3. Pressurized storage chamber: The deflection of the thin membrane can be used to measure the stored volume. To release the drug the preloaded membrane can be used to push the drug into the body.
Micromachines 06 00080 g003

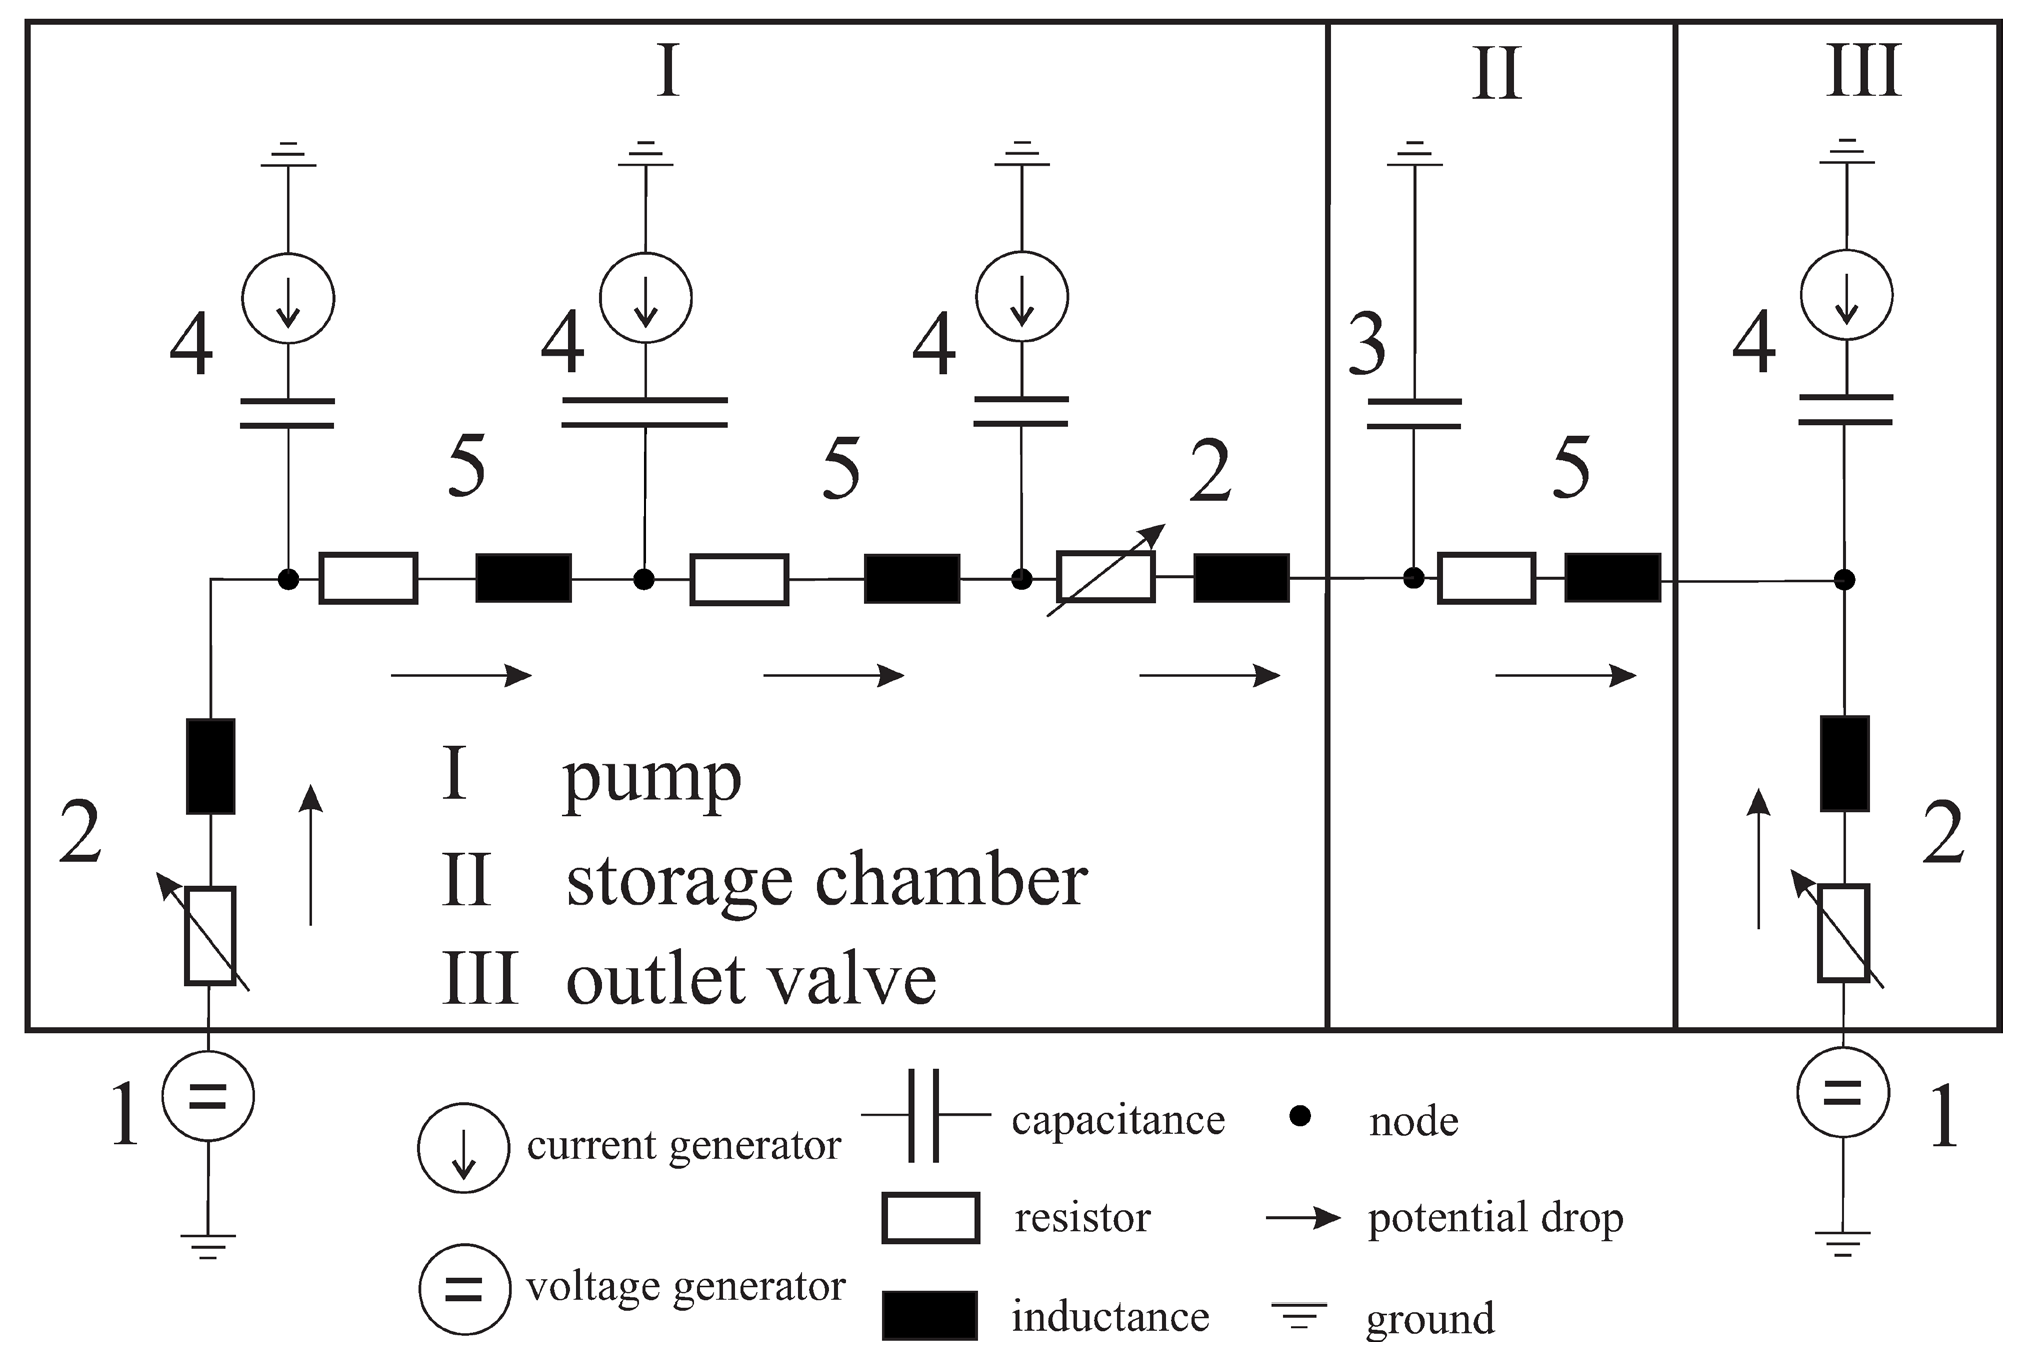
2.2. Lumped Parameter Model

A lumped parameter model can be used to model a fluidic system [6,7,12,13,14,15] . Based on the equation of a mechanically oscillating system, Equation (1) describes an incompressible laminar flow for a Newtonian fluid in steady state [16]:
p = m A 2 d V ˙ d t + χ A 2 V ˙ + k A 2 V ˙ d t
In Equation (1), p is the pressure drop, V is the volume, m the mass, and A the cross sectional area. χ is the friction coefficient and k the stiffness factor of the membrane. If we now compare the equation of an electric resistor, inductor and capacitor (RCL)-series-oscillator with Equation (1), we can define constants of the volume flow as fluidic capacitance C, resistance R and inductance L, see Equation (2) [14]:
k A 2 = C ;   χ A 2 = R ;   m A 2 = L
The lumped parameter model of a fluidic system is build up similar to an electric circuit and consists of parts like fluidic resistors, capacitances, and inductances, see Equation (2). By subdividing the fluidic system into defined parts with known behavior Equation (1) can be used to build a network based on the mesh equations of an electric circuit. The lumped parameters can be calculated with the mathematics of pipe hydraulics and mechanics. The schematic of the lumped parameter model is shown in Figure 4. For simplification the schematic is drawn with the equivalent electric counterparts.
Figure 4. Schematic of the lumped parameter model. Element 1: source pressure applied at the inlet and outlet. Element 2 is the valve, and element 3 is the storage capacitance. Element 4 represents a piezo-electrically actuated membrane and element 5 is the fluidic resistance between two nodes.
Micromachines 06 00080 g004
The lumped parameter model, shown in Figure 4, is used to calculate the fluidic flow at a node, and the pressure drop between two nodes with the law of mass conservation, see Equation (3):
d V d t = q i n q o u t
In Equation (3) qin is the volume flow to a node and qout the flow out of a node. The time-dependent change in volume V ˙ for a piezoelectrically actuated membrane can be written as a function of the applied pressure p and voltage U, see Equation (4):
d V d t = V p | U * p t + V U | p * U t  
By inserting Equation (3) in Equation (4), Equation (5) can be concluded:
p t = q i n q o u t   V U | p   ×   U t V p | U
The piezoceramic actuator is driven with a square wave signal. To circumvent the mathematical problem of differentiation of this square wave function, Equation (5) is integrated, see Equation (6). Equation (6) is used in the lumped parameter model for the deflection of the piezoelectrically actuated membranes and the storage membrane, see elements 3 and 4 in Figure 4:
p = q i n q o u t   V U | p ×   U t V p | U d t = V i n V o u t V U | p   ×   U C p
The denominator in Equation (6) is the capacitance of the membrane, and is hence written as Cp. After building up the drug delivery system with lumped parameters, the discrete parts have to be calculated, see Figure 4. To calculate the lumped parameters fluidic calculations and mechanical simulations have to be conducted. The inductance L can be calculated with the knowledge of the dimensions and the density of the fluid [8]. The constant resistance, see Figure 4 element 5, of the channels can be calculated by the knowledge of pipe hydraulics and a dimensionless factor for the cross sectional area. The resistance of a valve has a range between infinity and a minimum value, when the gap is fully opened. Due to this fact, a function has to be found which models the behavior of the valve dependent on the applied voltage and pressure. The capacitance Cp is defined as the change of volume due to an applied pressure while the applied voltage is zero. The current source, see Figure 4, defines the dependence of the displacement of the membrane of the applied voltage on the piezoelectric actuator. The capacitance and the current generator act additively and change the pressure under the membrane.

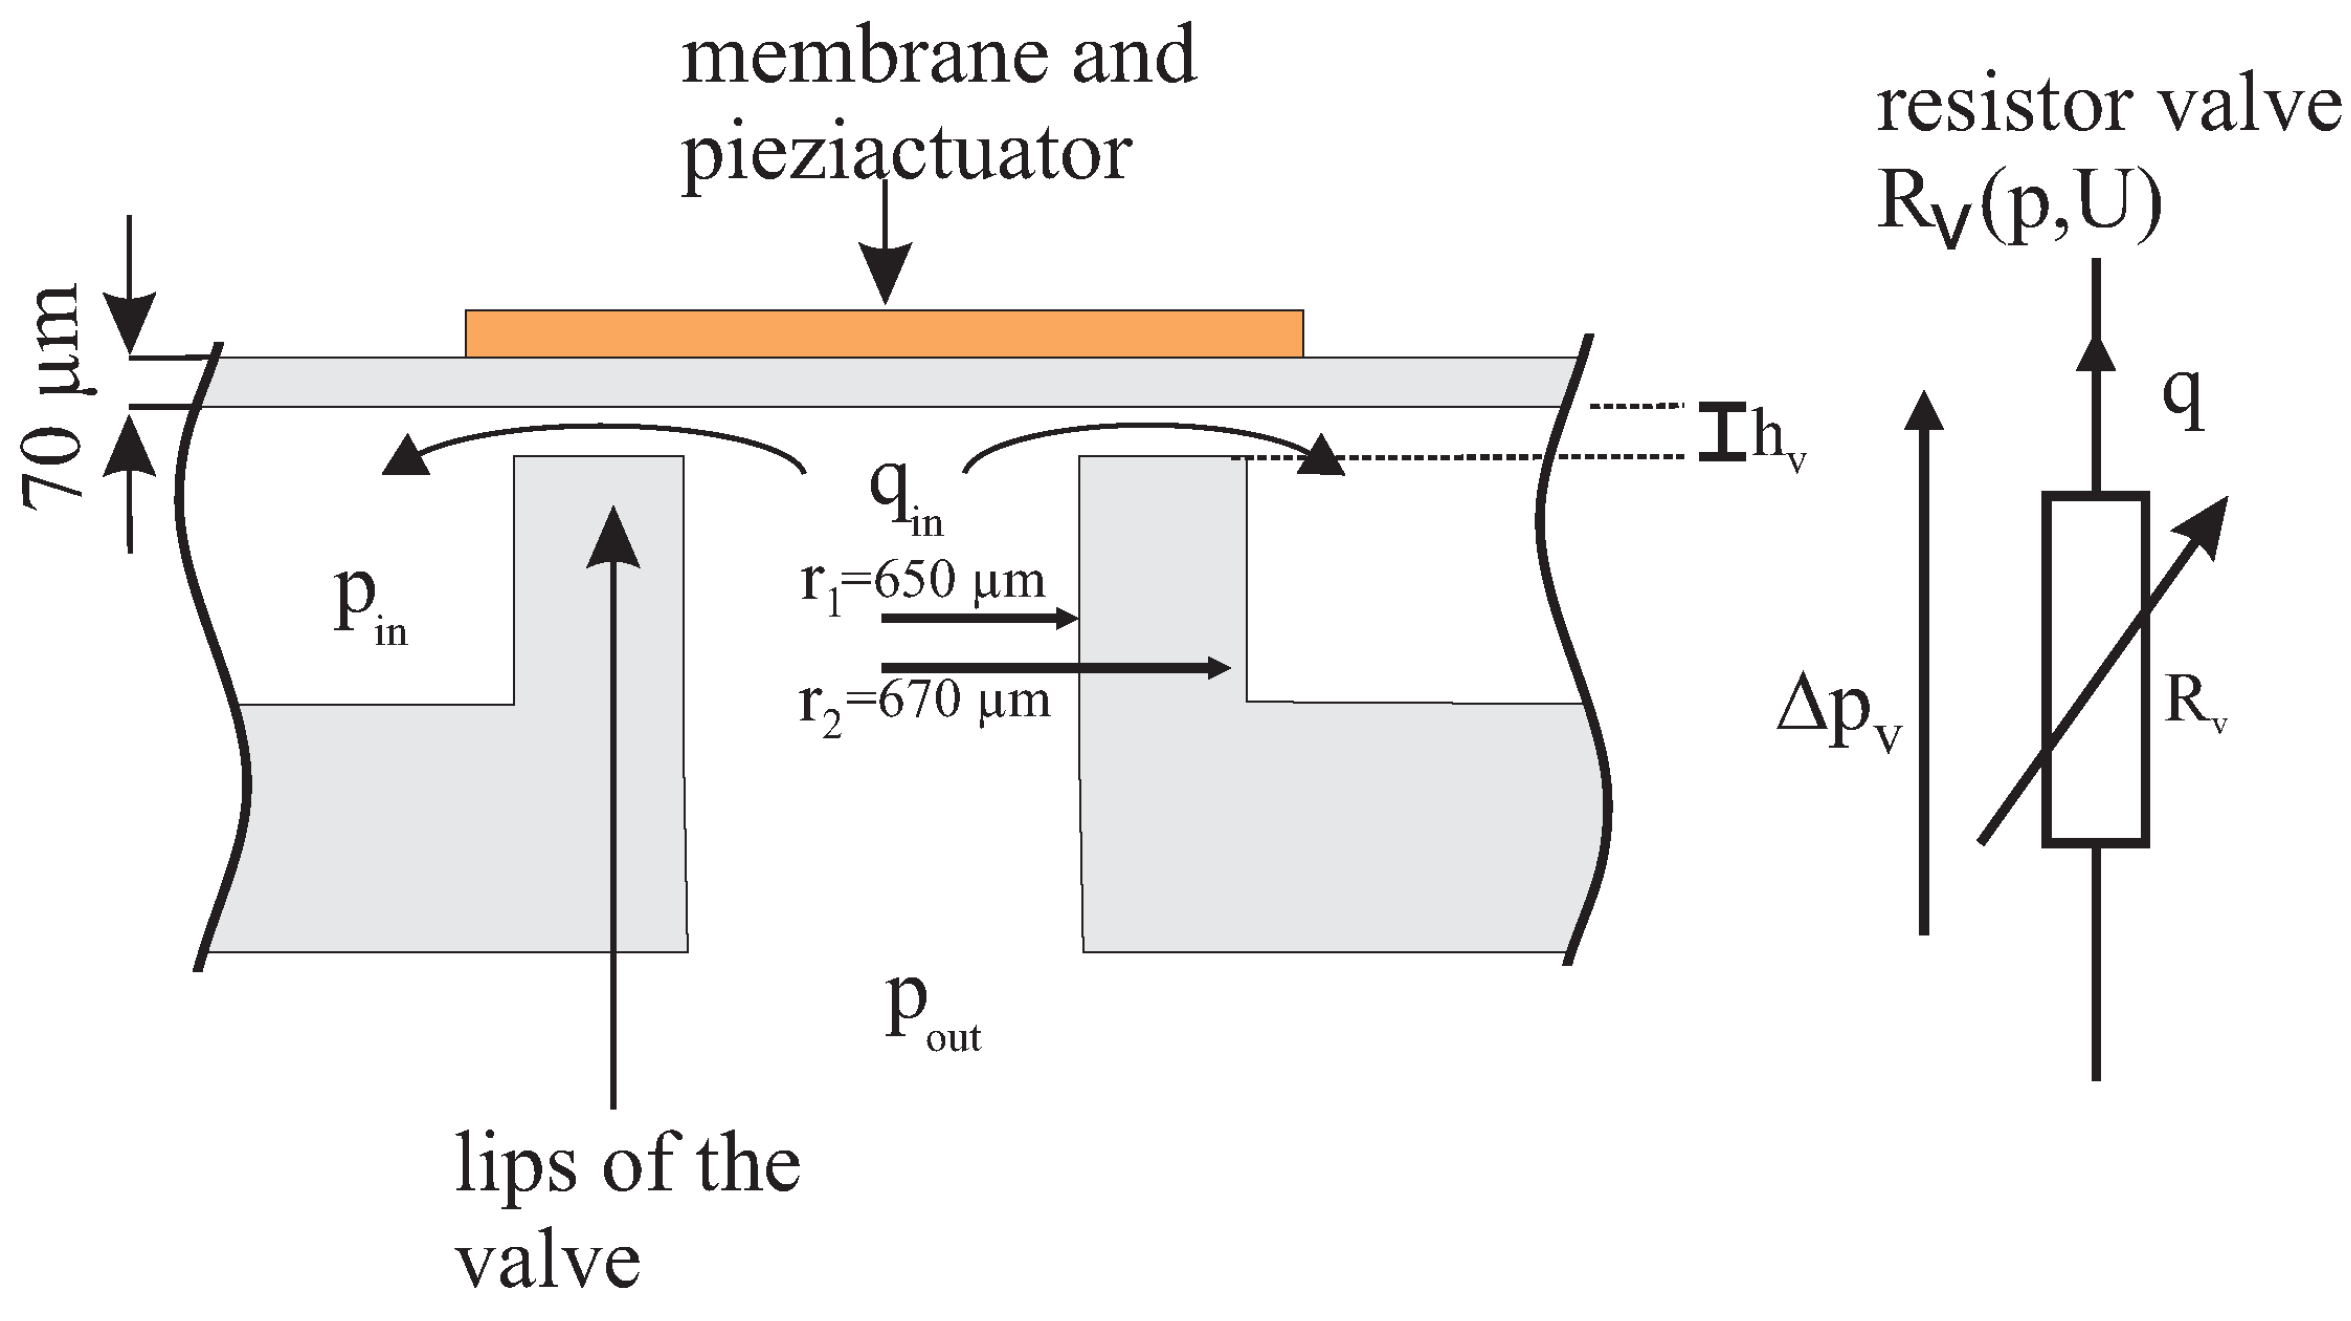
2.2.1. Fluidic Calculation

As described in the previous section, two types of resistors are used in the lumped parameter model. The resistances of the chamber or between the pump and storage chamber, depicted in Figure 4 as element 5, can be assumed to be constant. Assuming a laminar slit stream, the resistance of the pump chamber can be calculated by Equation (7) [17]:
R k = 8 η l s π ( 4 b m h k 2 b m + 2 h k ) 4
In Equation (7) η is the dynamic viscosity, and ls the length of the channel. The cross-sectional area is defined by the height hk and the width bm, see Figure 5.
Obviously the fluidic resistance of the valve cannot be constant. It is assumed that there is no leakage in the closed state. Therefore the resistance is infinite. In the open state the resistance is dependent on the thickness of the valve lips and the gap hv between the membrane and the lips, depicted in Figure 6. In Equation (8), the relation between the geometrical dimensions and the resistance is shown [17]:
R v = { 6 n π h v 3 l n ( r 2 r 1 ) ,   h v > 0   ,   h v = 0
In order to solve the problem of a variable resistor a parametric function for the gap hv(p,U) has to be found. For that purpose a finite element method (FEM) simulation is established to find a function that links the displacement with the applied pressure p and voltage U, see Section 2.2.2.
Due to the acceleration of the liquid during pumping, mass inertia has to be taken into account. For frequencies below 40 Hz and length scales in the micro range Equation (9) can be used [18]:
p 1 p 2 = 3 4 ρ l q t = 3 4 ρ l V ¨ A = L × V ¨
Figure 5. On the left side: side view of the pump chamber height and length from inlet to outlet. On the right side the top view of the pump chamber can be seen. The geometrical dimensions for the lumped parameter are lk, hk and bm.
Micromachines 06 00080 g005
Figure 6. Dimensions of the valve. To calculate the fluidic resistance of the valve hv, r1 and r2 have to be known.
Micromachines 06 00080 g006

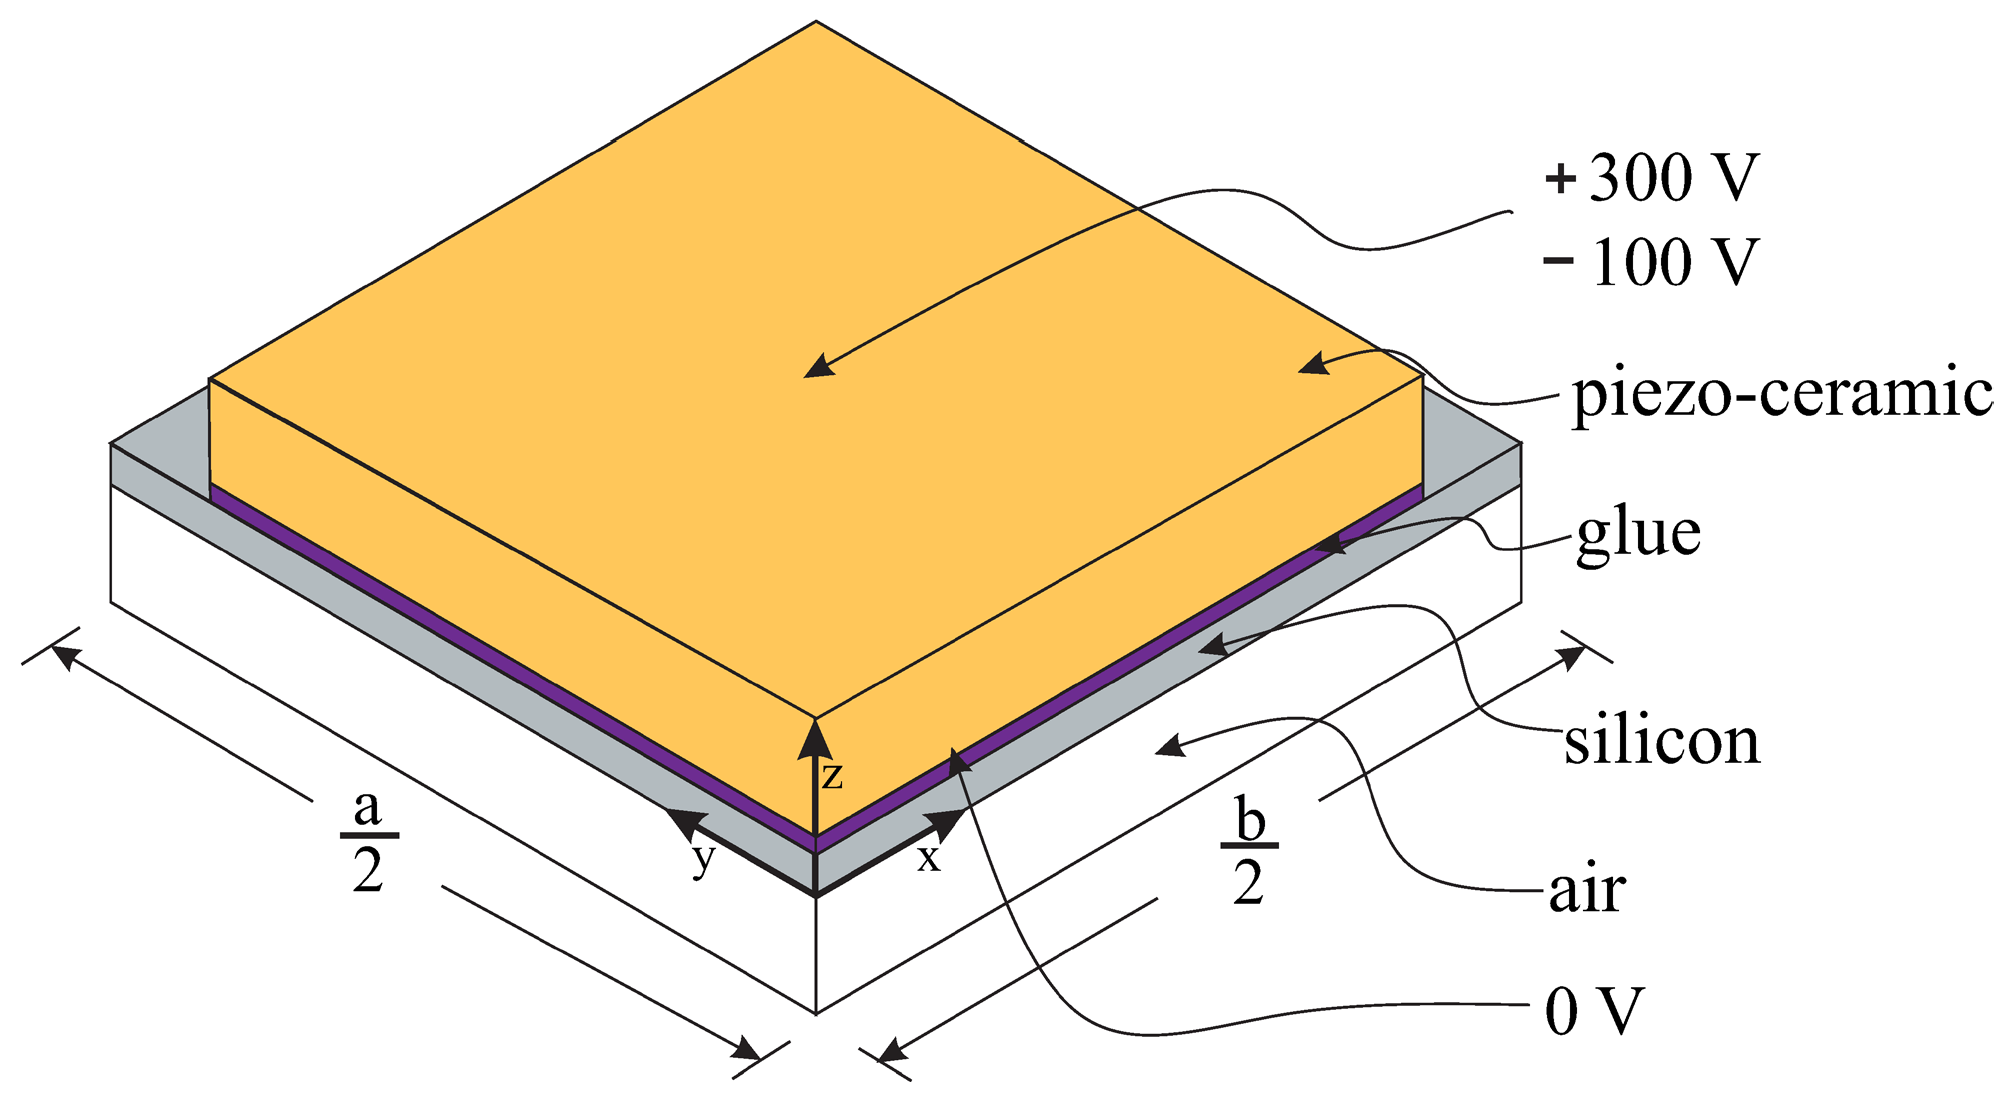
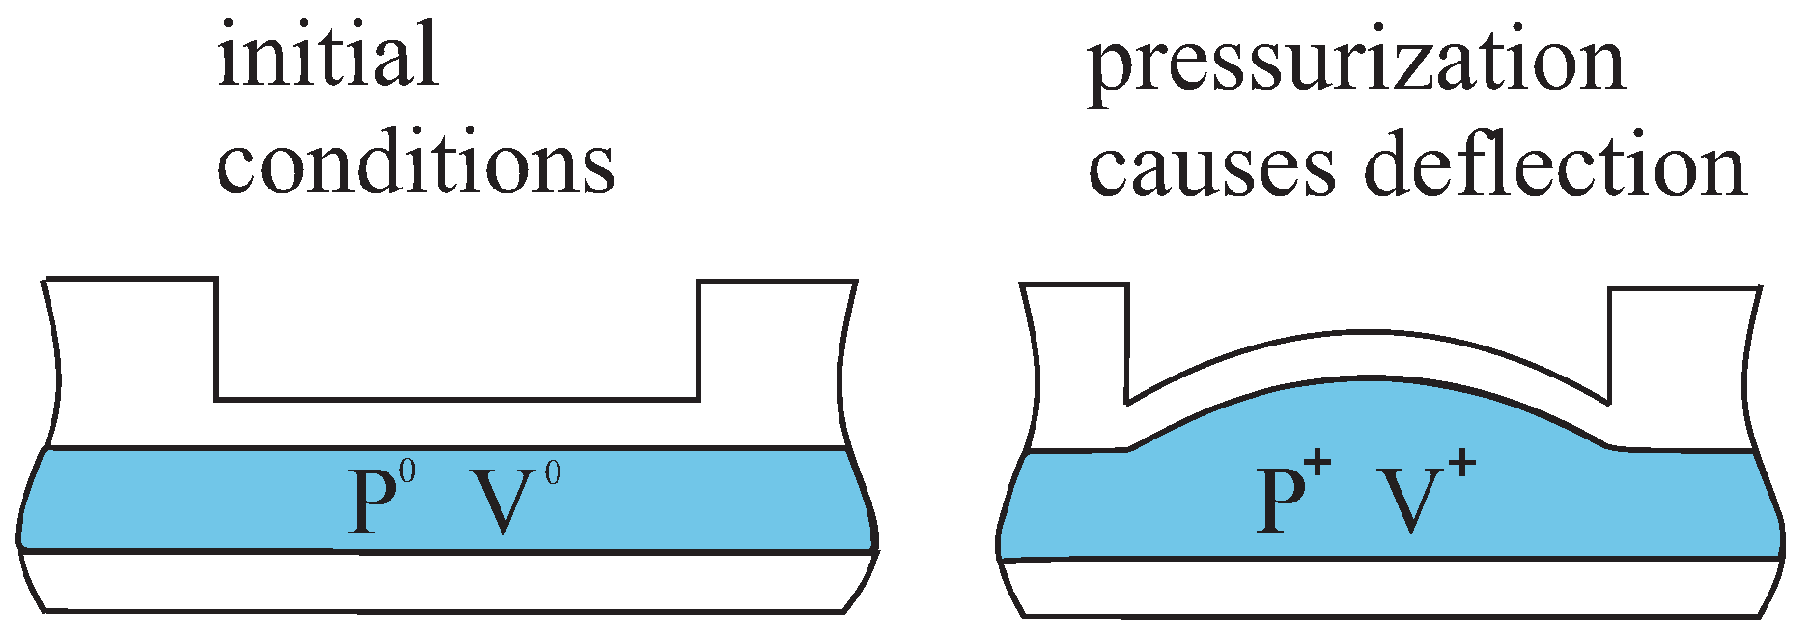
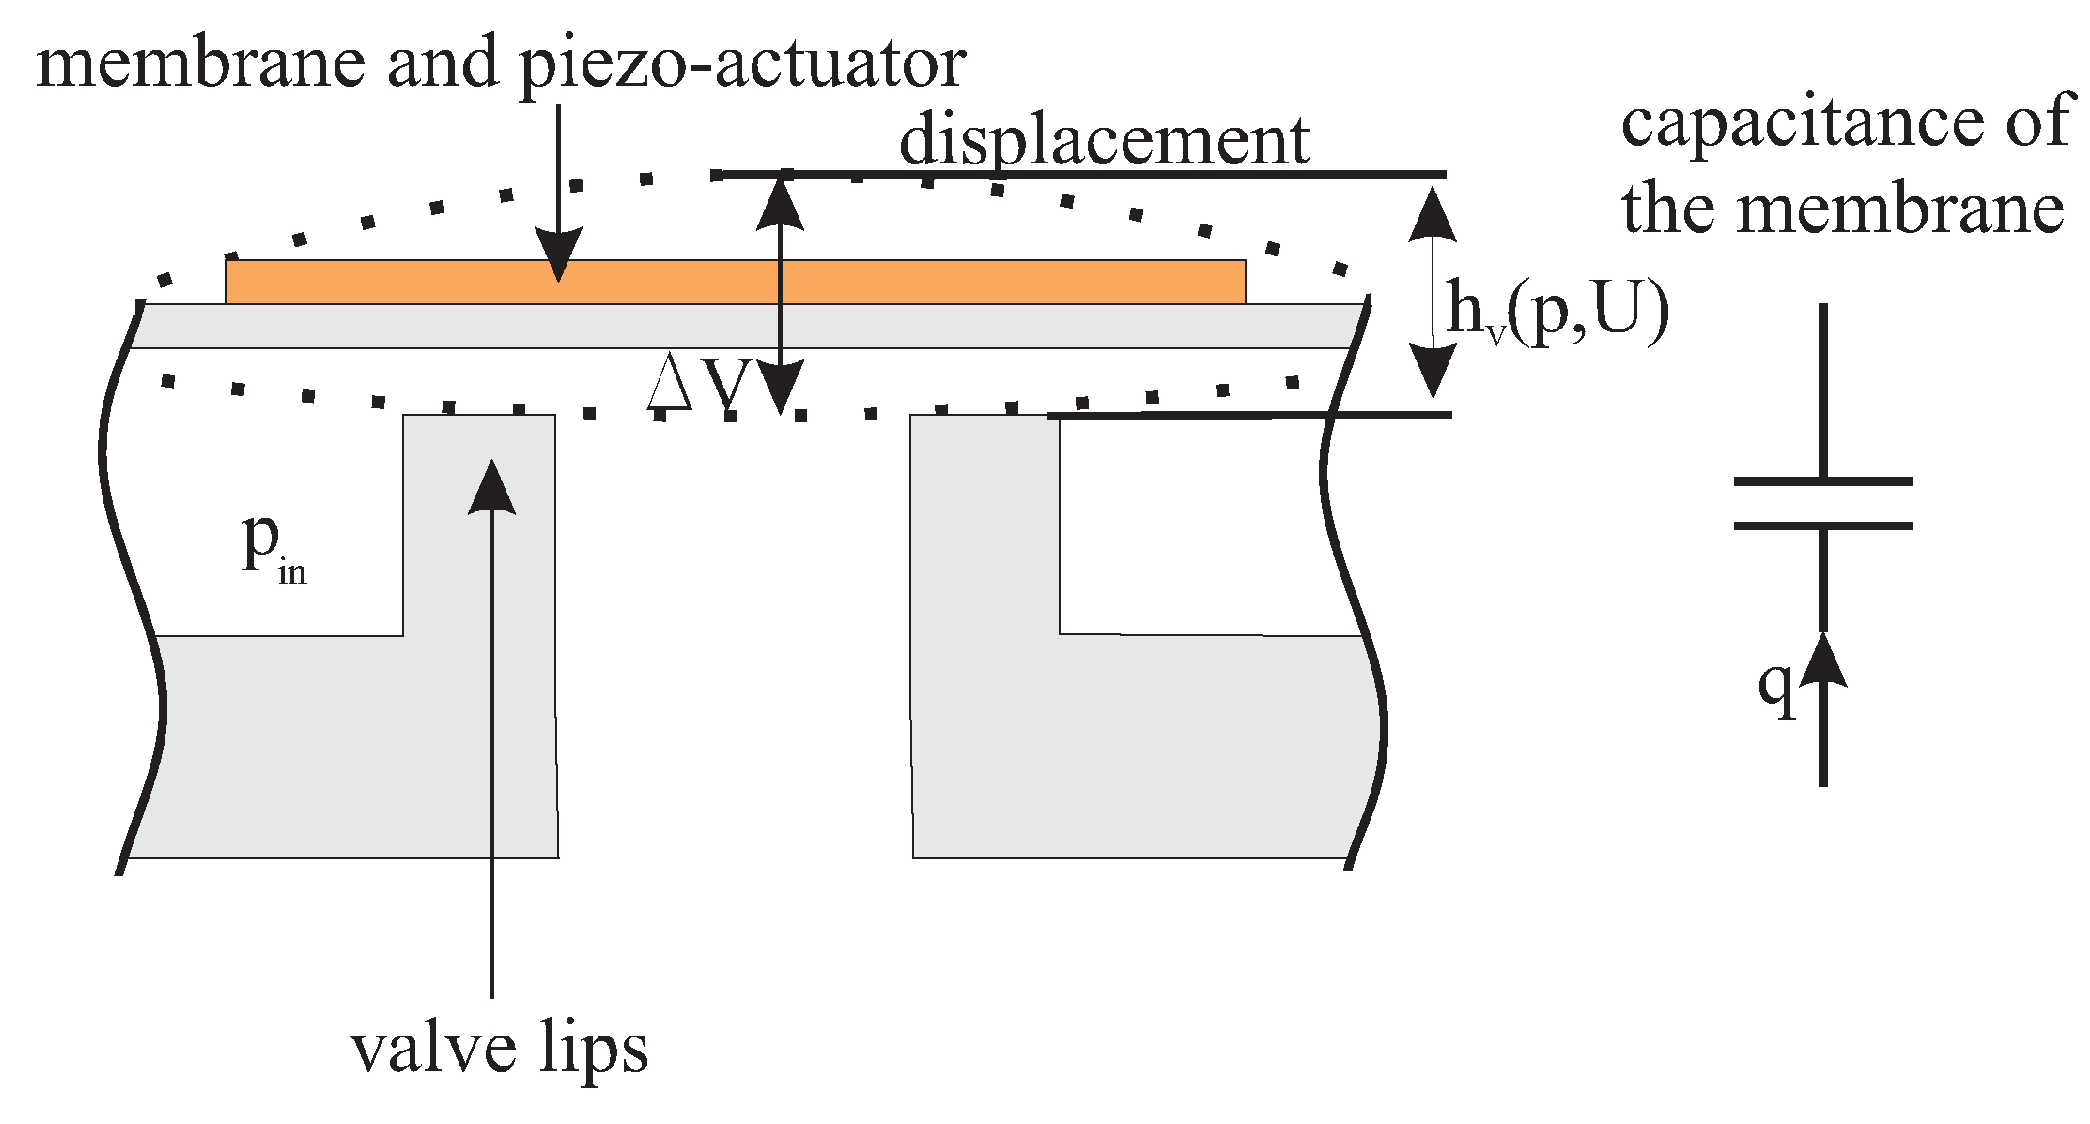
2.2.2. Mechanical Simulation

In this section, a parametric fit function for the volume under the membrane and the distance between the valve lips and the membranes, caused by the applied pressure and voltage, has to be found. Therefore, an FEM-model was set up in ANSYS Multiphysics (ANSYS, Inc., Canonsburg, PA, USA). The assembly of the piezoelectrically driven membranes is modeled by four layers, see Figure 7. The membrane of the storage chamber has only two layers, due to the missing glue and piezoceramic layers. The edges of the membranes are built in. A linear model is assumed for the displaced volume, with respect to the applied pressure and voltage. The parametric equation for V(p,U) is a superposition of the displacement due to pressure and voltage, and becomes V ( p , U ) = C P × p + V U | p × U , see Table 2. In a similar way we find a parametric equation for hv, see Table 3.
Figure 7. Assembly of the piezoelectrically driven valve- and pump-membrane.
Micromachines 06 00080 g007
Table 2. Factors of the parametric fit function of the simulation results for the generated volume under a membrane.
FactordV/dp = CpdV/dU
Generated volume: valve membrane0.072 μL/bar−0.0014 μL/V
Generated volume: pump membrane1.027 μL/bar−0.007 μL/V
Generated volume: storage membrane18.8 μL/bar0
Table 3. Factors of the parametric fit function of the simulation results for the gap of the valve.
Factordh/dpdh/dU
Gap of the valve2.97614 μm/bar−0.05027 μm/V

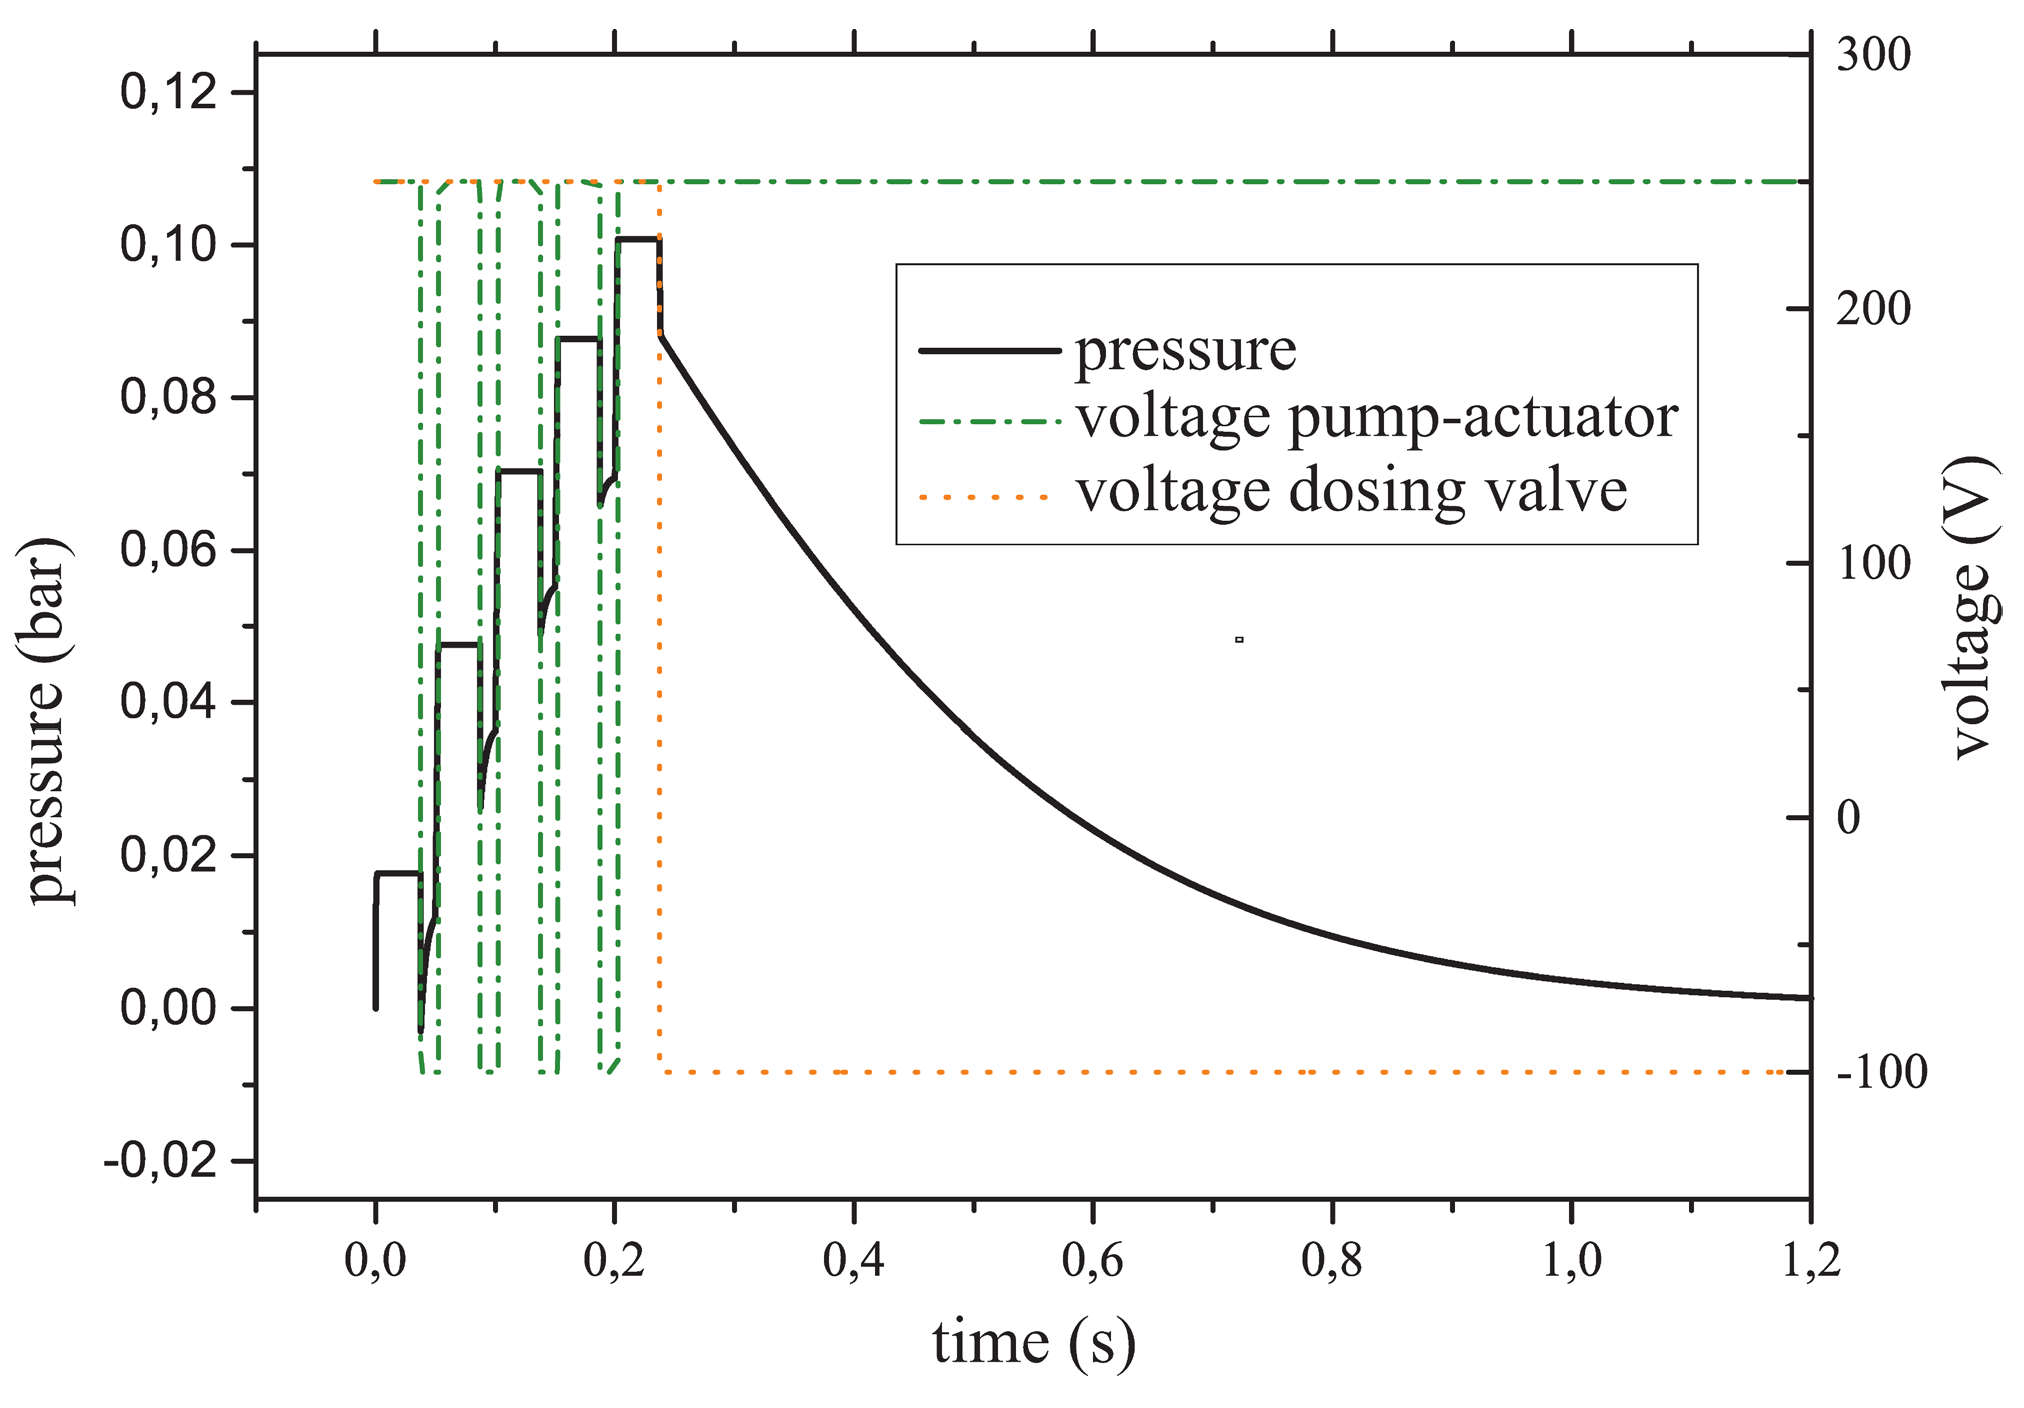
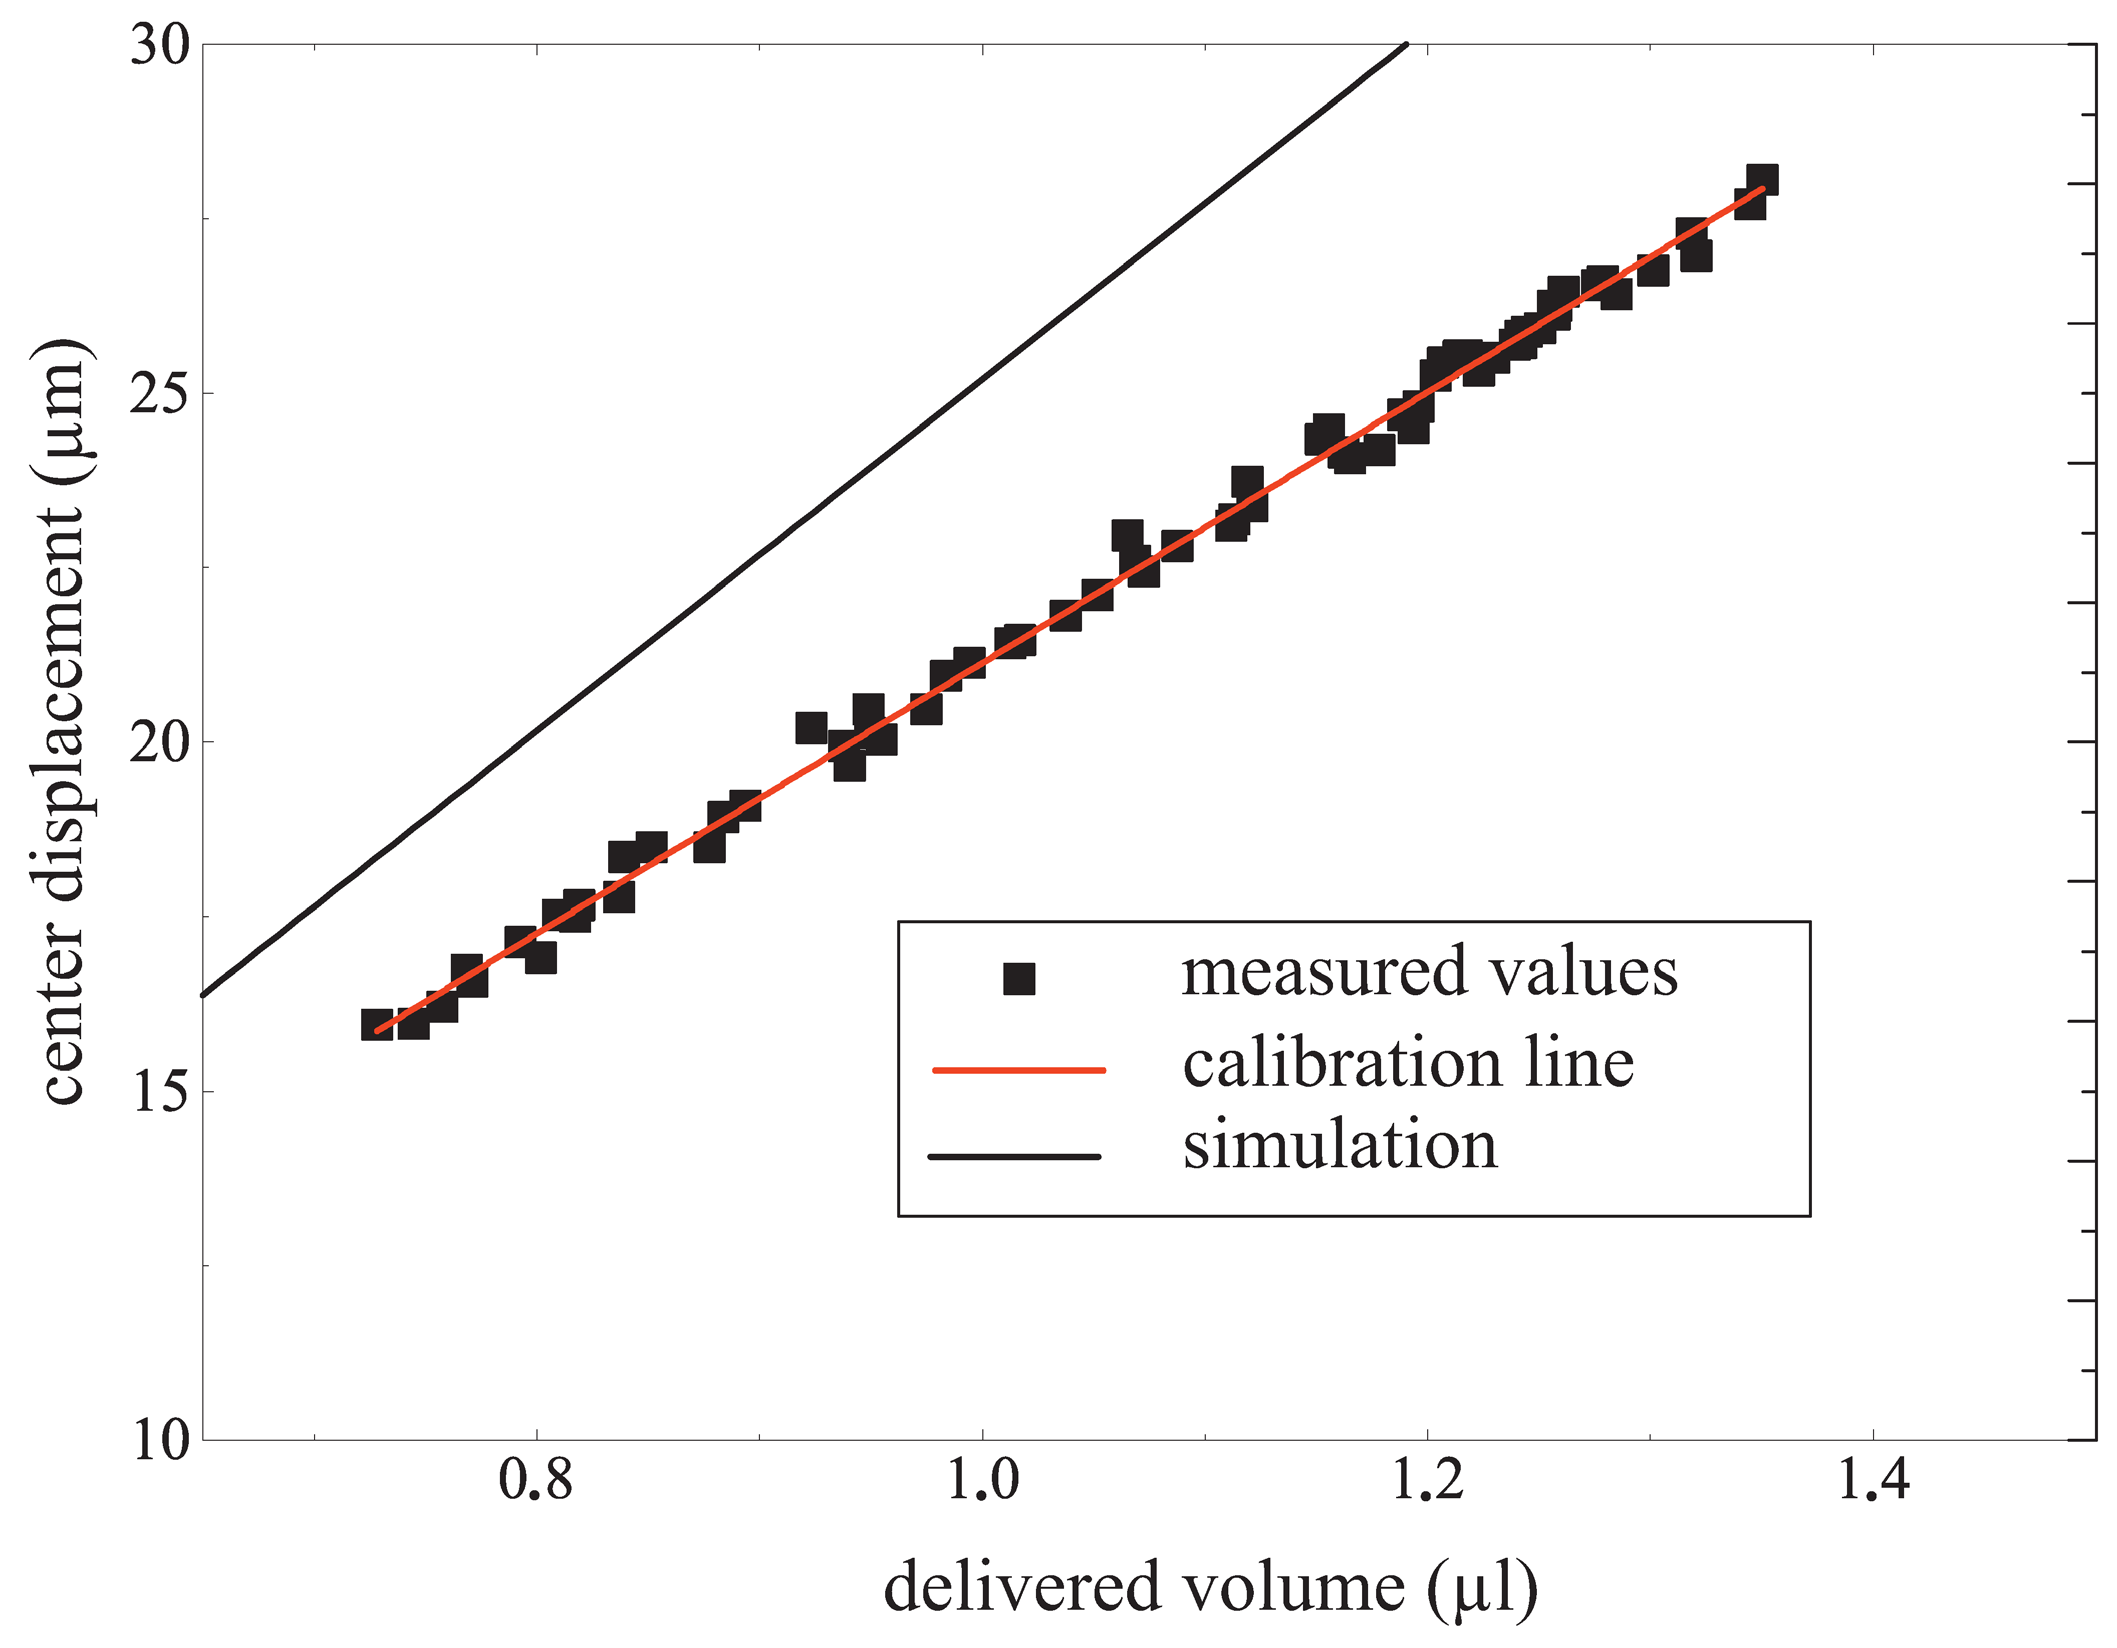
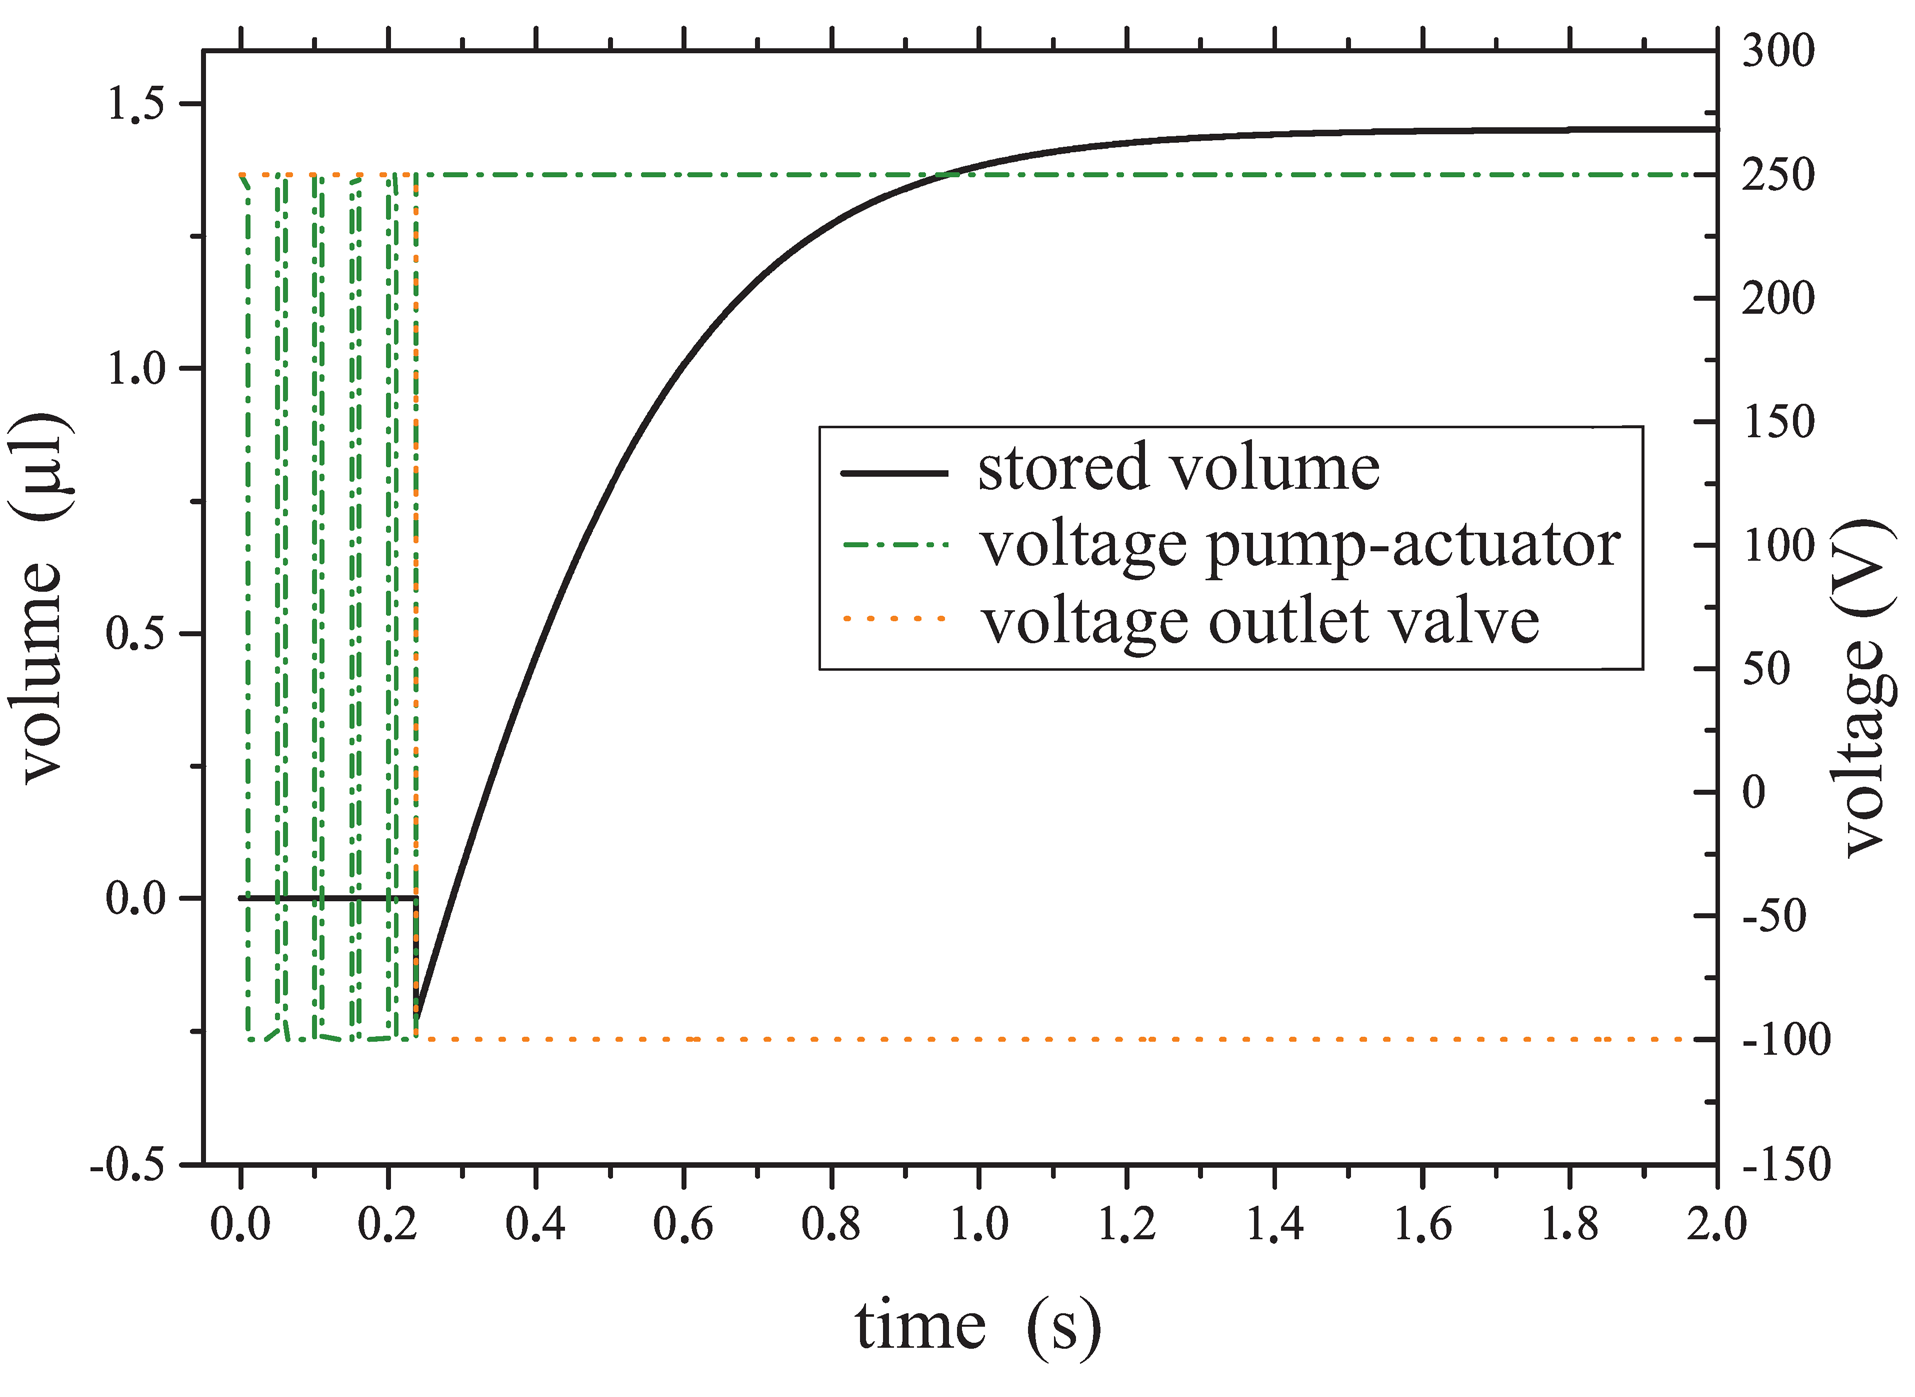
2.3. Simulation Results

After the fluidic calculation and the mechanical simulation, the lumped parameter model is set up. The model of the drug delivery system is established in MATLAB Simulink. The initial value problem is solved with the fourth order Runge-Kutta-method, with a fixed step size of 1 μs. The pressurization of the storage chamber, generated by the pump, is simulated, see Figure 8. The rising pressure correlates with the voltage, applied to the pump-actuators. In the lumped parameter simulation, the pump was triggered to stop pumping, if a pressure of 100 mbar was reached in the storage chamber. Afterwards the pump stops and the outlet valve opens at 0.22 s (see Figure 9 and Figure 10). Then, the pressure in the storage chamber drops with a capacitive discharge characteristic.
Figure 8. The values to be calculated, hv(p,U), Cp and the center displacement, are shown in the schematic drawing. The piezo-ceramic is a 200 μm thick Stelko PK21 actuator. For the valve a 7 × 7 mm2 and for the pumping membrane it’s a 10 × 10 mm2 piezo-ceramic actuator is used.
Micromachines 06 00080 g008
Figure 9. The voltage of the pump actuator can be seen in the green dash-dotted line and the voltage of the valve in the dotted line. The pressure in the storage chamber rises while the pump actuator is operated. After reaching a pressure of 0.1 bar the actuation of the pumps stops and the valve opens (see corresponding lines). The pressure drops with a capacitive discharge characteristic.
Micromachines 06 00080 g009
Figure 10. The voltage of the pump actuator can be seen in the green dash-dotted line and the voltage of the valve in the dotted line. After a certain time the valve is opened and the volume is released, (see corresponding line). The dispensed volume rises with a capacitive charge characteristic.
Micromachines 06 00080 g010
The dispensed volume, see Figure 10, corresponds to the pressure drop in the storage chamber. When the outlet valve opens, a negative flow in the pump is observed, and a negative pressure is generated. Due to this fact the fluid is forced to flow to this node. After reaching a state of stable equilibrium the excess pressure of the storage chamber forces the fluid to flow out of the drug delivery system, see Figure 10 at the time 0.23 s.

3. Results and Discussion

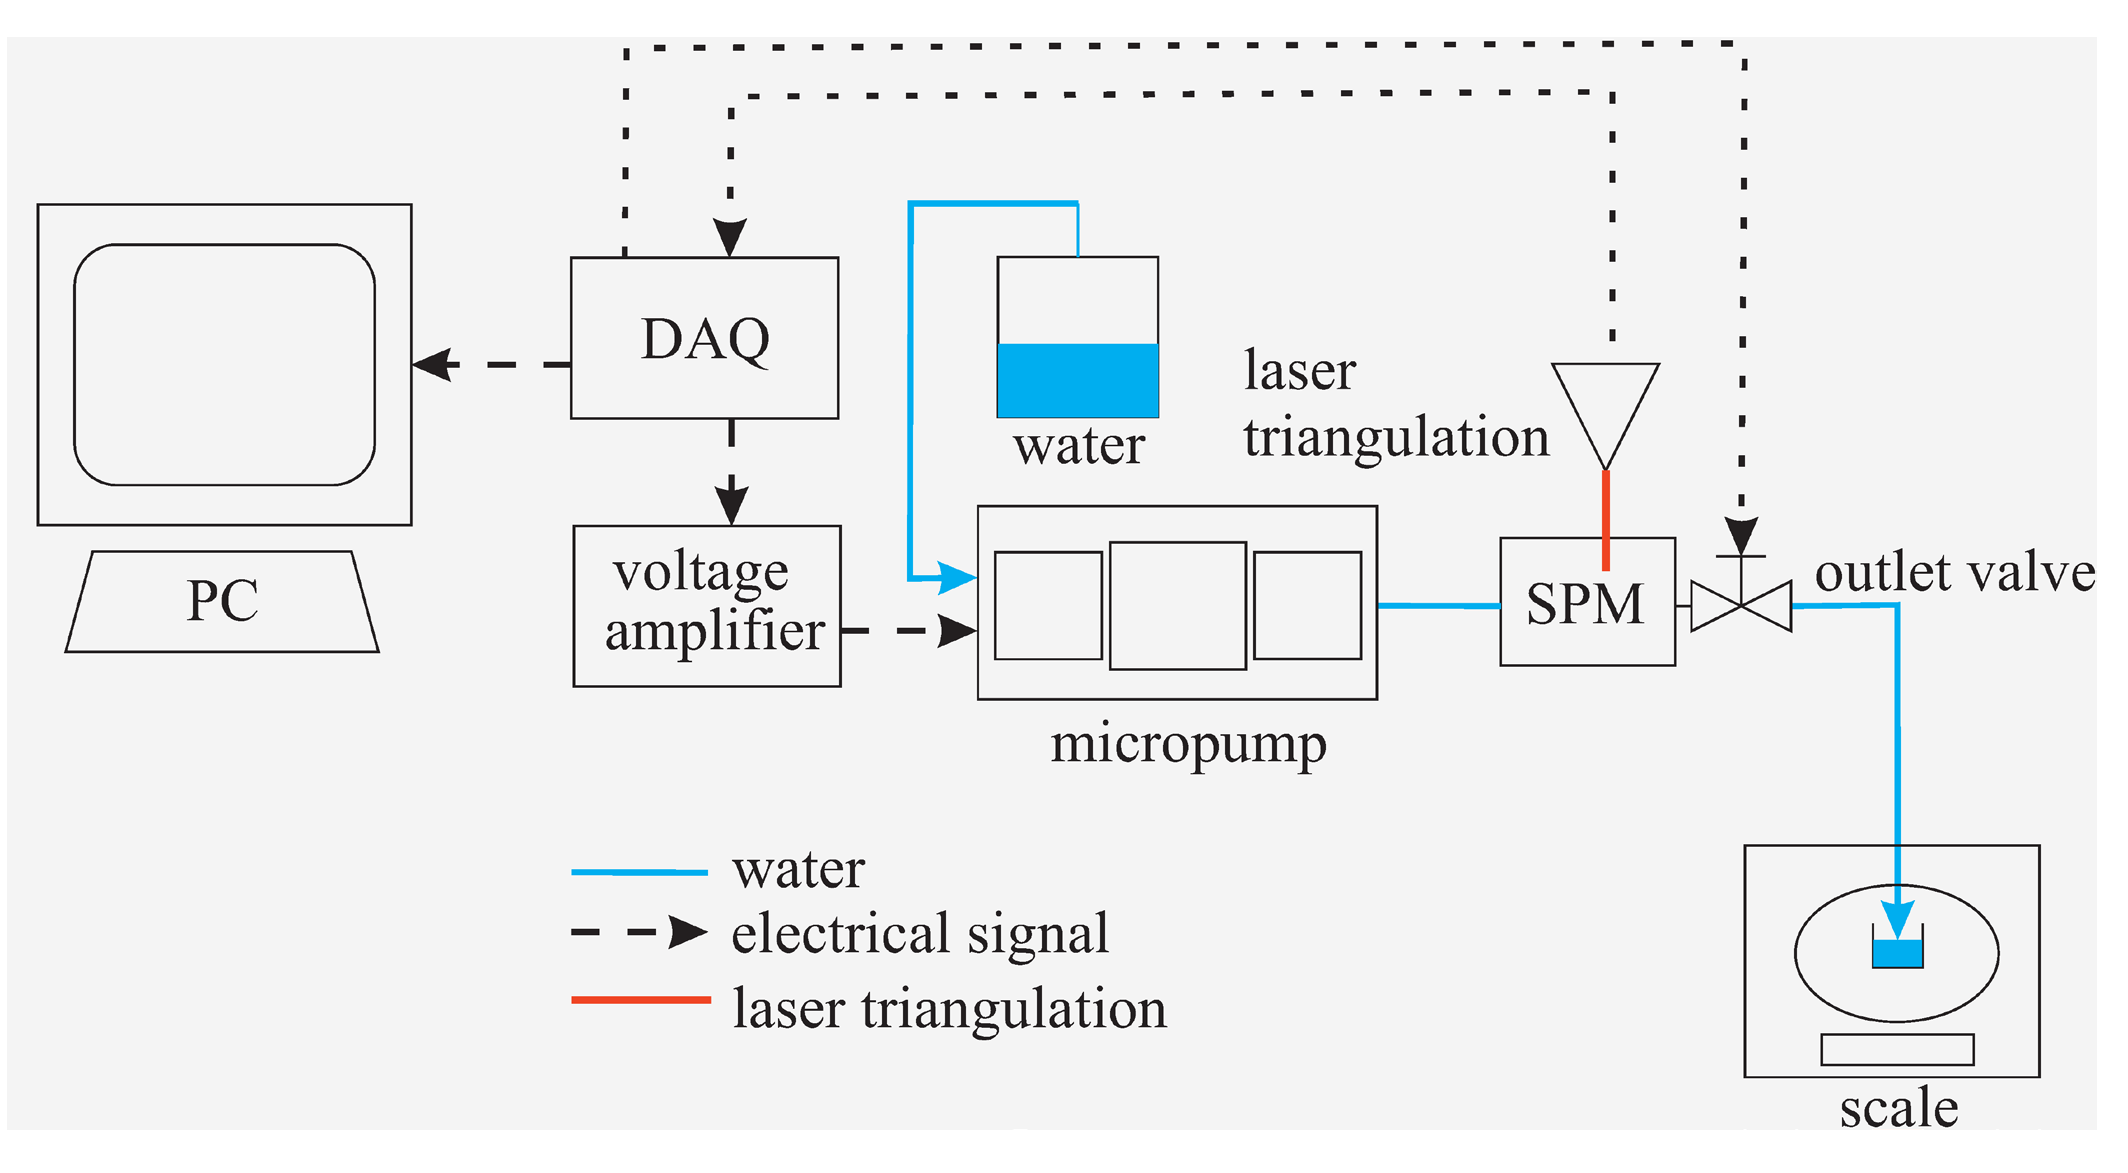
3.1. Measurement Setup

The measurements are separated into two parts. First a characterization of the micropump is performed to verify the simulation of the pump itself. After that the dispensed volume of the drug delivery system is gravimetrically measured.

3.1.1. Measurement Setup for Flow Rate Characterization

To drive the drug delivery system, a LabVIEW program (National Instruments Germany GmbH, Munich, Germany)generates a square wave for every phase of the pump and a signal for the valves, see Figure 2, and sends it to an amplifier (SVR 350-3 bip by Piezomechanik Dr. Lutz Pickelmann GmbH, Munich, Germany). To characterize the micropump a flow sensor (Piezomechanik Dr. Lutz Pickelmann GmbH, Munich, Germany) measures the generated flow while the LabVIEW software ramps the frequency of the driving signal in 5 Hz steps.

3.1.2. Measurement Setup for the Drug Delivery System

The dosing is measured by a gravimetrical method (Sartorius Cubis® micro scale, accuracy of reading 0.1 μg, Sartorius AG, Göttingen, Germany) while the displacement of the membrane of the storage chamber is measured by a laser triangulation sensor (AWL7 by Welotec GmbH, Laer, Germany) with a resolution of 0.4 μm, see Figure 3. The pump is operated with the setup introduced in Section 3.3.1 with a frequency of 20 Hz. The outlet valve is a “LHLA0521111H” magnetic valve manufactured by “The LEE Company (Westbrook, ME, USA)”. The switching is triggered by the LabVIEW program at a certain time. The amplified switching signal is used to change the state of the valve, see Figure 11.
Figure 11. Measurement setup for the drug delivery system. The outlet valve can be opened on demand. The pump can stop at any time depending on the displacement, measured by the laser triangulation.
Micromachines 06 00080 g011

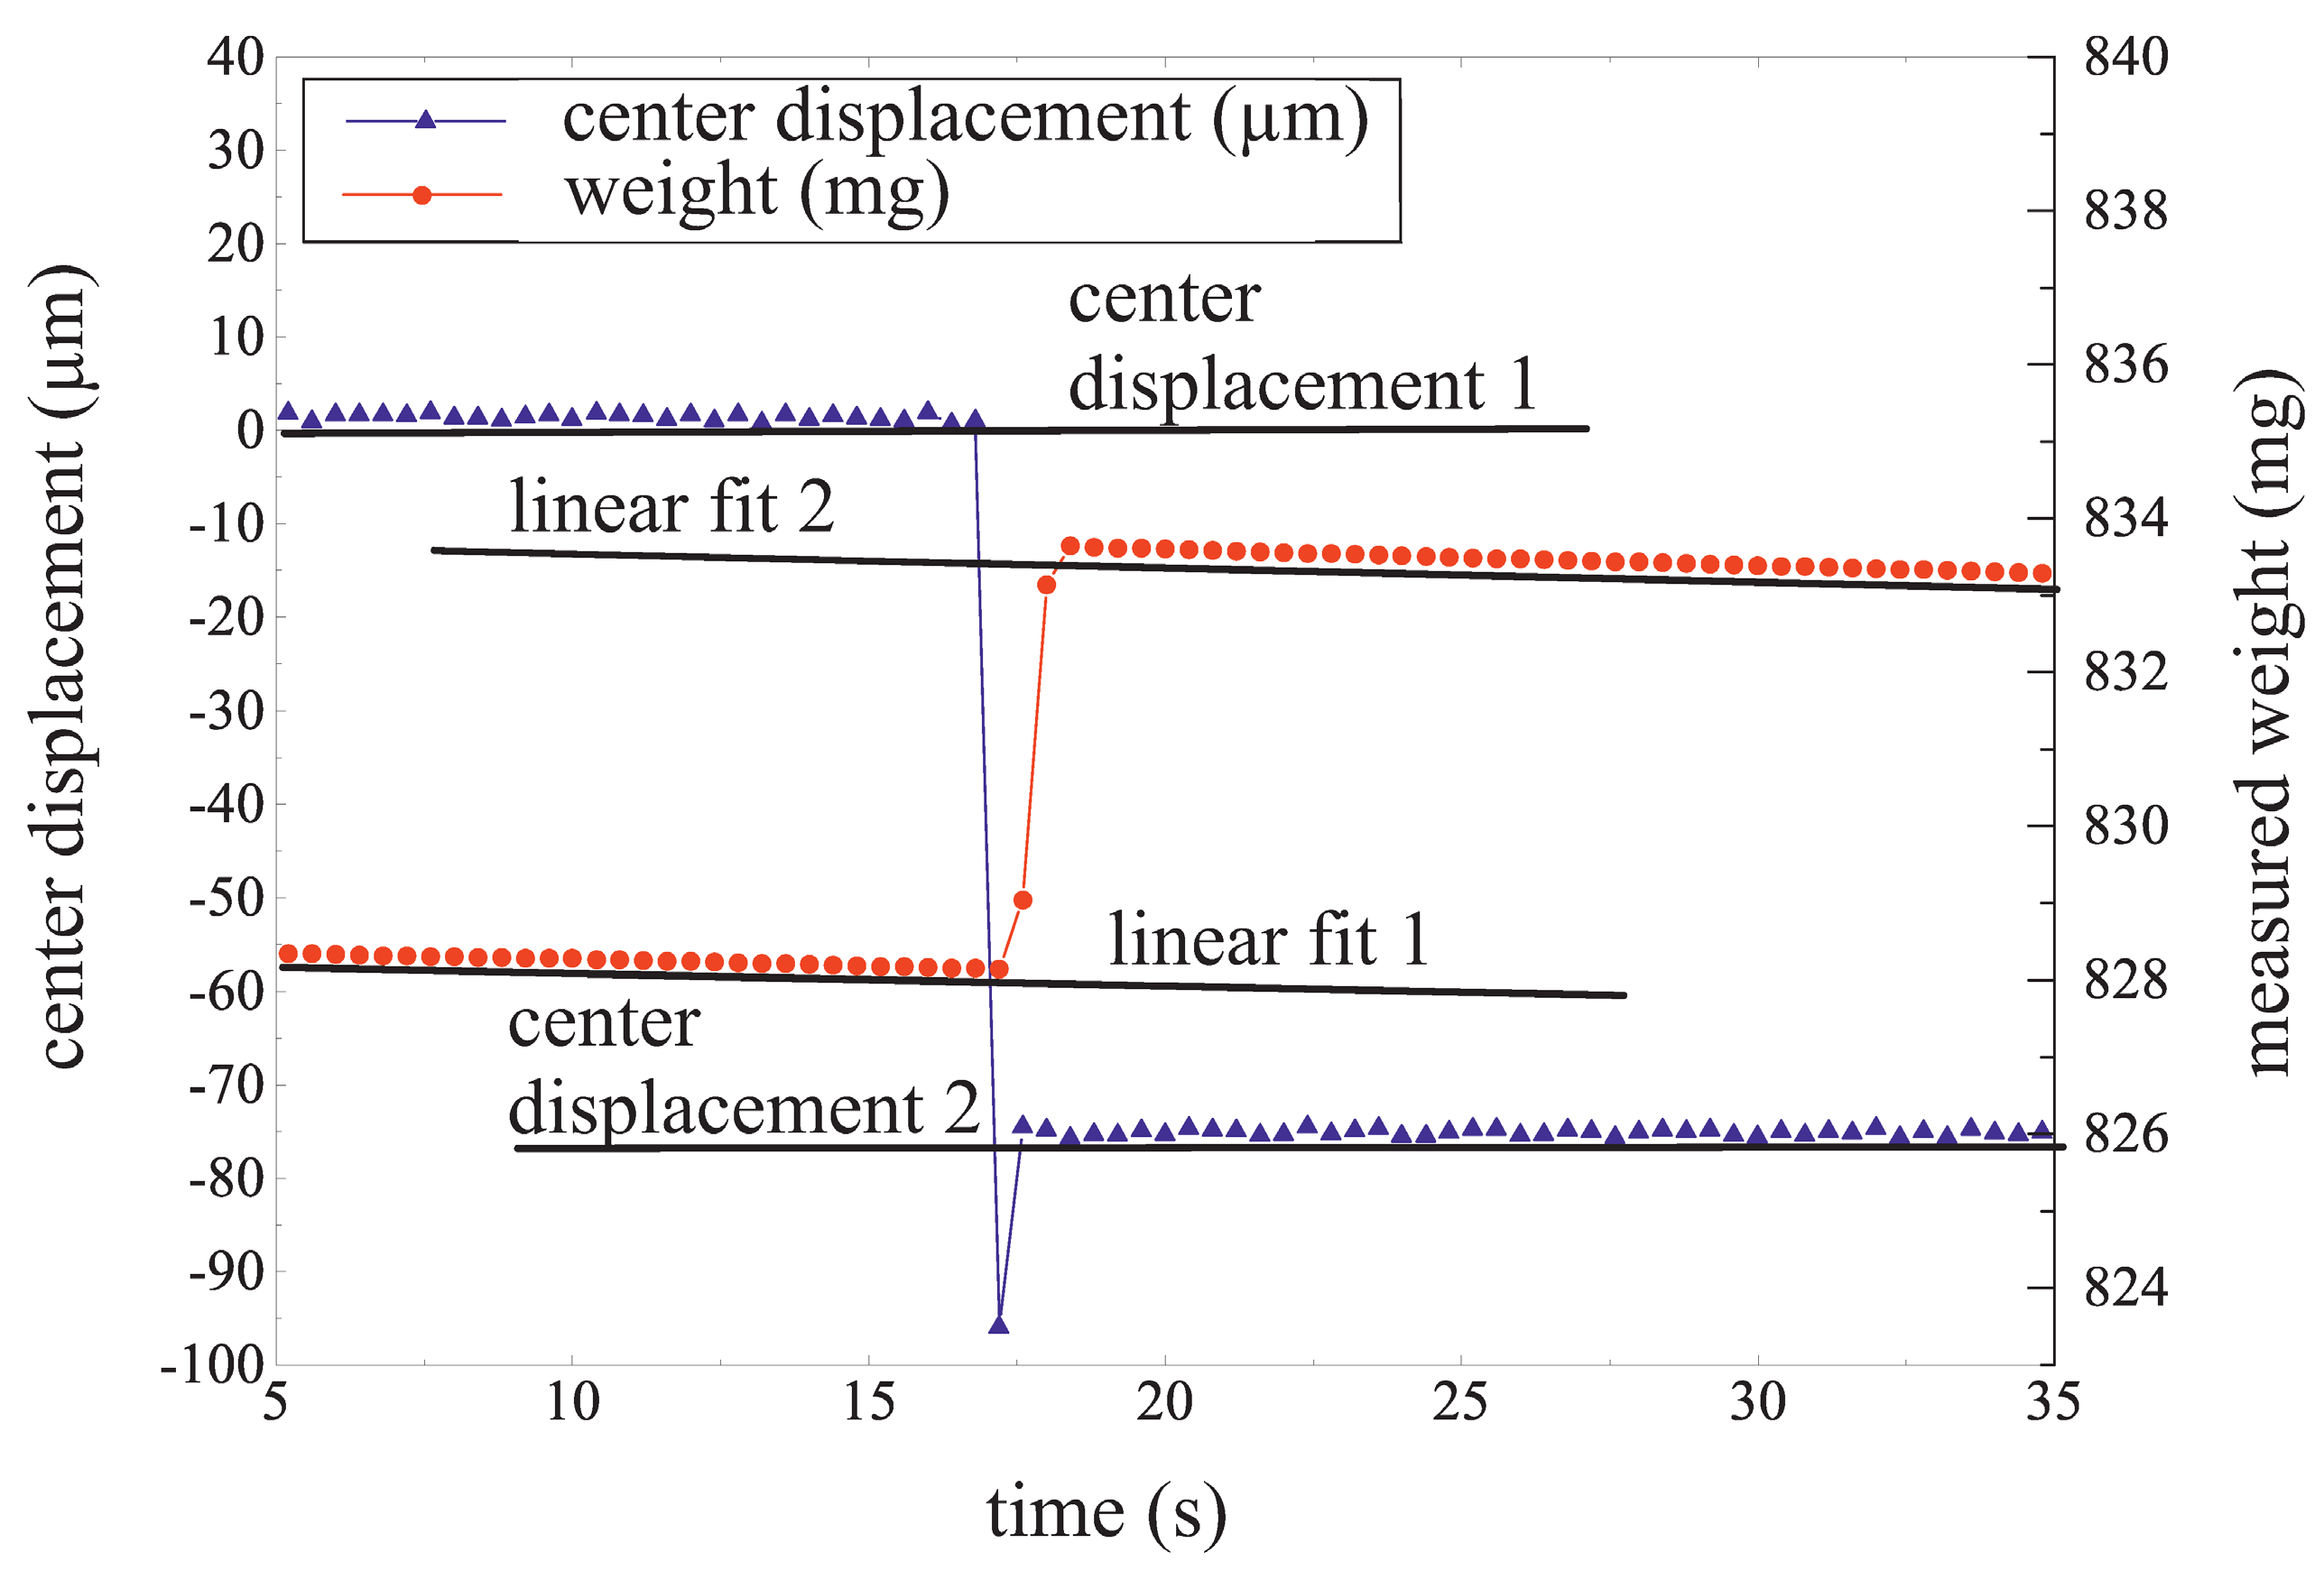
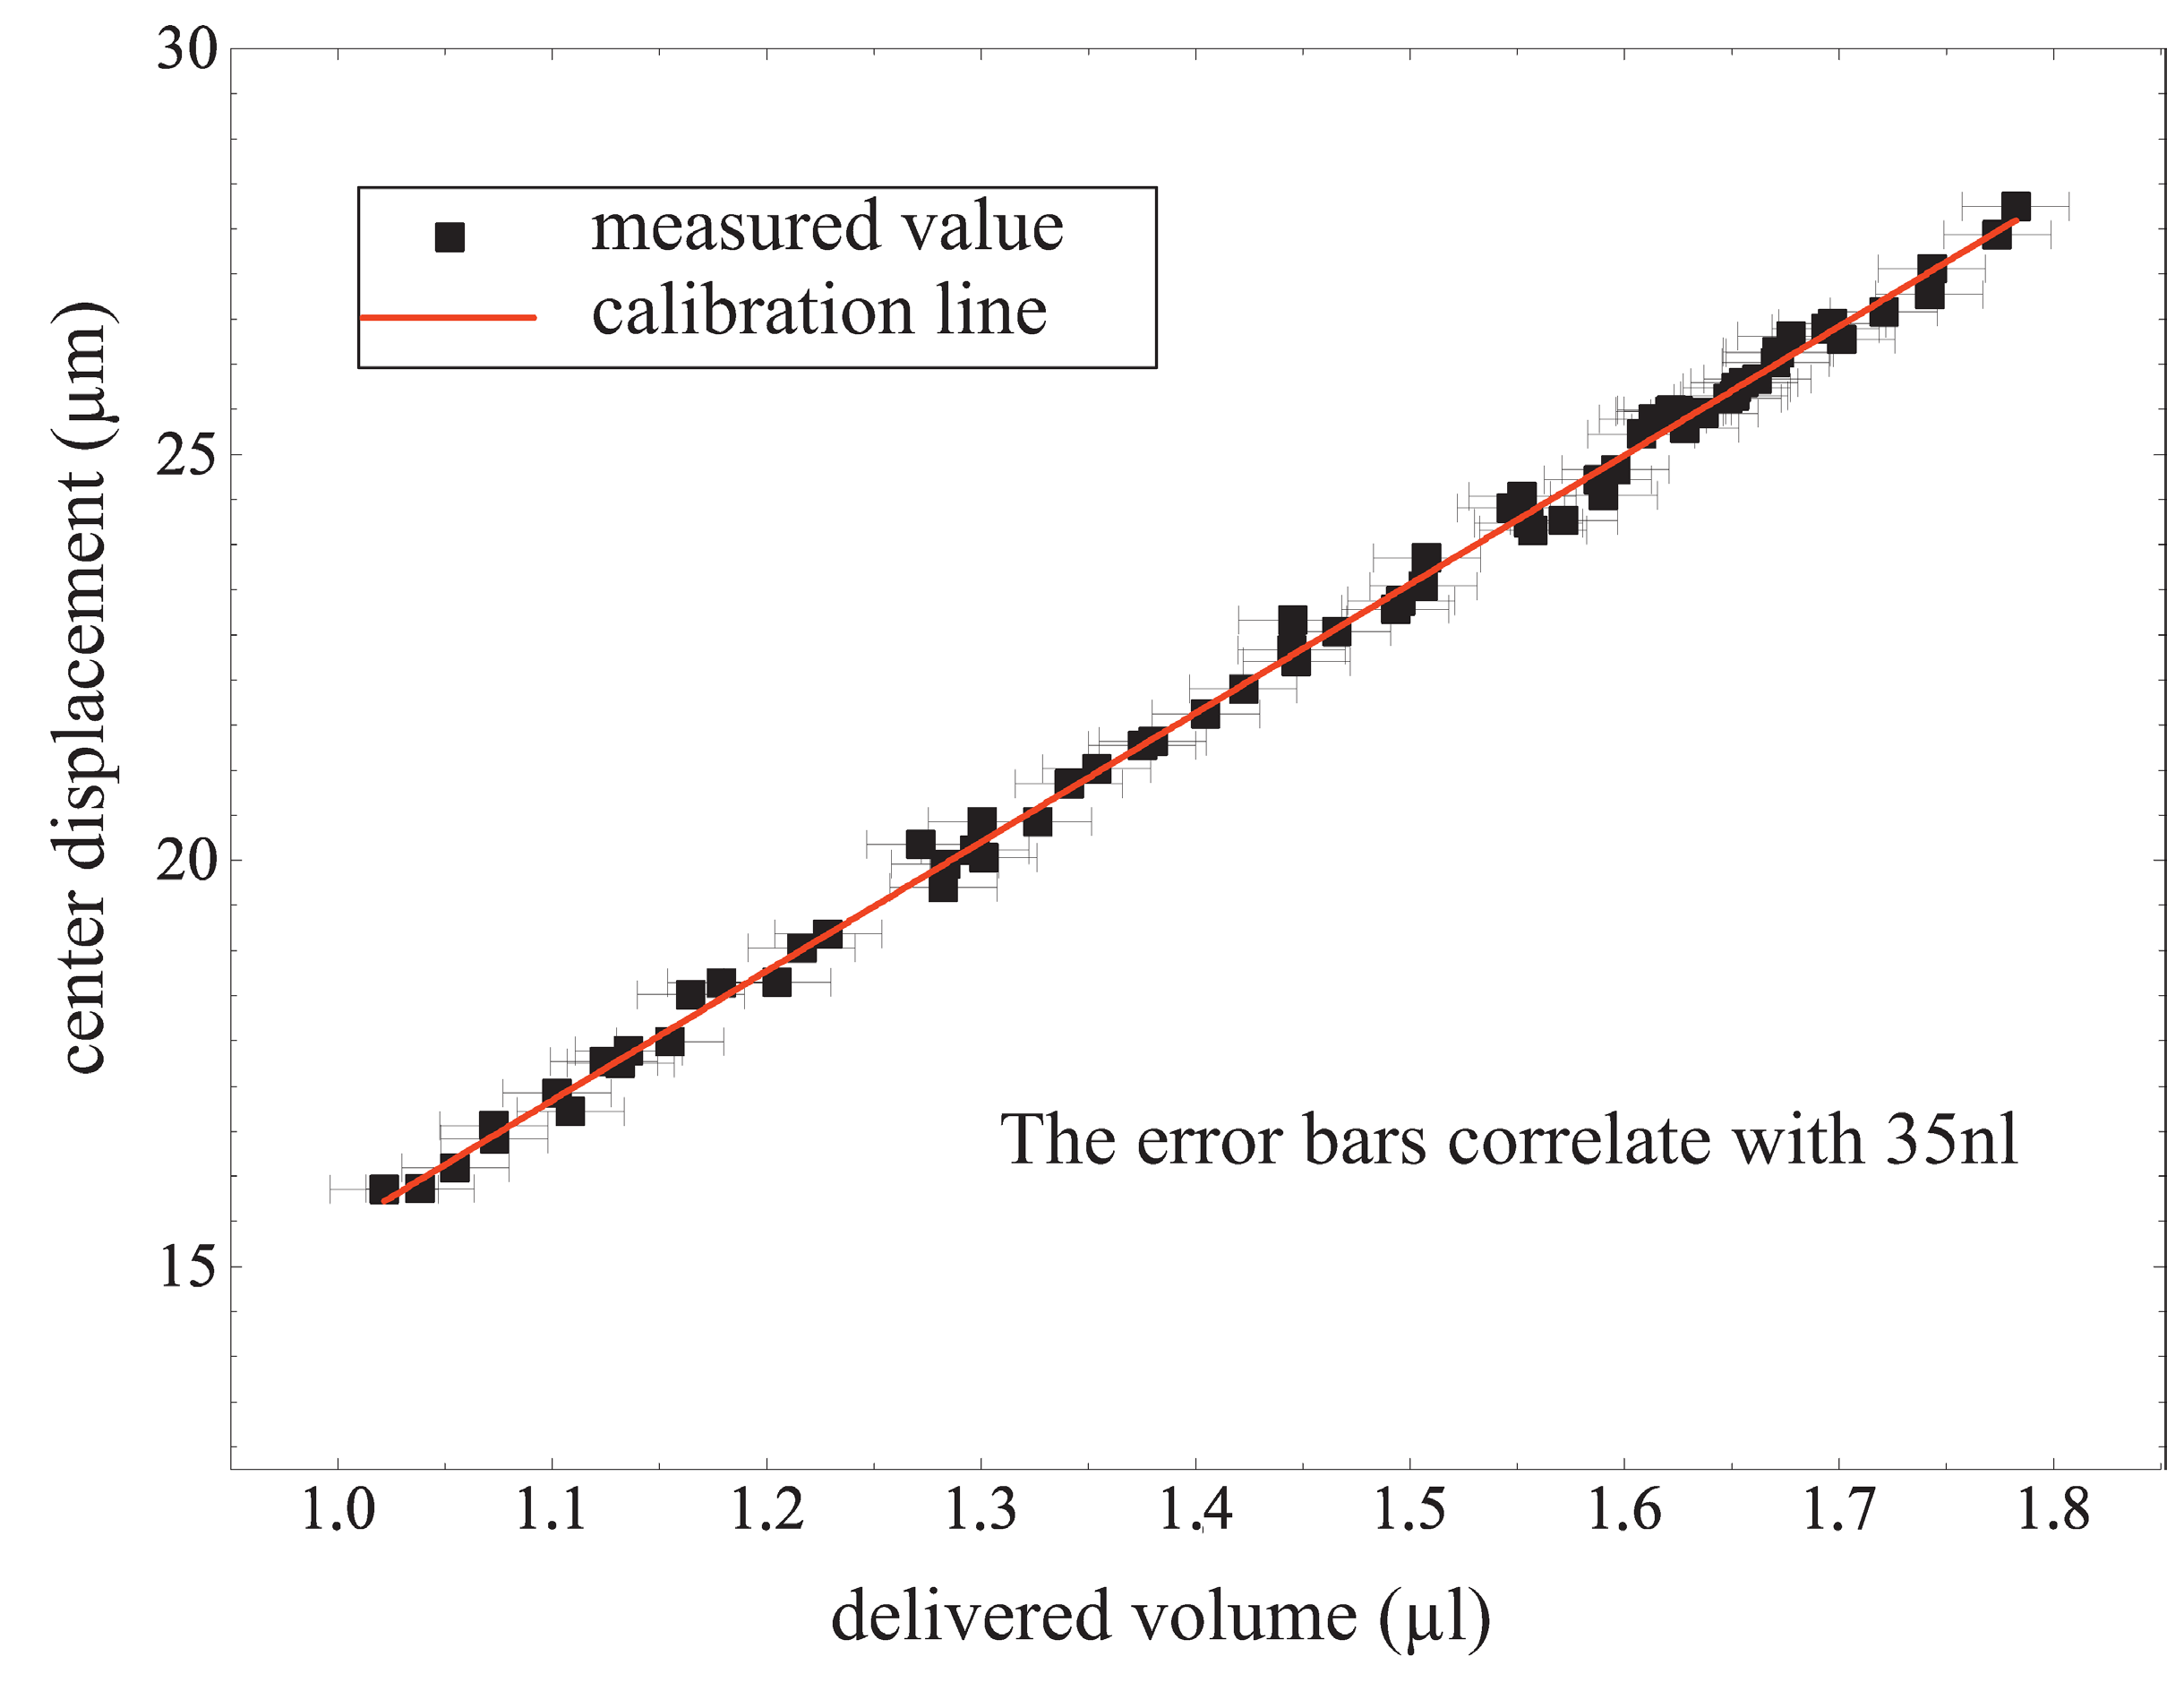
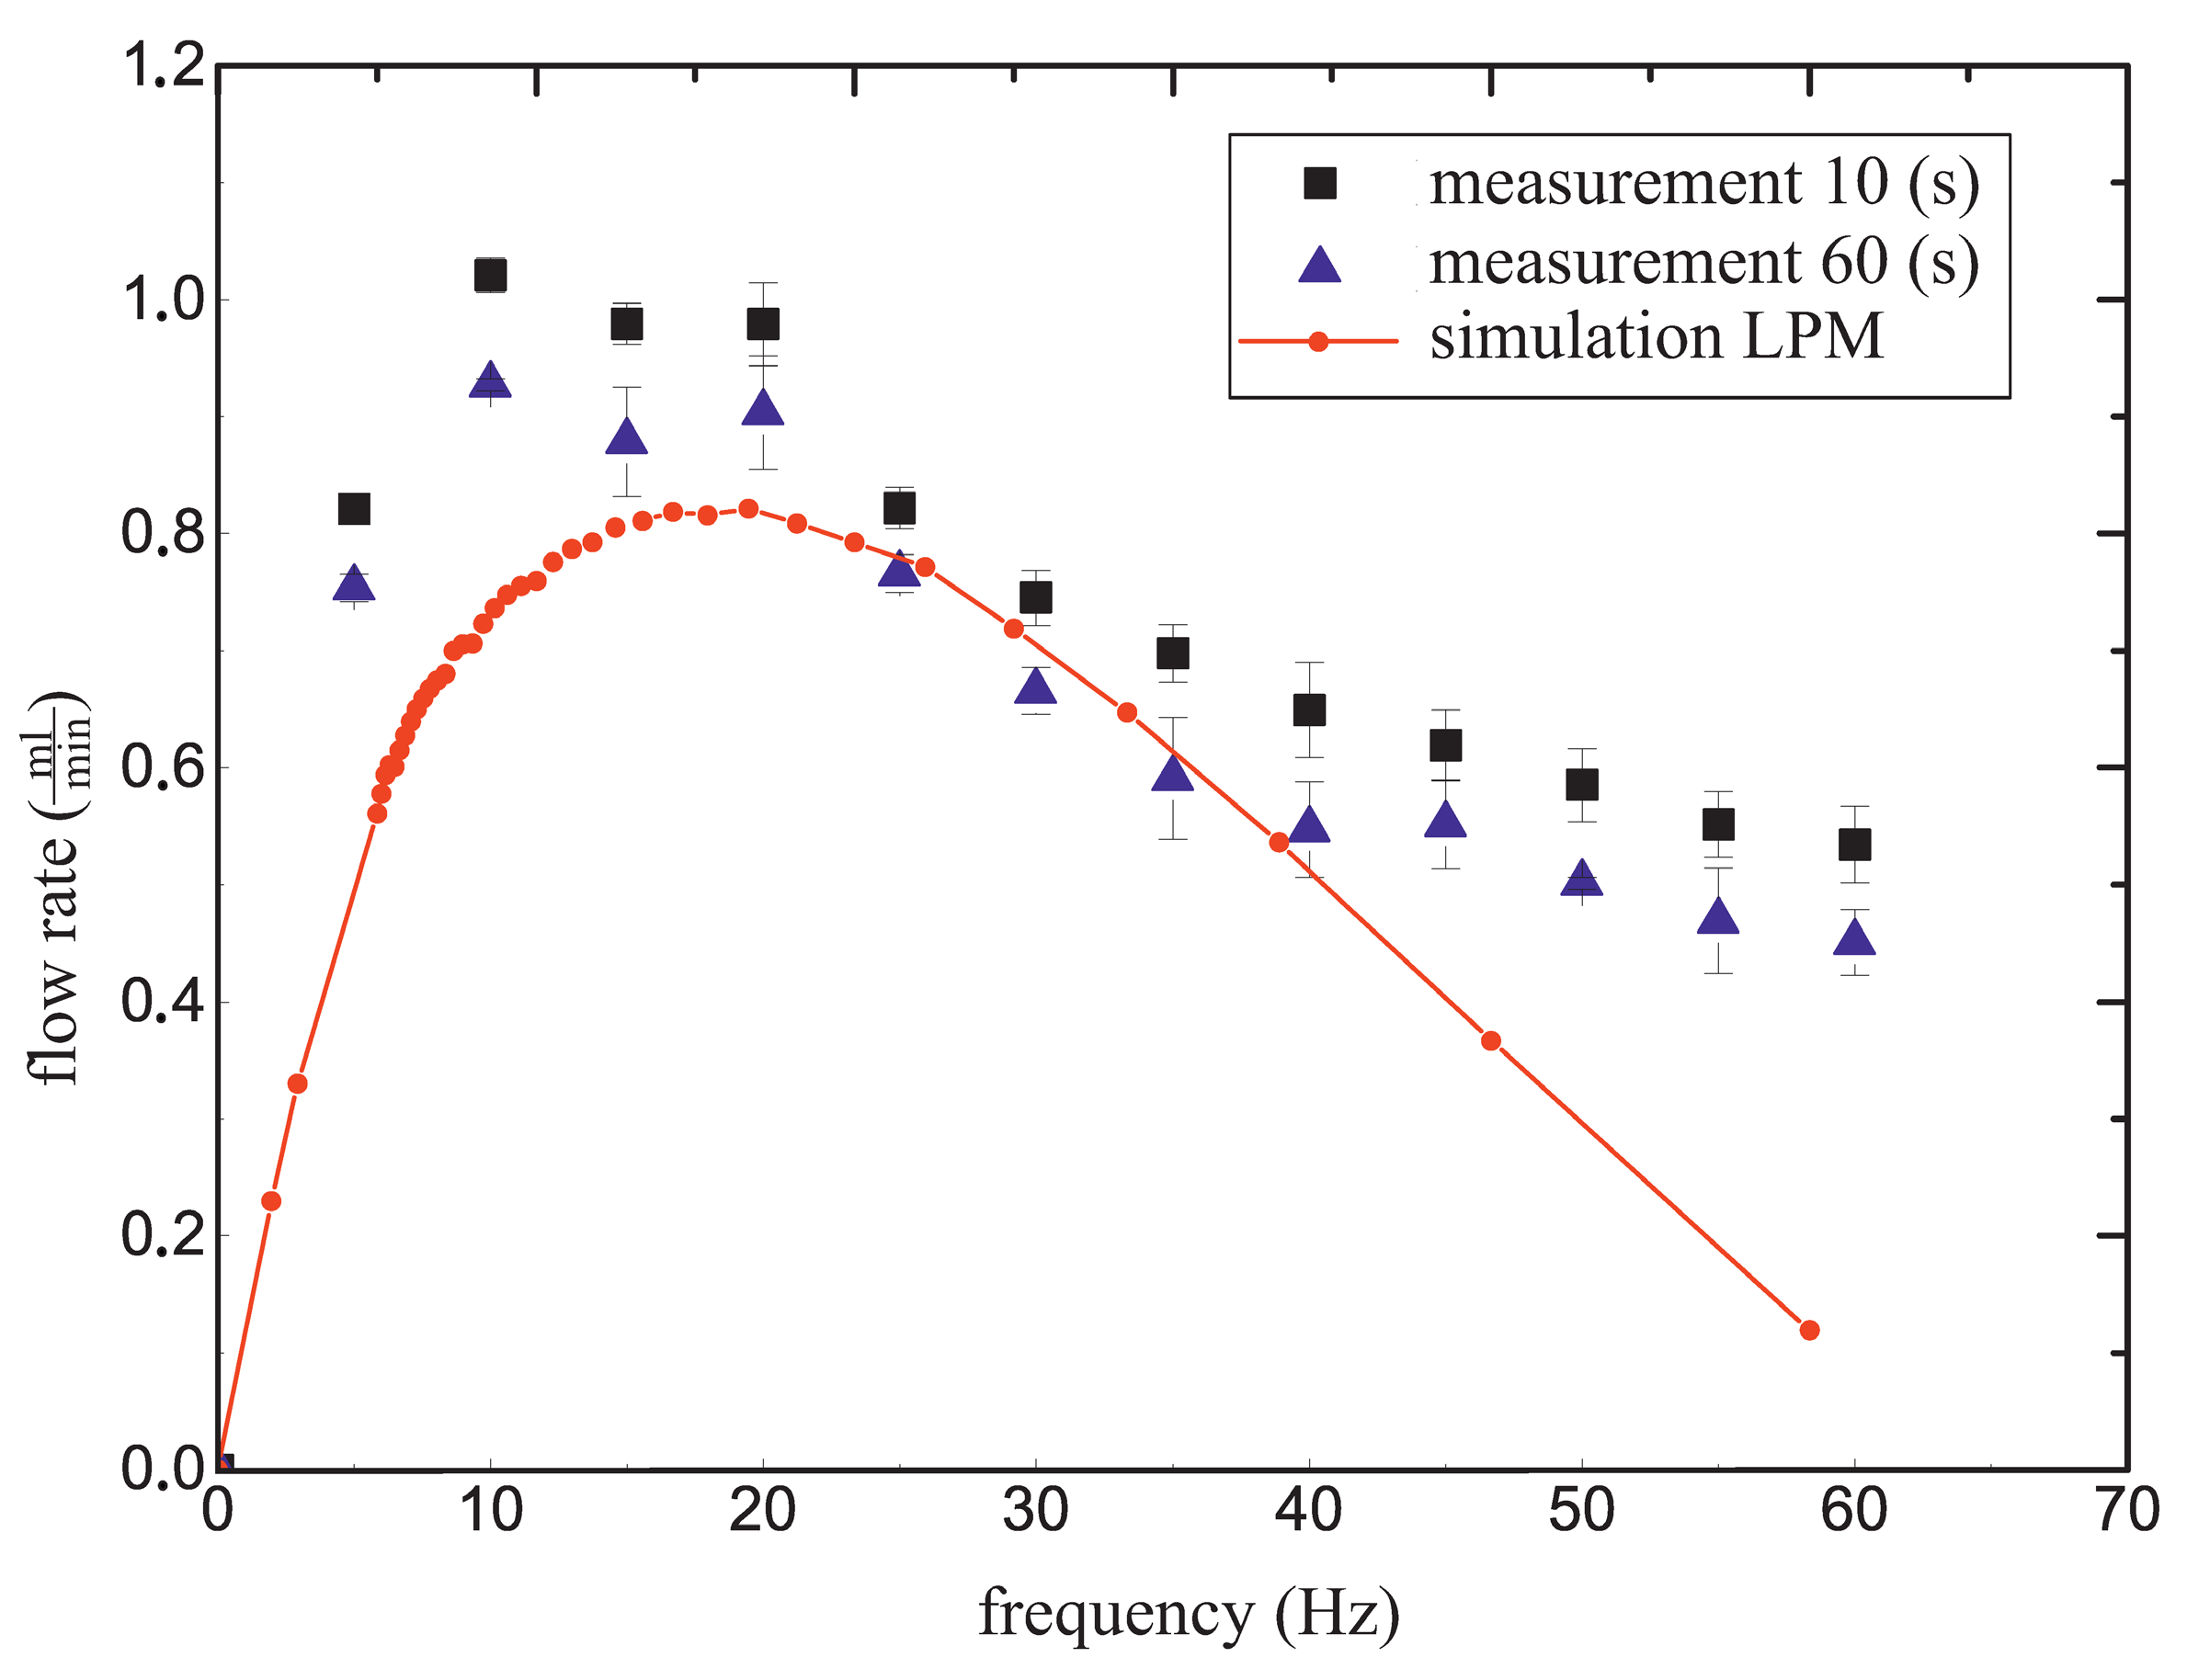
3.2. Measurement Results

First, a simulation of the pump itself is set up, to verify the lumped parameter model of the pump. Therefore, the frequency dependence of the pump itself, see Figure 2, is measured and compared with the simulation results, see Figure 12. Two flow measurements where performed. First the flow rate was measured three times for 10 s, and secondly the measurement was performed three times for 60 s, see Figure 12. The theoretical curve, simulated by the lumped parameter model, is given as the red curve. Compared with the 60 s measurement, the simulations show a satisfactory correlation below a frequency of 35 Hz. Higher actuation frequencies cannot be simulated with this model due to inertial effects that are not covered by the simple model of a fluidic inductance.
Figure 12. Comparison of the frequency dependence of the simulated and measured pump. The measuring is repeated three times for 10 and 60 s.
Micromachines 06 00080 g012
After the verification of the lumped parameter model of the pump, the dosing part is added. The simulated delivered volume is compared with the measurement of the drug delivery system. To measure the dispensed volume using water, evaporation effects of the small delivered droplets have to be taken into account. Therefore a single measurement is shown in Figure 13, to explain the approach for the calculation of the delivered volume. After finishing the filling process of the storage chamber, the center displacement and the weight of the dispensed fluid is calculated, see Figure 13. As can be seen in Figure 13 the height is constant, while the weight is decreasing. After a certain time the outlet valve is opened. Due to the preload of the membrane, the stored water volume is forced to flow out. The membrane moves to the original state, while the measured weight increases. The evaporation has a significant influence on the weight. Therefore we perform a linear fit to the measurement points and evaluate them at the time of the dispensing. The offset of the two calculations is taken as the weight of the delivered fluid. The center displacement is calculated by the offset of the mean of the two measurements before and after delivery. To prove the accuracy of the new drug delivery method 67 dosages where performed. It can be seen that the correlation between the center displacement and the delivered volume is very close to the calibration line, see Figure 14.
Figure 13. Measurement of the delivered volume and the center displacement at the same time. The center shows stable displacement result while the measured weight of the fluid changes with time. This is due to evaporation effects.
Micromachines 06 00080 g013
Figure 14. Delivered volumes in relation to the center displacement. The delivered volume deviates from the calibration line by a maximum of 35 nL.
Micromachines 06 00080 g014
The residual plot, see Figure 15, shows a normal distribution around the calculated value of the calibration line. The regular residual ri is the observed value of the center displacement minus the predicted value of center displacement. The fluctuation around zero can be explained by the resolution of 0.4 μm of the laser triangulation measurement.
The gradient of the simulated dosing volume compared to the calibration line of the dispensed volumes deviates by 29%. As a result of the parasitic capacitances like tubes and connectors, calibration measurements of the whole system without the storage capacitance were performed. The results of this measurement where taken as the offset. The offset is subtracted from the measurements, depicted in Figure 16.
Figure 15. The regular residual of the dosing event between 1 and 1.8 μL with a constant variance.
Micromachines 06 00080 g015
Figure 16. Simulated line and measured values fitted with a calibration regression.
Micromachines 06 00080 g016
In addition to the accurate delivery, the temporal profile of the center displacement during the filling and the dosing process of the fluid can be used as a safety feature. The center displacement is measured during a filling to the maximum achievable pressure, see Figure 17. The time dependent displacement is calculated by solving the differential Equation (10).
C P p t = q ( p ) = q m a x × ( 1 q q m a x )
Solving differential Equation (10) results in Equation (11).
p = p m a x * e q 0 R ( C m e m + C p a r a ) * t  
With the measurement of the flow at 20 Hz, see Figure 12, and the displacement of the membrane, which can be used to calculate the maximum pressure, Cpara can be calculated. With pmax of 210 mbar and a flow rate at 20 Hz of 880 μL/min,·R × (Cmem + Cpara) can be calculated. If we now assume that the resistance between the pump and the storage membrane is small and that the capacitance of the storage membrane is known, the parasitic capacitances can be derived from the delivered volume.
If we compare the exponential fits, of the center displacment in Figure 17 and the simulated pressure in Figure 18, it is possible to define a time constant for the exponential characteristic.
In the lumped parameter model Cpara is assumed as zero. With the exponential fit curves of the simulated and measured filling process, we obtain the following values for the RC-modules for the storage chamber, see Equations (12) and (13) and section II in Figure 4.
τ s i m = R * ( C m e m ) = 0.18   s
τ m e s = R * ( C m e m + C p a r a ) = 0.43   s
If we now compare the simulated and the measured gradient of the delivered volume vs. center displacement, see Figure 16, we observe that a factor of 1.83 between them. Cmem × 0.83 has to be substituted as Cpara in Equation (11). With this assumption the time constant τ is then calculated to 0.46 s. Comparing the measured time constant 0.43 s, Equation (12), with the calculated τ of 0.46 s which is derived from the time dependent dosing event, the dispensed volume can be calculated with an error of 7%.
Figure 17. Time dependent center displacement of the storage chamber membrane.
Micromachines 06 00080 g017
Figure 18. Simulated time dependent pressure under the storage chamber membrane.
Micromachines 06 00080 g018

3.3. Discussion

To summarize the results of our new design, we have to account for two things: First the validation of the lumped parameter model and second the accuracy of the developed drug delivery system. The lumped parameter model for the pump calculates the frequency dependent flow with an accuracy of 20%. The frequency, at which the maximum flow rate is generated, can be calculated very precisely. Taking into account the fact, that only the geometric parameters are used in the model, also the deviation of the electro-mechanical simulation and the fluidic calculations influence the results. The mechanical simulations of the piezoelectrically actuated membranes are not represented in this paper. The deviation between mechanical simulation and measurement are about 12%–20% for different membranes. Taking into account all these facts, the results of the lumped parameter model are satisfactory. Therefore this first principle modeling of the whole microfluidic system can be considered as a valuable tool for further optimizations.
The delivery of a defined volume is compared to a calibration line. The error has a maximum deviation of 35 nL in a dosing range of 1 to 1.8 μL. This error can be explained by the measurement uncertainty of the used equipment. A calibrated system has the potential to show a distinct improvement to the state of the art by reaching relative accurrancy of better than 3.5%. The currently used implanted drug delivery systems with an active micropump have accuracies between 10% and 15%, see Table 1 [5].

4. Conclusions

In a summary the new drug delivery system has the potential to be more accurate than the drug delivery systems on the market. Implementing a measurement technology before drug delivery furthermore increases the patient’s safety. With the lumped parameter model, we have developed a tool that allows a fast calculation of the fluidic characteristics only with the knowledge of geometric and piezo-ceramic parameters.

5. Outlook

After the proof of concept, the next development step will be an integration of the measurement into a miniaturized system. First a reduction of the actuator voltage has to be established. This can be achieved with multilayer piezoactuators. The functionality of multilayer piezoelectrically driven micropumps is shown in [19,20]. With the reduction of the applied voltage almost the same performance can be expected. An integrated measurement of the additional volume in the storage chamber can be done with a pressure sensor [21], that can be integrated into the membrane of the storage chamber. Alternatively a capacitive measurement can be used [22]. With these development steps and the following examination of biocompatibility issues a miniaturized implantable drug delivery system with increased accuracy and safety seems feasible.

Author Contributions

Florian Thoma designed the dosing system, set up the lumped parameter model, carried out the experiments and wrote the paper. Peter Woias and Frank Goldschmidtböing advised the author concerning the simulation and the dosing technology.

Appendix A1. List of Symbols

SymbolDefinitionUnit
AAream2
CFluidic capacitancem5/N
hvGap of the valveM
KStiffnessN/m
LFluidic inductancekg/m4
MMassKg
PPressureBar
VVolumem3
QFluidic flowm3/s
RFluidic resistanceN·s/m5
ΡDensitykg/m3
ΤTime constantS
ΧFriction coefficientN·s/m

Conflicts of Interest

The authors declare no conflict of interest.

References

  1. Wang, W.; Soper, S.A. Bio-MEMS: Technologies and Applications; CRC Press: Boca Raton, FL, USA, 2006. [Google Scholar]
  2. Stevenson, C.L.; Santini, J.T., Jr.; Langer, R. Reservoir-based drug delivery systems utilizing microtechnology. Adv. Drug Deliv. Rev. 2012, 64, 1590–1602. [Google Scholar] [CrossRef] [PubMed]
  3. Jain, K.K. Textbook of Personalized Medicine; Springer: New York, NY, USA, 2009. [Google Scholar]
  4. Meng, E.; Hoang, T. MEMS-enabled implantable drug infusion pumps for laboratory animal research, preclinical, and clinical applications. Adv. Drug Deliv. Rev. 2012, 64, 1628–1638. [Google Scholar] [CrossRef] [PubMed]
  5. Receveur, R.A.M.; Lindemans, F.W.; de Rooij, N.F. Microsystem technologies for implantable applications. J. Micromech. Microeng. 2007, 17, R50–R80. [Google Scholar] [CrossRef]
  6. Goldschmidtböing, F.; Doll, A.; Heinrichs, M.; Woias, P.; Schrag, H.-J.; Hopt, U.T. A generic analytical model for micro-diaphragm pumps with active valves. J. Micromech. Microeng. 2005, 15, 673. [Google Scholar] [CrossRef]
  7. Woias, P. Micropumps-summarizing the first two decades. In Proceeding of SPIE 4560, Microfluidics and BioMEMS, San Francisco, CA, USA, 22 October 2001.
  8. Smits, J.G. Piezoelectric micropump with three valves working peristaltically. Sens. Actuators A Phys. 1990, 21, 203–206. [Google Scholar] [CrossRef]
  9. Kan, J.; Tang, K.; Liu, G.; Zhu, G.; Shao, C. Development of serial-connection piezoelectric pumps. Sens. Actuators A Phys. 2008, 144, 321–327. [Google Scholar] [CrossRef]
  10. Kan, J.; Tang, K.; Ren, Y.; Zhu, G.; Li, P. Study on a piezohydraulic pump for linear actuators. Sens. Actuators A Phys. 2009, 149, 331–339. [Google Scholar] [CrossRef]
  11. Geipel, A.; Goldschmidtböing, F.; Doll, A.; Jantscheff, P.; Esser, N.; Massing, U.; Woias, P. An implantable active microport based on a self-priming high-performance two-stage micropump. Sens. Actuators A Phys. 2008, 145–146, 414–422. [Google Scholar] [CrossRef]
  12. Français, O.; Dufour, I. Dynamic simulation of an electrostatic micropump with pull-in and hysteresis phenomena. Sens. Actuators A Phys. 1998, 70, 56–60. [Google Scholar] [CrossRef]
  13. Lin, Q.; Yang, B.; Xie, J.; Tai, Y.C. Dynamic simulation of a peristaltic micropump considering coupled fluid flow and structural motion. J. Micromech. Microeng. 2007, 17, 220. [Google Scholar] [CrossRef]
  14. Bourouina, T.; Grandchamp, J.P. Modeling micropumps with electrical equivalent networks. J. Micromech. Microeng. 1996, 6, 398–404. [Google Scholar] [CrossRef]
  15. Hamdan, M.N.; Abdallah, S.; Al-Qaisia, A. Modeling and study of dynamic performance of a valveless micropump. J. Sound Vib. 2010, 329, 3121–3136. [Google Scholar] [CrossRef]
  16. Oertel, H.; Böhle, M.; Dohrmann, U. Strömungsmechanik: Grundlagen, Grundgleichungen, Lösungsmethoden, Softwarebeispiele, 4th ed.; Springer Vieweg: Berlin, Germany, 2009. [Google Scholar]
  17. Truckenbrodt, E. Fluidmechanik, 4th ed.; Springer Vieweg: Berlin, Germany, 2013. [Google Scholar]
  18. Goldschmidtböing, F. Entwurf, Design und Experimentelle Charakterisierung von Mikro-Freistrahldispensern. Ph.D. Thesis, Universitätsbibliothek Freiburg, Freiburg, Germany, 2004. [Google Scholar]
  19. Thoma, F.; Feth, H.F.; Goldschmidtboeing, F.; Woias, P. Integrated fluidic system for an artificial sphincter prosthesis. In Proceeding of 2012 IEEE Micro- and Nanoengineering in Medicine Conference, Maui, HI, USA, 3–7 December 2012.
  20. Biancuzzi, G.; Lemke, T.; Woias, P.; Ruthmann, O.; Schrag, H.J.; Vodermayer, B.; Goldschmidtboeing, F. Design and simulation of advanced charge recovery piezoactuator drivers. J. Micromech. Microeng. 2010, 20, 105022. [Google Scholar] [CrossRef]
  21. Ko, W.; Hynecek, J.; Boettcher, S. Development of a miniature pressure transducer for biomedical applications. IEEE Trans. Electron Devices 1979, 26, 1896–1905. [Google Scholar] [CrossRef]
  22. Yu, J.; Wang, W.; Lu, K.; Mei, D.; Chen, Z. A planar capacitive sensor for 2D long-range displacement measurement. J. Zhejiang Univ. Sci C 2013, 14, 252–257. [Google Scholar] [CrossRef]

