
Development of a Rapid LC-MS/MS Method for the Determination of Emerging Fusarium mycotoxins Enniatins and Beauvericin in Human Biological Fluids

 ,
, 
Abstract
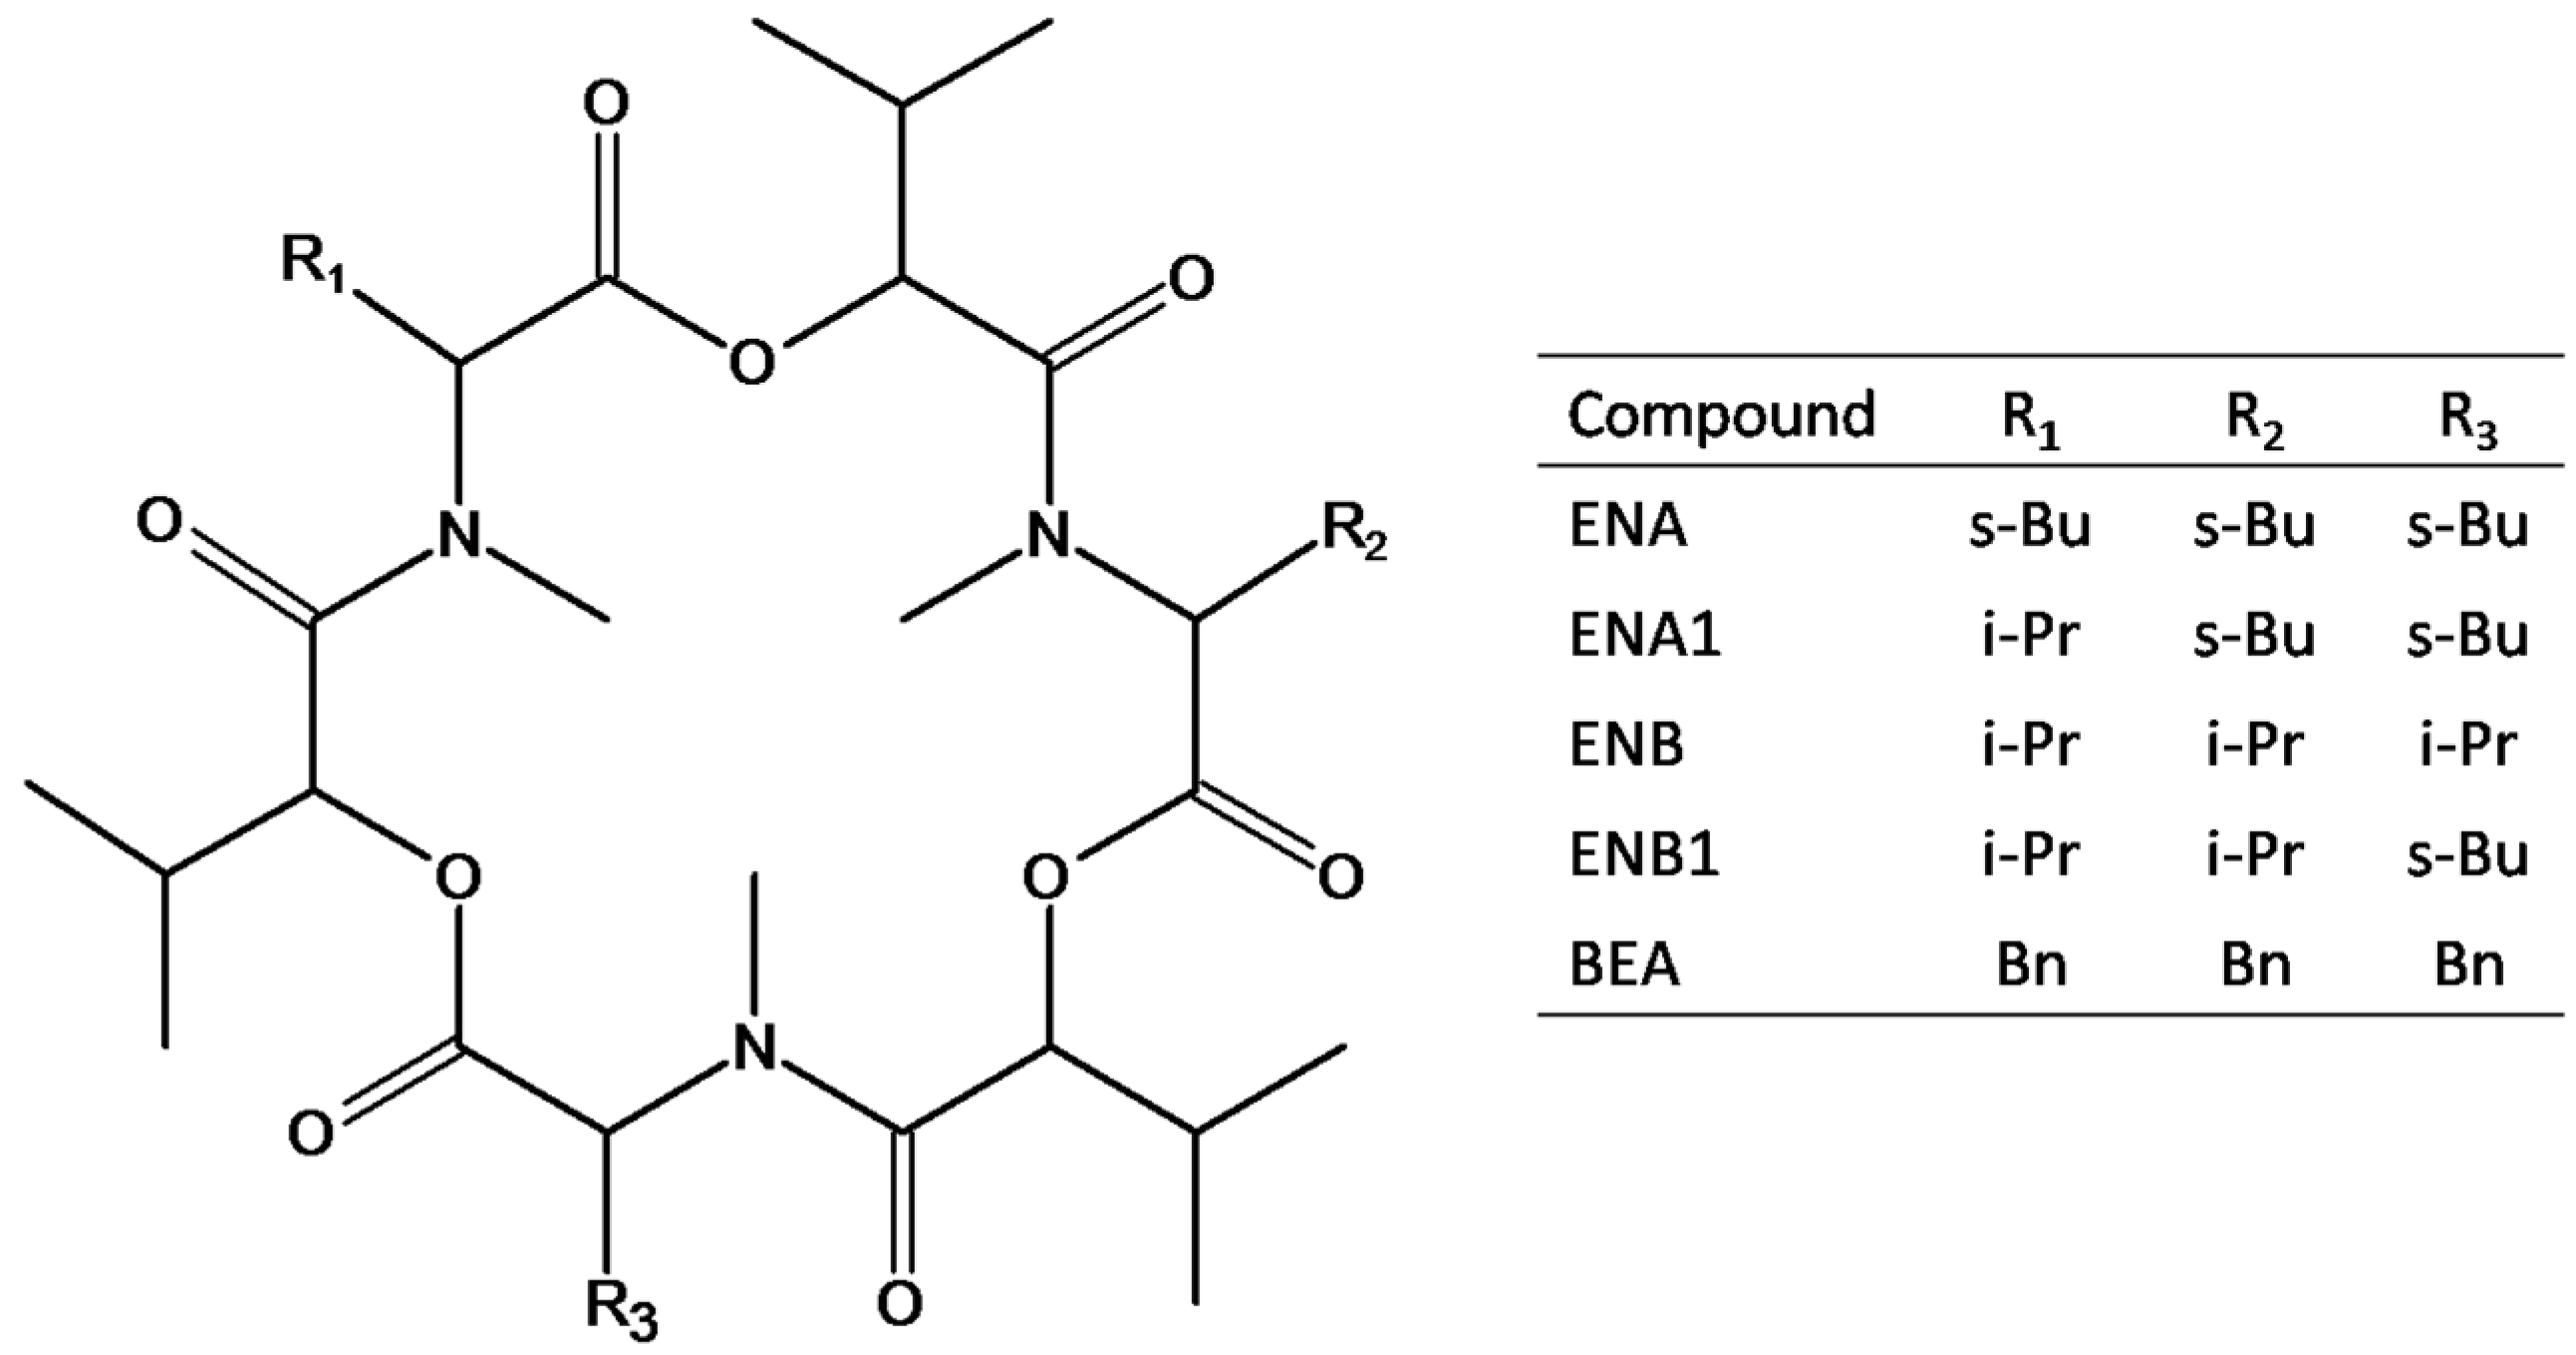
:1. Introduction

2. Results and Discussion
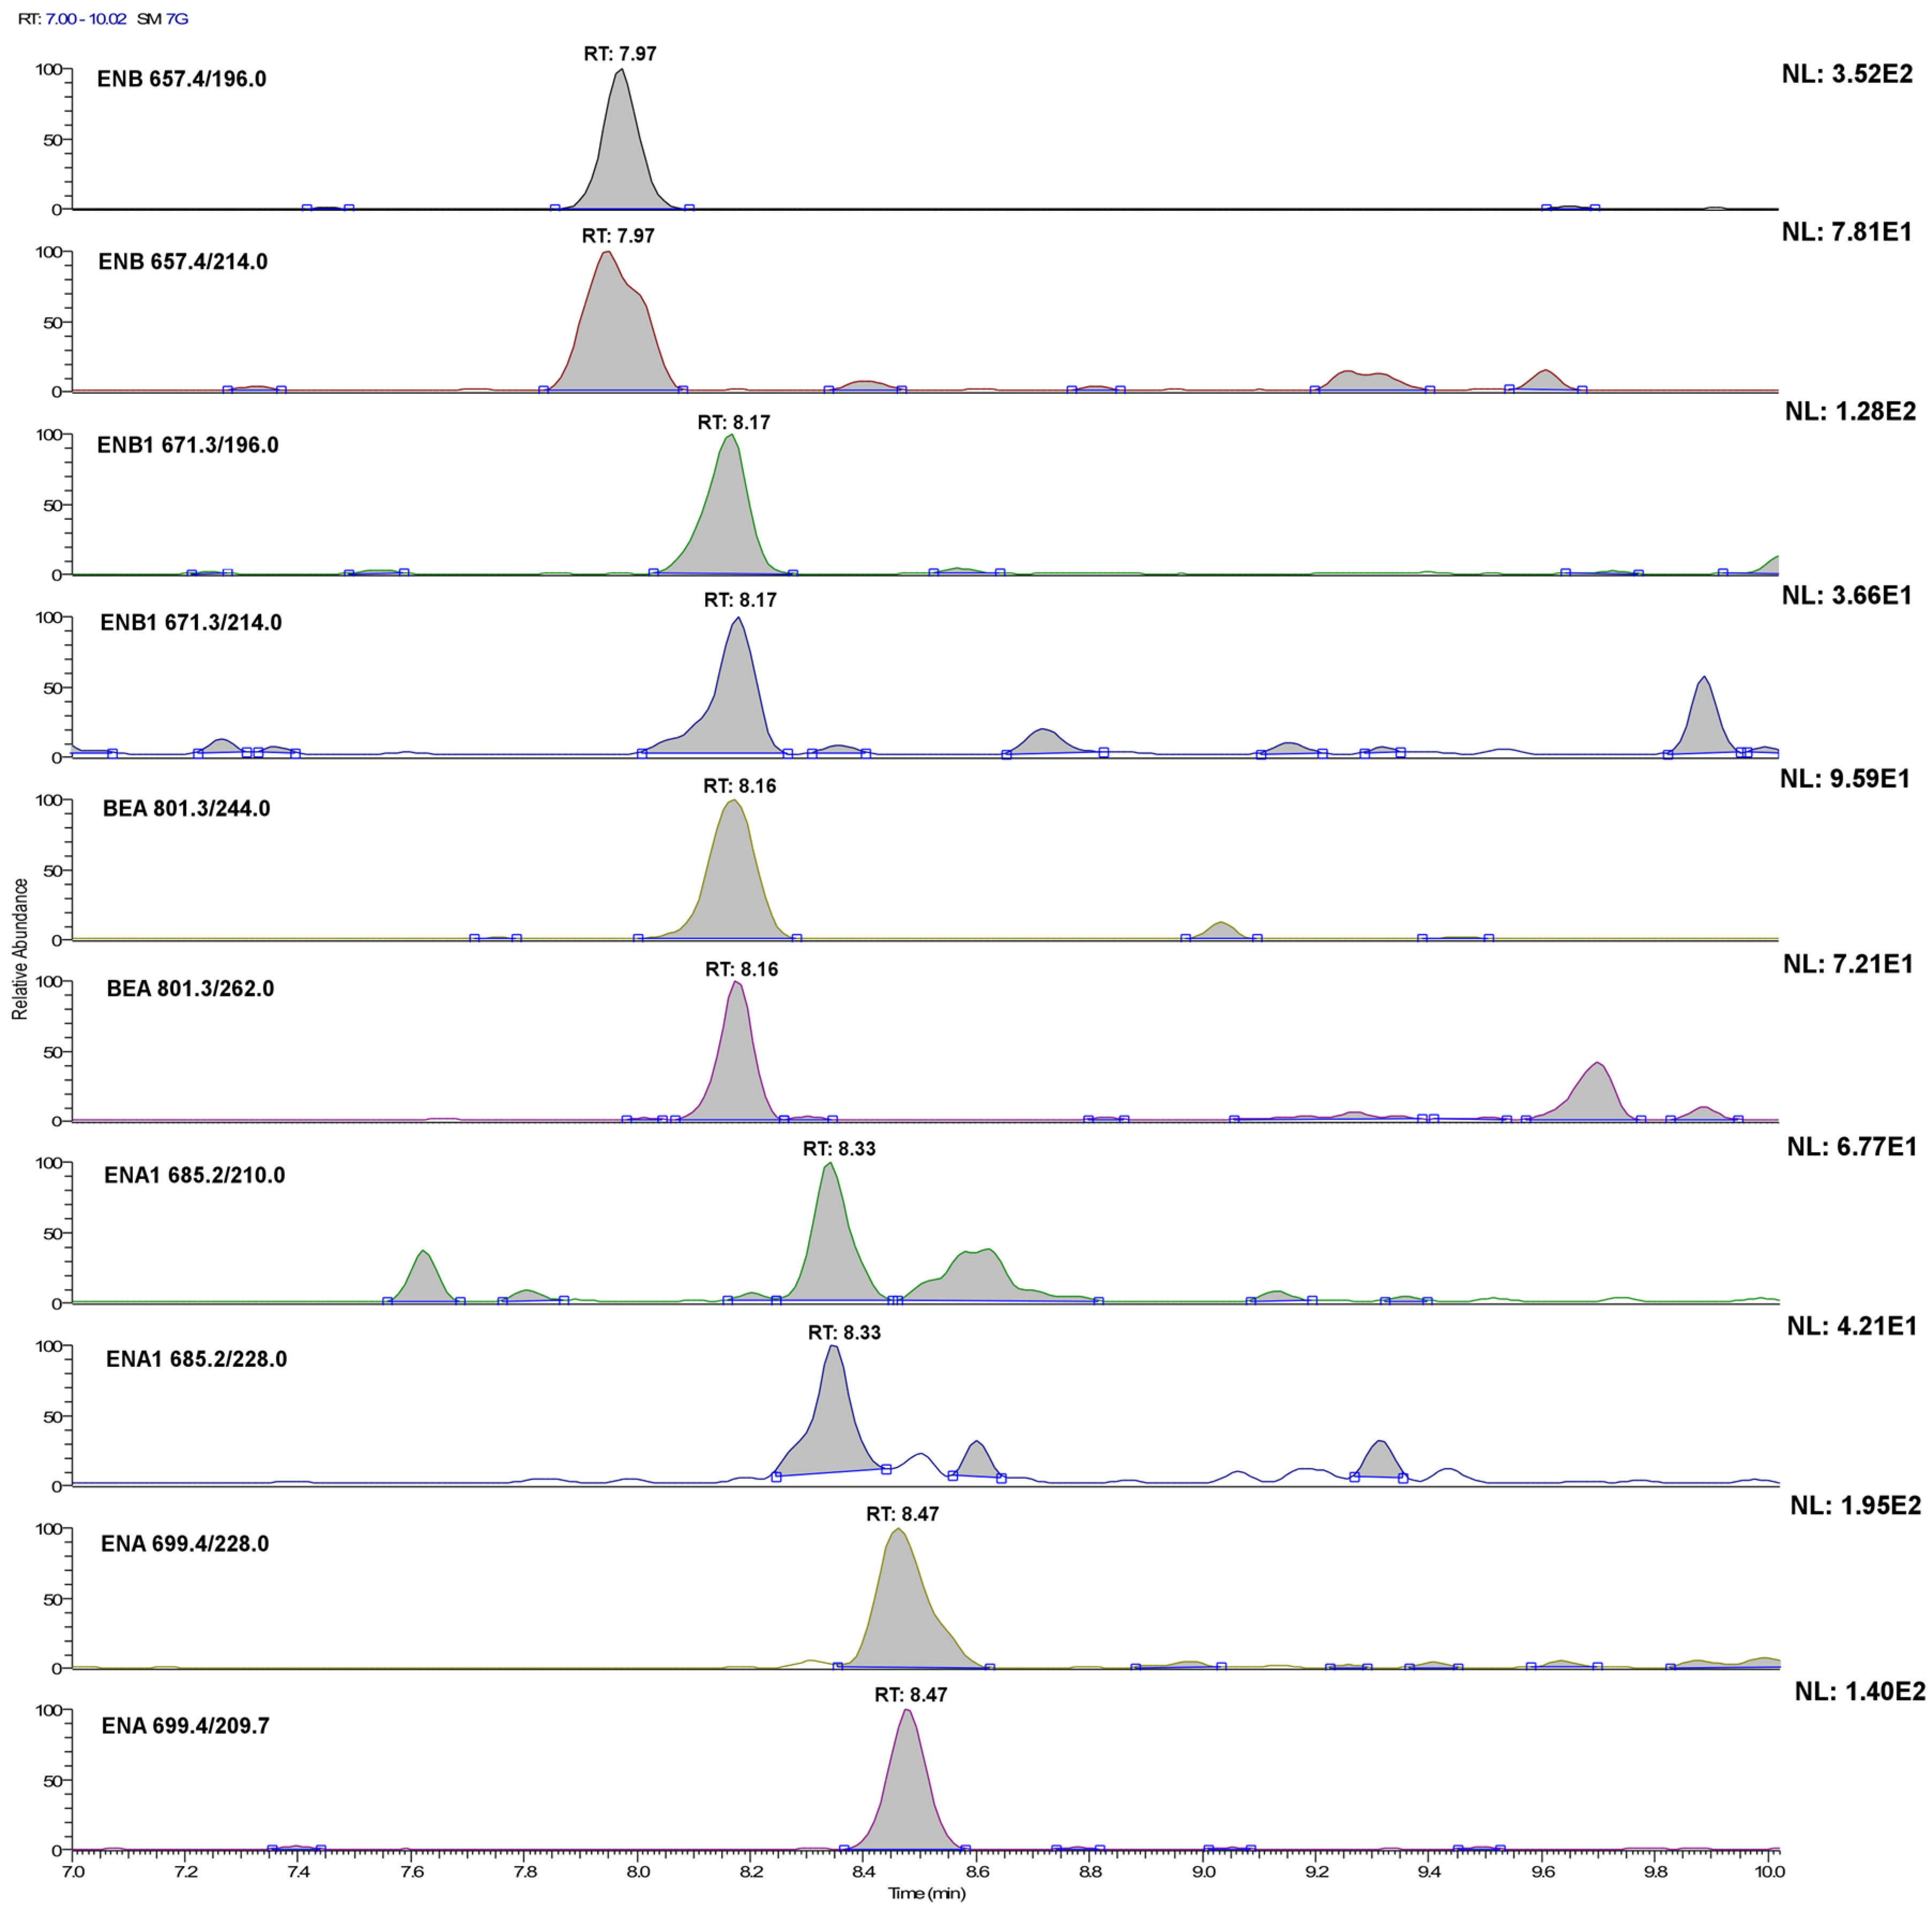
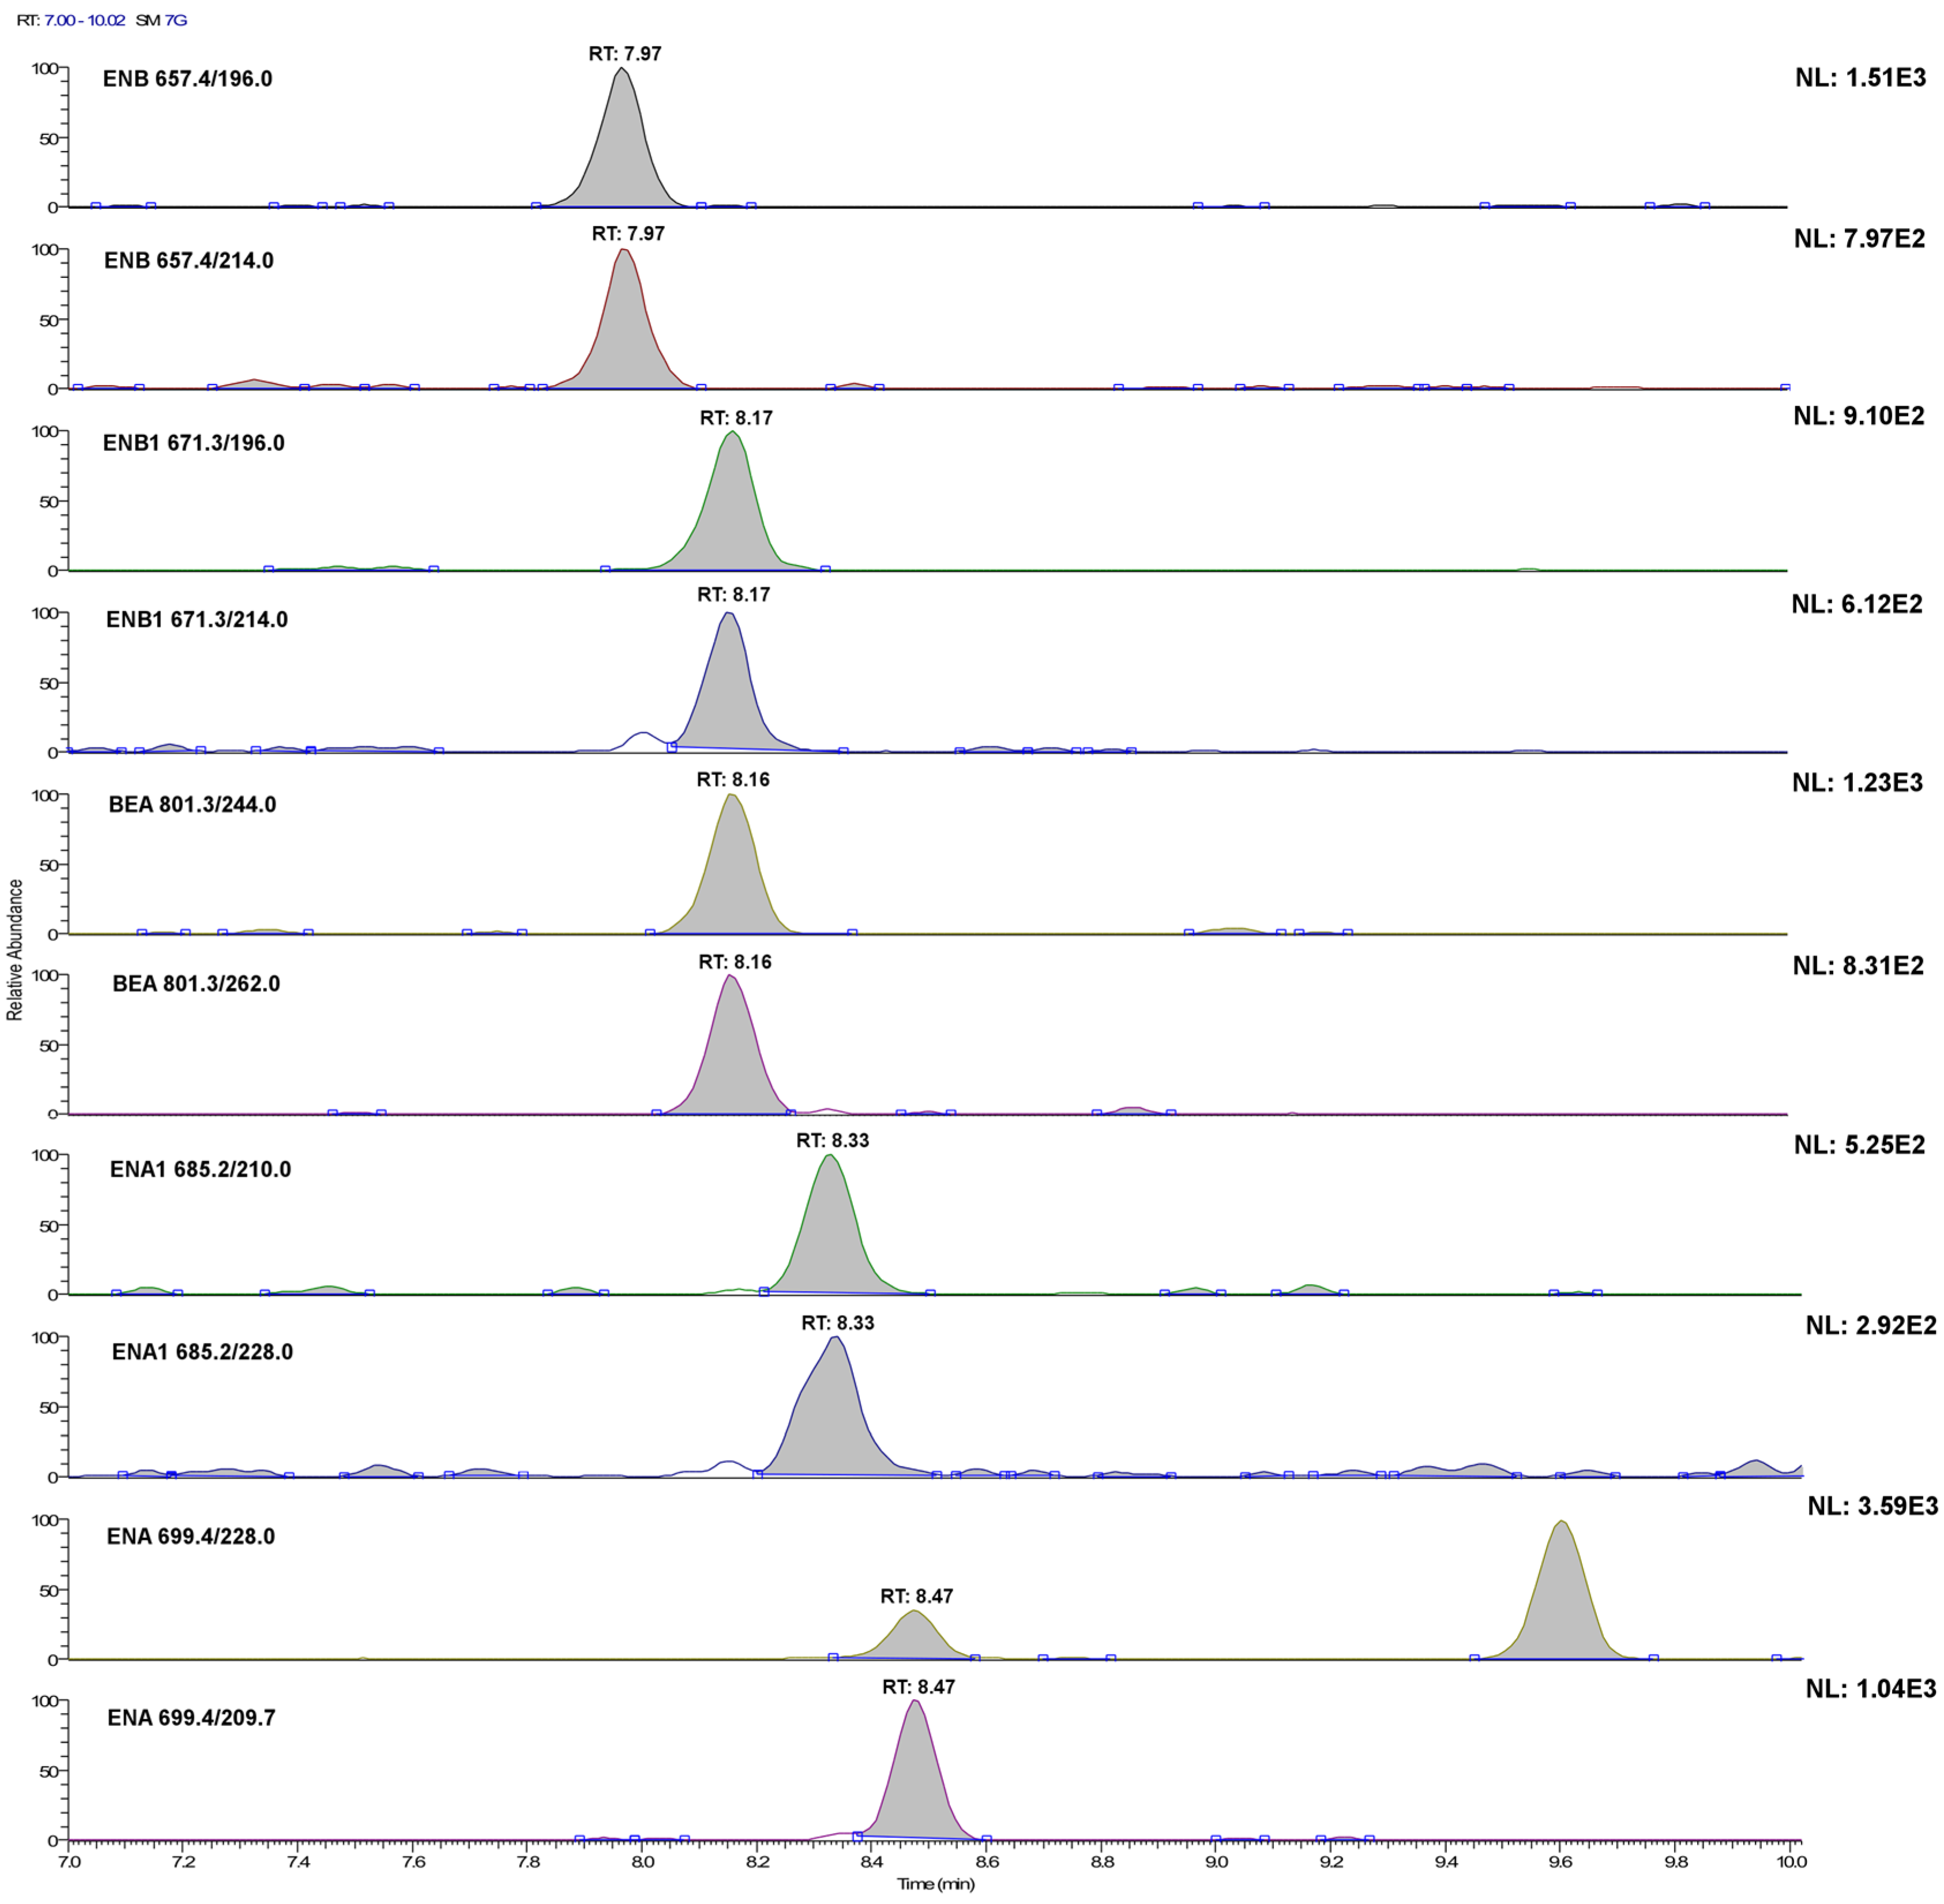
2.1. LC-MS/MS Optimization

| Mycotoxin (Abbreviation) | Retention Time (min) | Precursor Ion [M+NH4]+ (m/z) | Product Ion (m/z) | Collision Energy (V) | S-Lens (V) |
|---|---|---|---|---|---|
| Enniatin A (ENA) | 8.48 | 699.4 | 209.7 | 35 | 148 |
| 228.0 | 36 | ||||
| Enniatin A1 (ENA1) | 8.34 | 685.2 | 210.0 | 33 | 139 |
| 228.0 | 33 | ||||
| Enniatin B (ENB) | 7.97 | 657.4 | 196.0 | 32 | 137 |
| 214.0 | 33 | ||||
| Enniatin B1 (ENB1) | 8.16 | 671.3 | 196.0 | 33 | 148 |
| 214.0 | 34 | ||||
| Beauvericin (BEA) | 8.17 | 801.3 | 244.0 | 36 | 172 |
| 262.0 | 34 |
2.2. Optimization of the Extraction Method
2.2.1. Urine
| Mycotoxin | Recovery ± RSD a (%) | |||
|---|---|---|---|---|
| Urine | Plasma | |||
| This method | SALLE b [27] | This method | Deproteinization with ACN [17] | |
| ENA | 92 ± 6 | 85 ± 7 | 99 ± 7 | 77 ± 15 |
| ENA1 | 80 ± 10 | 64 ± 4 | 90 ± 3 | 73 ± 14 |
| ENB | 82 ± 1 | 60 ± 9 | 97 ± 8 | 92 ± 7 |
| ENB1 | 95 ± 4 | 75 ± 5 | 76 ± 3 | 88 ± 6 |
| BEA | 87 ± 4 | 73 ± 11 | 103 ± 12 | 62 ± 13 |
2.2.2. Plasma
2.3. Method Performance
2.3.1. Linearity, and Process Efficiency
| Mycotoxin | R2 | Slope of Regression Line (RSD a, %) | Process Efficiency (%) b | |||||
|---|---|---|---|---|---|---|---|---|
| Solvent | Urine | Plasma | Solvent | Urine | Plasma | Urine | Plasma | |
| ENA | 0.998 | 0.999 | 0.993 | 112.4 (1.7) | 112.5 (2.3) | 116.3 (5.7) | 100.0 | 103.5 |
| ENA1 | 0.995 | 0.991 | 0.994 | 25.6 (1.4) | 26.7 (3.2) | 27.9 (5.6) | 108.2 | 109.0 |
| ENB | 0.998 | 0.993 | 0.994 | 77.8 (2.0) | 77.7 (2.1) | 77.6 (4.8) | 99.9 | 99.7 |
| ENB1 | 0.991 | 0.995 | 0.997 | 65.7 (1.7) | 53.7 (2.1) | 67.0 (3.8) | 81.7 | 102.0 |
| BEA | 0.999 | 0.998 | 0.999 | 118.2 (1.0) | 100.0 (2.4) | 129.4 (2.4) | 84.6 | 109.5 |
2.3.2. Detection and Quantification Limits
| Mycotoxin | Instrumental | Urine | Plasma | |||||||||
|---|---|---|---|---|---|---|---|---|---|---|---|---|
| ILOQ (pg) | ILOD (pg) | MQL (ng·L−1) | MDL (ng·L−1) | MQL (ng·L−1) | MDL (ng·L−1) | |||||||
| Ext | Exp | Ext | Exp | Ext | Exp | Ext | Exp | Ext | Exp | Ext | Exp | |
| ENA | 0.1 | 0.2 | 0.03 | 0.2 | 25 | 10 | 8 | 10 | 65 | 40 | 20 | 40 |
| ENA1 | 0.5 | 0.1 | 0.20 | 0.05 | 35 | 10 | 10 | 5 | 65 | 20 | 20 | 10 |
| ENB | 0.1 | 0.1 | 0.04 | 0.05 | 15 | 5 | 5 | 2.5 | 55 | 20 | 15 | 10 |
| ENB1 | 0.1 | 0.05 | 0.03 | 0.05 | 15 | 20 | 5 | 20 | 45 | 20 | 15 | 20 |
| BEA | 0.3 | 0.2 | 0.10 | 0.05 | 30 | 10 | 8 | 5 | 30 | 40 | 10 | 20 |


2.3.3. Trueness and Precision
| Mycotoxin | Urine | Plasma | ||||||||||
|---|---|---|---|---|---|---|---|---|---|---|---|---|
| Trueness % (RSD a) | Trueness % (RSD a) | |||||||||||
| 1× MQL | 2.5× MQL | 10× MQL | 1× MQL | 2.5× MQL | 10× MQL | |||||||
| Intra-day | Inter-day | Intra-day | Inter-day | Intra-day | Inter-day | Intra-day | Inter-day | Intra-day | Inter-day | Intra-day | Inter-day | |
| ENA | 92 ± 12 | 88 ± 15 | 109 ± 8 | 90 ± 9 | 102 ± 1 | 96 ± 14 | 99 ± 17 | 101 ± 15 | 120 ± 6 | 112 ± 11 | 95 ± 4 | 99 ± 11 |
| ENA1 | 85 ± 10 | 98 ± 8 | 96 ± 7 | 96 ± 11 | 91 ± 6 | 94 ± 8 | 90 ± 13 | 92 ± 16 | 114 ± 10 | 118 ± 14 | 94 ± 6 | 93 ± 10 |
| ENB | 87 ± 7 | 110 ± 17 | 89 ± 13 | 90 ± 9 | 98 ± 1 | 102 ± 10 | 97 ± 18 | 95 ± 21 | 109 ± 12 | 117 ± 14 | 110 ± 8 | 105 ± 9 |
| ENB1 | 101 ± 14 | 102 ± 11 | 89 ± 6 | 95 ± 8 | 103 ± 4 | 90 ± 12 | 106 ± 13 | 87 ± 14 | 112 ± 9 | 115 ± 9 | 95 ± 9 | 98 ± 9 |
| BEA | 93 ± 12 | 97 ± 14 | 105 ± 10 | 98 ± 10 | 101 ± 3 | 87 ± 12 | 103 ± 12 | 91 ± 12 | 106 ± 10 | 114 ± 12 | 96 ± 10 | 92 ± 11 |
2.4. Application to Samples
3. Experimental Section
3.1. Chemicals and Reagents
3.2. Sampling
3.3. Sample Preparation
3.3.1. Sample Pretreatments
3.3.2. Extraction Method
3.4. LC-MS/MS Analysis
3.5. Method Performance
3.5.1. Linearity
3.5.2. Recovery and Process Efficiency
3.5.3. Detection and Quantification Limits
3.5.4. Trueness and Precision
4. Conclusions
Acknowledgments
Author Contributions
Conflicts of Interest
References
- Marin, S.; Ramos, A.J.; Cano-Sancho, G.; Sanchis, V. Mycotoxins: Occurrence, toxicology, and exposure assessment. Food Chem. Toxicol. 2013, 60, 218–237. [Google Scholar] [CrossRef] [PubMed]
- Capriotti, A.L.; Caruso, G.; Cavaliere, C.; Foglia, P.; Samperi, R.; Laganà, A. Multiclass mycotoxin analysis in food, environmental and biological matrices with chromatography/mass spectrometry. Mass Spectrom. Rev. 2012, 31, 466–503. [Google Scholar] [CrossRef] [PubMed]
- European Commission. Opinion of the scientific committee on Food on Fusarium toxins. Part 6: Group evaluation of T-2 toxin, HT-2 toxin, nivalenol and deoxynivalenol, SCF/CS/CNTM/MYC/27 Final. Scientific Committee of Food. E.C. In Presented at Health and Consumer Protection Directorate-General, Brussels, Belgium, 2002.
- Commission Regulation (EC) No 1881/2006. Setting maximum levels for certain contaminants in foodstuffs (Last amendment on 01/09/2014). Off. J. Eur. Commun. 2006, L364, 5–24.
- Milićević, D.R.; Škrinjar, M.; Baltić, T. Real and perceived risks for mycotoxin contamination in foods and feeds: Challenges for food safety control. Toxins 2010, 2, 572–592. [Google Scholar] [CrossRef] [PubMed]
- Santini, A.; Meca, G.; Uhlig, S.; Ritieni, A. Fusaproliferin, beauvericin and enniatins: Occurrence in food—A review. World Mycotoxin 2012, 5, 71–81. [Google Scholar] [CrossRef]
- Fornelli, F.; Minervini, F.; Logrieco, A. Cytotoxicity of fungal metabolites to lepidopteran (Spodoptera frugiperda) cell line SF-9. J. Invertebr. Pathol. 2004, 85, 74–79. [Google Scholar] [CrossRef] [PubMed]
- Behm, C.; Degen, G.H.; Föllmann, W. The Fusarium toxin enniatin B exerts no genotoxic activity, but pronounced cytotoxicity in vitro. Mol. Nutr. Food Res. 2009, 53, 423–430. [Google Scholar] [CrossRef] [PubMed]
- Prosperini, A.; Font, G.; Ruiz, M.J. Interaction effects of Fusarium enniatins (A, A1, B and B1) combinations on in vitro cytotoxicity of Caco-2 cells. Toxicol. In Vitro 2014, 28, 88–94. [Google Scholar] [CrossRef] [PubMed]
- Jestoi, M. Emerging Fusarium mycotoxins fusaproliferin, beauvericin, enniatins, and moniliformin—A review. Crit. Rev. Food Sci. Nutr. 2008, 48, 21–49. [Google Scholar] [CrossRef] [PubMed]
- Manyes, L.; Escrivá, L.; Serrano, A.B.; Rodríguez-Carrasco, Y.; Tolosa, J.; Meca, G.; Font, G. A preliminary study in Wistar rats with enniatin A contaminated feed. Toxicol. Mech. Methods 2014, 24, 179–190. [Google Scholar] [CrossRef] [PubMed]
- Serrano, A.B.; Font, G.; Mañes, J.; Ferrer, E. Emerging Fusarium mycotoxins in organic and conventional pasta. Food Chem. Toxicol. 2013, 51, 259–266. [Google Scholar] [CrossRef] [PubMed]
- Tolosa, J.; Font, G.; Mañes, J.; Ferrer, E. Nuts and dried fruits: Natural occurrence of emerging Fusarium mycotoxins. Food Control 2013, 33, 215–220. [Google Scholar] [CrossRef]
- Capriotti, A.L.; Cavaliere, C.; Foglia, P.; Samperi, R.; Stampachiacchiere, S.; Ventura, S.; Laganà, A. Multiclass analysis of mycotoxins in biscuits by high performance liquid chromatography-tandem mass spectrometry. Comparison of different extraction procedures. J. Chromatogr. A 2014, 1343, 69–78. [Google Scholar] [CrossRef] [PubMed]
- Alkadri, D.; Rubert, J.; Prodi, A.; Pisi, A.; Manes, J.; Soler, C. Natural co-occurrence of mycotoxins in wheat grains from Italy and Syria. Food Chem. 2014, 157, 111–118. [Google Scholar] [CrossRef] [PubMed]
- EFSA CONTAM Panel (EFSA Panel of Contaminants in the Food Chain) Scientific Opinion on the risks to human and animal health related to the presence of beauverivin and enniatins in food and feed. EFSA J. 2014, 12, 3802. [CrossRef]
- Devreese, M.; De Baere, S.; De Backer, P.; Croubels, S. Quantitative determination of the Fusarium mycotoxins beauvericin, enniatin A, A1, B and B1 in pig plasma using high performance liquid chromatography-tandem mass spectrometry. Talanta 2013, 106, 212–219. [Google Scholar] [CrossRef] [PubMed]
- Ivanova, L.; Fæste, C.K.; Uhlig, S. In vitro phase I metabolism of the depsipeptide enniatin B. Anal. Bioanal. Chem. 2011, 400, 2889–2901. [Google Scholar] [CrossRef] [PubMed]
- Sulyok, M.; Berthiller, F.; Krska, R.; Schuhmacher, R. Development and validation of a liquid chromatography/tandem mass spectrometric method for the determination of 39 mycotoxins in wheat and maize. Rapid Commun. Mass Spectrom. 2006, 20, 2649–2659. [Google Scholar] [CrossRef] [PubMed]
- Serrano, A.B.; Font, G.; Mañes, J.; Ferrer, E. Comparative assessment of three extraction procedures for determination of emerging Fusarium mycotoxins in pasta by LC-MS/MS. Food Control 2013, 32, 105–114. [Google Scholar] [CrossRef]
- Krska, R.; Schubert-Ullrich, P.; Molinelli, A.; Sulyok, M.; Macdonald, S.; Crews, C. Mycotoxin analysis: An update. Food Addit. Contam. 2008, 25, 152–163. [Google Scholar] [CrossRef] [PubMed]
- Juan, C.; Manyes, L.; Font, G.; Juan-García, A. Evaluation of immunologic effect of Enniatin A and quantitative determination in feces, urine and serum on treated Wistar rats. Toxicon 2014, 87, 45–53. [Google Scholar] [CrossRef] [PubMed]
- Cavaliere, C.; Foglia, P.; Pastorini, E.; Samperi, R.; Laganà, A. Liquid chromatography/tandem mass spectrometric confirmatory method for determining aflatoxin M1 in cow milk: Comparison between electrospray and atmospheric pressure photoionization sources. J. Chromatogr. A 2006, 1101, 69–78. [Google Scholar] [CrossRef] [PubMed]
- Jestoi, M.; Rokka, M.; Rizzo, A.; Peltonen, K. Determination of Fusarium mycotoxins Beauvericin and Enniatins with Liquid Chromatography-Tandem Mass Spectrometry (LC-MS/MS). J. Liq. Chromatogr. Relat. Technol. 2005, 28, 369–381. [Google Scholar] [CrossRef]
- Kameník, Z.; Hadacek, F.; Marečková, M.; Ulanova, D.; Kopecký, J.; Chobot, V.; Plháčková, K.; Olšovská, J. Ultra-high-performance liquid chromatography fingerprinting method for chemical screening of metabolites in cultivation broth. J. Chromatogr. A 2010, 1217, 8016–8025. [Google Scholar] [CrossRef] [PubMed]
- Cavaliere, C.; Foglia, P.; Guarino, C.; Nazzari, M.; Samperi, R.; Laganà, A. A sensitive confirmatory method for aflatoxins in maize based on liquid chromatography/electrospray ionization tandem mass spectrometry. Rapid Commun. Mass Spectrom. 2007, 21, 550–556. [Google Scholar] [CrossRef] [PubMed]
- Song, S.; Ediage, E.N.; Wu, A.; De Saeger, S. Development and application of salting-out assisted liquid/liquid extraction for multi-mycotoxin biomarkers analysis in pig urine with high performance liquid chromatography/tandem mass spectrometry. J. Chromatogr. A 2013, 1292, 111–120. [Google Scholar] [CrossRef] [PubMed]
- Matuszewski, B.K.; Constanzer, M.L.; Chavez-Eng, C.M. Strategies for the assessment of matrix effect in quantitative bioanalytical methods based on HPLC-MS/MS. Anal. Chem. 2003, 75, 3019–3030. [Google Scholar] [CrossRef] [PubMed]
- Commission Decision No 2002/657/EC. Implementing Council Directive 96/23/EC concerning the performance of analytical methods and the interpretation of results. Off. J. Eur. Commun. 2002, L221, 8–36.
- Williams, J.R. The declaration of helsinki and public health bull. World Health Org. 2008, 86, 650–651. [Google Scholar] [CrossRef]
© 2015 by the authors; licensee MDPI, Basel, Switzerland. This article is an open access article distributed under the terms and conditions of the Creative Commons Attribution license (http://creativecommons.org/licenses/by/4.0/).
Share and Cite
Serrano, A.B.; Capriotti, A.L.; Cavaliere, C.; Piovesana, S.; Samperi, R.; Ventura, S.; Laganà, A. Development of a Rapid LC-MS/MS Method for the Determination of Emerging Fusarium mycotoxins Enniatins and Beauvericin in Human Biological Fluids. Toxins 2015, 7, 3554-3571. https://doi.org/10.3390/toxins7093554
Serrano AB, Capriotti AL, Cavaliere C, Piovesana S, Samperi R, Ventura S, Laganà A. Development of a Rapid LC-MS/MS Method for the Determination of Emerging Fusarium mycotoxins Enniatins and Beauvericin in Human Biological Fluids. Toxins. 2015; 7(9):3554-3571. https://doi.org/10.3390/toxins7093554
Chicago/Turabian StyleSerrano, Ana Belén, Anna Laura Capriotti, Chiara Cavaliere, Susy Piovesana, Roberto Samperi, Salvatore Ventura, and Aldo Laganà. 2015. "Development of a Rapid LC-MS/MS Method for the Determination of Emerging Fusarium mycotoxins Enniatins and Beauvericin in Human Biological Fluids" Toxins 7, no. 9: 3554-3571. https://doi.org/10.3390/toxins7093554