2.1. IS and IAA Induced PS Exposure and MPs Release of RBCs
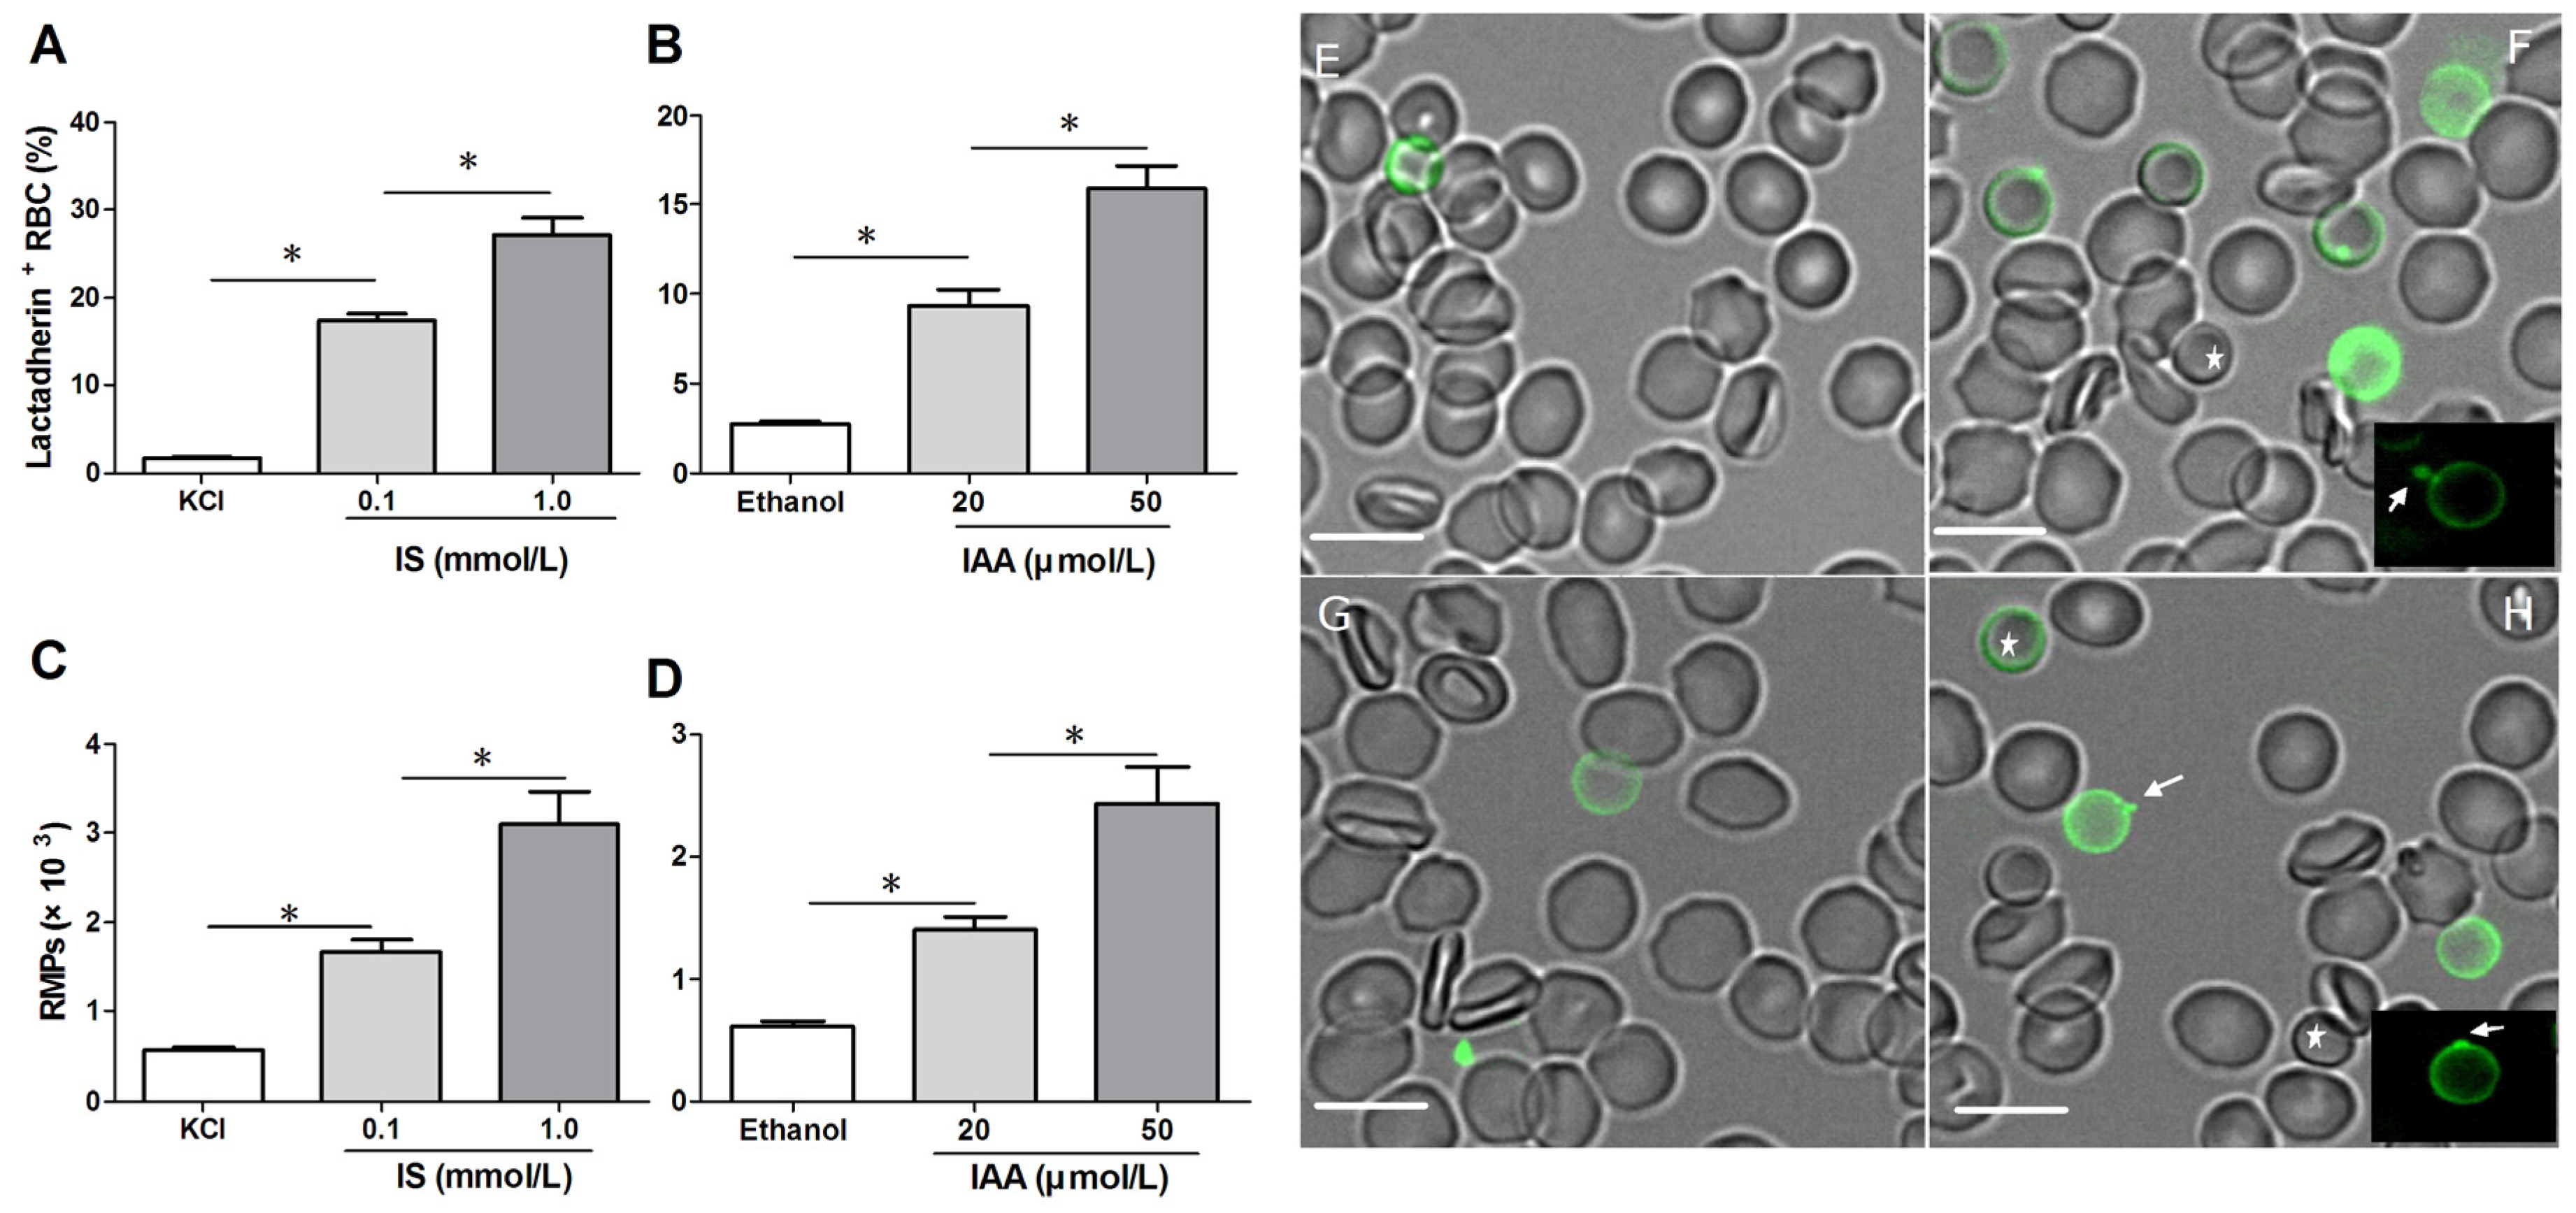
To confirm RBC damage or eryptosis in IS and IAA, we utilized Alexa Fluor 488-lactadherin to detect PS exposure on RBCs and RMPs release by flow cytometer. After 24 h of incubation at the mean and maximal concentrations of IS and IAA found in chronic kidney disease (CKD) patients, we found that the percentage of lactadherin
+ RBC in IS (0.1 mM) was significantly higher than that in control (
p < 0.001), with more lactadherin
+ RBC in maximal levels of IS (1 mM) than that in median levels of IS (0.1 mM) (
p < 0.001). IAA also induced a significant increase in PS exposure after 24 h of incubation (
p < 0.001
vs. control), and which paralleled the increasing IAA concentrations (
Figure 1A,B). In another time-response experiment, IS (1 mM) or IAA (50 μM) induced a significant increase in PS exposure after 4 h of incubation, and increased rapidly during the first 24 h. From 24 h to 48 h, the proportion of lactadherin
+ RBC continued to increase slowly, while a control group was almost unchanged during 48 h (
Figure S1).
At the same time, we analyzed RMPs shedding by flow cytometry. The level of RMPs obtained with IS or IAA is higher than those obtained with control (KCl for IS, ethanol for IAA), and these levels paralleled with uremic solutes concentrate (
Figure 1C,D).
To visually identify PS on the outer membrane of RBCs and RMPs generation, RBCs were incubated with Alexa Fluor 488-lactadherin and imaged on a confocal microscopy. As shown in
Figure 1F,H, partly RBCs exhibited volume reduction from normal discocytic shapes and changed into spherocytes with strong green fluorescence stained by lactadherin on the outer membrane and accompanying vesiculation formation. IS or IAA treatment induced typical MPs generation (the arrows indicate RMPs). Only very little staining by fluorescence-labeled lactadherin could be detected on control RBC (
Figure 1E,G), which is in agreement with the findings presented in the flow cytometry measurements.
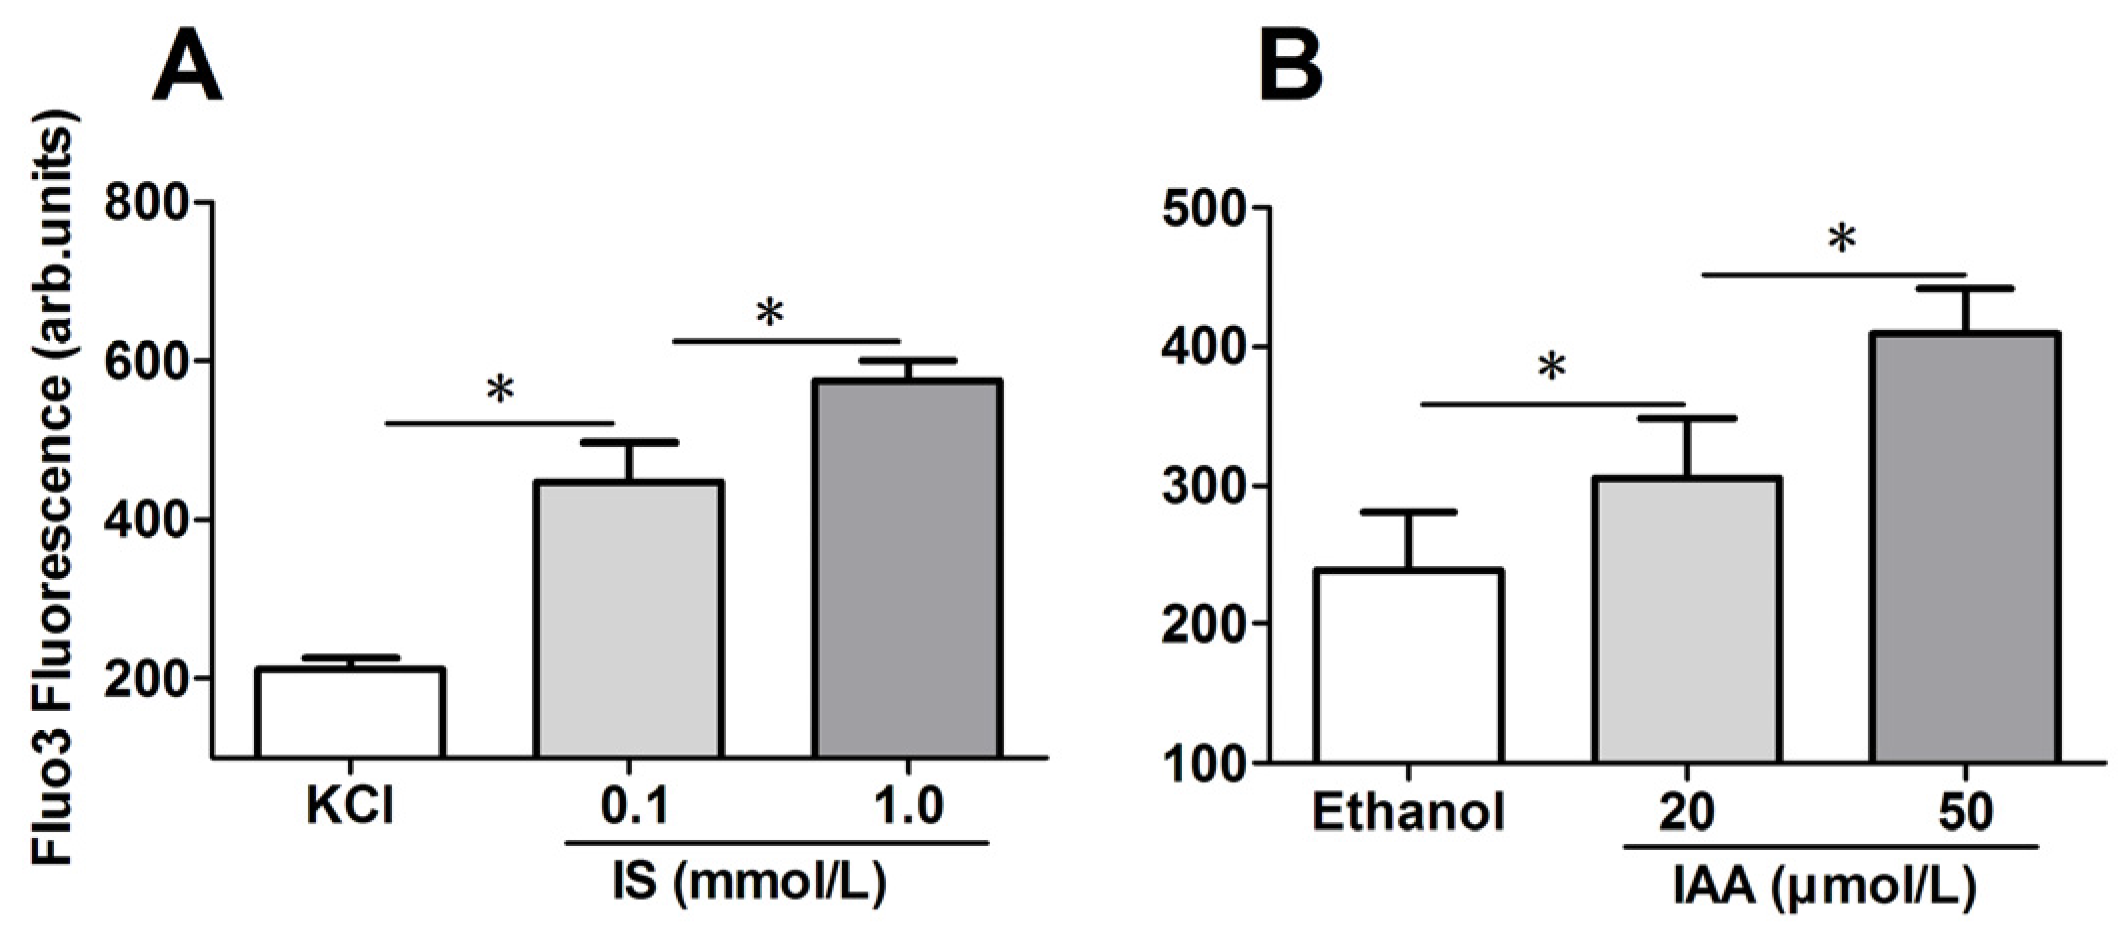
2.2. Role of Indolic Uremic Solutes on Erythrocyte Cytosolic Ca2+ Concentration
To explore the mechanism responsible for the PS exposure of RBCs in indolic uremic solutes, further experiments were performed to test cytosolic Ca
2+ concentration ([Ca
2+]) using flow cytometry and results are represented by Ca
2+ dependent fluorescence intensity. As illustrated in
Figure 2A,B, in comparison to that in control conditions, median levels of IS and IAA induced a significant increase of erythrocyte cytosolic [Ca
2+] after 24 h of incubation. Furthermore, there was a significant increase of [Ca
2+] in maximal levels of IS (1 mM) and IAA (50 μM) than that in median uremic concentration, respectively (
p < 0.001).
Figure 1.
Detection of phosphatidylserine (PS) exposure and microparticles (MPs) release on red blood cells (RBCs). RBCs from healthy volunteers were incubated with median and maximal uremic concentration of IS and IAA for 24 h, respectively. KCl or ethanol was utilized as their respective controls. (A,B) Lactadherin-binding percent of RBCs was evaluated by flow cytometry. Results represent the mean ± SD of four independent experiments (* p < 0.001). (C,D) After indolic uremic solutes treatment for 24 h, MPs from 10 mL of the RBCs supernatants was harvested, and stained with Alexa Fluor 488-lactadherin and Alexa Fluor 647-CD235a. RMPs were defined as smaller than 1 μm and coexpression of lactadherin and CD235a. The number of RMP per μL culture medium was examined using flow cytometry. Results represent the mean ± SD of four independent experiments (* p < 0.001). PS exposure and MPs release on RBCs using confocal microscopy. RBCs were stained with Alexa Fluor 488-lactadherin in the dark at room temperature. RBC membrane displayed green fluorescence when labelled by Alexa Fluor 488-lactadherin. Few lactadherin staining was observed on RBCs cultured in KCl (E) or ethanol (G). Treatment of RBCs with 1.0 mM IS (F) or 50 μM IAA (H) for 24 h led to PS externalized to the outer membrane, vesicles released from the budding of cellular membranes. Arrows indicate MP generation (appeared green) on erythrocyte membranes, and the stars indicate spherocyte. Bars represent 10 μm. PS, phosphatidylserine; IS, Indoxyl sulfate; IAA, indoxyl-3-acetate acid; RBC, red blood cell, MPs, microparticles; RMPs, RBC derived MPs.
![Toxins 07 04390 g001]()
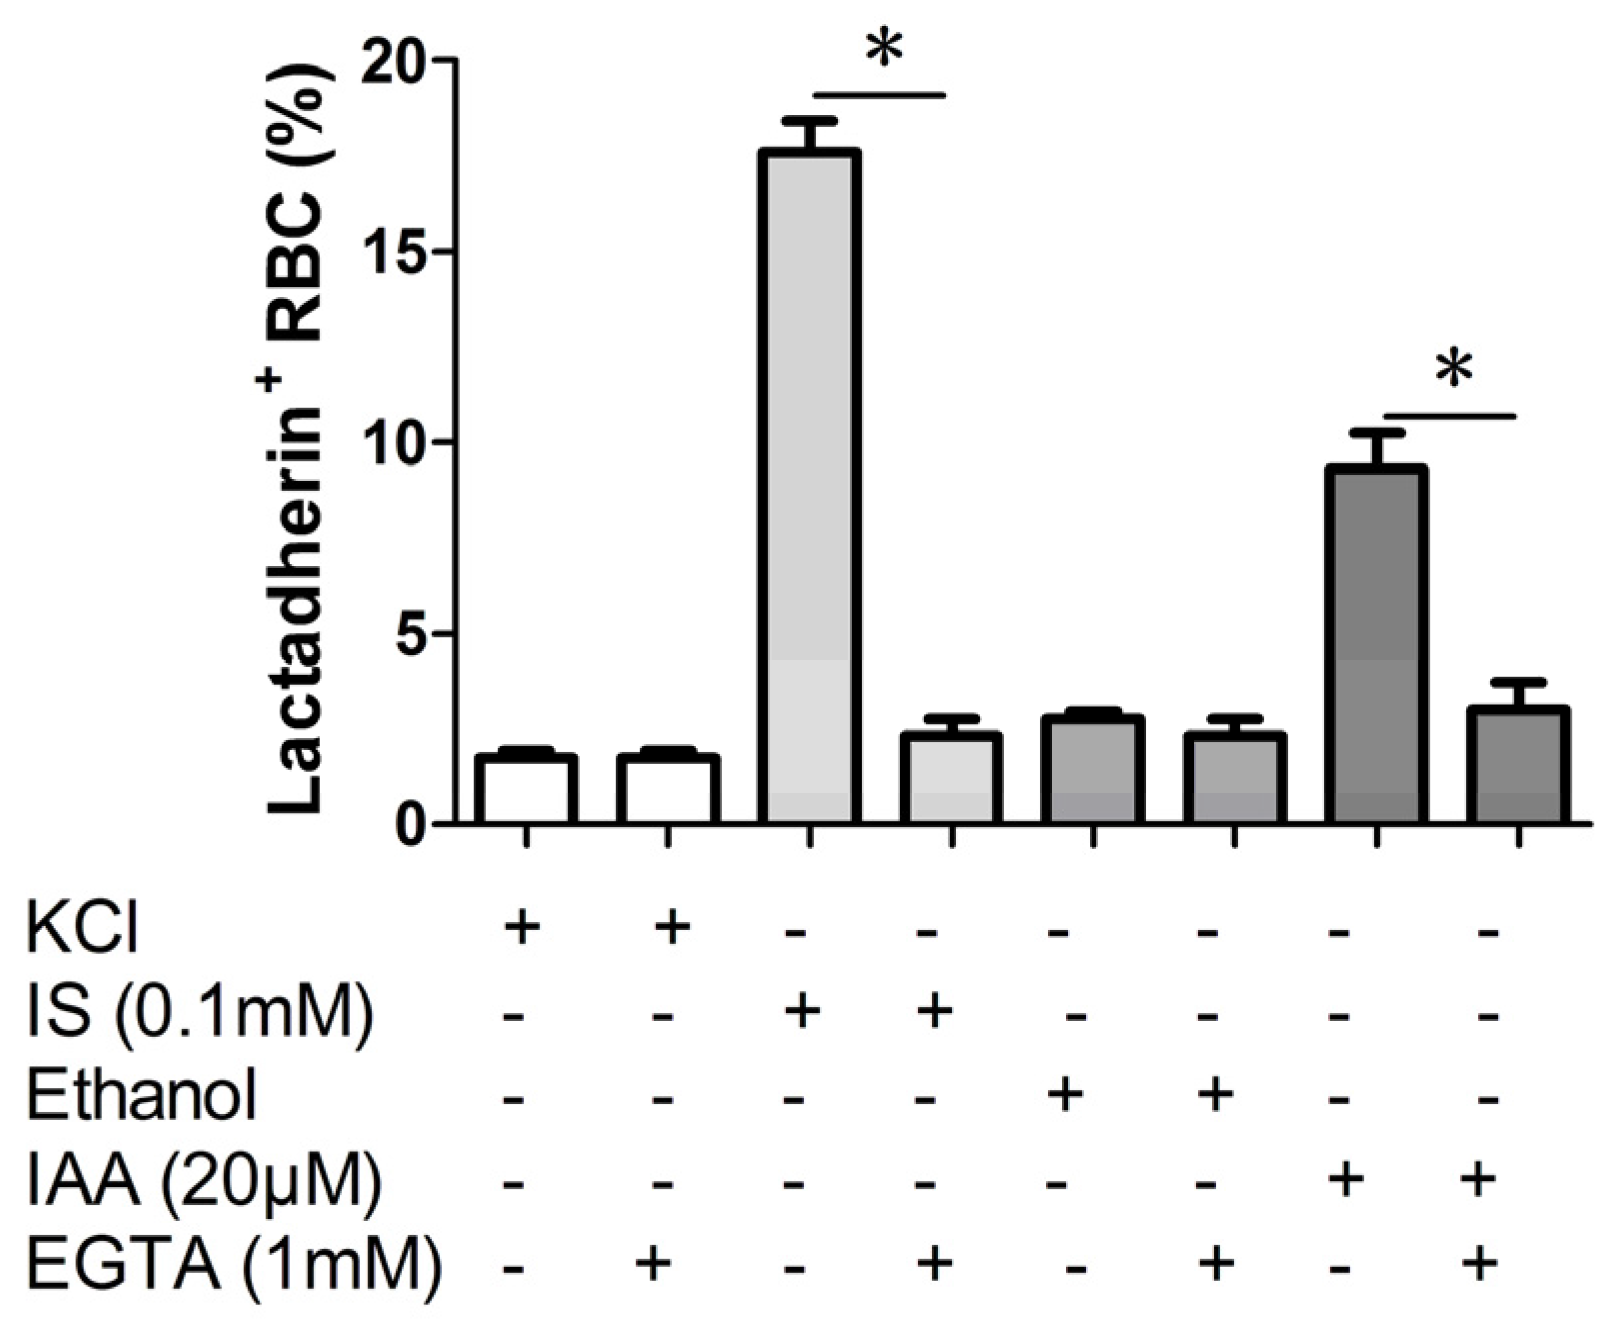
2.3. Effect of Ca2+ Withdrawal on IS and IAA Induced PS Exposure
In order to verify whether the PS exposure on erythrocyte by indolic uremic solutes was secondary to an increase of [Ca
2+], erythrocytes were exposed to IS (0.1 mM) and IAA (20 μM) for 24 h either in the presence of extracellular Ca
2+ (1 mM) or in the nominal absence of Ca
2+ and presence of the Ca
2+ chelator EGTA (1 mM). As shown in
Figure 3, the effect of IS and IAA on the increased PS exposure was virtually abolished in the absence of Ca
2+.
Figure 2.
Role of uremic solution on erythrocyte cytosolic Ca2+ concentration. Following exposure for 24 h to the different indicated concentration of indolic uremic solutes, erythrocytes were washed in Ringer solution and then loaded with Fluo 3/AM. Ca2+ dependent fluorescence intensity was measured with flow cytometry. The Fluo-3 mean fluorescence intensity (MFI) (arbitrary units) in erythrocytes exposed to culture media with indoxyl sulfate (IS) (A) and indoxyl-3-acetate acid (IAA) (B) was shown. Data are displayed as mean ± SD for triplicate samples of independent experiments, * indicate p < 0.001.
Figure 3.
Effect of Ca2+ withdrawal on IS and IAA induced PS exposure. The percentage of lactadherin binding erythrocytes after a 24 h treatment with IS (0.1 mM) or IAA (20 μM) in the presence and absence of EGTA (1 mM). KCl or ethanol was utilized as their respective controls. Data are displayed as mean ± SD for triplicate samples of independent experiments, * indicate p < 0.001.
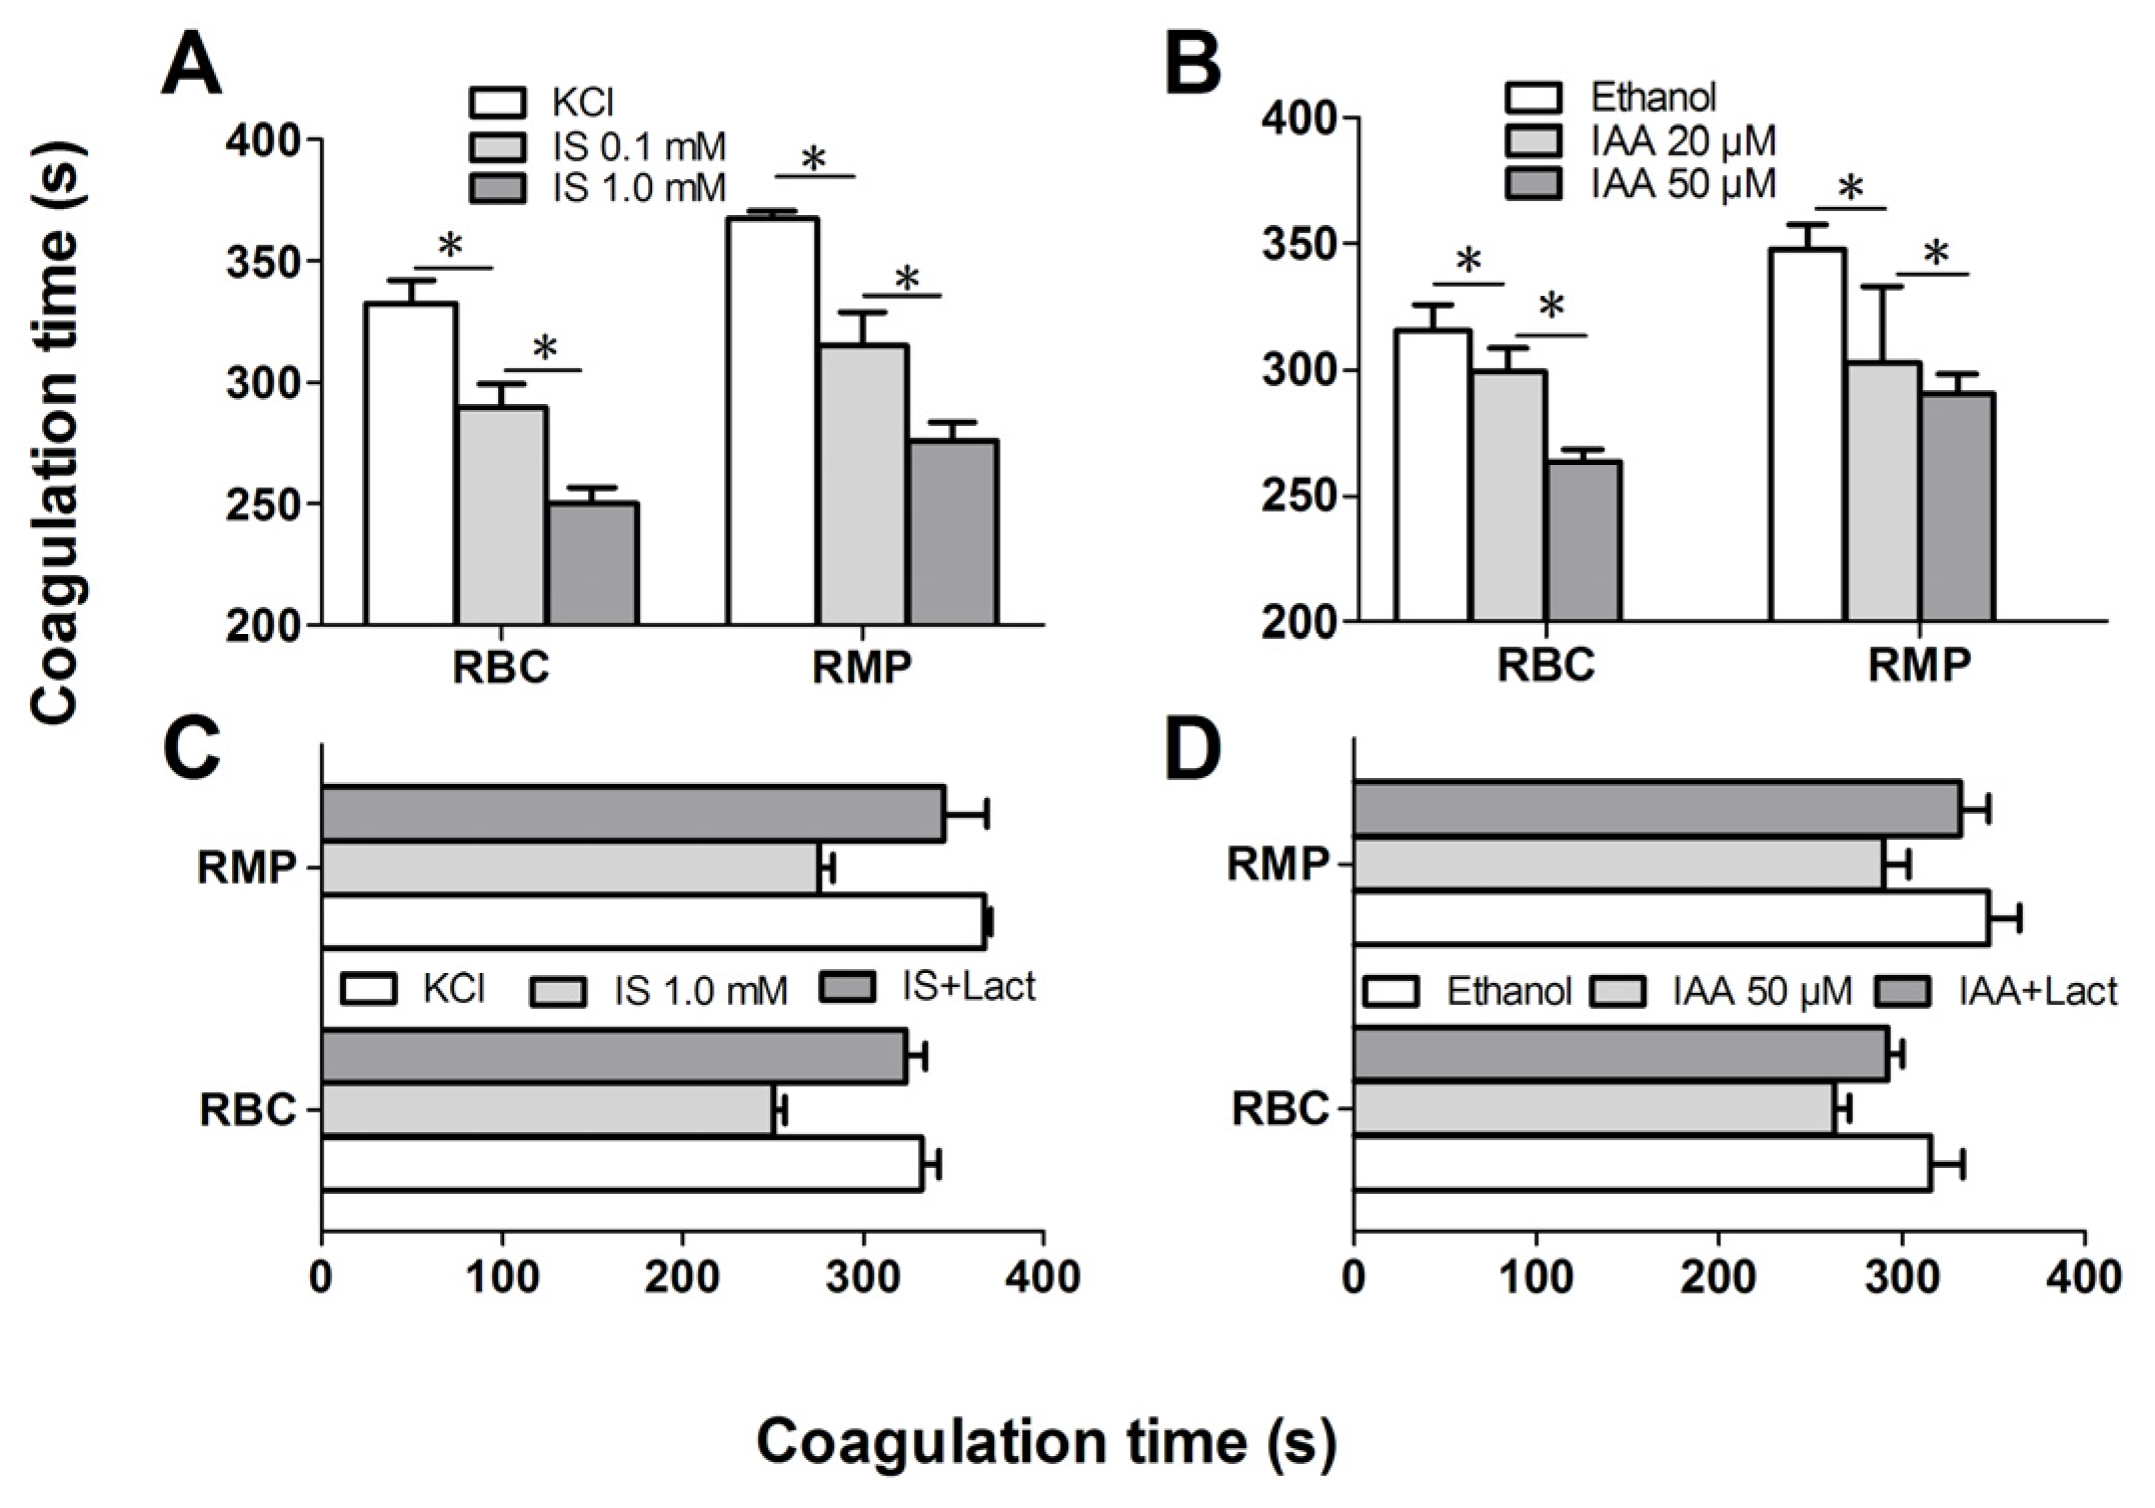
2.4. IS and IAA Increase the PCA of RBCs
Further experiments explored whether indolic uremic solutes triggered PCA of RBCs. We first evaluated the PCA of RBCs and RMPs by recalcification-time assays in the absence or presence of IS and IAA. Incremental PCA was exhibited by reductive clotting time. As shown in
Figure 4A,B, the coagulation time was significantly reduced in IS (0.1 mM) and IAA (20 μM) compared with RBCs in control medium (KCl for IS, ethanol for IAA) after 24 h of incubation (
p < 0.001), with shorter coagulation time in maximal levels of IS (1 mM) and IAA (50 μM) than in median uremic concentration (
p < 0.001). For RMPs, IS and IAA enhanced the PCA also in a concentration-dependent fashion. The reduction of coagulation time was in accord with the number of RMPs. In order to explore the relationship between PS exposure and PCA of RBCs that induced by IS or IAA, we performed coagulation inhibition assays. PCA of both RBCs and RMPs were almost completely inhibited by 128 nM lactadherin, as described in
Figure 4C,D.
Figure 4.
Recalcification time and inhibition assay. RBCs were treated with different concentrations of IS or IAA for 24 h, cells and RMPs were collected, respectively. KCl or ethanol was utilized as their respective controls. Coagulation times of 100 μL RBCs (1 × 10⁸) and RMPs (prepared from 10 mL of the RBCs supernatants) in each group of IS (A) and IAA (B) are shown. PCA of RBCs and RMPs that incubated in IS (C) and IAA (D) were detected in the absence or presence of 128 nM lactadherin. Data are displayed as mean ± SD for triplicate samples of independent experiments, * indicate p < 0.001.
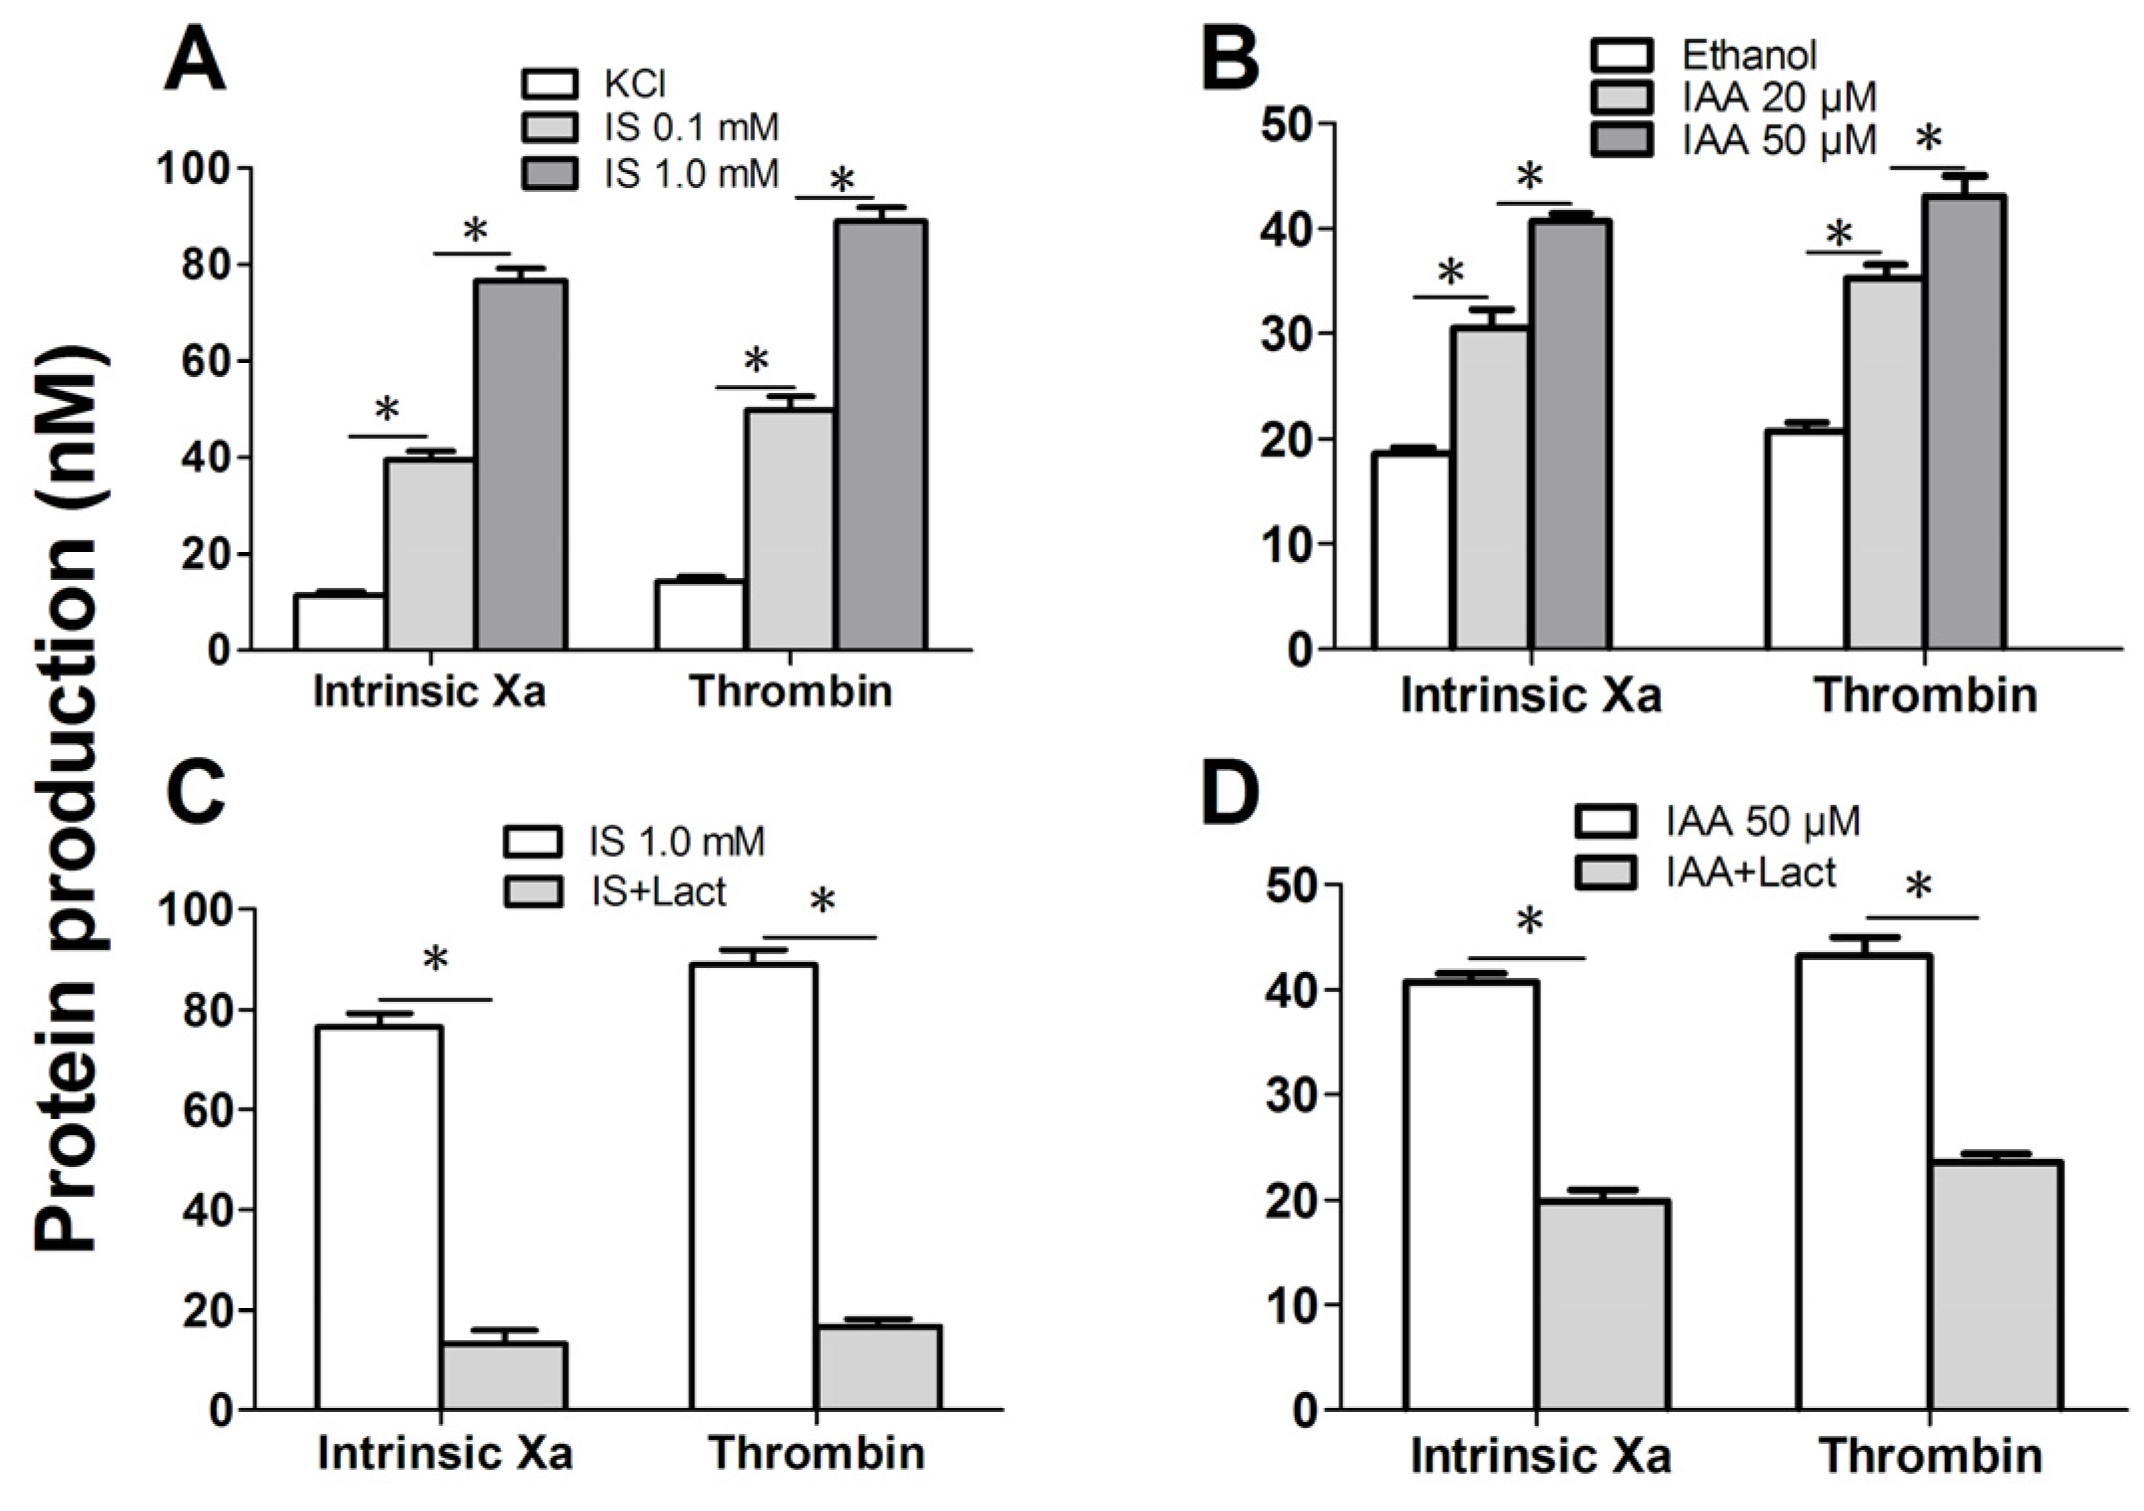
Figure 5.
Formation and inhibition assays of procoagulant enzyme complexes. After exposure for 24 h to the different indicated concentration of IS or IAA or KCl (control) or ethanol (control), erythrocytes were washed with Ringer solution. Intrinsic FXa formation was measured in the presence of FIXa, FVIII and thrombin. Thrombin generation was investigated in the presence of FXa and FVa. Intrinsic FXa and thrombin production of 105 RBCs in each group of IS (A) and IAA (B) are shown. The capacity of 128 nM lactadherin to block procoagulant enzyme complexes on RBCs that incubated in IS (C) and IAA (D) was evaluated. Results represent the mean ± SD for triplicate of independent experiments, * indicate p < 0.001.
We further investigated the capacity of RBCs to support intrinsic FXa and thrombin that contribute to PCA. As depicted in
Figure 5A, the production of the two procoagulant enzyme complexes was increased in median uremic concentration of IS (0.1 mM) compared with controls (
p < 0.001), and more higher in maximal levels of IS (1 mM). Similar results were obtained on IAA treated RBC, the rise of thrombin and intrinsic FXa production paralleled the increasing IAA concentration (
Figure 5B). Inhibition assays of FXa and prothrombinase productions were also performed. Over 90% of the production of two procoagulant enzyme complexes was inhibited by 128 nM lactadherin (
Figure 5C,D). Results from inhibition assays confirmed further that PS played a crucial role in the PCA of indolic uremic solutes treated RBCs.
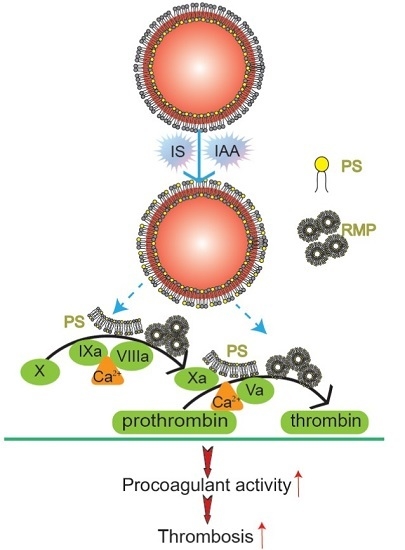
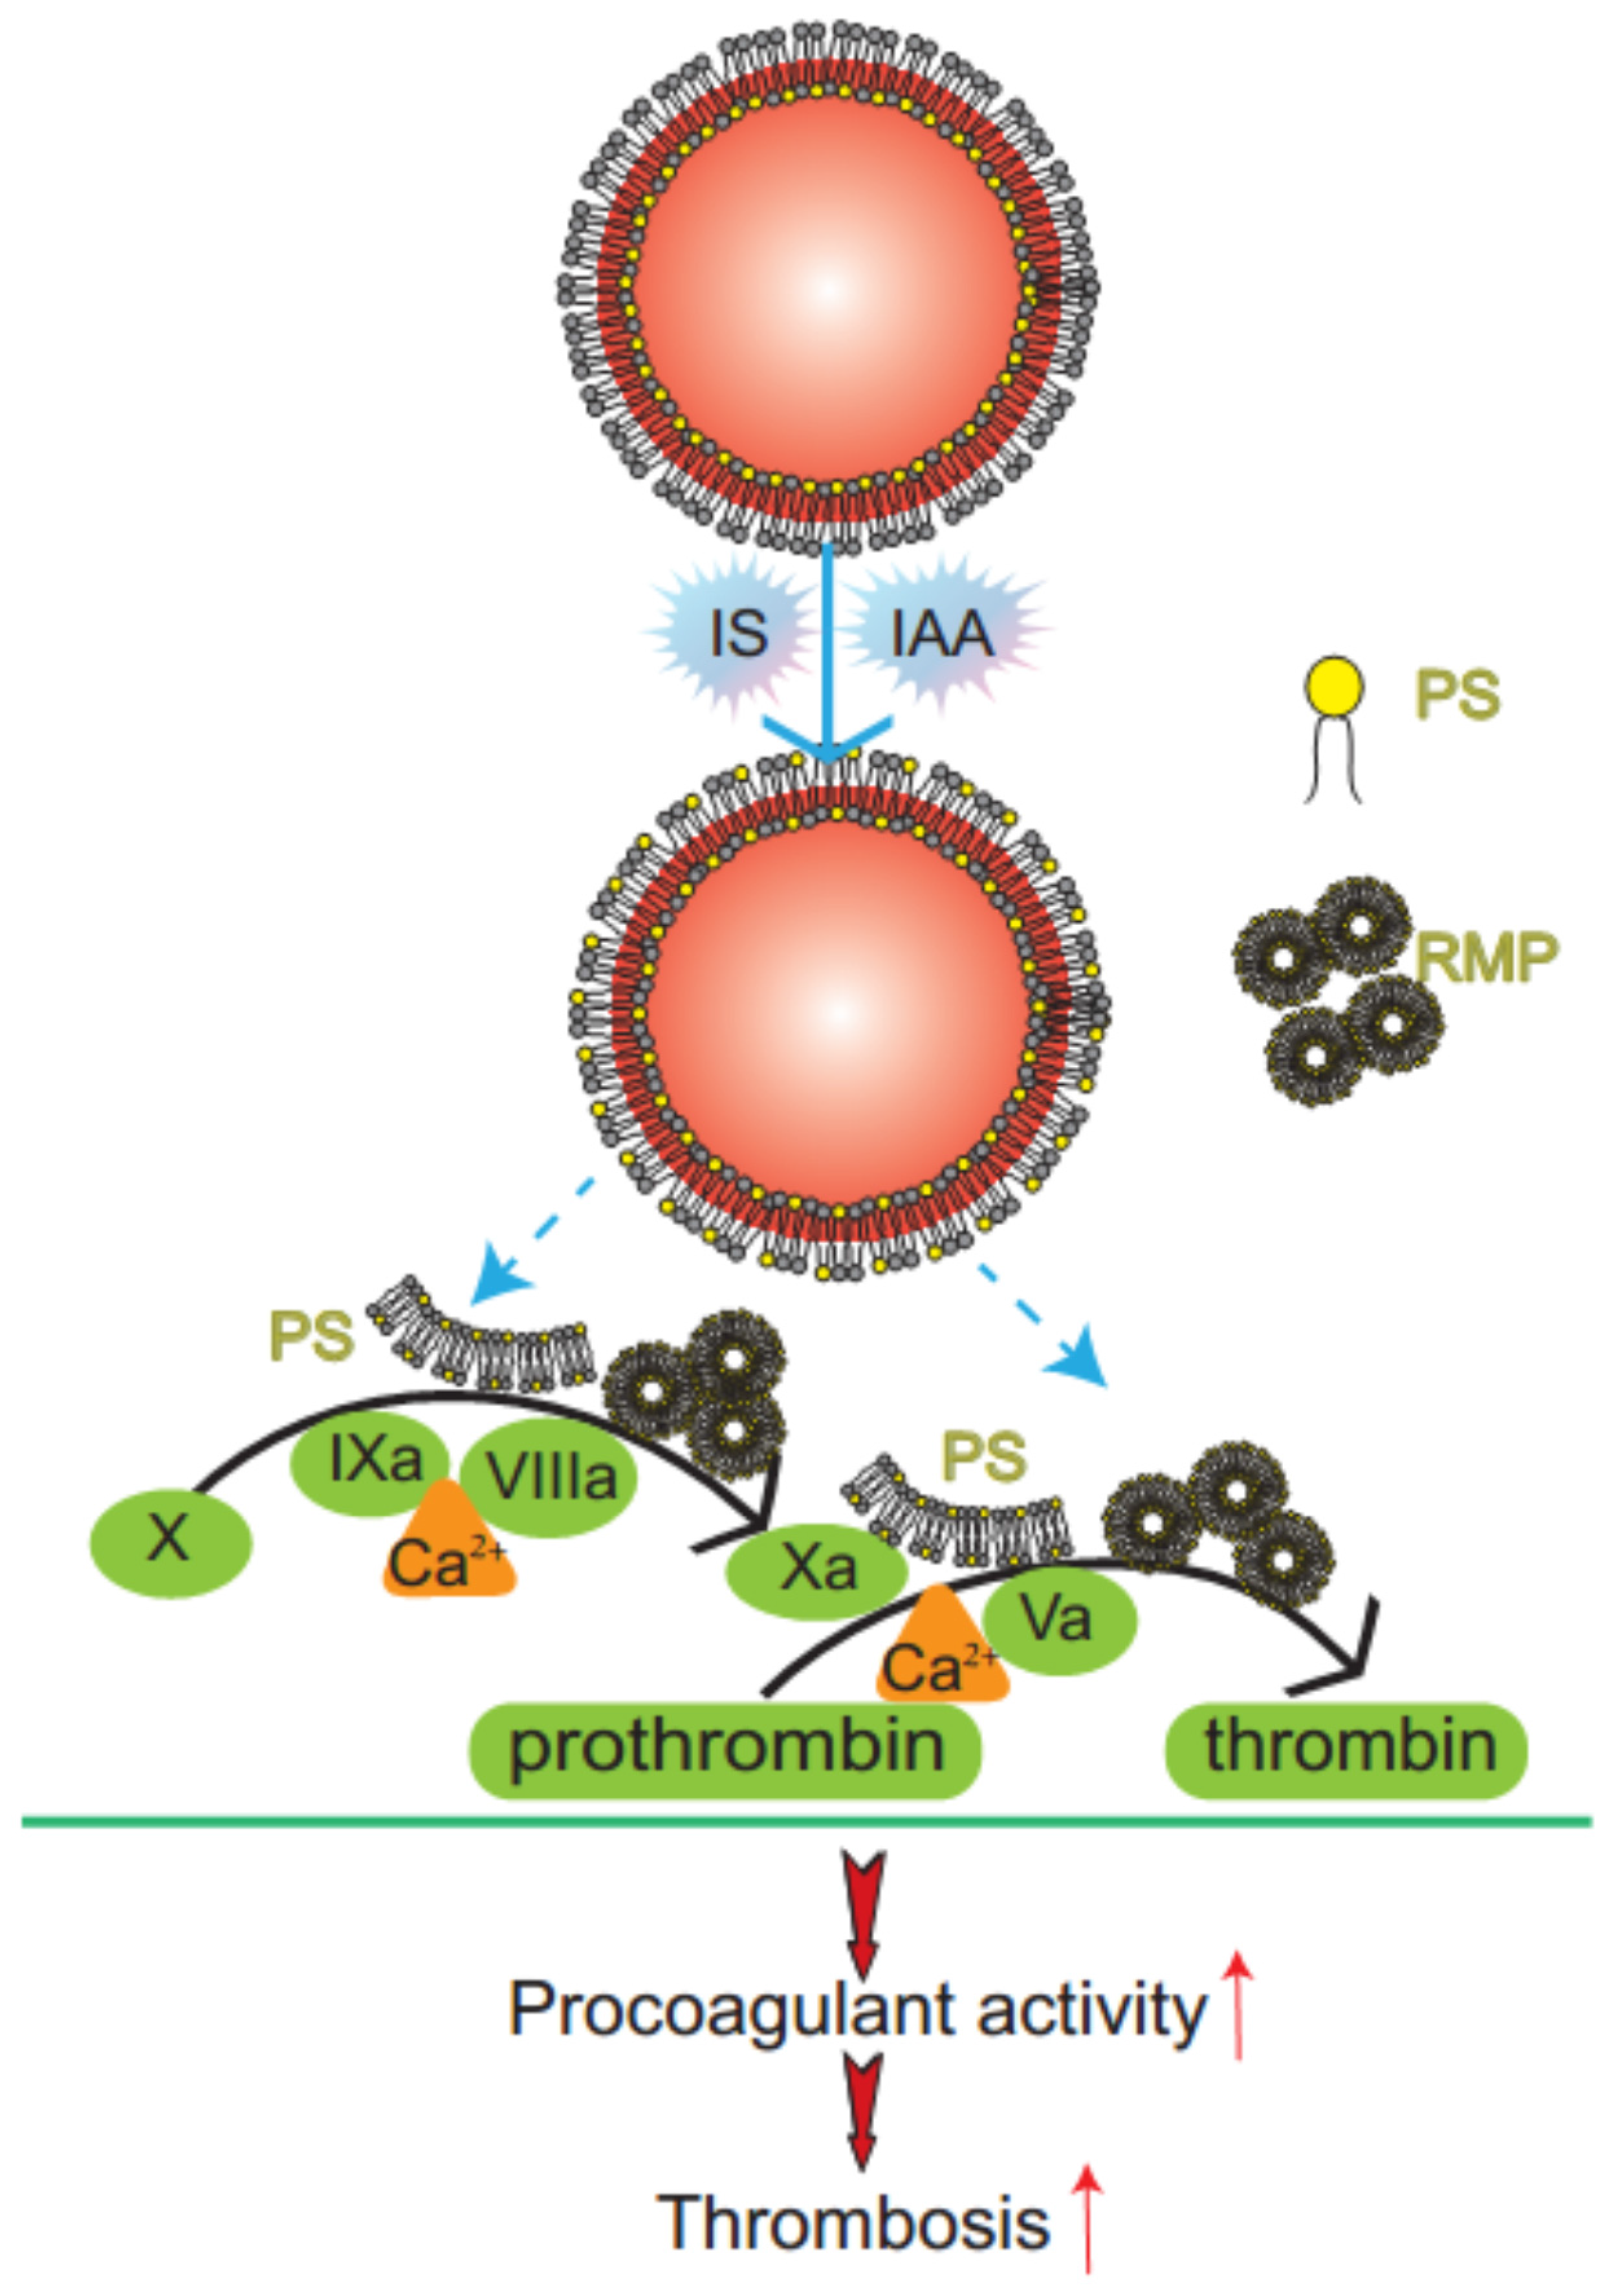
Figure 6.
Mechanism diagram of indolic solutes-induced PCA of erythrocytes. IS and IAA triggered PS externalized on the outer membrane of RBC and accompanied with RMPs shedding. Externalized PS on RBCs and PS-bearing RMPs provided binding sites for FXa and prothrombinase complexes, increased thrombin production and enhanced thrombus formation. PS, phosphatidylserine; RMPs, RBC derived MPs; IS, Indoxyl sulfate; IAA, indoxyl-3-acetate acid; PCA, procoagulant activity.
2.5. Discussion
In this study, we have found that indolic uremic solutes (IS or IAA) induced a procoagulant phenotype on RBC through increased PS exposure and RMP release. Exposed PS of RBCs and RMPs supports the assembly of intrinsic FXa and prothrombinase, moreover, blockade of PS with lactadherin inhibits activity of procoagulant enzyme complexes and consequently decreases the PCA of RBCs and RMPs (
Figure 6). Furthermore, we showed that PS translocation to the RBC surface within indolic uremic solutes is at least partially due to increased cytosolic Ca
2+ concentration.
The protein-bound uremic solutes IS and IAA are poorly removed by conventional dialysis and probably contribute to cardiovascular risk during the progression of chronic kidney disease (CKD) [
18]. RBCs could be a major concern because they make up more than 99% of the total blood cells and live for about 120 days in the circulation system and could be particularly deleterious in these uremic solutes. However, the role of erythrocyte in indolic uremic solutes-associated hemostatic disorders has not been fully evaluated. RBC do not express tissue factor [
19]. We therefore designed this study to evaluate the effects of IS and IAA on PS exposure, MPs release of RBCs and consequent PCA.
Our results showed that IS and IAA were able to induce the PS externalization and RMPs release of RBC. Compared with the results of Lang
et al. [
13], more higher levels of PS exposure on RBC was detected by Alexa Fluor 488-lactadherin, because lactadherin is more sensitive for detecting PS exposure than annexin V [
16,
20]. Unlike annexin V, the lactadherin assay is Ca
2+ independent, making it suitable for our detection of PS exposure on RBC in the absence of extracelluar calcium. Under confocal microscopy using Alexa Fluor 488-lactadherin, we visually identify PS externalization on erythrocyte membranes accompanying MPs formation in uremic solutes. These erythrocytes change into spherocytes by a substantial loss of membrane surface through vesiculation and MPs generation. All these results reveal that IS and IAA trigger a suicidal erythrocyte death that is eryptosis [
21,
22].
The role of erythrocyte in indolic uremic solutes-associated hemostatic disorders has not been fully evaluated. Our prior research found that RBC is involved in hypercoagulability in nephrotic syndrome (NS) and polycythemia vera (PV) via PS exposure and MPs shedding [
23,
24]. In this study, we evaluated the prothrombotic impact of IS and IAA on RBCs. We found that the increased RMPs shedding and exposure of PS on the surface of RBCs provides binding sites for FXa and prothrombinase complexes, thus promoting the coagulation cascade reaction and subsequently leading to a dramatic increase in thrombin generation. In another experiment, RBCs were pre-incubated with 128 nM lactadherin, which inhibited over 90% production of the FXa and thrombin, and almost restored coagulation times of RBCs and RMPs to control levels. Therefore, strong evidence demonstrates that the PCA is mostly due to exposed PS on the surface of RBCs and shed RMPs. Our present study not only indicated increase of PS exposure and MPs release of RBC in indolic uremic solute but also confirmed one mechanism of IS- and IAA-induced hypercoagulable state, which may be a factor inducing cardiovascular events in CKD. In the present study, we examined only IS and IAA, which are known to have vascular effects, rather than each kind of toxin. Further studies will be necessary to investigate the role of other uremic solutes on RBC.
As eryptosis is triggered by the increase of cytosolic Ca
2+ concentration ([Ca
2+]) [
25,
26,
27], fluo3 fluorescence was employed to estimate [Ca
2+]. Our results showed that cytosolic [Ca
2+] was increased significantly in indolic uremic solutes and associated with increased PS exposure and RMPs release. Upon the increase of cytosolic [Ca
2+], scramblase presumably mediate PS translocation to the erythrocyte surface with membrane blebbing and MPs shedding [
28,
29]. Removal of extracellular Ca
2+ significantly blunted the effect of IS and IAA on lactadherin binding. Our study shows that the increased cytosolic [Ca
2+] might contribute to IS and IAA-induced PS exposure and MPs generation in erythrocyte. The underlying molecular mechanism will be required to define our future studies.
Lactadherin, an effective PS-stained reagent was used as a novel probe to quantify and localize PS exposure on RBC. Moreover, lactadherin acts as an effective anticoagulant for inhibiting PCA of IS- and IAA-cultured RBC by blocked PS, which may prevent indolic uremic solutes induced thrombophilia.
In conclusion, we provide new insights into the roles of RBCs in the development of IS and IAA-related hypercoagulable states. We demonstrated that indolic uremic solutes increased PCA of RBC by inducing PS exposure and RMPs release, and the effect is at least partially due to increased cytosolic [Ca2+]. Alternatively, it is necessary to further study the possibility of applying lactadherin in thrombotic complications of uremia.

