
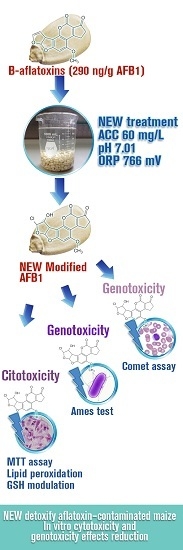
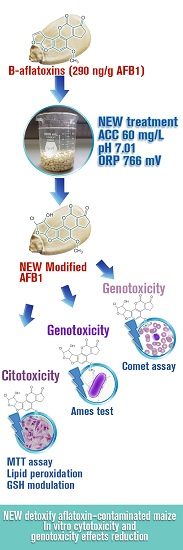
Detoxification of Aflatoxin-Contaminated Maize by Neutral Electrolyzed Oxidizing Water

 ,
,
Abstract
:
1. Introduction
2. Results and Discussion
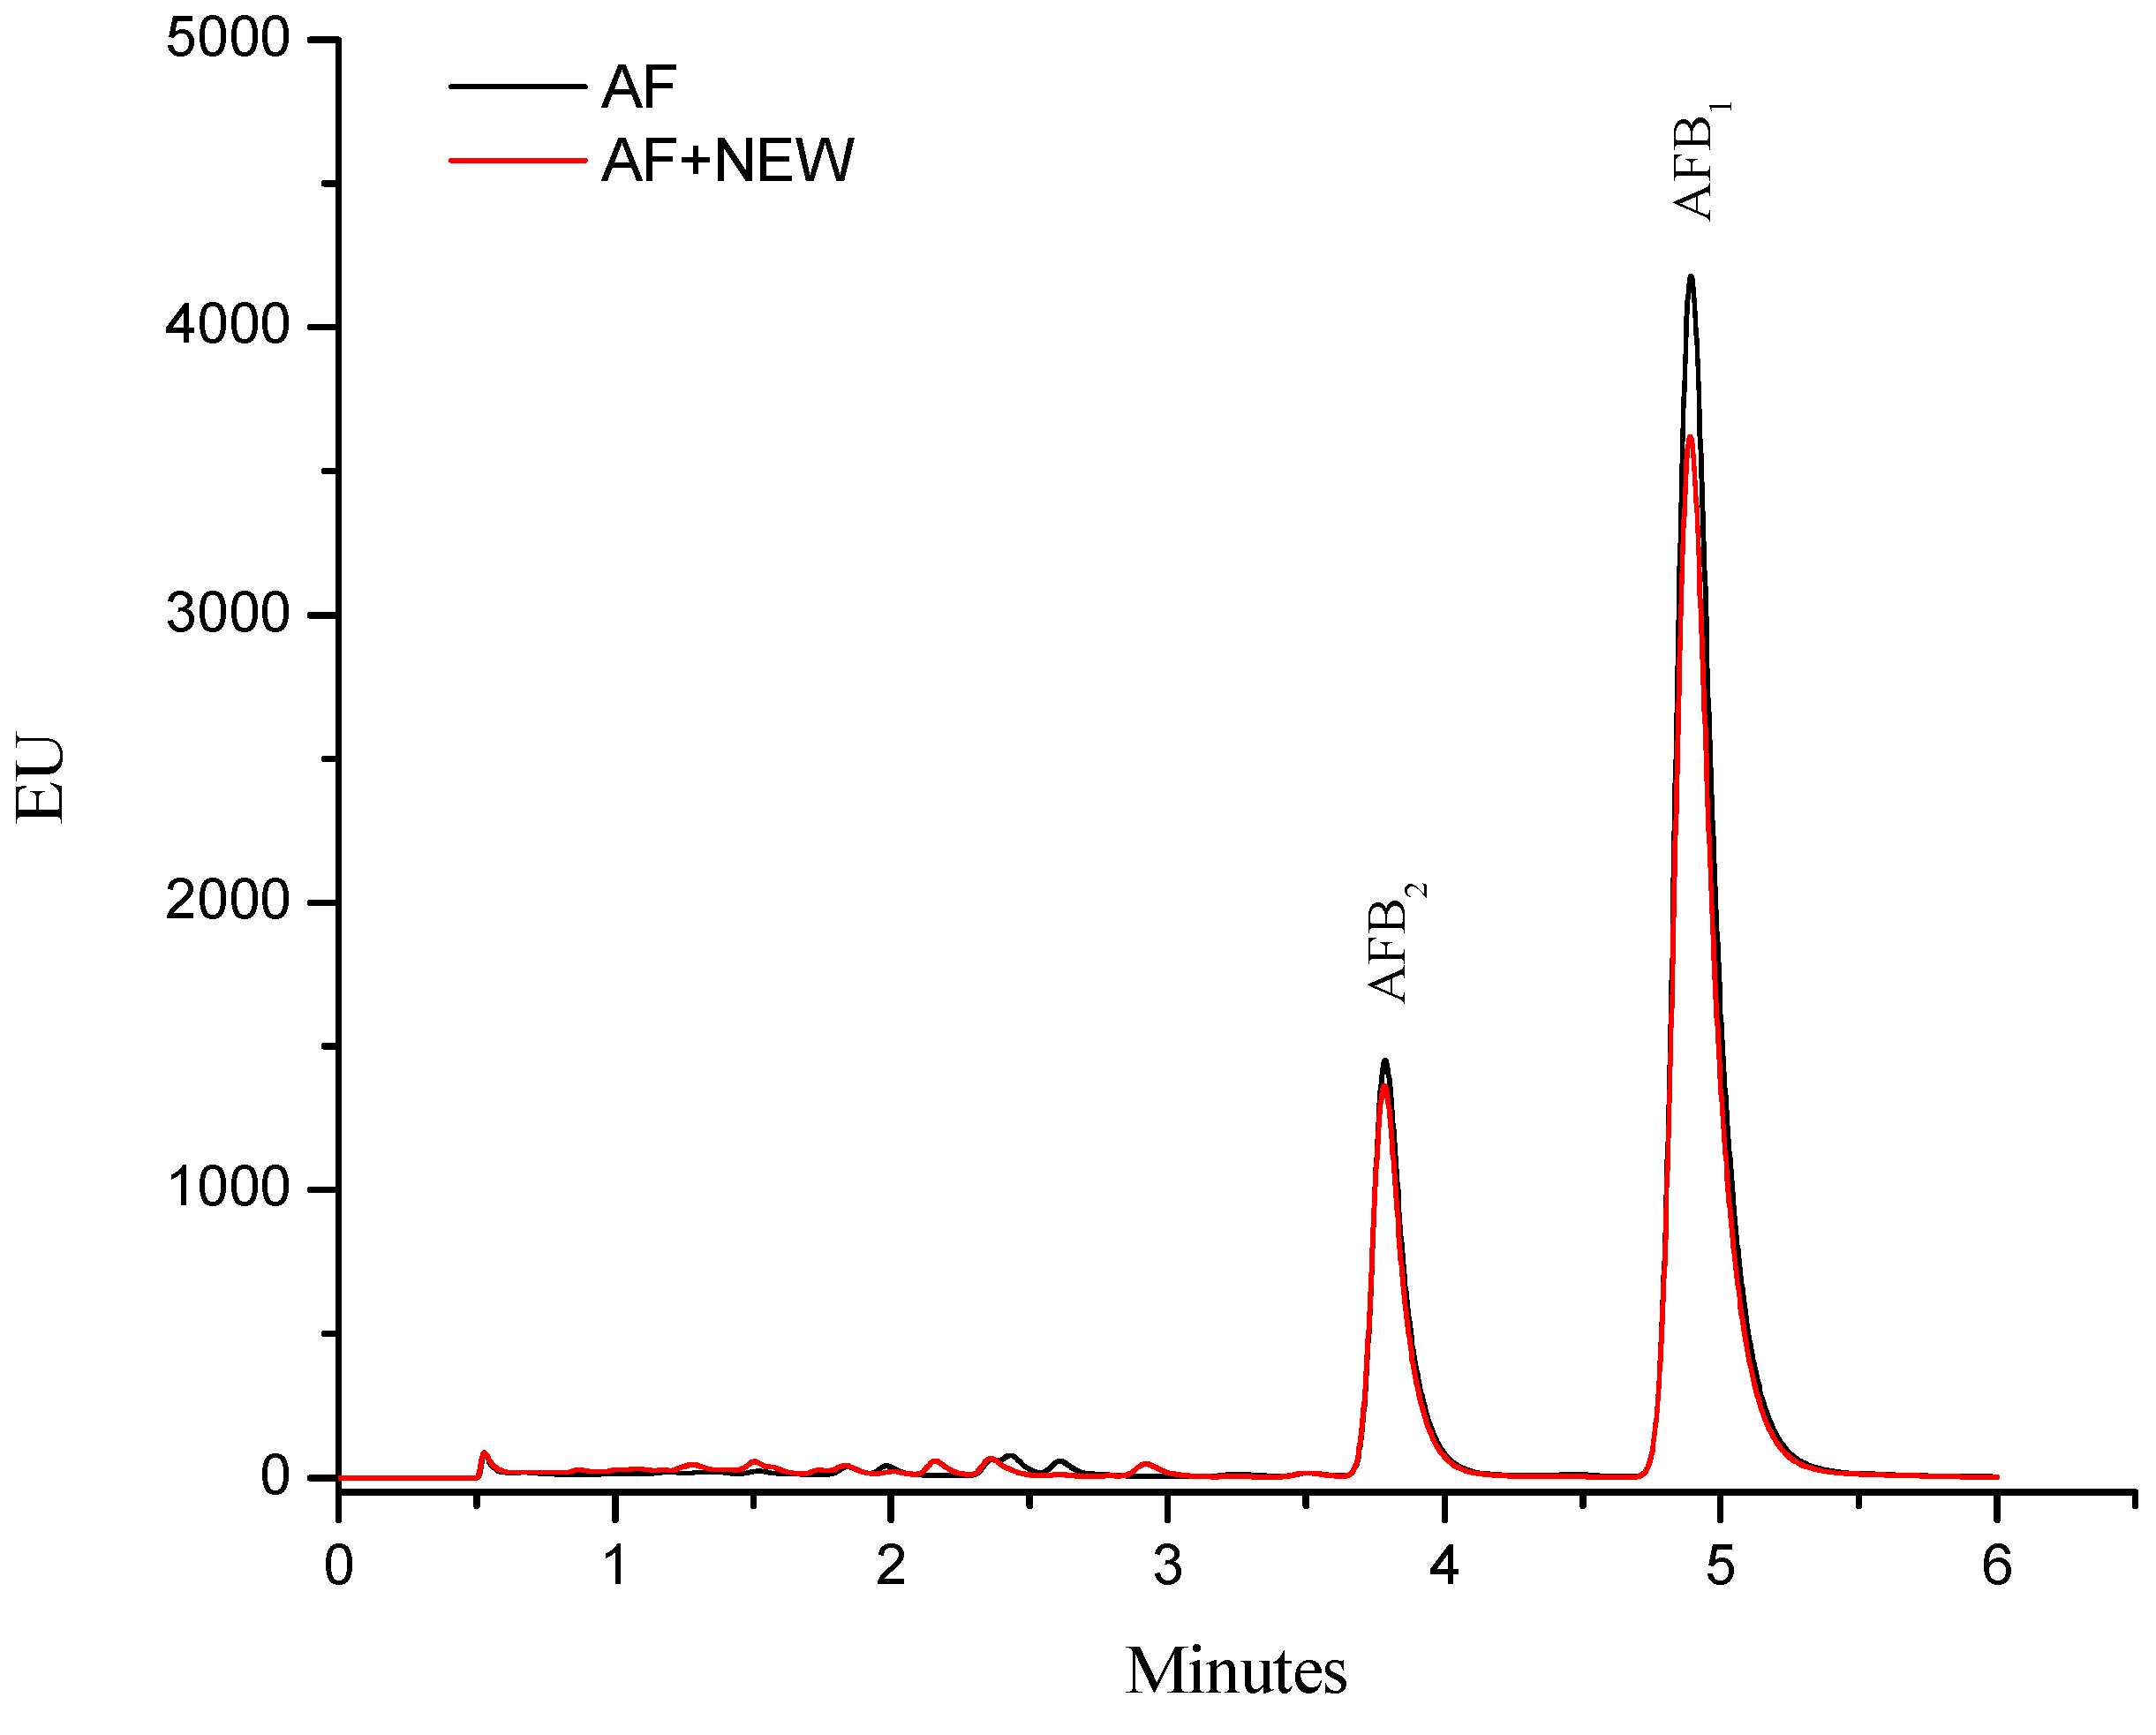
2.1. Efficacy of NEW to Detoxify Aflatoxin-Contaminated Maize

| Parameter | NEW | DW |
|---|---|---|
| PH | 7.01 ± 0.04 | 5.60 ± 0.15 |
| ORP (mV) | 766 ± 3.4 | 459 ± 2.5 |
| ACC (mg/L) | 60 ± 0.47 | <1 |
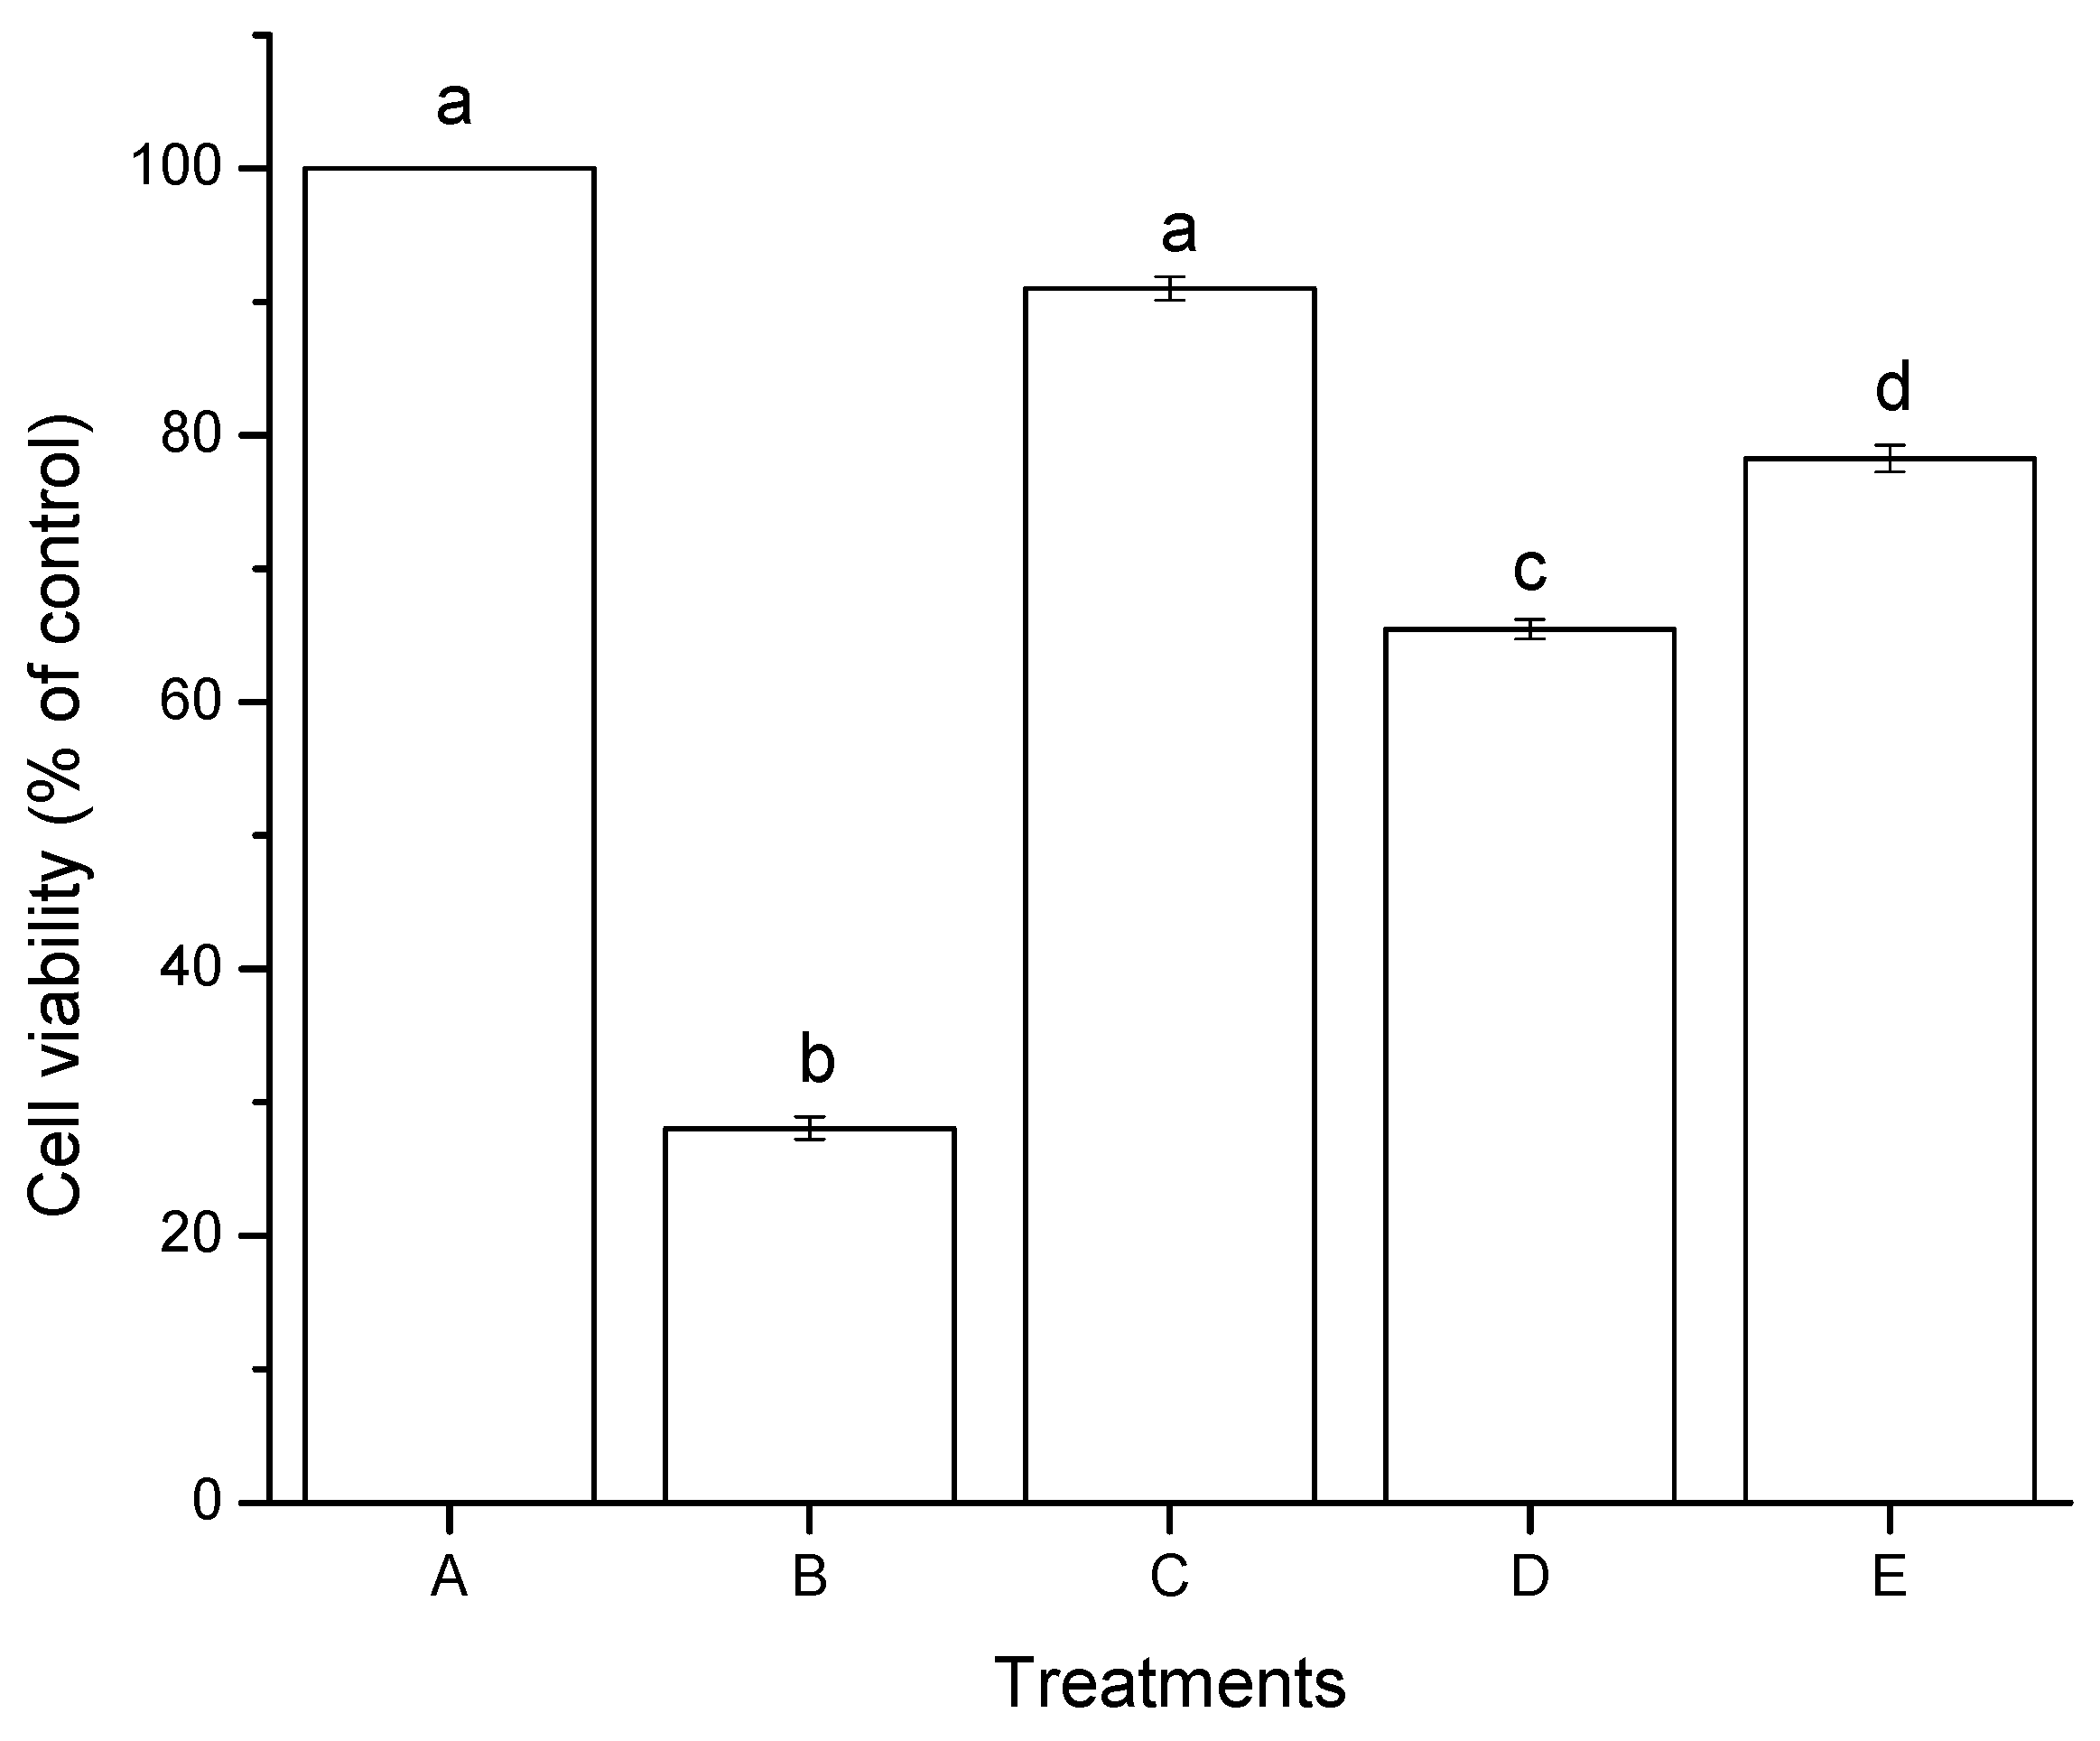
2.2. Cytotoxic Effects
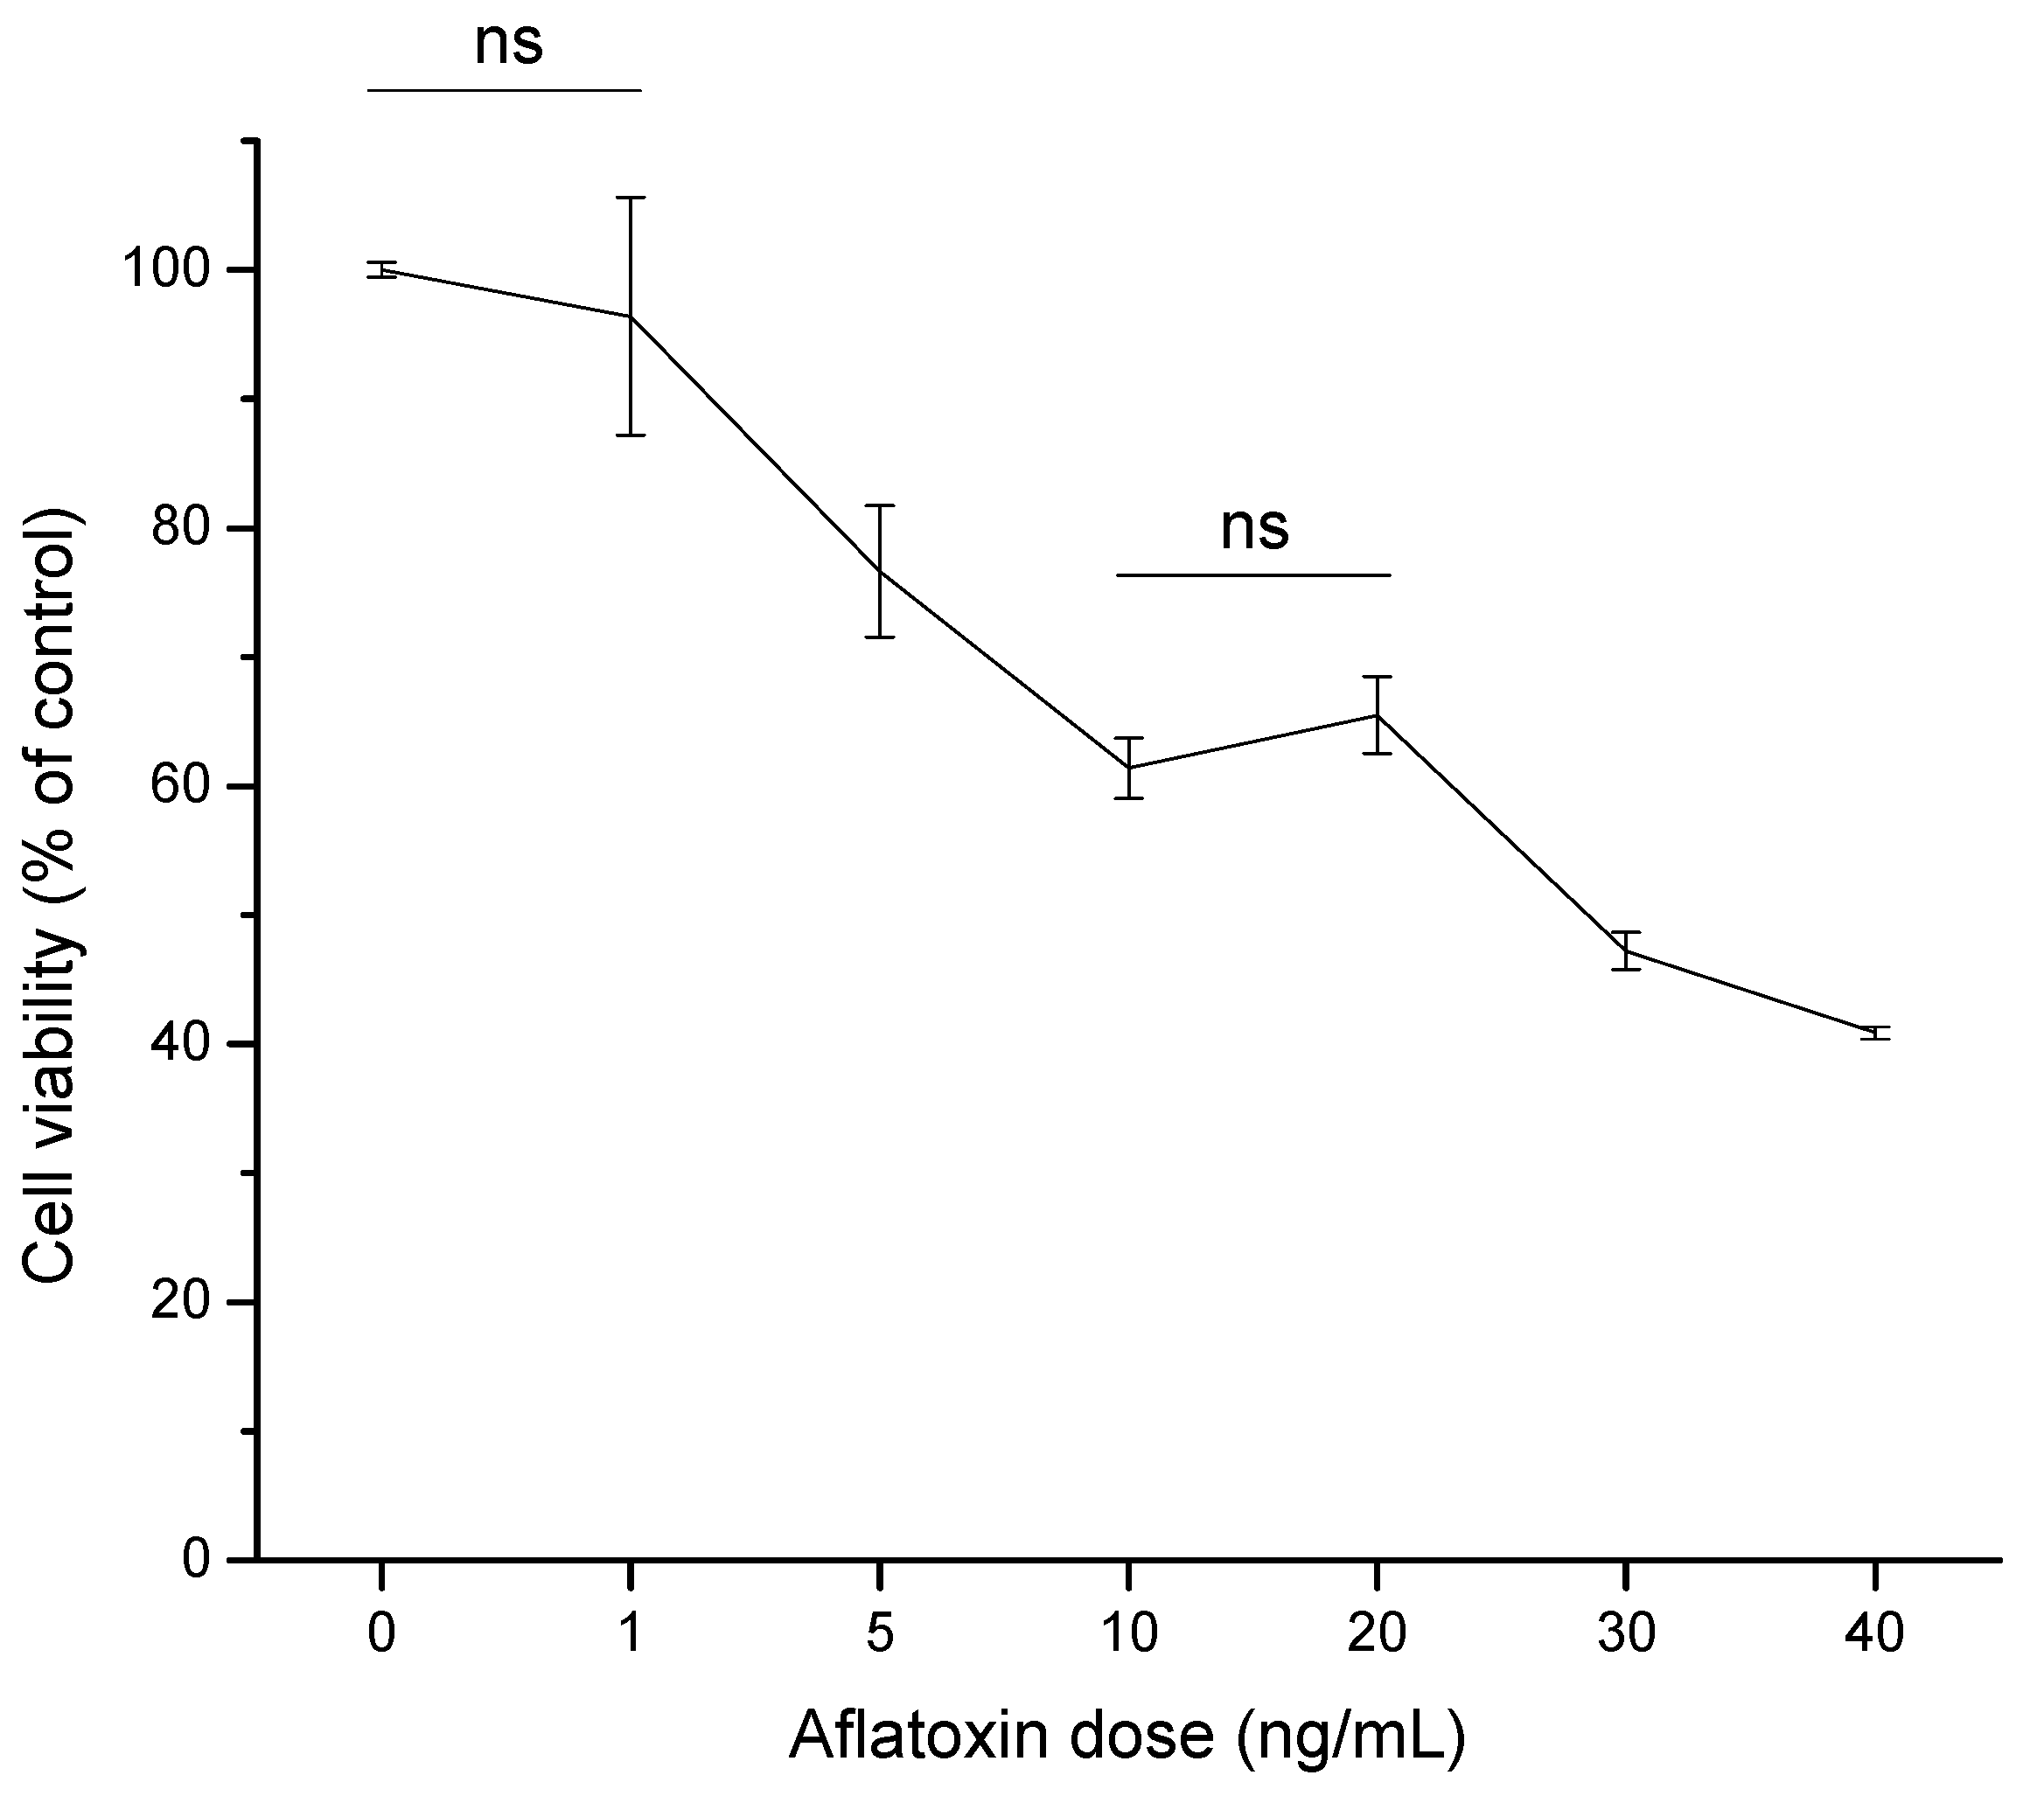
2.2.1. Cell Viability (MTT Assay)
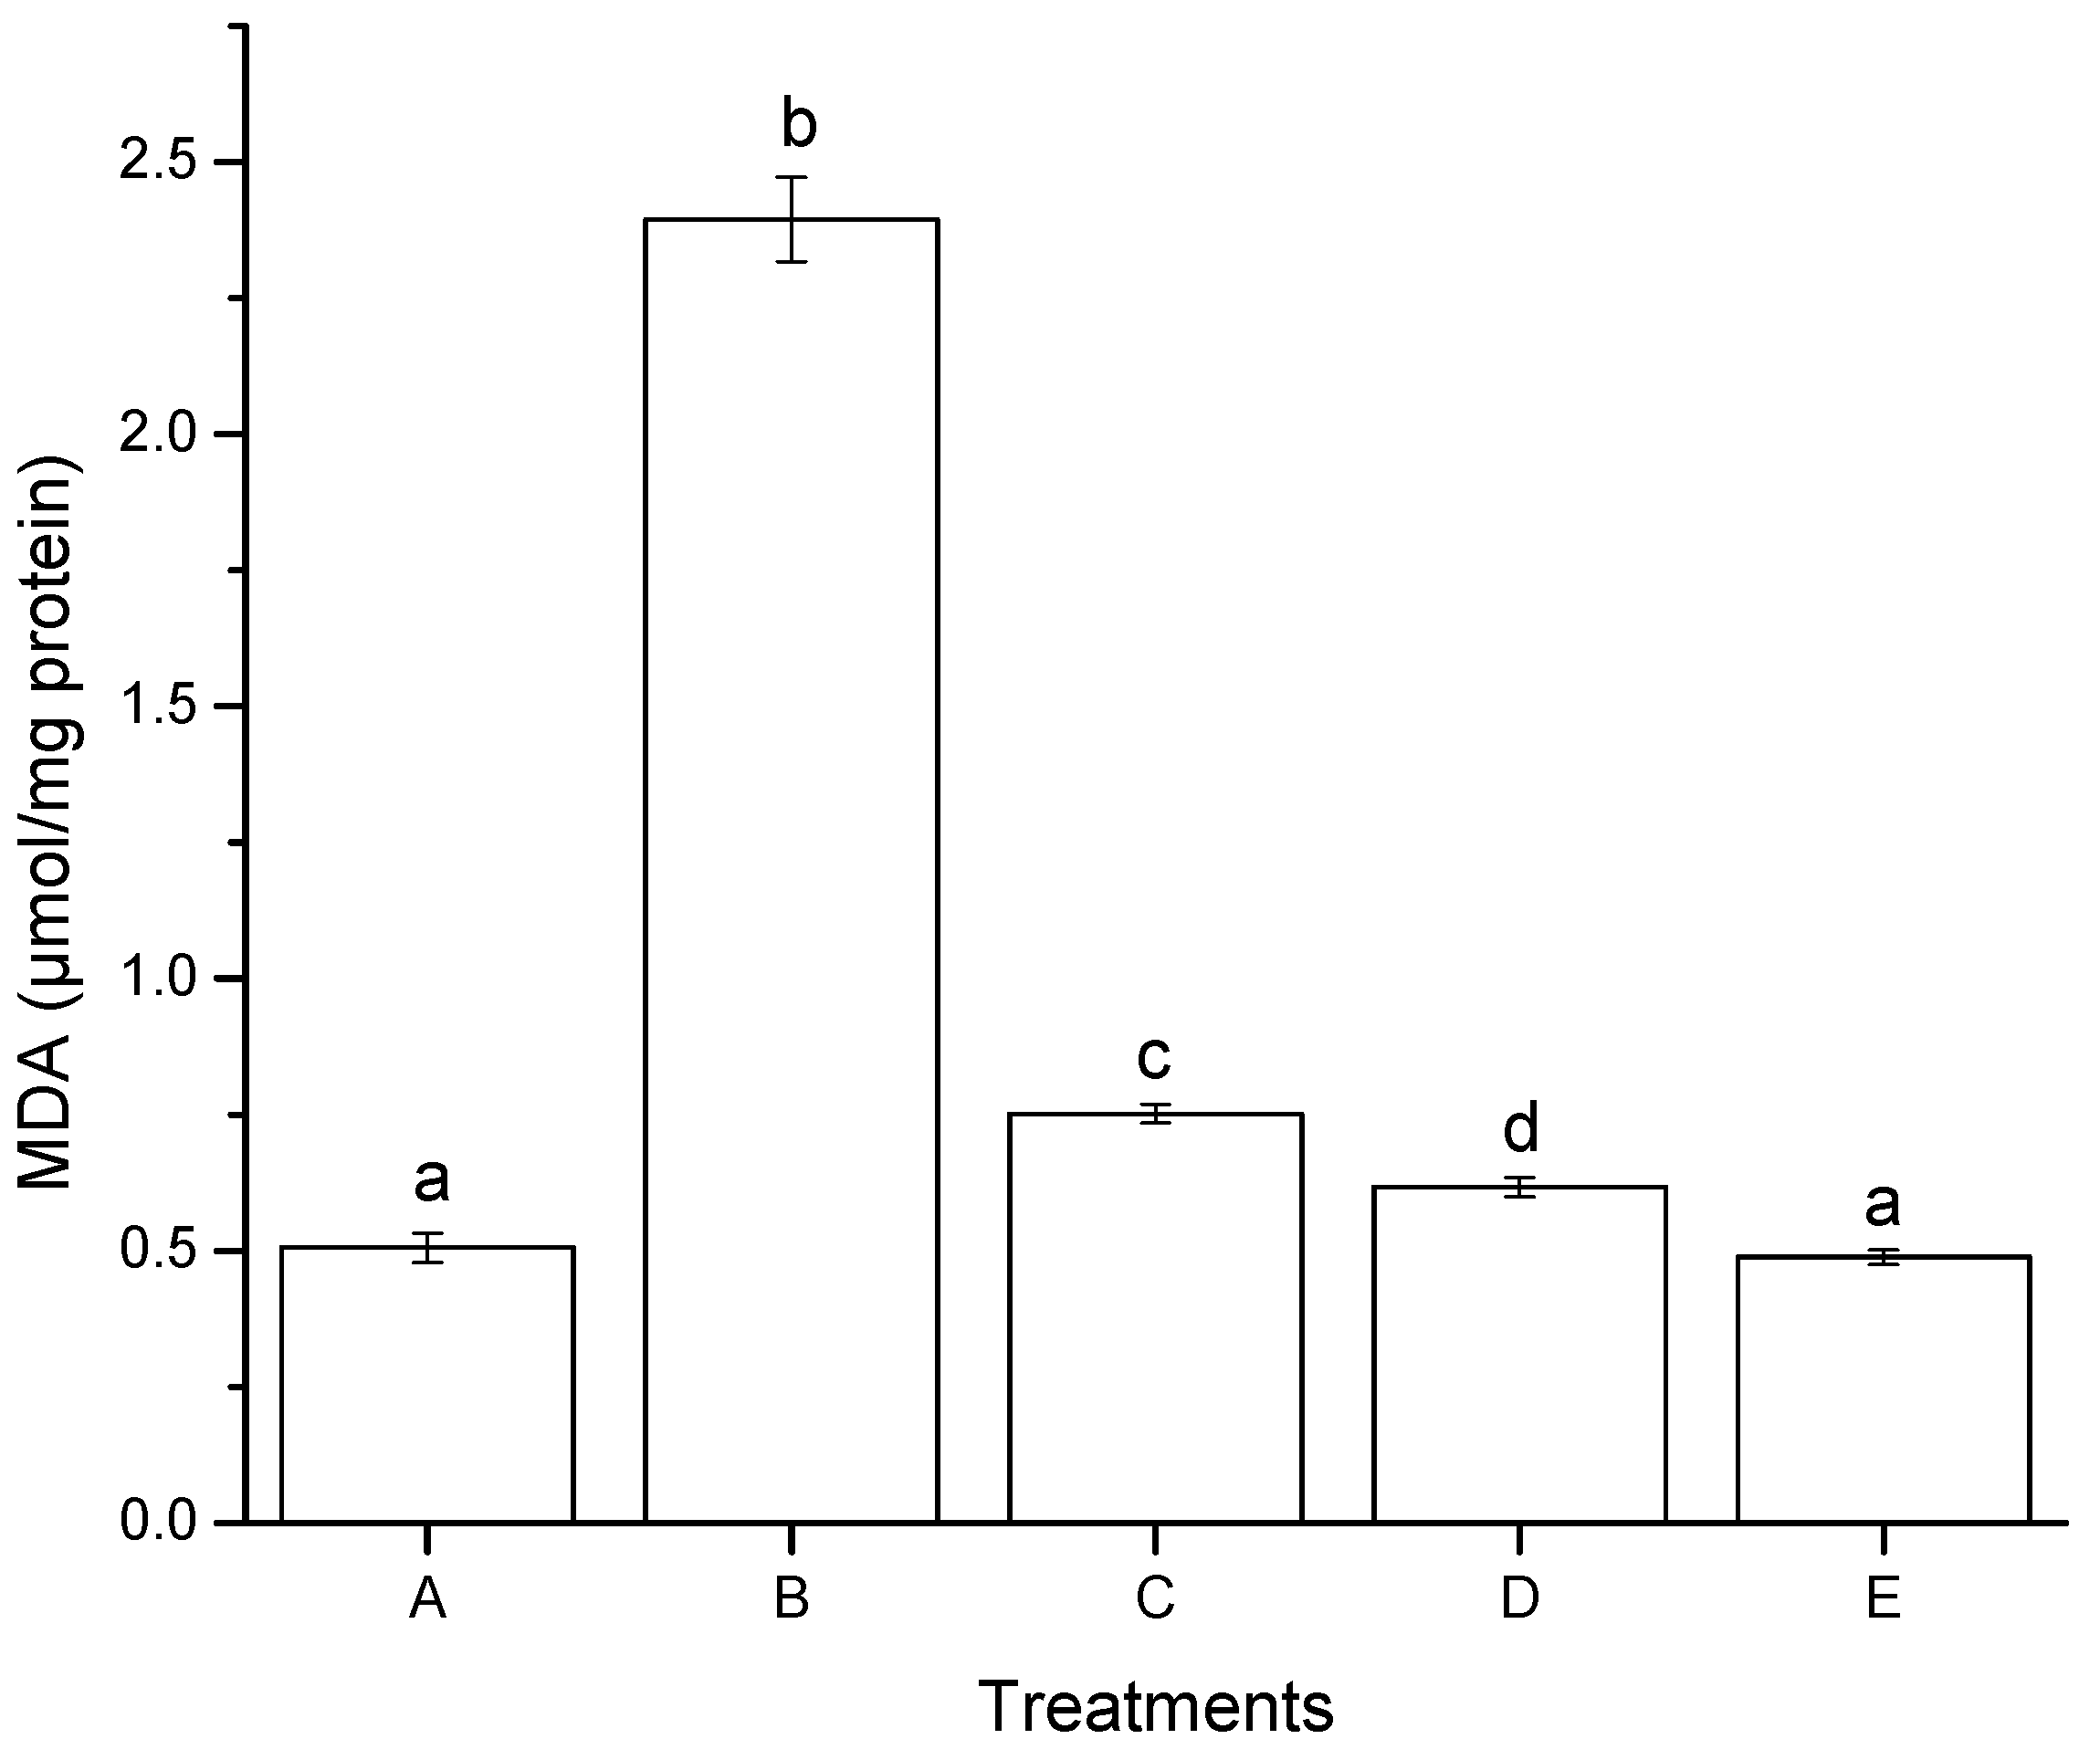
2.2.2. Lipid Peroxidation (Oxidative Stress)
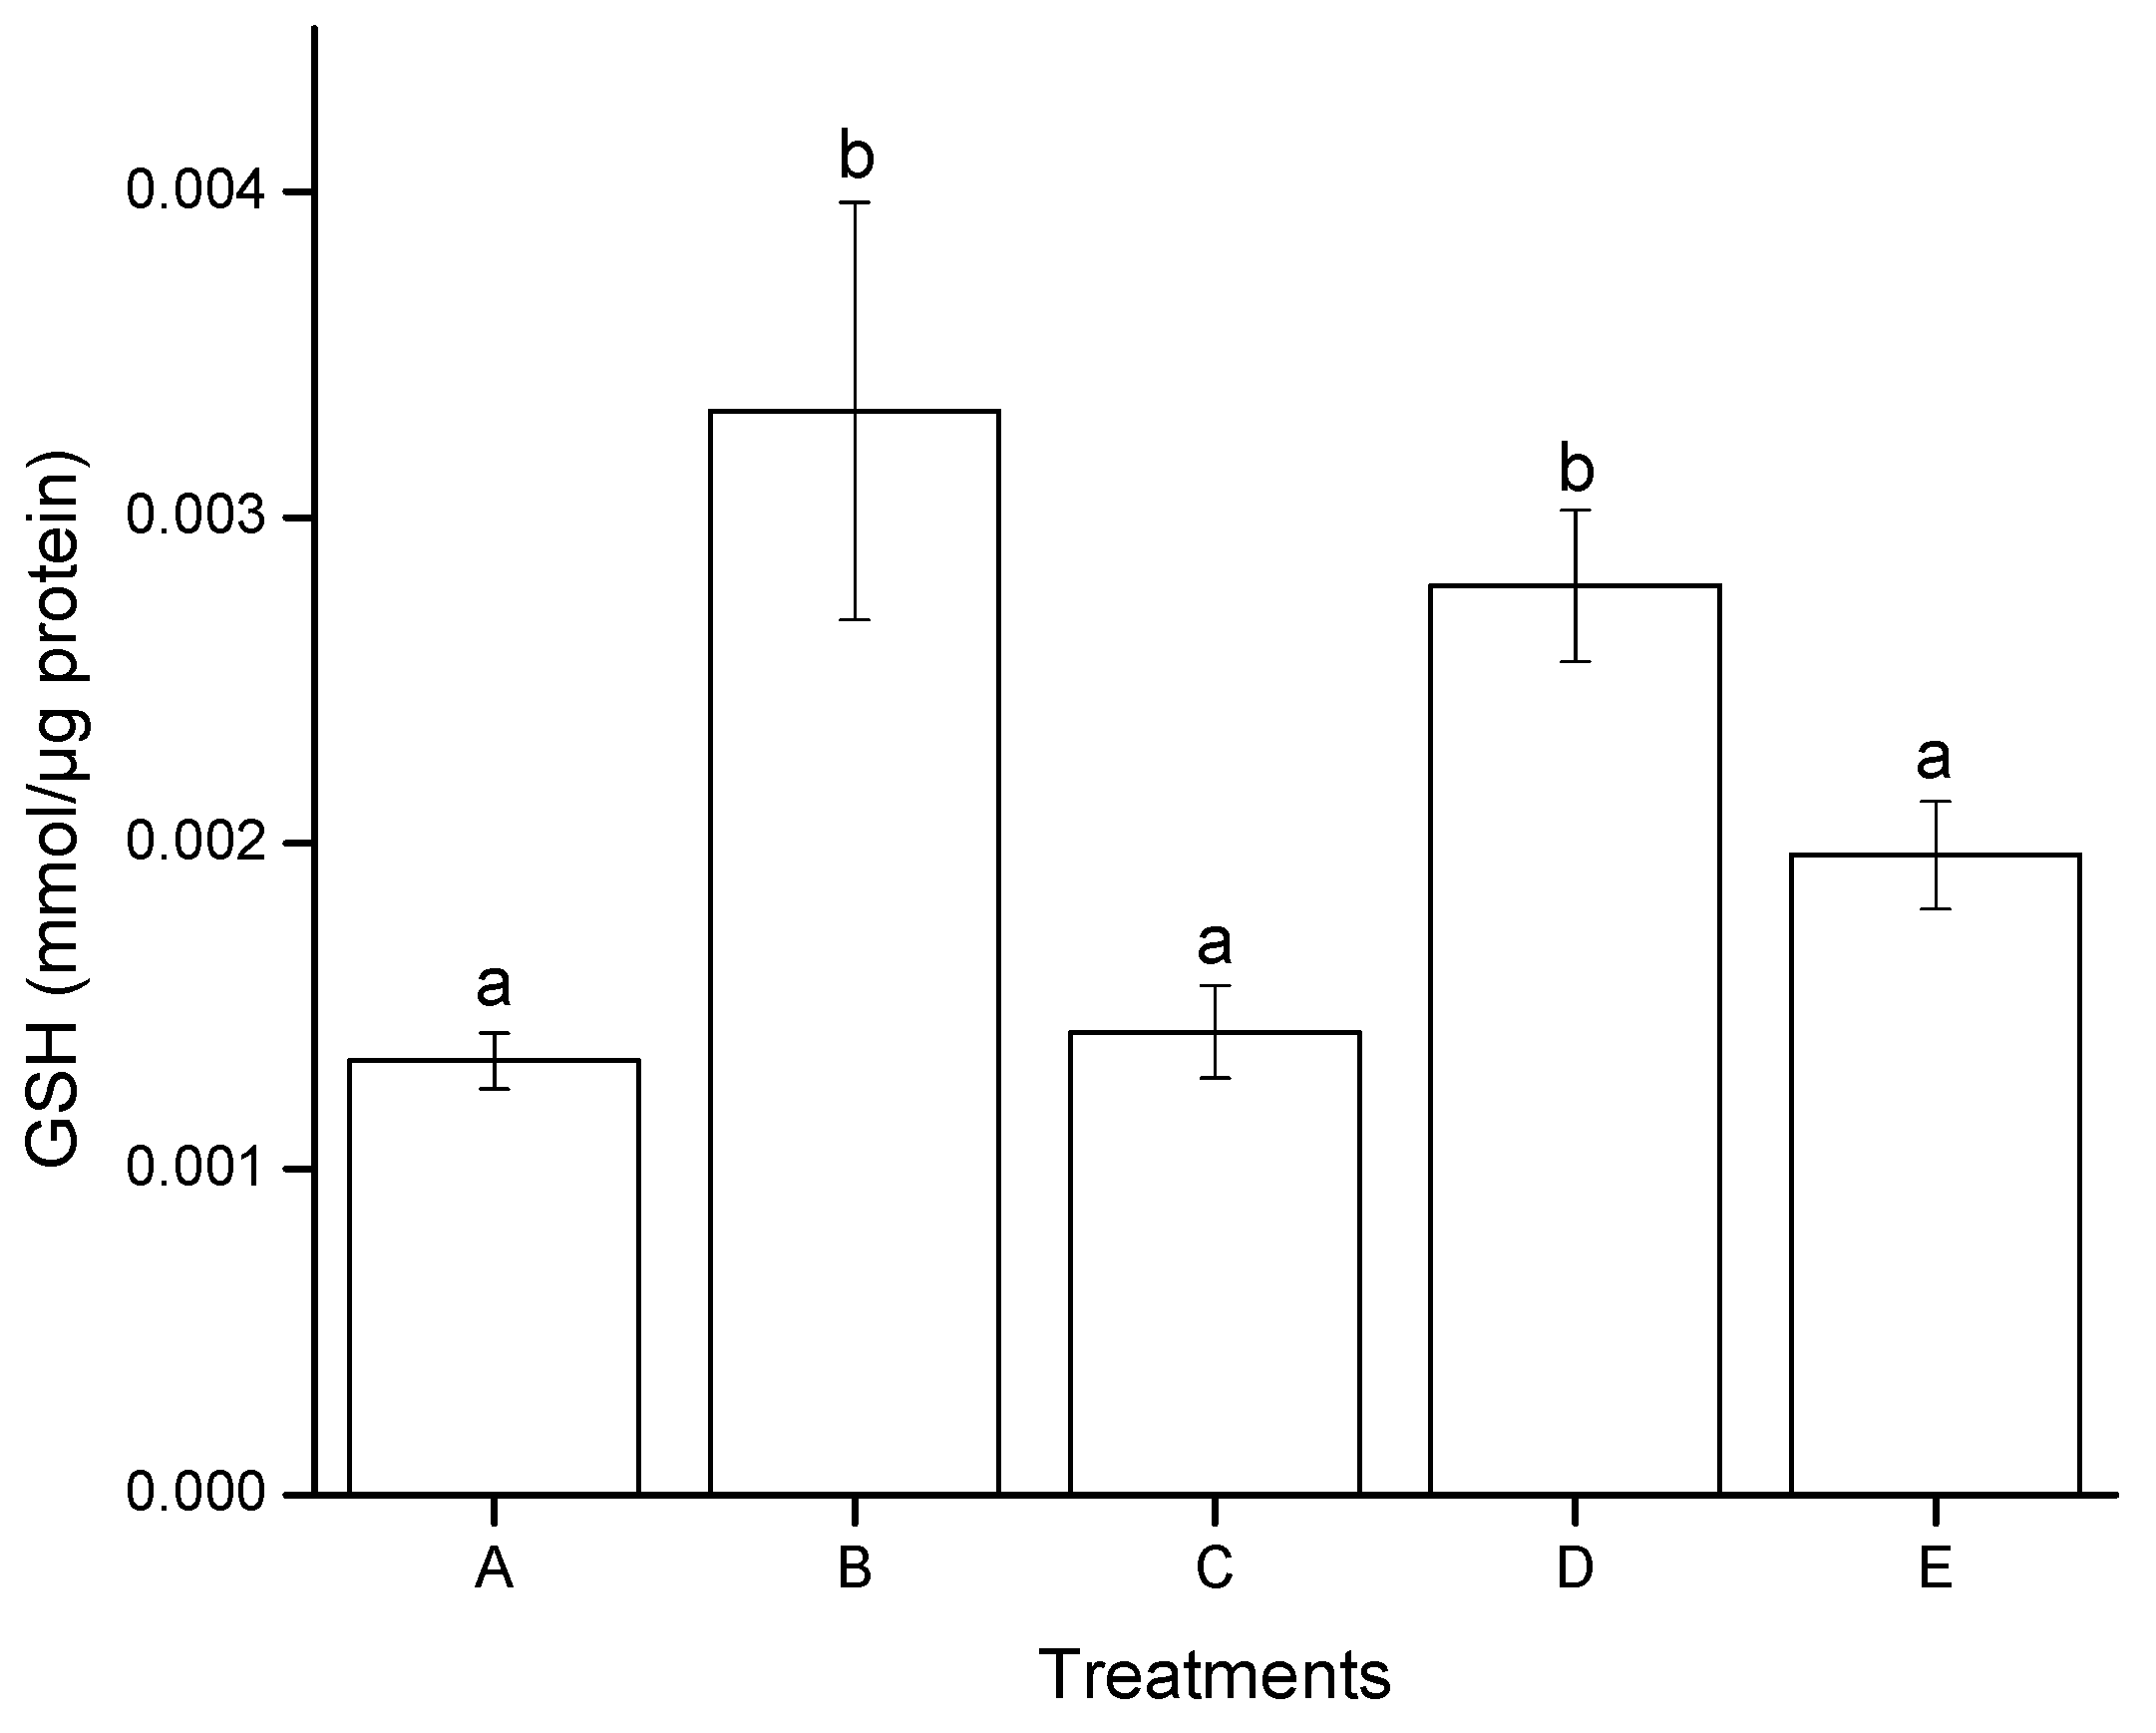
2.2.3. Reduced Glutathione (GSH) Modulation
2.3. Genotoxic Effects
2.3.1. Ames Test
| Treatment | Revertants/Plate |
|---|---|
| A | 107 ± 16 a |
| B | 161 ± 25 b |
| C | 223 ± 50 c |
| D | 344 ± 4 d |
| E | 111 ± 17 a |
| F | 216 ± 19 c |
| G | 103 ± 11 a |
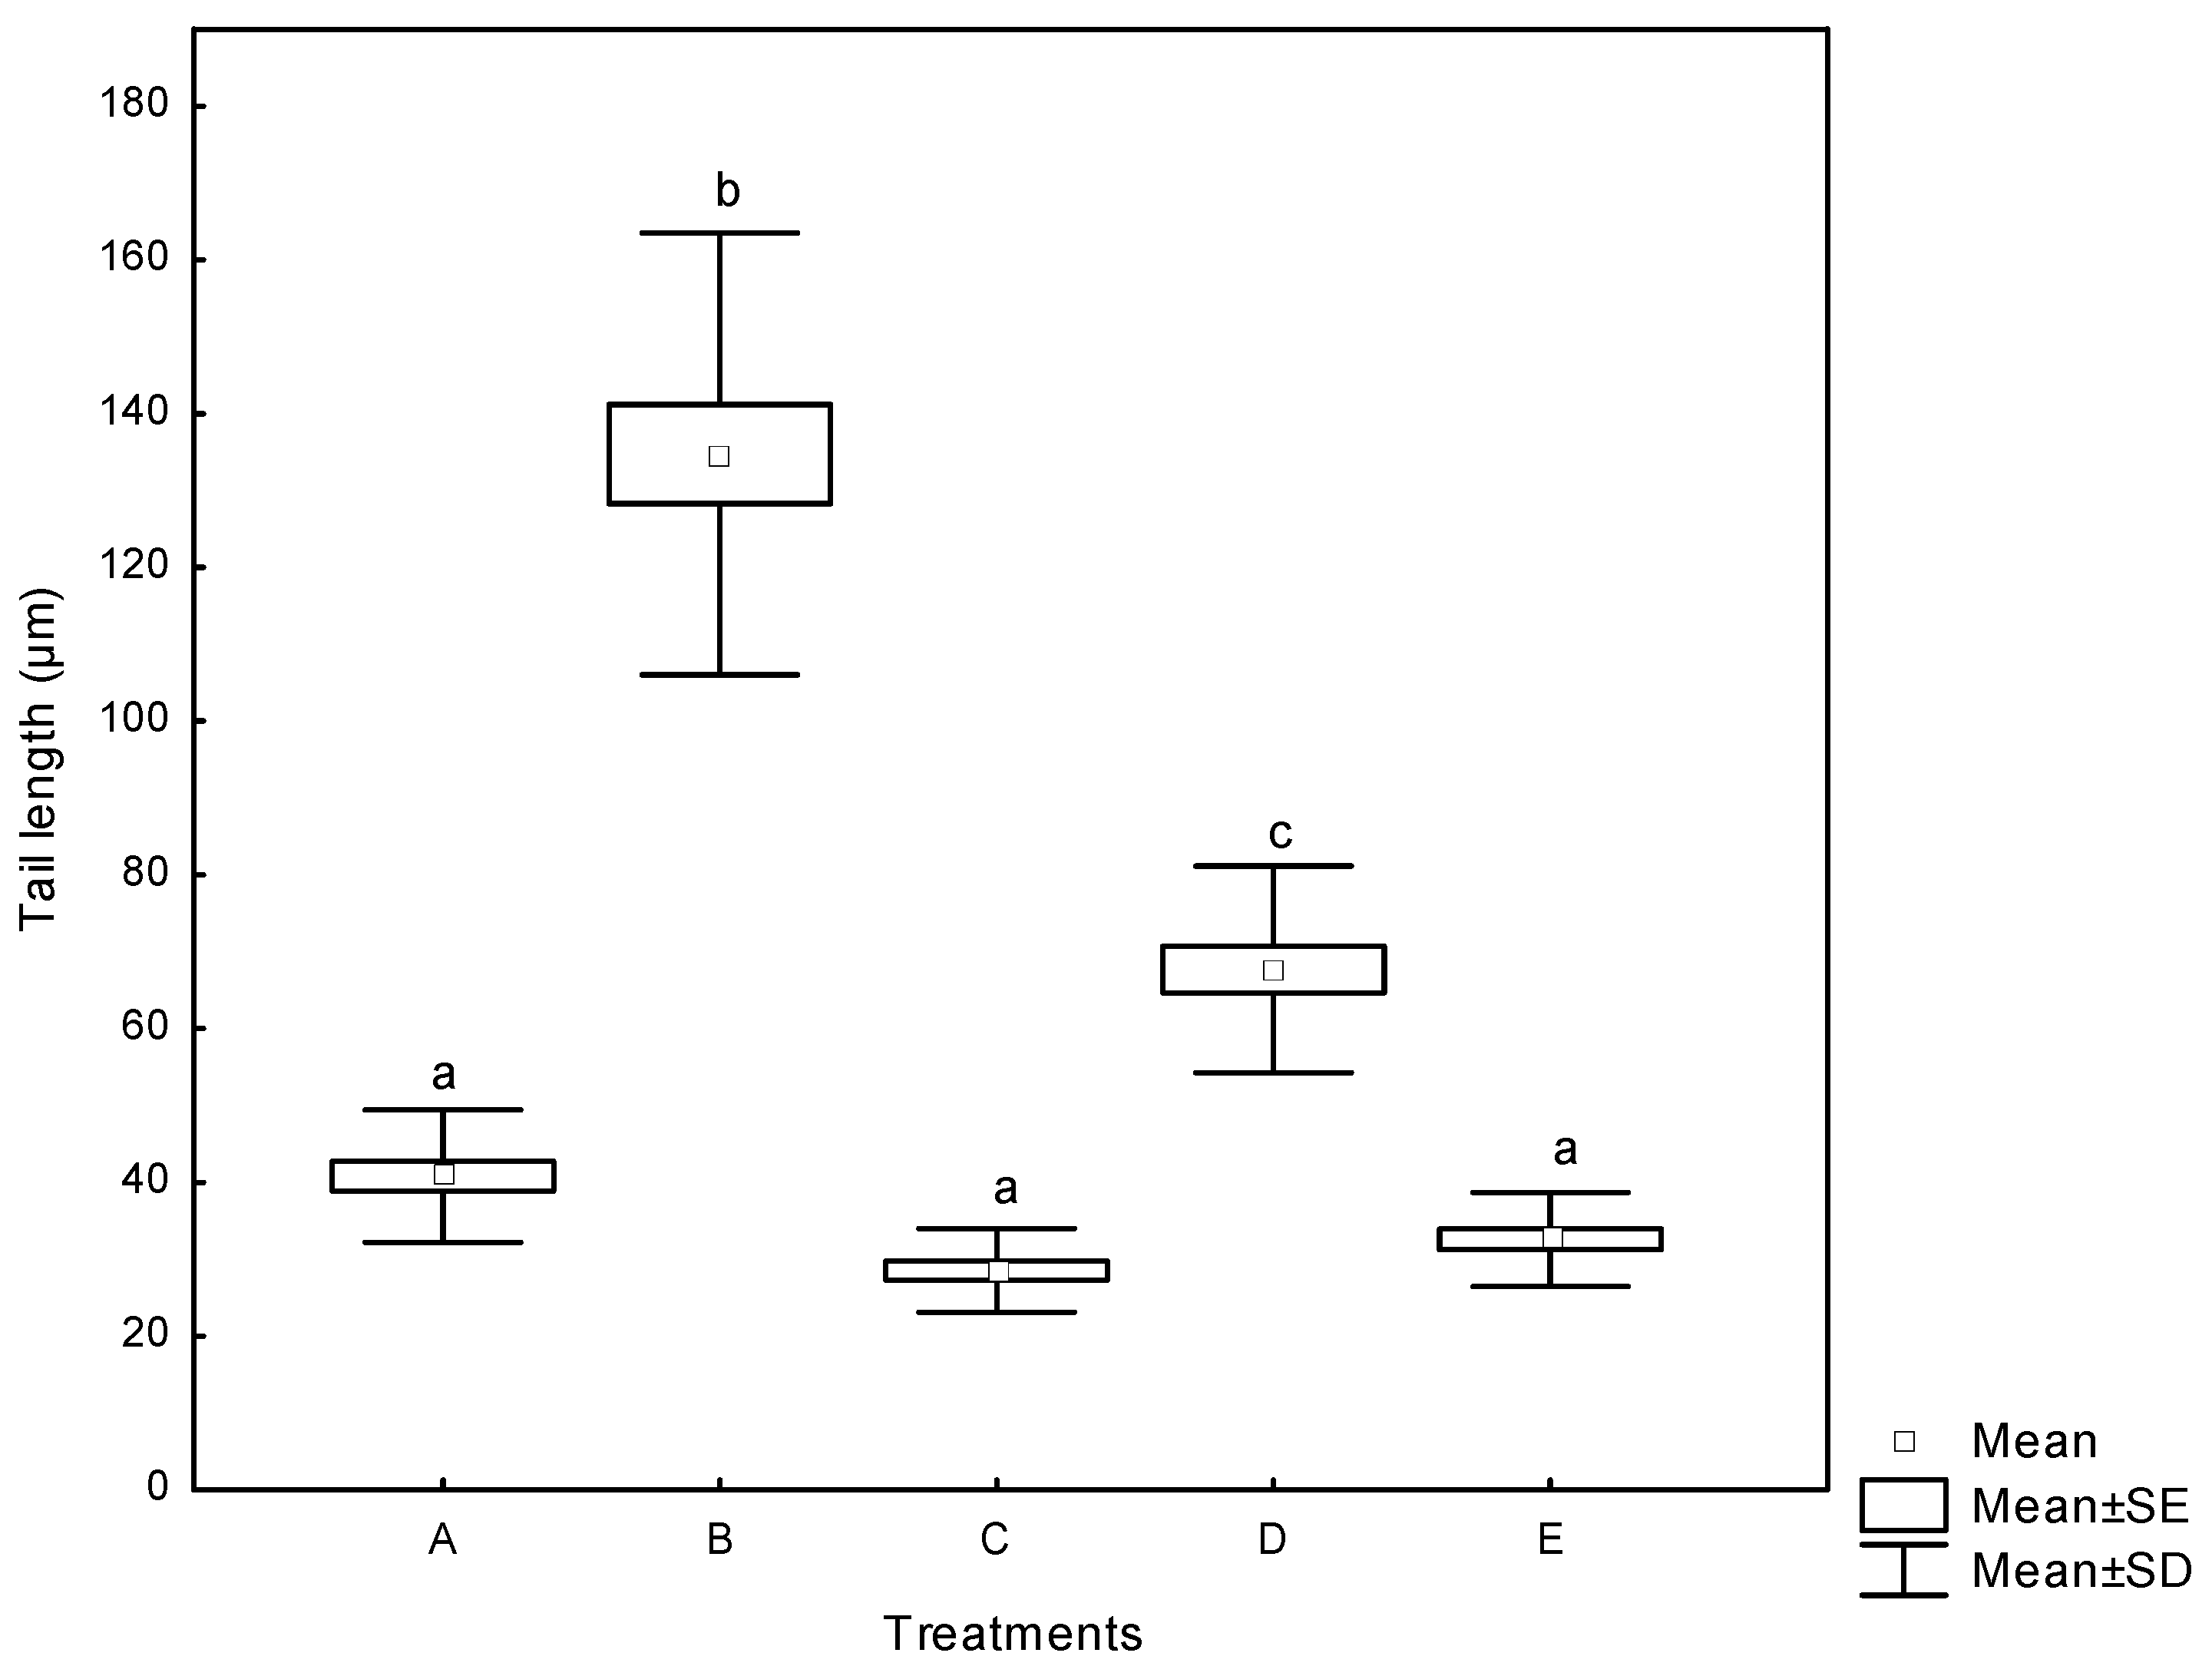
2.3.2. Comet Assay
3. Experimental Section
3.1. Safety Precautions
3.2. Chemicals and Reagents
3.3. Preparation of NEW
3.4. Maize Grain
3.5. Aflatoxin Production
3.6. Aflatoxin Quantification
3.7. Aflatoxin Identification
3.8. Detoxification of Aflatoxin-Contaminated Maize with NEW
3.9. Determination of Cytotoxicity
3.9.1. Cell Culture
3.9.2. Cell Viability (MTT Assay)
3.9.3. Lipid Peroxidation Assay
3.9.4. GSH Assay
3.10. Determination of Genotoxicity
3.10.1. Ames Test
3.10.2. Alkaline Comet Assay
Lymphocyte Viability
3.11. Experimental Design and Statistical Analysis
4. Conclusions
Supplementary Materials
Acknowledgments
Author Contributions
Conflicts of Interest
References
- Feibelman, T.P.; Cotty, P.J.; Doster, M.; Michailides, T. A morphologically distinct strain of Aspergillus nomius. Mycologia 1998, 90, 618–623. [Google Scholar] [CrossRef]
- Nesci, A.; Gsponer, N.; Etcheverry, M. Natural maize phenolic acids for control of aflatoxigenic fungi on maize. J. Food Sci. 2007, 72, M180–M185. [Google Scholar] [CrossRef] [PubMed]
- IARC. Some Naturally Occurring Substances: Food Items and Constituents, Heterocyclic Aromatic Amines and Mycotoxins. Available online: http://bases.bireme.br/cgi-bin/wxislind.exe/iah/online/?IsisScript=iah/iah.xis&src=google&base=WHOLIS&lang=p&nextAction=lnk&exprSearch=9283212568&indexSearch=ID (accessed on 21 October 2015).
- Parkin, D.M. Global cancer statistics in the year 2000. Lancet Oncol. 2001, 2, 533–543. [Google Scholar] [CrossRef]
- El-Serag, H.B.; Mason, A.C. Rising incidence of hepatocellular carcinoma in the United States. N. Engl. J. Med. 1999, 340, 745–750. [Google Scholar] [CrossRef] [PubMed]
- Bressac, B.; Puisieux, A.; Kew, M.; Volkmann, M.; Bozcall, S.; Mura, J.B.; de la Monte, S.; Carlson, R.; Blum, H.; Wands, J. p53 mutation in hepatocellular carcinoma after aflatoxin exposure. Lancet 1991, 338, 1356–1359. [Google Scholar] [CrossRef]
- Turner, P.C.; Sylla, A.; Diallo, M.S.; Castegnaro, J.J.; Hall, A.J.; Wild, C.P. The role of aflatoxins and hepatitis viruses in the etiopathogenesis of hepatocellular carcinoma: A basis for primary prevention in Guinea–Conakry, West Africa. J. Gastroenterol. Hepatol. 2002, 17, S441–S448. [Google Scholar] [CrossRef] [PubMed]
- Méndez-Albores, J.; Villa, G.; Rio-García, D.; Martinez, E. Aflatoxin-detoxification achieved with Mexican traditional nixtamalization process (MTNP) is reversible. J. Sci. Food and Agric. 2004, 84, 1611–1614. [Google Scholar] [CrossRef]
- Doyle, M.; Applebaum, R.; Brackett, R.; Marth, E. Physical, chemical and biological degradation of mycotoxins in foods and agricultural commodities. J. Food Prot. 1982, 45, 964–971. [Google Scholar]
- Guentzel, J.L.; Lam, K.L.; Callan, M.A.; Emmons, S.A.; Dunham, V.L. Postharvest management of gray mold and brown rot on surfaces of peaches and grapes using electrolyzed oxidizing water. Int. J. Food Microbiol. 2010, 143, 54–60. [Google Scholar] [CrossRef] [PubMed]
- Audenaert, K.; Monbaliu, S.; Deschuyffeleer, N.; Maene, P.; Vekeman, F.; Haesaert, G.; de Saeger, S.; Eeckhout, M. Neutralized electrolyzed water efficiently reduces Fusarium spp. in vitro and on wheat kernels but can trigger deoxynivalenol (DON) biosynthesis. Food Control. 2012, 23, 515–521. [Google Scholar]
- Zhang, Q.; Xiong, K.; Tatsumi, E.; Liu, H.-J. Elimination of aflatoxin B1 in peanuts by acidic electrolyzed oxidizing water. Food Control. 2012, 27, 16–20. [Google Scholar] [CrossRef]
- Torres Espinosa, E.; Acuña Askar, K.; Naccha Torres, L.R.; Montoya Olvera, R.; Castrellón Santa Anna, J.P. Quantification of aflatoxins in corn distributed in the city of Monterrey, Mexico. Food Addit. Contam. 1995, 12, 383–386. [Google Scholar] [CrossRef] [PubMed]
- Xiong, K.; Liu, H.J.; Li, L.T. Product identification and safety evaluation of aflatoxin B1 decontaminated by electrolyzed oxidizing water. J. Agric. Food Chem. 2012, 60, 9770–9778. [Google Scholar] [CrossRef] [PubMed]
- Mendez-Albores, A.; del Rio-Garcia, J.C.; Moreno-Martinez, E. Decontamination of aflatoxin duckling feed with aqueous citric acid treatment. Anim Feed Sci. Technol. 2007, 135, 249–262. [Google Scholar] [CrossRef]
- Méndez-Albores, A.; Pérez-Flores, G.; Moreno-Martínez, E. Effect of microwave heating during alkaline-cooking of aflatoxin contaminated maize. J. Food Sci. 2011, 76, T48–T52. [Google Scholar]
- Nicolás-Vázquez, I.; Méndez-Albores, A.; Moreno-Martínez, E.; Miranda, R.; Castro, M. Role of lactone ring in structural, electronic, and reactivity properties of aflatoxin B1: A theoretical study. Arch. Environ. Contam. Toxicol. 2010, 59, 393–406. [Google Scholar] [CrossRef] [PubMed]
- Carr, A.; Vissers, M.; Domigan, N.; Winterbourn, C. Modification of red cell membrane lipids by hypochlorous acid and haemolysis by preformed lipid chlorohydrins. Redox Report: Commun. Free Rad. Res. 1996, 3, 263–271. [Google Scholar]
- Méndez-Albores, A.; Arambula-Villa, G.; Loarca-Piña, M.; Castano-Tostado, E.; Moreno-Martínez, E. Safety and efficacy evaluation of aqueous citric acid to degrade B-aflatoxins in maize. Food Chem. Toxicol. 2005, 43, 233–238. [Google Scholar] [CrossRef] [PubMed]
- Guentzel, J.L.; Lam, K.L.; Callan, M.A.; Emmons, S.A.; Dunham, V.L. Reduction of bacteria on spinach, lettuce, and surfaces in food service areas using neutral electrolyzed oxidizing water. Food Microbiol. 2008, 25, 36–41. [Google Scholar] [CrossRef] [PubMed]
- Buck, J.; van Iersel, M.; Oetting, R.; Hung, Y.-C. Evaluation of acidic electrolyzed water for phytotoxic symptoms on foliage and flowers of bedding plants. Crop. Prot. 2003, 22, 73–77. [Google Scholar] [CrossRef]
- Bonsi, P.; Augusti-Tocco, G.; Palmery, M.; Giorgi, M. Aflatoxin B1 is an inhibitor of cyclic nucleotide. Gen. Pharmacol.: Vasc. Syst. 1999, 32, 615–619. [Google Scholar] [CrossRef]
- Viviers, J.; Schabort, J.C. Aflatoxin B1 alters protein phosphorylation in rat livers. Biochem. Biophys. Res. Commun. 1985, 129, 342–349. [Google Scholar] [CrossRef]
- Kuilman, M.; Maas, R.; Fink-Gremmels, J. Cytochrome P450-mediated metabolism and cytotoxicity of aflatoxin B1 in bovine hepatocytes. Toxicol. In Vitro 2000, 14, 321–327. [Google Scholar] [CrossRef]
- McKean, C.; Tang, L.; Billam, M.; Tang, M.; Theodorakis, C.W.; Kendall, R.J.; Wang, J.-S. Comparative acute and combinative toxicity of aflatoxin B1 and T-2 toxin in animals and immortalized human cell lines. J. Appl. Toxicol. 2006, 26, 139–147. [Google Scholar] [CrossRef] [PubMed]
- Liu, R.; Jin, Q.; Tao, G.; Shan, L.; Huang, J.; Liu, Y.; Wang, X.; Mao, W.; Wang, S. Photodegradation kinetics and byproducts identification of the Aflatoxin B1 in aqueous medium by ultra-performance liquid chromatography-quadrupole time-of-flight mass spectrometry. J. Mass Spectrom. 2010, 45, 553–559. [Google Scholar] [CrossRef] [PubMed]
- Gutleb, A.C.; Morrison, E.; Murk, A.J. Cytotoxicity assays for mycotoxins produced by Fusarium strains: A review. Environ. Toxicol. Pharmacol. 2002, 11, 309–320. [Google Scholar] [CrossRef]
- Güngör, N.; Knaapen, A.M.; Munnia, A.; Peluso, M.; Haenen, G.R.; Chiu, R.K.; Godschalk, R.W.; van Schooten, F.J. Genotoxic effects of neutrophils and hypochlorous acid. Mutagenesis 2010, 25, 149–154. [Google Scholar] [CrossRef] [PubMed]
- Vázquez-Durán, A.; Díaz-Torres, R.; Ramírez-Noguera, P.; Moreno-Martínez, E.; Méndez-Albores, A. Cytotoxic and genotoxic evaluation of tortillas produced by microwave heating during alkaline-cooking of aflatoxin-contaminated maize. J. Food Sci. 2014, 79, T1024–T1029. [Google Scholar] [CrossRef] [PubMed]
- Abado-Becognee, K.; Mobio, T.A.; Ennamany, R.; Fleurat-Lessard, F.; Shier, W.; Badria, F.; Creppy, E.E. Cytotoxicity of fumonisin B1: Implication of lipid peroxidation and inhibition of protein and DNA syntheses. Arch. Toxicol. 1998, 72, 233–236. [Google Scholar] [CrossRef] [PubMed]
- Abid-Essefi, S.; Ouanes, Z.; Hassen, W.; Baudrimont, I.; Creppy, E.; Bacha, H. Cytotoxicity, inhibition of DNA and protein syntheses and oxidative damage in cultured cells exposed to zearalenone. Toxicol. In Vitro 2004, 18, 467–474. [Google Scholar] [CrossRef] [PubMed]
- Lee, J.-K.; Choi, E.H.; Lee, K.-G.; Chun, H.S. Alleviation of aflatoxin B1-induced oxidative stress in HepG2 cells by volatile extract from Allii Fistulosi Bulbus. Life Sci. 2005, 77, 2896–2910. [Google Scholar] [CrossRef] [PubMed]
- El Ghissassi, F.; Barbin, A.; Nair, J.; Bartsch, H. Formation of 1,N6-ethenoadenine and 3,N4-ethenocytosine by lipid peroxidation products and nucleic acid bases. Chem. Res. Toxicol. 1995, 8, 278–283. [Google Scholar] [CrossRef] [PubMed]
- Raney, K.D.; Meyer, D.J.; Ketterer, B.; Harris, T.M.; Guengerich, F.P. Glutathione conjugation of aflatoxin B1 exo-and endo-epoxides by rat and human glutathione S-transferases. Chem. Res. Toxicol. 1992, 5, 470–478. [Google Scholar] [CrossRef] [PubMed]
- Ames, B.N.; McCann, J.; Yamasaki, E. Methods for detecting carcinogens and mutagens with the Salmonella/mammalian-microsome mutagenicity test. Mutat. Res./Environ. Mutagen. Relat. Subj. 1975, 31, 347–363. [Google Scholar] [CrossRef]
- Punvittayagul, C.; Sringarm, K.; Chaiyasut, C.; Wongpoomchai, R. Mutagenicity and antimutagenicity of hydrophilic and lipophilic extracts of thai northern purple rice. Asian Pac. J. Cancer Prev. 2013, 15, 9517–9522. [Google Scholar] [CrossRef]
- Wong, J.J.; Hsieh, D. Mutagenicity of aflatoxins related to their metabolism and carcinogenic potential. Proc. Natl. Acad. Sci. USA 1976, 73, 2241–2244. [Google Scholar] [CrossRef] [PubMed]
- Fairbairn, D.W.; Olive, P.L.; OʼNeill, K.L. The comet assay: A comprehensive review. Mutat. Res./Rev. Genet. Toxicol. 1995, 339, 37–59. [Google Scholar] [CrossRef]
- Gedik, C.; Ewen, S.; Collins, A. Single-cell Gel electrophoresis applied to the analysis of UV-C damage and its repair in human cells. Int. J. Radiat. Biol. 1992, 62, 313–320. [Google Scholar] [CrossRef] [PubMed]
- Miyata, M.; Takano, H.; Guo, L.Q.; Nagata, K.; Yamazoe, Y. Grapefruit juice intake does not enhance but rather protects against aflatoxin B1-induced liver DNA damage through a reduction in hepatic CYP3A activity. Carcinogenesis 2004, 25, 203–209. [Google Scholar] [CrossRef] [PubMed]
- Horwitz, W. Official Methods of Analysis of AOAC International; AOAC International: Gaithersburg, MD, USA, 2000. [Google Scholar]
- Mosmann, T. Rapid colorimetric assay for cellular growth and survival: Application to proliferation and cytotoxicity assays. J. Immunol. Methods 1983, 65, 55–63. [Google Scholar] [CrossRef]
- Buege, J.A.; Aust, S.D. Microsomal lipid peroxidation. Methods Enzymol. 1978, 52, 302–310. [Google Scholar] [PubMed]
- Bradford, M.M. A rapid and sensitive method for the quantitation of microgram quantities of protein utilizing the principle of protein-dye binding. Anal. Biochem. 1976, 72, 248–254. [Google Scholar] [CrossRef]
- Eyer, P.; Podhradský, D. Evaluation of the micromethod for determination of glutathione using enzymatic cycling and Ellmanʼs reagent. Anal. Biochem. 1986, 153, 57–66. [Google Scholar] [CrossRef]
- Kado, N.Y.; Guirguis, G.N.; Flessel, C.P.; Chan, R.C.; Chang, K.I.; Wesolowski, J.J. Mutagenicity of fine (<2.5 µm) airborne particles: Diurnal variation in community air determined by a Salmonella micro preincubation (microsuspension) procedure. Environ. Mutagen. 1986, 8, 53–66. [Google Scholar]
- Maron, D.M.; Ames, B.N. Revised methods for the Salmonella mutagenicity test. Mutat. Res./Environ. Mutagen. Relat. Subj. 1983, 113, 173–215. [Google Scholar] [CrossRef]
- Lowry, O.H.; Rosebrough, N.J.; Farr, A.L.; Randall, R.J. Protein measurement with the Folin phenol reagent. J. Biol. Chem. 1951, 193, 265–275. [Google Scholar] [PubMed]
- Kim, B.S.; Margolin, B.H. Statistical methods for the Ames Salmonella assay: A review. Mutat. Res./Rev. Mutat. Res. 1999, 436, 113–122. [Google Scholar] [CrossRef]
- Tice, R.; Agurell, E.; Anderson, D.; Burlinson, B.; Hartmann, A.; Kobayashi, H.; Miyamae, Y.; Rojas, E.; Ryu, J.; Sasaki, Y.; et al. Single cell Gel/comet assay: Guidelines for in vitro and in vivo genetic toxicology testing. Environ. Mol. Mutagen. 2000, 35, 206–221. [Google Scholar] [CrossRef]
- Jones, K.H.; Senft, J.A. An improved method to determine cell viability by simultaneous staining with fluorescein diacetate-propidium iodide. J. Histochem. Cytochem. 1985, 33, 77–79. [Google Scholar] [CrossRef] [PubMed]
- SAS/STAT Userʼs Guide, Version 8. Available online: http://www.okstate.edu/sas/v8/saspdf/stat/pdfidx.htm (accessed on 21 October 2015).
© 2015 by the authors; licensee MDPI, Basel, Switzerland. This article is an open access article distributed under the terms and conditions of the Creative Commons Attribution license (http://creativecommons.org/licenses/by/4.0/).
Share and Cite
Jardon-Xicotencatl, S.; Díaz-Torres, R.; Marroquín-Cardona, A.; Villarreal-Barajas, T.; Méndez-Albores, A. Detoxification of Aflatoxin-Contaminated Maize by Neutral Electrolyzed Oxidizing Water. Toxins 2015, 7, 4294-4314. https://doi.org/10.3390/toxins7104294
Jardon-Xicotencatl S, Díaz-Torres R, Marroquín-Cardona A, Villarreal-Barajas T, Méndez-Albores A. Detoxification of Aflatoxin-Contaminated Maize by Neutral Electrolyzed Oxidizing Water. Toxins. 2015; 7(10):4294-4314. https://doi.org/10.3390/toxins7104294
Chicago/Turabian StyleJardon-Xicotencatl, Samantha, Roberto Díaz-Torres, Alicia Marroquín-Cardona, Tania Villarreal-Barajas, and Abraham Méndez-Albores. 2015. "Detoxification of Aflatoxin-Contaminated Maize by Neutral Electrolyzed Oxidizing Water" Toxins 7, no. 10: 4294-4314. https://doi.org/10.3390/toxins7104294
APA StyleJardon-Xicotencatl, S., Díaz-Torres, R., Marroquín-Cardona, A., Villarreal-Barajas, T., & Méndez-Albores, A. (2015). Detoxification of Aflatoxin-Contaminated Maize by Neutral Electrolyzed Oxidizing Water. Toxins, 7(10), 4294-4314. https://doi.org/10.3390/toxins7104294