Article

Verotoxin A Subunit Protects Lymphocytes and T Cell Lines against X4 HIV Infection in Vitro

1
Department of Biochemistry, University of Toronto, Ontario M5G 1X8, Canada
2
Division of Molecular Structure and Function and Research Institute, The Hospital for Sick Children, Ontario M5G 1X8, Canada
3
Canadian Blood Services, Toronto, Ontario M5G 2M1, Canada
4
Laboratory Medicine & Pathology, University of Toronto, Ontario M5G 1X8, Canada
5
Department of Medical Biophysics & Pharmaceutical Sciences, University of Toronto, Ontario M5G 1X8, Canada
6
Sunnybrook Research Institute, Sunnybrook Health Science Centre, Toronto M4N 3M5, Canada
7
Department of Medicine, University of Toronto, Ontario M5G 1X8, Canada
8
Division of Cell and Molecular Biology, Toronto General Research Institute of the University Health Network, Toronto, Ontario M5G 2M9, Canada
*
Author to whom correspondence should be addressed.
Toxins 2012, 4(12), 1517-1534; https://doi.org/10.3390/toxins4121517
Submission received: 22 October 2012 / Revised: 24 November 2012 / Accepted: 6 December 2012 / Published: 14 December 2012
(This article belongs to the Special Issue Novel Properties of Well-Characterized Toxins)

Abstract

:
Our previous genetic, pharmacological and analogue protection studies identified the glycosphingolipid, Gb3 (globotriaosylceramide, Pk blood group antigen) as a natural resistance factor for HIV infection. Gb3 is a B cell marker (CD77), but a fraction of activated peripheral blood mononuclear cells (PBMCs) can also express Gb3. Activated PBMCs predominantly comprise CD4+ T-cells, the primary HIV infection target. Gb3 is the sole receptor for Escherichia coli verotoxins (VTs, Shiga toxins). VT1 contains a ribosome inactivating A subunit (VT1A) non-covalently associated with five smaller receptor-binding B subunits. The effect of VT on PHA/IL2-activated PBMC HIV susceptibility was determined. Following VT1 (or VT2) PBMC treatment during IL2/PHA activation, the small Gb3+/CD4+ T-cell subset was eliminated but, surprisingly, remaining CD4+ T-cell HIV-1IIIB (and HIV-1Ba-L) susceptibility was significantly reduced. The Gb3-Jurkat T-cell line was similarly protected by brief VT exposure prior to HIV-1IIIB infection. The efficacy of the VT1A subunit alone confirmed receptor independent protection. VT1 showed no binding or obvious Jurkat cell/PBMC effect. Protective VT1 concentrations reduced PBMC (but not Jurkat cell) proliferation by 50%. This may relate to the mechanism of action since HIV replication requires primary T-cell proliferation. Microarray analysis of VT1A-treated PBMCs indicated up regulation of 30 genes. Three of the top four were histone genes, suggesting HIV protection via reduced gene activation. VT blocked HDAC inhibitor enhancement of HIV infection, consistent with a histone-mediated mechanism. We speculate that VT1A may provide a benign approach to reduction of (X4 or R5) HIV cell susceptibility.
Keywords:
verotoxin; HIV; AIDS; PBMCs; anergy

1. Introduction

Verotoxin or Shiga-like toxins are a family of AB5 subunit toxins produced by enterohemorrhagic E. coli (EHEC). Gastrointestinal infection with VT producing EHEC is the primary cause of hemolytic uremic syndrome [1]. VT1 and VT2 are 60% homologous but VT2 is associated with more severe clinical disease [2]. VTs belongs to a group of ribosomal inactivating proteins (RIPs) that inhibit protein synthesis in target cells by specifically removing an adenine residue in the 28S rRNA via its N-glycanase activity [3,4]. VTs bind, via their pentameric B subunit array, to their receptor GSL, Gb3 which alone [5] mediates their internalization and retrograde transport to the Golgi and then ER, where the A subunit separates from the holotoxin to be translocated into the cytosol to inhibit protein synthesis and kill the cell [6]. However, without the receptor binding B subunits, the A subunit is non-toxic. Several RIPs have been shown to have anti viral activity [7] but the exact mechanism is not defined.
Ruminant animals naturally harbor EHEC in their digestive system without any harmful effect [8] and benefit from their anti-viral effect. The enzymatic A subunit of VT has been shown to inhibit expression and replication of two bovine retroviruses, bovine leukemia virus (BLV) and bovine immunodeficiency virus (BIV) [9,10,11]. A major characteristic of in vivo BLV infection in bovine PBMCs is spontaneous lymphocyte proliferation in vitro. VT1 treatment has been shown to inhibit this process without any cytotoxic effect or altered response to normal immune stimulants [9]. The catalytic activity of the A subunit is required for the inhibition effect since the catalytically inactive mutant VT1A, E167D, was ineffective. Furthermore, the BLV p24 core protein expression was reduced by VT1A treatment. However, this reduction was only seen in the cell-associated fraction and not in the culture supernatant, which suggests VT1A specifically eliminates BLV infected cells by lysis [12]. Studies with BIV also suggest VT specifically inhibits viral production by inducing apoptosis in infected cells [11]. However, no direct binding of VT to bovine PBMCs or BLV has been detected [11]. Since BLV infected bovine B cells showed greatly increased uptake of macromolecules < 70kDa, the specificity of VT to infected cells is thought to be a result of increased cell membrane permeability caused by viral infection [12].
Human CD4+ T-cells contain a small subpopulation which also express Gb3 [13,14] and Gb3 has been defined as a natural resistance factor against HIV infection [15,16]. The effect of verotoxin on PBMC HIV infection was therefore investigated.

2. Results

2.1. PBMC Antigen Expression

PHA/IL-2-activated PBMCs are over 95% T-cell blasts [17]. This was confirmed using flow cytometry for the PBMC cell cultures used in this study. Freshly isolated PBMCs were activated with PHA/IL-2 for 4 days. Cells were then stained with anti-CD3, anti-CD14 or anti-CD19 antibody for detection of T-cells, monocytes and B cells respectively by FACS. The results (Table 1) showed that over 97% of the cell population was T-cells. Thus, the vast majority of the PBMC cell culture is susceptible to the T-cell-tropic HIV-1IIIB virus. The PBMC cell surface staining was not affected by VT treatment (Table 1). Although only a small percentage (<2%) of CD4+ T-cells co express Gb3 [14] we nevertheless, determined the effect of VT on activated PBMCs and their susceptibility to HIV-1 infection.
Table 1. Fluorescent-activated cell sorting (FACS) analysis of peripheral blood mononuclear cell (PBMC) lymphoid antigen expression.
(a) Markers of PHA/IL-2 activated PBMC lymphoid subsets
Antigen% positive
CD3-T cells97.4
CD14-monocytes2.0
CD19-B cells1.5
(b) Cell surface marker labeling of VT treated PHA/IL-2 activated PBMCs
Treatment%CD3+ve
Untreated97.4
1 µg/mL VT195.7
1 µg/mL VT1A94.2
1 µg/mL VT1B97.9
(c) Effect of VT1A treatment on CD4 positive vs. CD8 positive T cell composition
Treatment% CD3+ T cells *% CD4+ CD3+ T cells *% CD8+ CD3+ T cells *CD4+ CD8+ T cells *
Untreated Control85.141.747.00.9
1 µg/mL VT1A88.143.549.20.9
* Different T cell antigen markers.

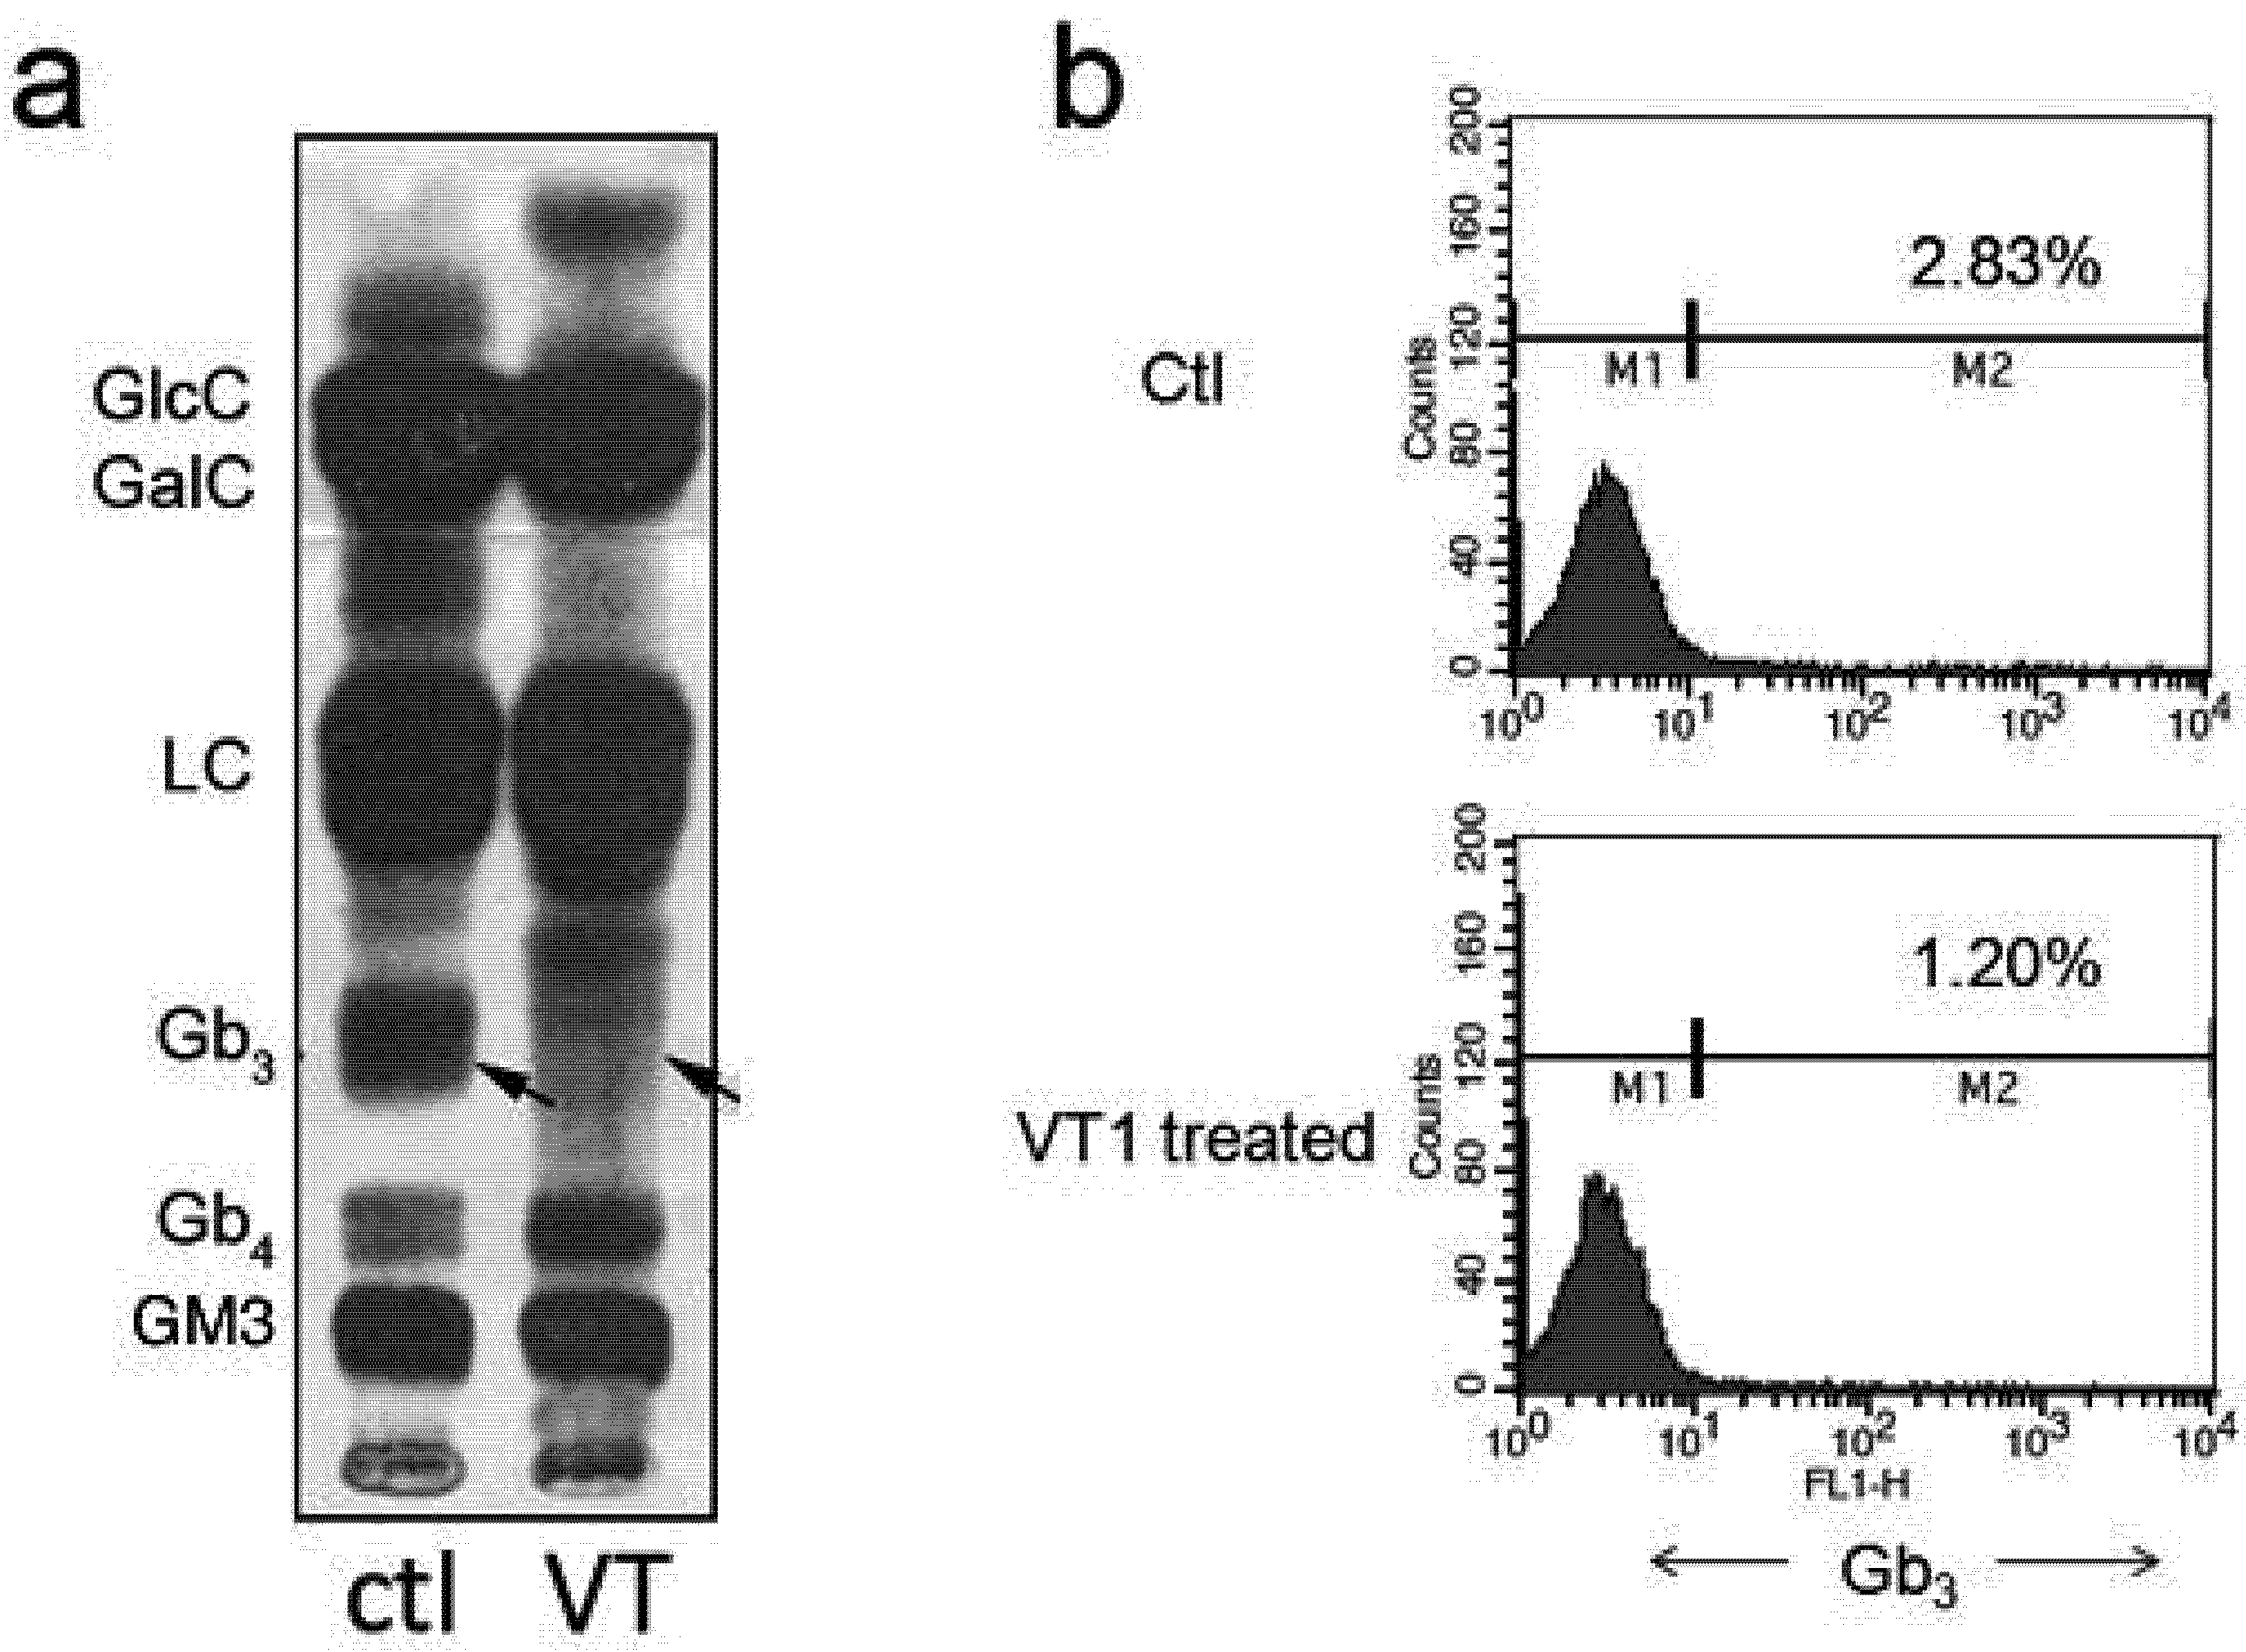
2.2. Metabolic Labeling of PBMC GSLs

Gb3 is the only known receptor for VT, which can trigger the receptor-mediated retrograde transport pathway that results in ribosomal inactivation and cell death. The effect on Gb3 synthesis by activated PBMCs was first determined using 14C-galactose/serine metabolic labeling. Activated PBMCs were treated with or without VT1 and then metabolically labeled with 14C-galactose/serine for 18 h. GSLs were extracted, separated by TLC and detected by autoradiography (Figure 1a). Gb3 was detected as a minor species, which was lost in the VT treated sample, suggesting VT deleted the Gb3-expressing subpopulation in activated PBMCs. Gb3 staining was reduced from 2.8 to 1.2% (Figure 1b). This finding is in agreement with previous results, which showed PHA/IL-2 activation induced Gb3 expression in PBMCs [13], but that only a very small fraction of CD4+ T-cells co express Gb3 [14]. Interestingly, although Gb3 was eliminated, Gb4 was increased in the VT treated PBMCs (Figure 1b).
Figure 1. Gb3 expression in PHA/IL-2 activated PBMCs. (a) PBMCs were treated with 500 ng/mL of Verotoxin-1 (VT1) and activated with PHA/IL-2. On day 2, 2 µCi/mL of 14C-galactose and 0.5 µCi/mL of 14C-serine were added to the cell culture overnight. The cells were then washed once with phosphate-buffered saline (PBS), subjected to total neutral GSL extraction and purified by silica chromatography. GSLs were resolved using TLC and detected by autoradiography. Position of GSL standards, glucosyl ceramide, galactosyl ceramide, lactosyl ceramide, Gb3, Gb4 and GM3 ganglioside, are shown on the left. Lane 1—control untreated PBMCs, lane 2—VT1 treated PBMCs. Arrows indicate Gb3; (b) PBMCs were activated and treated ± VT1 then analyzed for Gb3 expression by FACS staining with Alexa-488-VT1B on day 4. Plots represent Gb3 expression profiles. Negative gate was set using unlabeled control.
Toxins 04 01517 g001
These results are consistent with a small, VT-sensitive population within activated PBMCs. VT elimination of this small population would be unlikely to have significant effect on HIV-1 susceptibility of activated PBMCs; unless, to explain the natural resistance provided by Gb3 this would prove to be a key regulatory cell type.

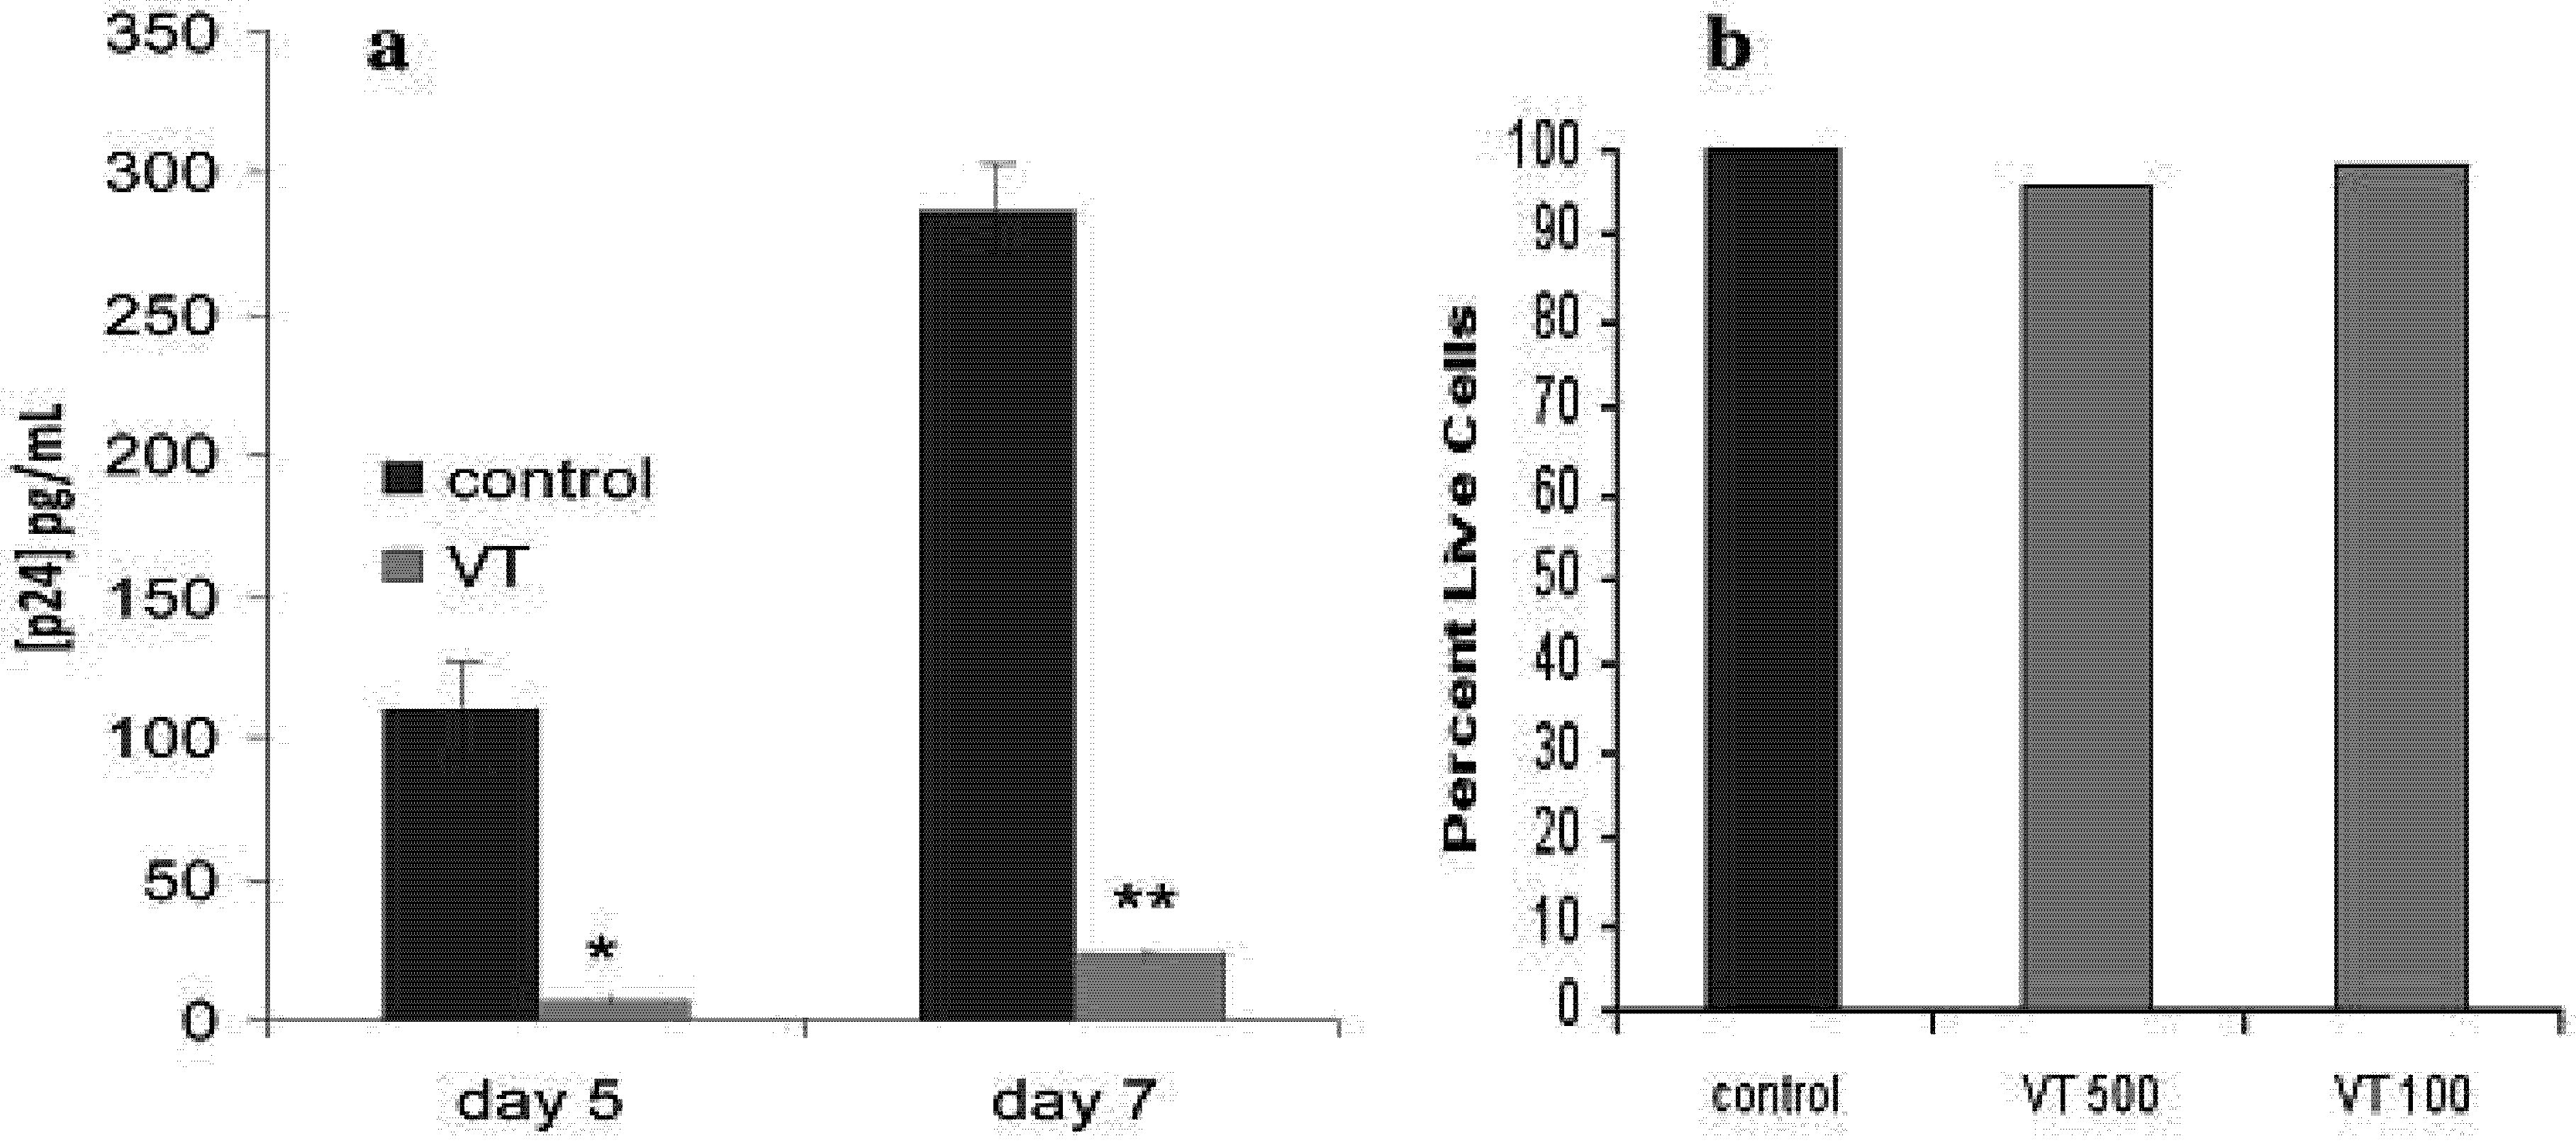
2.3. Effect of VT on HIV PBMC Infection

The effect of VT treatment of PBMCs on HIV susceptibility was unexpected since the HIV target cell population was unaffected by VT1 treatment (Table 1). VT1 treated PBMCs became highly refractory to HIV infection (Figure 2a). Consistent with a minor Gb3 expressing fraction, the viability of VT treated and control PBMCs was equivalent (Figure 2b).
Figure 2. Effect of VT1 on PBMC susceptibility to HIV infection. Panel (a) PBMCs were treated with 500 ng/mL of VT1 and activated with PHA/IL-2 for 3 days. PBMCs were infected with HIV-1IIIB for 1 h, washed and measured by p24gag ELISA after 5 and 7 days. >90% inhibition was observed. Asterisks indicate statistical significance compared to control (* p < 0.05; ** p < 0.03); Panel (b) Cell viability for PBMCs activated in the presence of 500 or 100 ng/mL VT1 was monitored by trypan blue dye exclusion.
Toxins 04 01517 g002

2.4. Comparison of VT Subunits for Protection of PBMCs against HIV Infection

To determine whether the VT1 inhibition of HIV infection was receptor independent, we compared the effect of VT1 with that of the separated VT1A and VT1B subunits. We found that at 1 µg/mL VT1A subunit was as effective as VT1 holotoxin, and that the receptor binding VT1B subunit pentamer was not protective (Figure 3). VT1A subunit protection was dose dependent, showing inhibition of infection at 100 but not 10 ng/mL.
VT1 and protective concentrations of VT1A reduced the proliferation of activated PBMCs (Figure 3c). The HIV infection monitored by p24gag is normalized to the cell number, but the correlation with efficacy implicates reduced cell growth in the mechanism of action.
The reduced PBMC proliferation during PHA/IL2 activation was highly consistent and seen for VT1 and VT1A but not VT1B subunits (Figure 4). The dose response for PBMC was quite different from the toxicity observed for Gb3 expressing cells (Figure 4a cf. c). Although little effect of VT1A on PBMC protein synthesis in the short-term could be detected, treatment for 4 days reduced 3H-leucine incorporation into TCA insoluble material by 50% (not shown). No effect of VT1A on global phosphotyrosine content of activated PBMCs was seen (not shown).
Since we found the verotoxin receptor glycosphingolipid, Gb3, to be a resistance factor for HIV infection in vitro [14,15], we expected that treatment of activated PBMCs with VT1 would eliminate the small fraction of Gb3 expressing cells we have shown to be present and thereby increase susceptibility to subsequent HIV infection. Although this subpopulation was effectively removed by VT1 treatment, the VT1 (or VT2, not shown) treated cells became highly refractory to HIV infection and this was found to be a Gb3/B subunit independent, VT1A subunit-mediated event. Even though the VT1A subunit was removed by cell washing, the activated PBMCs remained resistant to infection.
Figure 3. Verotoxin-1 A subunit protects PHA/IL-2 activated PBMCs against HIV-1IIIB infection. PBMCs were treated with VT1 (1 µg/mL), VT1A (1, 0.1, 0.01 µg/mL) or VT1B (1 µg/mL) during PHA/IL2 activation. HIV-1IIIB infection was conducted 4 days post activation (m.o.i. = 0.3, n = 4). (a) Viral production was measured by p24gag ELISA for day 3, 5 and 7 of infection. Asterisks indicate statistical significance compared to control (* p < 0.05; ** p < 0.03); (b) Viral production over time. All viral production values were normalized by cell count; (c) Viable cell count over time by Trypan blue exclusion. (▼ = control, ♦ = 1 µg/mL VT1, ■ = 1 µg/mLVT1A, ▲ = 0.1 µg/mL VT1A, □ = 0.01 µg/mL VT1A, ● = 1 µg/mL VT1B). A subunit was as effective as holotoxin to induce HIV resistance.
Toxins 04 01517 g003
Figure 4. PBMC proliferation after PHA/IL-2 activation and VT or VT subunit treatment. VT was added to lymphocytes after isolation and remained present during PHA/IL-2 activation. Cell proliferation was measured on day 4 using alamarBlue® fluorescent dye indicator assay. (a) VT1 (▼), VT1A (♦) titration of percentage proliferation compared to no VT control; (b) PBMC samples were collected from 4 different donors and activated in the presence of 1 µg/mL VT1, VT1A or VT1B. Cell number was determined on day 4. (c) Cytotoxcity titration curve using VT sensitive Gb3+ THP-1 monocytic cell line: VT1 (♦), VT1A (■) or VT1B (●). The toxicity of the VT1A indicates a maximum holotoxin contamination of 1/50,000.
Toxins 04 01517 g004

2.5. VT also Inhibits Jurkat T-Cell Infection by HIV-1

The Gb3-negative Jurkat-C human T-cell line is a standard surrogate for primary human T-lymphocyte HIV infection. VT is effective at reducing HIV Jurkat cell infection (Figure 5). As for PBMCs, VT1A subunit was as effective as holotoxin (not shown). Initially cells were preincubated with VT as for the PBMCs (Figure 5a) but this prolonged preincubation proved unnecessary (Figure 5b). An hour preincubation was sufficient for optimal inhibition. Unlike for PBMCs, VT had no effect on Jurkat cell proliferation or viability (Figure 6).
Figure 5. VT treatments of Jurkat-C cells significantly reduce subsequent HIV-1IIIB infection. (a) JKT-C cells were treated for 3 days with VT1 or VT2 (1 µg/mL) and the toxins were removed by washing with culture media prior to infection with HIV-1IIIB (m.o.i. = 0.1). Post infection supernatants were collected at day 7 and HIV-1 viral production was measued by p24gag ELISA (b) A time course was conducted to determine the minimum preincubation time required for VT1 treatment to achieve viral reduction. p24 measured on day 6. Error bar represents standard error mean (n = 4). One hour pretreatment was sufficient.
Toxins 04 01517 g005
Figure 6. Verotoxin is non-toxic to Jurkat-C cells. Cells were treated with different concentrations of VT1 or VT1B in 10× serial dilutions. Cell proliferation was measured by the redox dye alamarBlue®. (a) JKT-C cell viability with 1 μg/mL VT1, VT2, or VT1B treatment for 3 days was measured by Trypan Blue dye exclusion assay. Error bars represent standard error mean (n = 4); (b) JKT-C cells were treated with VT1B (■) or VT1 (♦) for 3 days and proliferation was calculated as percentage of no VT control. One of three similar experiments is shown.
Toxins 04 01517 g006

2.6. Gene Expression Array Analysis of VT1A Treated PHA/IL-2-Activated PBMCs

To further define the effects of VT1A treatment on normal function of PBMCs, gene expression array analysis was conducted. Isolated PBMCs were activated with PHA/IL-2 for 4 days. Test samples were treated with 1 µg/mL of VT1A at the time of activation and control samples were treated with vehicle only (n = 3). Total RNA was extracted using TRIzol® reagent and sent for gene expression array analysis using Human WG-6 Expression BeadChip. Array results were analyzed using the LIMMA algorithm. Genes with an adjusted p value of <0.03 were considered differentially expressed. Table 2 shows the gene changes with p value of <0.1. Overall, the effect of VT1A on PBMC gene expression was highly specific since only 49 genes were significantly affected out of a total of 36,604 genes. 30 genes were up-regulated (0.082%) and 19 genes were down-regulated (0.051%) (Table 2). The most striking finding was that 10 of the upregulated genes (three of the top four) belonged to histone cluster proteins.
Table 2. Differentially expressed genes of VT1A treated PBMCs vs. control PBMCs. Only genes with adjusted p value of less than 0.1 are listed. Fold change represents expression level difference between VT1A treated samples vs. control no VT samples. Positive values indicate an increase and negative values indicate a decrease.
SymbolDefinitionFold Changeadj. p value
HIST1H4Bhistone cluster 1, H4b5.220.000185
HIST1H4Hhistone cluster 1, H4h5.010.000192
SPP1secreted phosphoprotein 1, transcript variant 2−4.500.000192
HIST1H4Fhistone cluster 1, H4f 3.950.000363
INDOindoleamine-pyrrole 2,3 dioxygenase−3.840.000466
CSF2colony stimulating factor 2 (granulocyte-macrophage)3.630.000515
SPP1secreted phosphoprotein 1, transcript variant 1.−3.940.000515
LYZlysozyme (renal amyloidosis)−3.510.000547
GADD45Bgrowth arrest and DNA-damage-inducible, beta 3.430.000547
CCL24chemokine (C-C motif) ligand 24 −3.450.000547
IL9interleukin 9 3.470.000699
IL9interleukin 93.170.00112
TM4SF19transmembrane 4 L six family member 19 −3.110.00112
IL8interleukin 8−3.200.00151
SLC11A1solute carrier family 11 (proton-coupled divalent metal ion transporters), member 1.−3.330.00154
IL1Binterleukin 1, beta−2.780.00317
MMP9matrix metallopeptidase 9−2.730.00358
HIST2H4Ahistone cluster 2, H4a2.710.00569
TAC1tachykinin, precursor 1, transcript variant alpha2.620.00627
PPP1R15Aprotein phosphatase 1, regulatory (inhibitor) subunit 15A 2.600.00627
TYROBPTYRO protein tyrosine kinase binding protein, transcript variant 1.−2.800.00627
GNLYgranulysin, transcript variant NKG5−2.520.00733
OSMoncostatin M 2.490.00758
TM4SF19PREDICTED: transmembrane 4 L six family member 19, transcript variant 2 −2.600.00758
HIST1H2AChistone cluster 1, H2ac 2.490.00972
OR8H2olfactory receptor, family 8, subfamily H, member 22.510.00972
FOSv-fos FBJ murine osteosarcoma viral oncogene homolog 2.580.972
TNFSF4tumor necrosis factor (ligand) superfamily, member 4 2.350.0185
IL8interleukin 8 −2.290.0185
FOSBFBJ murine osteosarcoma viral oncogene homolog B 2.320.0185
HIST1H2BFhistone cluster 1, H2bf 2.340.0220
GNLYgranulysin, transcript variant 519−2.240.0223

2.7. VT1 Blocks HDAC Inhibitor Effect on HIV Infection

Gene activation is required for HIV infection [18]. Histones regulate gene transcription via their acetylation status and histone deacetylase inhibitors have been probed as a means to activate transcription to detect and treat latent HIV provirus transcripts integrated within the target cell genome [19]. A VT1A subunit effect on histone acetylation could provide a basis for its protection against HIV infection. The effect of phenyl butyrate (PBA), a known HDAC inhibitor [20], on VT1 protection against HIV infection was tested (Figure 7).
Figure 7. VT1A counters Histone deacetylase (HDAC) inhibitor effect on PBMC HIV susceptibility. PBMCs were PHA/IL2 activated in the presence of inactivated A subunit containing holotoxin (VT1m), VT1A , phenyl butyrate (PBA) or PBA + VT1A and tested for susceptibility to HIV infection (day 4). Panel (a) X4 HIVIIIB and 6mM PBA, panel (b) X4 HIVIIIB and 1mM PBA, panel (c) R5 HIVBa-L and 1mM PBA ** indicates p < 0.03 (n = 4).
Toxins 04 01517 g007
VT1, but not its A subunit inactivated mutant [21], reduced PBMC susceptibility to HIV, whereas PBA significantly increased infection. Combining VT1 with PBA resulted in a (even more) pronounced protection against infection. Either PBA reversal of VT1 protection or VT1 reversal of PBA enhancement of infection would serve to indicate a shared mechanism of action. VT1 blocking PBA increased HIV susceptibility supports a role for VT promotion of histone deacetylation to reduce gene activation and engender HIV resistance. At the 6 mM concentration used for HDAC inhibition, PBMC proliferation during PHA/IL2 activation was reduced. The experiment was therefore repeated at 1 mM PBA and tested against both X4 (Figure 7b) and R5 (Figure 7c) HIV. At 1mM PBA pretreatment, the stimulation of HIV infection was not maintained but the VT1A inhibition of both X4 and R5 HIV infection was clearly demonstrated.

2.8. Discussion

The verotoxin A subunit is an N-glycanase, removing an adenine base from position 4324 of the 28S RNA of the 60S ribosomal subunit [4] to inhibit protein synthesis and kill the cell. To achieve this, the A subunit must internalize [22], undergo proteolytic cleavage [23], traffic to the ER [24] and translocate into the cytosol [6]. The A subunit can have additional effects, including increasing the half-life of selected mRNAs [25,26] and DNA can be a substrate for the N-glycanase activity [27]. The A subunit can induce apoptosis [28]. However in all these cases, A subunit cytosolic access is dependent on B subunit mediated cell binding and intracellular traffic. A subunit antiviral activity has been reported [11] but prior cell infection was required to increase cell permeability to allow cell entry [28]. In contrast, our studies indicate the A subunit can interact with uninfected cells to induce a state of anergy, resistant to HIV infection.
The A subunit contains hydrophobic residues which can mediate cell interaction [29]. However, we were unable to detect specific VT1A binding to PBMCs and fluid phase micro pinocytosis is the most likely mechanism of VT1A cell entry, but the mechanism for cytosolic access if required, is not obvious. The mechanism of A subunit cell targeting and internalization remains to be determined. Ribosome inactivating proteins have been shown to have anti-HIV activity [7]. These include bacterial toxins [16]. Depurination of HIV-1 RNA long terminal repeats may hinder HIV integration [30]. However, RIPs can also activate the host MAP kinase pathway to counter this and increase infectivity [31]. VT has been shown to activate this pathway [32]. RIP-immunoconjugates have been promoted for HIV intervention [33].
In several animal species, verotoxin has been found to be protective against related retroviral infection [9,34] and the A subunit is toxic to bovine retrovirus infected cells [11], although binding to such cells could not be demonstrated. In these cells, increased permeability of the infected cells was proposed as the selectivity basis.
In the present studies however, the VTA subunit is added to the target human lymphocytes and removed before any HIV infection. There is no change in viability as defined by vital dye exclusion, but growth rate is reduced. Inhibition of “spontaneous lymphocyte proliferation” by VT1A in the bovine was reported [9]. In our studies, PBMC proliferation during activation was clear, though reduced by 50%. PBMC proliferation post HIV infection was <10% control. This inhibition correlated with, but was not proportional to, the degree of inhibition of PBMC proliferation. However, we saw no effect on Jurkat T cell proliferation, so growth inhibition may be downstream of the primary VT effect only in primary lymphocytes. VT treatment during lymphocyte activation induces a form of subsequent T cell anergy. This resistance is effective against both X4 and R5 HIV infection. VT1 increased histones, indicated from our mRNA microarray data, could increase chromatin to decrease gene activation and hence proliferation, to provide the basis of the induced prolonged HIV resistance. HDAC inhibitors are used to facilitate transcription to allow detection of latent HIV virions integrated in the genome [19]. The VT blockade of HDAC inhibitor enhanced HIV infection we observed, is consistent with histone mediated VT1A protection against HIV. The PBA HDAC inhibitor reduced PBMC proliferation during activation, indicating T cell growth reduction per se can be insufficient for HIV resistance.
VT1A reduced T cell division might counteract the excessive T cell proliferation characteristic of early HIV infection [35] and reduced T lymphocyte proliferation might prove a small price to pay for prophylactic HIV resistance.

3. Experimental Section

3.1. Cell Lines

Acute T-cell leukemia-derived Jurkat-FHCRC cells (JKT-C) were obtained from Dr. D. Branch. The human acute monocytic leukemia cells (THP-1) were obtained from NIH AIDS Research and Reference Reagent Program (Rockville, MD, USA). Both cell lines were cultured in complete RPMI1640 medium (Wisent Inc, St-Bruno, QC, USA) supplemented with 10% fetal bovine serum (FBS) (Sigma-Aldrich, Oakville, ON, USA), 100 IU penicillin and 100 µg/mL streptomycin (Wisent Inc., Quebec, Canada) at 37 °C in 5% CO2.

3.2. Isolation and Activation of Peripheral Blood Mononuclear Cells (PBMCs)

PBMCs were prepared as previously described [36]. Briefly, fresh whole blood was collected from healthy donors following informed consent in acid citrate dextrose (ACD). The blood was mixed in a 1:1 ratio with complete RPMI1640 medium and overlaid on Ficoll-Paque PLUS (GE Healthcare AB, Stockholm, Sweden) and centrifuged at 1800 rpm for 45 min. The middle PBMCs layer was washed three times with Dulbecco’s PBS without MgCl2 and CaCl2. Viable PBMCs were re-suspended in complete medium at ~1 × 10⁶ cells per mL. Phytohemagglutinin (PHA) and interleukin-2 (IL2) were added to freshly isolated PBMCs to a final concentration of 5 µg/mL and 100 U/mL respectively and cells cultured at 37 °C in 5% CO2 for 4 days.

3.3. HIV Infection

HIV-1IIIB and R5 HIV-1Ba-L were from the National Institutes of Health AIDS Research and Reference Reagent Program, Division of AIDS, National Institute of Allergy and Infectious Diseases. In the Level 3 containment facility at the University of Toronto, HIV-1IIIB viral stocks were grown in JKT-C cells, and multiplicity of infection (m.o.i.) was determined as described using MT-4 cells [13]. HIV-1Ba-L viral stocks were grown in PBMCs, and infectious dose calculated from total p24gaglevels [16]. Infection of cells was as previously described [13,16]. Briefly, 5 × 10⁵ cells were incubated with HIV-1 (m.o.i. = 0.1) for 1 h at 37 °C, the cells washed three times with phosphate-buffered saline (PBS), and cultured in complete medium (containing IL-2 (100 U/mL) for PBMCs). Culture supernatant aliquots were taken over time to determine viral production by ELISA to measure p24gagantigen levels.

3.4. Preparation of VT1 and VT2

Verotoxin-1 (VT1) and Verotoxin-2 (VT2) were purified as described [37]. VT1B subunit was purified from E coli strain JB120 [38]. Recombinant VT1A subunit was obtained by HPLC separation of the denatured toxin [39]. Alexa 488-VT1B was prepared in our lab using Alexafluor-488 tetrafluorophenyl (TFP) ester (Invitrogen, Burlington, ON, Canada) according to product manual.

3.5. Cytotoxicity Assay

Target cells ~ 105 cells in 200 µL were dispensed into microtiter plate wells. 200 µL VT1, VT2, VT1A or VT1B solution was added in 10-fold serial dilutions. Cells were incubated for 4 days at 37 °C in 5% CO2. On day 4, cell proliferation was quantified using alamarBlue® assay. The fluorescence was measured using 540 nm excitation wavelength and read at 590 nm emission wavelength using Spectra MAX plate reader, Gemini EM (Molecular Devices, Toronto, ON, Canada). Proliferation was calculated as a percentage in comparison to no VT control (100%).

3.6. Protein Synthesis

3H-leucine incorporation was used to assess VT effect on nascent protein synthesis. ~6 × 10⁵ Cells were incubated in leucine-free DMEM media without serum (Specialty media, Phillipsburg, NJ, USA) for 3 h. Jurkat-C and THP-1 cells were treated with 1 µg/mL VT1, VT1A or no VT for 3 h. PBMCs were treated with 1 µg/mL VT1A for 4 days during activation or for 3 h on day 4 of activation. 5 µCi of 3H-leucine (Amersham Biosciences, Buckinghamshire, UK) were added for incorporation at 37 °C for 30 min. Cells were washed 3 times with PBS and 10% trichloroacetic acid was used to precipitate protein. The protein pellet was suspended in scintillation fluid. Incorporation was quantitated using a beta-counter (Beckman LS6500, Bioanalytical Systems Group, Mississauga, ON, USA). Alternatively cell pellets were lysed and resolved by 12% reducing SDS-PAGE gel, and proteins detected by autoradiography.

3.7. Flow Cytometry

Fluorescent-activated cell sorting (FACS) was used to detect cell surface receptors on PBMCs. Approximately 5 × 10⁵ cells were incubated in 100 μL of 10% mouse serum (Sigma-Aldrich, Oakville, ON, Canada) in FACS buffer (PBS, 2% FBS, 0.1% sodium Azide, 5 mM EDTA) at 4 °C for 30 min to block Fc receptors and non-specific binding. After spinning at 2000 rpm (Micromax, Buckinghamshire, UK) the cell pellets were then re-suspended in 100 μL of FACS buffer containing 1 μg of mouse anti-human CD3-FITC IgG2aκ, CD14-APC IgG2aκ or CD19-PE IgG1κ antibody and incubated at 4 °C for 30 min in the dark. FITC mouse IgG2aκ, PE mouse IgG1κ and APC mouse IgG2aκ were used as negative controls for gating. All antibodies above were purchased from BD Pharmingen, San Diego, CA, USA. Cells were then pelleted and washed once with fresh FACS buffer and then diluted in 500 μL of FACS buffer for data collection and analyses using a FACS Calibur Analyzer or Becton Dickinson LSRII (Flow cytometry facility, Toronto MarS Building) equipped with Cell Quest® or FACSDeva® 3.0 software. For CXCR4 staining a panel of three antibodies was used. Cells were blocked with 10% normal goat serum (Vector Laboratories Inc, Burlingame, CA, USA) then incubated with 0.5 μg ofmouse anti-human CXCR4 primary antibodies: 12G5 (Bioscience, San Diego, CA, USA), MAB 173 (NIH AIDS), or MAB171 (R&D systems, Burlington, ON, USA) in 100 μL FACS buffer. After washing once with FACS buffer, the cells were incubated with 0.3 μg of secondary goat anti-mouse-Alexa-488 antibody (Invitrogen, Burlington, ON, Canada) in 100 μL FACS buffer for 30 min at 4 °C in the dark. A sample stained with secondary antibody only was used as negative control. For Gb3 labeling, cells were directly labeled with 5 μg/mL VT1B-Alexa 488 for 30 min at 4 °C in the dark.

3.8. RNA Extraction

Freshly isolated PBMCs were activated with PHA/IL-2 and grown either with 1 μg/mL VT1A or no VT as control for 4 days. Cells were collected for total RNA extraction using TRIzol® reagent (Invitrogen, Burlington, ON, Canada). Approximately 5~10 × 106 cells were lysed by repetitively pipetting with 1mL of TRIzol followed by 5 min incubation at RT. 0.2 mL of chloroform was added and the sample was shaken vigorously for 15 s. After 3 min of incubation at RT the sample was centrifuged at 11,000g for 10 min at 2 °C. The white interphase was collected and incubated with 0.5 mL isopropyl alcohol for 10 min at RT. The precipitated RNA was centrifuged as before, washed once with 75% ethanol and centrifuged at 7500g for 5 min at 4 °C. RNA was re-dissolved in 0.01% diethylpyrocarbonate at 55 °C for 20 min. Concentration was determined by measuring A260 and quality of RNA was assessed by having an A260/A280 ratio of ~2 [40]. Samples were stored at −80 °C until further analysis.

3.9. Human Gene Expression Array Analysis

Purified total RNA samples were submitted to The Centre for Applied Genomics (TCAG, The Hospital for Sick Children Research Institute) for human gene expression array analysis. Total RNA was treated and amplified using the Illlumina® TotalPrepTM-96 RNA Amplification Kit (Ambion, Auston, TX, USA). Total RNA was first reverse transcribed into single stranded cDNA. Then the second DNA strand was synthesized and the double stranded cDNA was purified using magnetic beads. The dsDNA was transcribed into Biotin-labeled cRNA in vitro. Finally, the resulting cRNA was purified by capturing with RNA binding beads.
Human WG-6 Expression BeadChip from Illumina® (San Diego, CA, USA) was used as the array platform. The results were analyzed at the Statistical Analysis Core Facility (The Hospital for Sick Children Research Institute, Toronto, ON, USA) with the assistance of Dr. Pingzho Hu.

3.10. Statistics

For microarray analysis, background correction was done with BeadStudio software (Illumina). The quantile normalization method implemented in lumi R package was used to normalize the data quantiles [41]. Differentially expressed genes were identified using LIMMA (linear models for microarray data) [42]. Briefly, a linear model was fitted for each gene in the data, and then an empirical Bayes (EB) method was used to moderate the standard errors for estimating the moderated t-statistics for each gene, which reduced the standard errors towards a common value. The corresponding p-values for the t-statistics were adjusted using the multiple testing procedure. Differentially expressed genes were identified by having a fold change >2 and adjusted p-value < 0.03.
HIV-1 infection p24gag ELISA data and VT cytotoxicity assays were represented as the mean of several separate experiments, where n values are indicated in the Figure legends. Error bars represent standard error of the mean (+/− SEM). A two-tailed student’s t-test was performed where appropriate and p-values less than 0.05 were considered significant (*) and p-values less than 0.03 were considered highly significant (**).

4. Conclusions

The ribosome inactivating A subunit of verotoxin induces resistance to subsequent X4/R5 HIV-1 exposure in primary human T-lymphocytes and the Jurkat T cell line, independent of the B subunit and Gb3 receptor binding of the holotoxin. Reduced primary T cell proliferation post infection correlates with inhibition of infection.

Acknowledgements

This work has been supported by Canadian Foundation for AIDS Research (CANFAR), Ontario HIV Treatment Network (OHTN) and Mitacs in partnership with Lisi Therapeutics Inc.

Conflict of Interest

The authors declare no conflict of interest.

References

  1. Zoja, C.; Buelli, S.; Morigi, M. Shiga toxin-associated hemolytic uremic syndrome: Pathophysiology of endothelial dysfunction. Pediatr. Nephrol. 2010, 25, 2231–2240. [Google Scholar] [CrossRef]
  2. Karch, H.; Friedrich, A.W.; Gerber, A.; Zimmerhackl, L.B.; Schmidt, M.A.; Bielaszewska, M. New aspects in the pathogenesis of enteropathic hemolytic uremic syndrome. Semin. Thromb. Hemost. 2006, 32, 105–112. [Google Scholar] [CrossRef]
  3. Endo, Y.; Tsurugi, K.; Yutsudo, T.; Takeda, Y.; Ogasawara, T.; Igarashi, K. Site of the action of a vero toxin (VT2) from Escherichia coli O157:H7 and a Shiga toxin on eukaryotic ribosomes. Eur. J. Biochem. 1988, 171, 45–50. [Google Scholar] [CrossRef]
  4. Saxena, S.K.; O’Brien, A.D.; Ackerman, E.J. Shiga toxin, Shiga-like toxin II variant, and ricin are all single-site RNA N-glycosidases of 28 S RNA when microinjected into Xenopus oocytes. J. Biol. Chem. 1989, 264, 596–601. [Google Scholar]
  5. Okuda, T.; Tokuda, N.; Numata, S.; Ito, M.; Ohta, M.; Kawamura, K.; Wiels, J.; Urano, T.; Tajima, O.; Furukawa, K.; Furukawa, K. Targeted disruption of Gb3/CD77 synthase gene resulted in the complete deletion of globo-series glycosphingolipids and loss of sensitivity to verotoxins. J. Biol. Chem. 2006, 281, 10230–10235. [Google Scholar]
  6. Tam, P.; Lingwood, C. Membrane-cytosolic translocation of Verotoxin A1-subunit in target cells. Microbiol 2007, 153, 2700–2710. [Google Scholar] [CrossRef]
  7. Huang, C.Y.; Thayer, D.A.; Chang, A.Y.; Best, M.D.; Hoffmann, J.; Head, S.; Wong, C.-H. Carbohydrate microarray for profiling the antibodies interacting with Globo H tumor antigen. Proc. Natl. Acad. Sci. USA 2006, 103, 15–20. [Google Scholar]
  8. Beutin, L.; Geier, D.; Steinruck, H.; Zimmermann, S.; Scheutz, F. Prevalence and some properties of verotoxin (Shiga-like toxin)-producing Escherichia coli in seven different species of healthy domestic animals. J. Clin. Microbiol. 1993, 31, 2483–2488. [Google Scholar]
  9. Ferens, W.A.; Hovde, C.J. Antiviral activity of shiga toxin 1: Suppression of bovine leukemia virus-related spontaneous lymphocyte proliferation. Infect. Immun. 2000, 68, 4462–4469. [Google Scholar] [CrossRef]
  10. Ferens, W.A.; Halver, M.; Gustin, K.E.; Ott, T.; Hovde, C.J. Differential sensitivity of viruses to the antiviral activity of Shiga toxin 1 A subunit. Virus Res. 2007, 125, 104–108. [Google Scholar] [CrossRef]
  11. Ferens, W.A.; Hovde, C.J. The non-toxic A subunit of Shiga toxin type 1 prevents replication of bovine immunodeficiency virus in infected cells. Virus Res. 2007, 125, 29–41. [Google Scholar] [CrossRef]
  12. Basu, I.; Ferens, W.A.; Stone, D.M.; Hovde, C.J. Antiviral activity of shiga toxin requires enzymatic activity and is associated with increased permeability of the target cells. Infect. Immun. 2003, 71, 327–334. [Google Scholar] [CrossRef]
  13. Lund, N.; Branch, D.R.; Mylvaganam, M.; Chark, D.; Ma, X.Z.; Sakac, D.; Binnington, B.; Fantini, J.; Puri, A.; Blumenthal, R.; Lingwood, C.A. A novel soluble mimic of the glycolipid globotriaosylceramide inhibits HIV infection. AIDS 2006, 20, 333–343. [Google Scholar] [CrossRef]
  14. Kim, M.; Binnington, B.; Sakac, D.; Lingwood, C.A.; Branch, D.R. CD4+ T-cells are unable to express the HIV natural resistance factor, globotriosylceramide. 2012. submitted for publication. [Google Scholar]
  15. Ramkumar, S.; Sakac, D.; Binnington, B.; Branch, D.R.; Lingwood, C.A. Induction of HIV resistance: Cell susceptibility to infection is an inverse function of globotriaosyl ceramide levels. Glycobiology 2009, 19, 76–82. [Google Scholar]
  16. Lund, N.; Olsson, M.L.; Ramkumar, S.; Sakac, D.; Yahalom, V.; Levene, C.; Hellberg, A.; Ma, X.Z.; Binnington, B.; et al. The human Pk histo-blood group antigen provides protection against HIVinfection. Blood 2009, 113, 4980–4991. [Google Scholar] [CrossRef]
  17. Branch, D.; Mills, G. pp60c-src expression is induced by activation of normal human T lymphocytes. J. Immunol. 1995, 154, 3678–3685. [Google Scholar]
  18. Zhang, D.; Murakami, A.; Johnson, R.P.; Sui, J.; Cheng, J.; Bai, J.; Marasco, W.A. Optimization of ex vivo activation and expansion of macaque primary CD4-enriched peripheral blood mononuclear cells for use in anti-HIV immunotherapy and gene therapy strategies. J. Acquir. Immune Defic. Syndr. 2003, 32, 245–254. [Google Scholar] [CrossRef]
  19. Margolis, D.M. Histone deacetylase inhibitors and HIV latency. Curr. Opin. HIV AIDS 2 0011, 6, 25–29. [Google Scholar] [CrossRef]
  20. Pontiki, E.; Hadjipavlou-Litina, D. Histone deacetylase inhibitors (HDACIs). Structure—Activity relationships: History and new QSAR perspectives. Med. Res. Rev. 2012, 32, 1–165. [Google Scholar] [CrossRef]
  21. Wen, S.X.; Teel, L.D.; Judge, N.A.; O’Brien, A.D. Genetic toxoids of Shiga toxin types 1 and 2 protect mice against homologous but not heterologous toxin challenge. Vaccine 2006, 24, 1142–1148. [Google Scholar] [CrossRef]
  22. Khine, A.A.; Lingwood, C.A. Capping and receptor mediated endocytosis of cell bound verotoxin(Shiga-like toxin) 1; Chemical identification of an amino acid in the B subunit necessary for efficient receptor glycolipid binding and cellular internalization. J. Cell. Physiol. 1994, 161, 319–332. [Google Scholar] [CrossRef]
  23. van Deurs, B.; Sandvig, K. Furin-induced cleavage and activation of Shiga toxin. J. Biol. Chem. 1995, 270, 10817–10821. [Google Scholar] [CrossRef]
  24. Sandvig, K.; Bergan, J.; Dyve, A.B.; Skotland, T.; Torgersen, M.L. Endocytosis and retrograde transport of Shiga toxin. Toxicon 2010, 56, 1181–1185. [Google Scholar] [CrossRef]
  25. Bitzan, M.M.; Wang, Y.; Lin, J.; Marsden, P.A. Verotoxin and ricin have novel effects on preproendothelin-1 expression but fail to modify nitric oxide synthase (ecNOS) expression and NO production in vascular endothelium. J. Clin. Invest. 1998, 101, 372–382. [Google Scholar] [CrossRef]
  26. Petruzziello-Pellegrini, T.N.; Yuen, D.A.; Page, A.V.; Patel, S.; Soltyk, A.M.; Matouk, C.C.; Wong, D.K.; Turgeon, P.J.; Fish, J.E.; Ho, J.J.; et al. The CXCR4/CXCR7/SDF-1 pathway contributes to the pathogenesis of Shiga toxin-associated hemolytic uremic syndrome in humans and mice. J. Clin. Invest. 2012, 122, 759–776. [Google Scholar] [CrossRef]
  27. Brigotti, M.; Alfieri, R.; Sestili, P.; Bonelli, M.; Petronini, P.G.; Guidarelli, A.; Barbieri, L.; Stirpe, F.; Sperti, S.; et al. Damage to nuclear DNA induced by Shiga toxin 1 and ricin in human endothelial cells. FASEB J. 2002, 16, 365–372. [Google Scholar] [CrossRef]
  28. Tesh, V.L. Induction of apoptosis by Shiga toxins. Future Microbiol. 2010, 5, 431–453. [Google Scholar] [CrossRef]
  29. Brigotti, M.; Carnicelli, D.; Arfilli, V.; Rocchi, L.; Ricci, F.; Pagliaro, P.; Tazzari, P.L.; Vara, A.G.; Amelia, M.; Manoli, F.; Monti, S. Change in conformation with reduction of alpha-helix content causes loss of neutrophil binding activity in fully cytotoxic Shiga toxin 1. J. Biol. Chem. 2011, 286, 34514–34521. [Google Scholar]
  30. Li, H.G.; Huang, P.L.; Zhang, D.; Sun, Y.; Chen, H.C.; Zhang, J.; Huang, P.L.; Kong, X.P.; Lee-Huang, S. A new activity of anti-HIV and anti-tumor protein GAP31: DNA adenosine glycosidase—Structural and modeling insight into its functions. Biochem. Biophys. Res. Commun. 2010, 391, 340–345. [Google Scholar] [CrossRef]
  31. Mansouri, S.; Kutky, M.; Hudak, K.A. Pokeweed antiviral protein increases HIV-1 particle infectivity by activating the cellular mitogen activated protein kinase pathway. PLOS One 2012, 7, e36369. [Google Scholar]
  32. Ikeda, M.; Gunji, Y.; Yamasaki, S.; Takeda, Y. Shiga toxin activates p38 MAP kinase through cellular Ca2+ increase in Vero cells. FEBS Lett. 2000, 485, 94–98. [Google Scholar] [CrossRef]
  33. Uckun, F.M.; Bellomy, K.; O’Neill, K.; Messinger, Y.; Johnson, T.; Chen, C.L. Toxicity, biological activity, and pharmacokinetics of TXU (anti-CD7)-pokeweed antiviral protein in chimpanzees and adult patients infected with human immunodeficiency virus. J. Pharmacol. Exp. Ther. 1999, 291, 1301–1307. [Google Scholar]
  34. Ferens, W.A.; Haruna, J.; Cobbold, R.; Hovde, C.J. Low numbers of intestinal Shiga toxin-producing E. coli correlate with a poor prognosis in sheep infected with bovine leukemia virus. J. Vet. Sci. 2008, 9, 375–379. [Google Scholar] [CrossRef]
  35. Ferrando-Martínez, S.; Ruiz-Mateos, E.; Romero-Sánchez, M.C.; Muñoz-Fernández, M.Á.; Viciana, P.; Genebat, M.; Leal, M. HIV infection-related premature immunosenescence: High rates of immune exhaustion after short time of infection. Curr. HIV Res. 2011, 9, 289–294. [Google Scholar] [CrossRef]
  36. Lund, N.; Branch, D.R.; Sakac, D.; Lingwood, C.A.; Siatskas, C.; Robinson, C.J.; Brady, R.O.; Medin, J.A. Lack of susceptibility of cells from patients with fabry disease to infection with R5 human immunodeficiency virus. AIDS 2005, 19, 1543–1546. [Google Scholar] [CrossRef]
  37. Rutjes, N.; Binnington, B.; Smith, C.; Maloney, M.; Lingwood, C. Differential tissue targeting and pathogenesis of verotoxins 1 and 2 in the mouse animal model. Kid. Int. 2002, 62, 832–845. [Google Scholar] [CrossRef]
  38. Ramotar, K.; Boyd, B.; Tyrrell, G.; Gariepy, J.; Lingwood, C.; Brunton, J. Characterization of Shiga-like toxin I B subunit purified from overproducing clones of the SLT-I B cistron. Biochem. J. 1990, 272, 805–811. [Google Scholar]
  39. Head, S.; Karmali, M.; Lingwood, C.A. Preparation of VT1 and VT2 hybrid toxins from their purified dissociated subunits: Evidence for B subunit modulation of A subunit function. J. Biol. Chem. 1991, 266, 3617–3621. [Google Scholar]
  40. Cathala, G.; Savouret, J.F.; Mendez, B.; West, B.L.; Karin, M.; Martial, J.A.; Baxter, J.D. A method for isolation of intact, translationally active ribonucleic acid. DNA 1983, 2, 329–335. [Google Scholar] [CrossRef]
  41. Du, P.; Kibbe, W.A.; Lin, S.M. lumi: A pipeline for processing Illumina microarray. Bioinformatics 2008, 24, 1547–1548. [Google Scholar] [CrossRef]
  42. Smyth, G.K. Linear models and empirical bayes methods for assessing differential expression in microarray experiments. Stat. Appl. Genet. Mol. Biol. 2004, 3, le3. [Google Scholar]

