Effect of Acrylamide and Mycotoxins in SH-SY5Y Cells: A Review


Laboratory of Food Chemistry and Toxicology, Faculty of Pharmacy and Food Science, University of Valencia, Av. Vicent Andrés Estellés s/n, Burjassot, 46100 València, Spain
*
Author to whom correspondence should be addressed.
Toxins 2024, 16(2), 87; https://doi.org/10.3390/toxins16020087
Submission received: 21 November 2023
/
Revised: 30 January 2024
/
Accepted: 4 February 2024
/
Published: 6 February 2024
(This article belongs to the Special Issue Novel Approaches in Mycotoxins Research: Detection, Prevention and Mode of Action)
Abstract
:Thermal processes induce the formation of undesired toxic components, such as acrylamide (AA), which has been shown to induce brain toxicity in humans and classified as Group 2A by the International Agency of Research in Cancer (IARC), as well as some mycotoxins. AA and mycotoxins’ toxicity is studied in several in vitro models, including the neuroblastoma cell line model SH-SY5Y cells. Both AA and mycotoxins occur together in the same food matrix cereal base (bread, pasta, potatoes, coffee roasting, etc.). Therefore, the goal of this review is to deepen the knowledge about the neurological effects that AA and mycotoxins can induce on the in vitro model SH-SY5Y and its mechanism of action (MoA) focusing on the experimental assays reported in publications of the last 10 years. The analysis of the latest publications shows that most of them are focused on cytotoxicity, apoptosis, and alteration in protein expression, while others are interested in oxidative stress, axonopathy, and the disruption of neurite outgrowth. While both AA and mycotoxins have been studied in SH-SY5Y cells separately, the mixture of them is starting to draw the interest of the scientific community. This highlights a new and interesting field to explore due to the findings reported in several publications that can be compared and the implications in human health that both could cause. In relation to the assays used, the most employed were the MTT, axonopathy, and qPCR assays. The concentration dose range studied was 0.1–10 mM for AA and 2 fM to 200 µM depending on the toxicity and time of exposure for mycotoxins. A healthy and varied diet allows the incorporation of a large family of bioactive compounds that can mitigate the toxic effects associated with contaminants present in food. Although this has been reported in some publications for mycotoxins, there is still a big gap for AA which evidences that more investigations are needed to better explore the risks for human health when exposed to AA and mycotoxins.
Key Contribution: Acrylamide (AA) (0.1 to 10 mM) and mycotoxins (2 fM to 200 µM) causes toxic effects in neuroblastoma cells, SH-SY5Y. This review highlights the importance of performing studies based in the mixture of mycotoxins and food processed contaminants such as acrylamide.
1. Introduction
The food baking process is the most important sub-process responsible for the main chemical, physical, and sensory properties of the final product, as well as the development of bioactive and antioxidant compounds [1,2,3]. However, this thermal process induces the formation of unwanted toxic components, including acrylamide (AA), due to the Maillard reaction occurring at high temperatures [1,4,5,6]. In detail, the Maillard reaction involves three major steps: (i) condensation of free amino groups (such as asparagine) with reducing sugars (glucose and fructose) to form acrolein; (ii) Strecker degradation of amino acids to aldehydes and ammonia; and (iii) brown nitrogenous compounds combining with acrylic acid to form AA (Figure 1) [7].
The compound AA is a colorless and odorless, highly reactive, and water-soluble crystalline compound with a low molecular weight of 71.08 kDa. AA is used in many different industrial areas, such as water treatment and the production of paper, fabrics, or cosmetics, and is widely employed in laboratories for gel chromatography [8]. The widespread use of AA causes a high level of occupational exposure by inhalation and skin contact [9]. Furthermore, in 2002, Swedish researchers reported that several heat-treated carbohydrate-rich foods contained significantly higher levels of AA than other known food carcinogens [6]. However, several factors can influence the level of AA formation in foods, such as the type of raw materials, product composition, pH, and moisture. In addition, the highest levels of AA are detected in foods derived from thermal processes involving the frying and browning of potatoes, cocoa beans, and coffee roasting, and the baking of cereals and cakes [10]. It is interesting to highlight that AA was classified as a compound “possibly carcinogenic to humans” by the International Agency for Research on Cancer [11] and classified in Group 2A. Likewise, the European Commission (2017) [12] classifies AA as a Class 1B carcinogen and mutagenic substance and Class 2 for reproductive toxicity, while the European Chemicals Agency (2022) [13] has included AA in the list of substances of very high concern. Therefore, it is of great interest, and further studies of AA toxicity are necessarily required to assess the potential risk for human health.
The toxicodynamic characteristics associated with AA are based on rapid absorption in the blood and wide distribution to tissues due to its low molecular weight and high solubility properties [14]. AA is mainly metabolized in the liver and brain by the glutathione-S-transferase enzyme, forming N-acetyl-S-(3-amino-3-oxypropyl)-cysteine [15]. Moreover, AA can be converted by cytochrome P450 2E1 (CYP2E1) to glycidamide (GA), a more reactive epoxide that can react with hemoglobin and DNA [16,17]. Thus, GA is responsible for the mutagenic and carcinogenic effects of AA in vivo [18]. AA has been shown to induce systemic side effects in animals, while brain toxicity has been detected in humans [19,20]. It has also been reported that AA neurotoxicity is associated with the imbalance between oxidation and antioxidant function brought on by lipid peroxidation and a rise in intracellular reactive oxygen species (ROS) [8].
Mycotoxins are toxic compounds produced by various Aspergillus, Penicillium, Fusarium, and Trichoderma fungal species that are health-hazardous poisons frequently present in various agricultural products, including grains, nuts, and spices [21]. These toxins pose significant health risks to humans and animals when consumed [22]. Understanding the effects of mycotoxins on different cell types is crucial for assessing their toxicological impact [23,24,25].
Studying mycotoxins in vitro using SH-SY5Y cells allows researchers to assess their potential neurotoxic effects and elucidate the underlying mechanisms of toxicity. These studies involve exposing the cells to various concentrations of specific mycotoxins, such as ochratoxin A (OTA) or fumonisins, and evaluating their impact on cell viability, morphology, proliferation, apoptosis, oxidative stress, neurotransmitter function, and other relevant endpoints [26,27].
Likewise, the European Commission has reported more than 400 alerts for fungal contamination in food and feed, with OTA being one of the most reported toxins, accounting for 10% of the notifications [28].
Nowadays, there is a strong effort toward studying the combination of compounds that can occur in the same food matrix, environment, or are daily ingested through the diet, especially regarding the effects that mixed compounds can cause. AA and mycotoxins neurotoxicity is reviewed in several in vitro models, including undifferentiated and differentiated human neuroblastoma cell line (SH-SY5Y) models. SH-SY5Y cells are used in toxicological research to assess neuronal differentiation, metabolism, and function, as well as in neuroadaptive, neurodegenerative, and neuroprotection processes [29]. The human SH-SY5Y cells are a subclone of SK-NSH, which, once stimulated with retinoic acid (RA), differentiates into dopaminergic neuron-like cells, acquiring many biochemical and functional properties of neurons [30,31].
Moreover, despite numerous reviews offering scientific insights into the chronic exposure [32], toxicity [33,34], presence in food [35], and various extraction procedures [36,37] related to AA and mycotoxins individually, there remains an unaddressed gap in the literature: a review uniting the toxic effects of AA and mycotoxins within an in vitro model, such as SH-SY5Y cells. In addition, a new study establishes the combined effects of these compounds in SH-SY5Y cells, emphasizing the importance of collecting data on AA and mycotoxins individually to understand their mechanisms of action [38]. Furthermore, the interest in the shared toxic effects documented in both acrylamide (AA) and multiple mycotoxins is not just due to their occurrence in our diets but also attributable to the potential combination of these effects, raising important implications for human health, particularly concerning neuronal impacts. Therefore, this review aimed to evaluate the effects of AA and mycotoxins as well as their mechanism of action (MoA) in the human neuroblastoma cell line SH-SY5Y, as reported in studies of the last 10 years.
The results have been organized according to findings of AA and mycotoxins that might coexist together in food and cereal food-based products. Thus, the section has been divided into the following sub-sections: cytotoxicity, apoptosis, oxidative stress, network degeneration, signaling pathways, protein expression, and natural compounds against the adverse effects of AA.
2. Cytotoxicity
2.1. Acrylamide (AA)
Non-viable or dead cells are associated with a loss of membrane integrity, which is accomplished by alterations in the movement of molecules either into or out of cells across membranes that have become leaky [39]. Cytotoxicity assays are convenient for understanding the dose- and time-dependent toxicity of chemicals and their reversibility and impacts on the cell cycle. Multiple methods are known, depending on their endpoints; some are based on a visual morphological scoring process (e.g., elution test, direct and indirect contact), while other methods use colorimetric and numbering rapid analysis techniques [i.e., trypan blue exclusion, propidium iodide uptake, 3-(4,5-dimethylthiazol-2-yl)-2,5-diphenyl-2H-tetrazolium bromide (MTT), etc.] [40].
In this sense, to find out the cytotoxicity of AA at the neuronal level, several authors investigated the cytotoxicity by MTT assay in SH-SY5Y cells when incubated with different concentrations of AA for 24 h [41]. Reductions in cell viability were detected from 15% to 40% in SH-SY5Y cells treated with AA (from 2 to 5 mM) in a dose-dependent manner [41,42,43]. Furthermore, changes in the shape of cells were detected after exposure to 2.5 or 5 mM of AA, for 24 h, as most cells shrank, and the cell body became round [41]. In the same line of research but one step forwards, the same group of investigators studied the protective effect of curcumin on AA-induced cytotoxicity for which SH-SY5Y cells AA-treated from 2.5 to 10 mM obtained a decrease in the number of living cells from 14% to 61% with respect to the control by a CCK8 assay [42], while the treatment of SH-SY5Y cells with 100 μM of α-lipoic acid (LA) suppressed AA apoptosis induction and the loss of cell viability.
Similarly, comparing the cytotoxicity of SH-SY5Y and a human glioblastoma cell line (U-1240 MG), in different time- and dose-dependent assays, it was shown that upon treatment with AA from 0.1 to 2 mM up to 72 h, SH-SY5Y viability was significantly reduced up to 40% upon exposure to 2 mM AA; while for U-1240 MG cells, viabilities were significantly reduced up to 92% for that same concentration of AA (2 mM) [44]. Coinciding with the results for SH-SY5Y cells in reducing viability, significance was also reported at 100 µM and after 72 h of exposure [45].
In addition to the common cytotoxic assay of MTT, viability alterations produced by AA have been carried out by SF assay [46], and trypan blue and lactate dehydrogenase leakage (LDH) [47]. The effects reported for SH-SY5Y cells by SF assay revealed that viability was altered at high concentrations of AA (10 mM) causing definite cellular damage and cell death at short times of exposure (8 h) [46]; while cytoxicity evaluation by trypan blue exclusion and LDH leakage was reported at the same doses of AA (10 mM) but, in this case, at 6 h with a viability decreased by 38% [47]. Compared with U-1240 MG cells, at 24 h, a reduction in viability of 20% and 35% at 5 and 10 mM was shown, respectively, concluding that the cell viability reduction in U-1240 MG cells was less than that reported for SH-SY5Y cells [47].
Another study carried by Okuno et al. (2006) [48], also in SH-SY5Y cells, showed that AA cytotoxicity was dose (0.5–5 mM) and time (1–24 h) dependent, by the fact that trypan blue exclusion decreased and LDH leakage increased [48]. The WST-8 assay is another assay for cell viability and it was compared with LDH leakage on SH-SY5Y exposed to a concentration range of 1–5 mM AA [49]; the results revealed a WST-8 decrease and LDH increase according to the AA dose, but it helped to confirm the previous results [49].
On the other hand, the possibility of SH-SY5Y cells to be differentiated as neurons allowed researchers to study the effect of AA by the LDH assay, revealing that it was largely non-cytotoxic at 1 h of exposure, except at higher doses (10 mM); this was similar to the results when undifferentiated SH-SY5Y cells were tested [50].
Furthermore, Frimat et al. (2010) [51] demonstrated through the viability assay with CellTiter-Blue that an AA concentration of 5 mM reached a 50% inhibition concentration (IC50) for SH-SY5Y cells, while 0.26 mM caused a 20% reduction in the network formation equivalent to the control at 24 h of exposure.
In another study, the basal cytotoxicity was determined by measuring the total cellular protein content, and the total protein from the 50 S subunit (TP50) and TP20 values (1.34 mmol/L and 0.61 mmol/L, respectively) reflected severe and moderate cytotoxicity, respectively, in SH-SY5Y cells exposed to AA [52].
However, other authors showed that 0.5–2.0 mM of AA did not produce any cytotoxicity (assessed by fluorescence microscopy) at 24 h, but concentrations higher than 4 mM caused a significant loss of HuD-positive neurons (58% of control) and a decrease in axon number by 21% with respect to the control [53]. Similarly, as proved by Calcein-AM assay, (a fluorescence-based cell viability assay), 1 mM of AA had no statistically significant toxicity at 48 h in SH-SY5Y cells or the embryonic carcinoma cell line (P19) derived from an embryo-derived teratocarcinoma in mice; however, it was cytotoxic for pheochromocytoma of the rat adrenal medulla (PC12) cells [54]. A study of cytotoxicity through fluorescence microscope observation by cytotoxicity tests using the Live/Dead Cell Staining Kit II following exposure to different concentrations of AA (0.01, 0.28, 7 mM) in the SH-SY5Y cell line at 24 h reported that the ratios significantly decreased at 0.28 mM and 7 mM, respectively [55].
In order to obtain more accurate results, the cytotoxicity of AA on SH-SY5Y cells was studied by MTS assay and the toxicity after 24 h of incubation was evaluated [56]. The amount obtained in the abluminal concentration after 1 h was also measured in the blood–brain barrier (BBB) model, to finally compare the results of cytotoxicity between AA assayed directly in SH-SY5Y after 24 h with the AA obtained after passing through an in vitro BBB (4 d/24 w) model for 1 h. It was proved that AA was cytotoxic at 100 μM in SH-SY5Y at 24 h, but not the abluminal AA concentration after BBB transport [56].
2.2. Mycotoxins
2.2.1. Beauvericin (BEA)
Studies on the impact of BEA on SH-SY5Y cells have illustrated varied results, predominantly through the utilization of the MTT assay. Viability was shown to be reduced by 50% during a 72 h exposure at 2.5 µM, with some studies citing a 43% decrease in viability at the highest concentration assayed (2.5 μM) after 48 h of exposure [57,58,59,60]. Diverse findings have been noted regarding IC50 values at different exposure times, such as 1.9 µM at 6 h, 1.7 µM at 24 h, and 1.5 µM at 48 h [61,62]. LDH leakage was also found to be induced by 1 µM of BEA, corroborating results obtained by the MTT assay [61].
2.2.2. Deoxynivalenol (DON)
Regarding the effects of DON in SH-SY5Y cells, the MTT assay was carried out for both studies, but with different concentrations and results. The IC50 for Pérez-Fuentes N. et al. 2021 [61] was 2.25 µM at 24 h, but 120 µM for Kalagatur et al. [63] at the same time. Pérez-Fuentes N. et al., 2021 [61] did not find any increase in the extracellular LDH level, but Kalagatur et al. [63] reported a directly proportionate extracellular LDH level in comparison to the MTT assay.
2.2.3. Enniatin A and Enniatin B (ENN A and ENN B)
Six hours of ENN A exposure resulted in a 41.0 ± 8.5% drop in cell viability at 2.5 μM and 94.3 ± 1.6% at 5 μM, respectively, with total inhibition at 10 μM. After incubation for 24 and 48 h, cell viability at 2.5 and 5 μM showed a decrease greater than 74.5%, and at the highest tested dose, a complete reduction was observed once more. Concerning ENN B, cell viability did not reach total inhibition at the highest dose at 6 h [61]. Nevertheless, at 24 h, ENN B had an IC50 of 0.43 μM. Also, ENN A increased LDH release at 5 and 10 μM at 24 and 48 h. After treatment for 24 h, ENN B increased LDH release by roughly 20% at values higher than 0.25 μM. After 6 h of incubation, at 5 and 10 μM, ENN A showed substantial differences from control cells (79.0 ± 8.9% and 67.7 ± 14.5%, respectively) [61].
2.2.4. Fumonisin B1 (FB1)
Concerning the effects of FB1, several studies investigated the toxic potential of this mycotoxin in SH-SY5Y cells. In total, 100 µM of FB1 decreased the cell viability of SH-SY5Y cells after incubation for 48–144 h [64]. In the same line but at lower exposure times, after 48 h of incubation, FB1 reduced the cell viability at the highest concentration (30 µM), and it appeared to promote cell proliferation at the lowest doses (0.1 µM) after 24 and 48 h. Furthermore, no IC50 was found, and in the LDH assay no cytotoxic effects were shown following FB1 treatment [62]. Similarly, in another study, 50 µM treatment of FB1 was compared to the control, and LDH was released at 12 h, but this release decreased at 24 h and at 48 h of treatment and there was no difference from the control [65]. Then, Domijan et al. (2011) [66] investigated how FB1 (at concentrations ranging from 0.5 to 200 M) affected the viability of cell cultures after 24 h of exposure. None of the FB1 concentrations utilized in the experiment caused cell death in neuroblastoma cells. Neuroblastoma cells treated for 24 h with the maximum FB1 dose (200 µM) showed 98.0 ± 1.85% cell survival.
2.2.5. Ochratoxin A (OTA)
Concerning the viability of SH-SY5Y cells treated with OTA, the IC50 values observed for 24 h and 48 h were 9.1 μM and 5.8 μM, respectively [67]. A significant decline in viability was noted beyond concentrations exceeding 3.12 μM or 6.25 μM for 24 h and 48 h, resulting in a decrease from 74% to 25% and from 80% to 49% at 24 h and 48 h, respectively [67]. Similarly, less dramatic decreases in mitochondrial activity were observed under different concentrations of OTA treatment (74 ± 12 and 74 ± 44% control at 10 and 100 µM OTA, respectively) at 24 h, and the LDH activities of OTA at 1, 10, or 100 µM were 128 ± 1, 125 ± 2, and 200 ± 1% of the untreated control [68].
2.2.6. T-2 Toxin
Regarding the exposure of SH-SY5Y cells to the T-2 toxin, this resulted in a significant decrease in cell viability, with percentages of 81.9%, 40.8%, and 35.5% observed for cells exposed to 5, 10, and 20 ng/mL of the toxin for 48 h, respectively. Additionally, LDH levels were significantly elevated by 1.8, 2.9, and 3.2 times compared to the control group [69].
2.2.7. Zearalenone (ZEA) and Its Metabolites
Referring to ZEA effects on SH-SY5Y cells, the MTT assay stated that at 6 h of incubation, ZEA did not cause any cell damage. However, it significantly reduced cell viability when the concentration exceeded 20 μM at 24 and 48 h, resulting in a reduction of more than 50% compared to the control cells. The inhibitory concentration (IC50) of ZEA was determined to be 17.4 μM [61]. However, after 24 h of ZEA treatment, in a previous study [70] similar results were obtained in SHSY5Y cells with a significant decrease in cell viability even at a lower concentration (25 µM). The viability of SH-SY5Y cells decreased by as much as 86% at 200 µM ZEA [70]. Regarding the cell viability in ZEA metabolites (α-ZEL and β-ZEL), the following IC50 values were obtained for α-ZEL: 20.8 at 48 h, 14.0 at 72 h and for β-ZEL: 94.3 at 24 h, 9.1 at 48 h, and 7.5 at 72 h [59].
In summary, we can state that AA produces cytotoxicity in SH-SY5Y cells, at high concentrations (5 mM or higher), and that in lower concentrations it reduces cell viability in a time- and dose-dependent manner (Table 1). On the other hand, mycotoxins produce cytotoxicity at low concentrations of 200 µM or less and this is time- and dose-dependent in some cases. The most cytotoxic compound was ENN B, followed by DON and ENN A. (Table 2). Therefore, AA and mycotoxins directly affect cell viability in all cell models studied; the most sensitive cells exposed to AA were PC12, followed by SH-SY5Y, and U-1240 MG.
3. Apoptosis
3.1. Acrylamide (AA)
In order to assess cellular apoptosis, the levels of mono- and oligonucleosomes were monitored in SH-SY5Y and U-1240 MG cells treated with AA. This revealed an increase in the enrichment factor of both mono- and oligonucleosomal fragments in both cell lines when exposed to concentrations ranging from 0.5 to 10 mM of AA over a period of 0 to 72 h. In SH-SY5Y cells, the levels of DNA fragments showed a significant increase with longer exposure times and higher concentrations of AA. On the other hand, U-1240 MG cells exhibited apoptotic responses only after 48 h of exposure to all concentrations of AA, except at 0.5 mM [47]. Moreover, when SH-SY5Y cells were treated with 2.5 mM of AA for 24 h, there was an approximately four-fold increase in the total apoptotic rate compared to the control group [38]. However, inhibiting c-Jun N-terminal kinase (JNK) using a nuclear factor κB (NF-κB) inhibitor led to a reduction in both early and late apoptosis in AA-treated cells [41].
To investigate the potential role and underlying mechanism of Sphingosine Kinase 1 (SphK1) in AA-induced nerve injury in SH-SY5Y cells, the expression of SphK1 was examined. It was observed that SphK1 levels decreased in correlation with increasing concentrations of AA. Specifically, after exposure to AA, the apoptosis rates and activation of SphK1 increased proportionally with the AA concentration [72]. At concentrations of 1.25 mM and 2.5 mM, the apoptosis rates were 3.06% ± 0.13% and 6.86% ± 0.67, respectively, while in the SphK1 activator group, the rates at the same concentrations were 2.12% ± 0.33% and 3.53% ± 0.17, respectively [72]. Furthermore, in a related study, Ning et al., 2021 [68], took the investigation a step further by using AA as a model to induce apoptosis in zebrafish, exposing them to 10 mM of AA. This resulted in the observation of AA-induced neuroapoptosis through fluorescent assays in the zebrafish [73].
3.2. Mycotoxins
3.2.1. Beauvericin (BEA)
Regarding cell cycle alterations, BEA significantly reduced the percentage of viable cells, producing an increase in apoptotic cell death of 55.9% ± 8.6% [61]. Similar results were obtained by Agahi et al., 2021 [74], who stated that apoptotic/necrotic cells increased for both times of exposure, which was up to 89% for 24 h and up to 38.8% for 48 h. Furthermore, Agahi et al., 2021 [74] observed that after 48 h of exposure, there was a notable increase in necrotic cells at 0.39 and 0.78 μM by almost two times compared to control cells.
3.2.2. Deoxynivalenol (DON)
In the case of DON, Kalagatur et al. [63] reported that a dose of 120 µM induced DNA damage and led to the formation of apoptotic nuclei.
3.2.3. Enniatin A and Enniatin B (ENN A and ENN B)
ENN A and ENN B reduced cell viability, producing an increase in apoptotic cell death of 49.2 ± 8.2% and 46.0 ± 9.3%, respectively [61].
3.2.4. Zearalenone (ZEA) and Its Metabolites
ZEA, on the other hand, did not produce a significant increase in cell death at the concentrations tested [61]. Nevertheless, α-ZEL treated cells increased significantly in apoptotic and apoptotic/necrotic cells at 24 h. And β-ZEL showed a significant increase in apoptotic cells exposed to the highest concentration assayed (12.5 μM) after 24 h and 48 h [74].
AA increases the apoptosis rate in neuronal cells (SH-SY5Y and U-1240 MG cells) proportional to the AA concentration, as well as to the time of exposure. Activating SphK1 could improve the survival rate of SH-SY5Y cells and reduce the apoptotic rate. Also, it has been shown to produce neuroapoptosis in zebrafish (Table 3). Mycotoxins like BEA, ENNs, and ZEA metabolites (α-ZEL and β-ZEL) could reduce the cell viability in SH-SY5Y cells and produce an increase in apoptotic cell death (Table 4).
4. Oxidative Stress
4.1. Acrylamide (AA)
The study of ROS in the SH-SY5Y cell line revealed an accumulation after AA exposure [46]. These results are supported by those reported indicating an intracellular decrease in glutathione (GSH) production in a dose-dependent manner and increased malondialdehyde (MDA) and ROS generation when SH-SY5Y cells were treated with 2.5 and 5 mM of AA [41]. Furthermore, when SH-SY5Y cells were exposed to AA at 2.5 mM for 24 h, it caused oxidative stress as revealed by the distinct increase in cellular ROS and the MDA level and a significant decrease in GSH content [42].
4.2. Mycotoxins
4.2.1. Beauvericin (BEA)
In view of the effects on cytotoxicity and apoptosis that mycotoxins had, oxidative stress was analyzed by several authors. Agahi et al. [75] studied the ROS production and the GSH/GSSG ratio in which BEA produced a slight decrease at 1.25 and 2.5 μM, from 45 to 120 min compared to the control, and GSH/GSSG ratio increased after 24 h in cells exposed to BEA from 103% to 142%. Subsequently, in the same line of investigation, they studied the activity of GPx, GST, CAT, and SOD [76]. The results showed an increase ranging from 9- to 17-fold and from 2- to 9-fold after 24 h and 48 h, respectively. Also, BEA increased GST activity at doses above 0.78 μM for 48 h of exposure by 4–32%. CAT activity was not altered when cells were exposed to the BEA mycotoxin. Finally, SOD activity increased significantly after being exposed to BEA after 48 h by up to 1-fold. In other study [61], the mitochondrial membrane potential measurement was analyzed, concluding that BEA had the capacity to depolarize the mitochondrial membrane at concentrations ranging from 2.5 to 10 μM at 6 h and 24 h.
4.2.2. Deoxynivalenol (DON)
4.2.3. Enniatin B (ENN B)
At 24 h, this emerging toxin affected the ΔΨm value at all of the concentrations tested. ENN B treatment altered ΔΨm at the highest doses employed (5 and 10 μM) after 6 h of incubation and caused differences at 24 h [61].
4.2.4. Fumonisin B1 (FB1)
In terms of oxidative stress, FB1 treatment resulted in a markedly higher production of ROS as compared to control cells. Additionally, they measured the amount of ROS accumulation in the mitochondria and found that FB1 therapy, independent of treatment duration, enhanced ROS accumulation in the mitochondria [65]. It is interesting to note that adding 0.5 µM of FB1 to neuroblastoma cells increased the rate of ROS by 1.2 times. In neuroblastoma cells, increasing the FB1 concentration to 5 and 50 µM did not activate the rate of HEt fluorescence in a dose-dependent manner [66]. On the other hand, at all of the time points (24, 48, 72, 96, 120, and 144 h) and fumonisin concentrations (0.1 to 100 µM) employed, treatment with FB1 had no effect on the formation of ROS [64].
When free radical levels are high, ROS can be harmful to cells because they significantly reduce the quantity of endogenous antioxidants. One of the main CNS antioxidant pathways is supplied by GSH. Oxidative stress causes GSH to be oxidized, and CNS disease results from GSH deficiency [67]. Reduced GSH levels (61% of controls) were seen in SH-SY5Y cells following a 144 h incubation period with 100 µM FB1, but not at earlier times or with lower FB1 doses [60].
After incubating with 100 µM FB1 for 24 h, SH-SY5Y cells already showed increased MDA concentrations [61]. Following a 72 h incubation period, cells exposed to 10 µM FB1 exhibited elevated MDA levels. MDA levels at the other time periods did not statistically differ from those of controls [61].
In a different study, the neuroblastoma cells’ cellular Ca2+ level considerably increased following FB1 exposure in comparison to the control group. Following ER stress, cellular Ca2+ is released, which causes the loss of mitochondrial membrane potential and, in neuroblastoma cells, results in cell death [65]. Nevertheless, Pérez-Fuentes N et al., 2021 [61], found that 30 µM FB1 treatment did not result in appreciable alterations in the ΔΨm of SH-SY5Y cells during either of the two incubation periods. While MitoSOX florescence rose at all doses, only the lowest concentration (0.5 µM) had a discernible impact [66].
4.2.5. Ochratoxin A (OTA)
When it came to ROS, 100 µM OTA for 30 and 60 min, followed by loading cells with 2 mM DCF-DA for 30 min, showed that OTA increased the intensity of DCF-DA fluorescence in comparison to the corresponding untreated control cells. This suggests that OTA-treated SH-SY5Y cells may have been exposed to oxidative stress [68].
4.2.6. T-2 Toxin
In this investigation, ROS levels dramatically increased to 3.8 and 5.0 times, respectively, in cells treated with 5 and 10 ng/mL of the T-2 toxin. As a result, for cells treated with 5 and 10 ng/mL of the T-2 toxin, the ratio of GSH to GSSG was drastically reduced to 79.8% and 60.7%, respectively. The ATP content dropped to 66.7% and 51.5% at the 5 and 10 ng/mL concentrations, respectively, whereas the mitochondrial membrane potential decreased to 60.7% and 41.5% at the same concentrations [69].
4.2.7. Zearalenone (ZEA) and Its Metabolites
ZEN administration dramatically boosted the formation of ROS in SH-SY5Y cells in relation to oxidative stress [70]. Additionally, ZEN administration led to a dose-dependent increase in MMP loss and lipid peroxidation [60,61]. Regarding the ZEA metabolites, α-ZEL at 25 μM elevated ROS from 5 to 60 min and moderately decreased from 90 to 120 min in comparison to their control. Conversely, β-ZEL dropped for 12.5 μM over a 90 min period [75]. After 24 h, the GSH/GSSG ratio in cells exposed to mycotoxins in fresh media increased dramatically from 111% to 148%, and for α-ZEL and β-ZEL, from 68% to 131%, respectively [75]. Deepening on our understanding of the harmful consequences of ZEA metabolites, the study conducted by Agahi et al. [76] examined the effects of α-ZEL and β-ZEL on the activity of enzymes in SH-SY5Y cells. The findings showed that α-ZEL and β-ZEL exposure increased the activity of GPx, CAT, and GST at all concentrations examined, and that SOD and α-ZEL increased the activity of SOD and GST after 48 h.
Summarizing, AA produces an increase in cellular ROS and a reduction in intracellular GSH at concentrations higher than 2.5 mM for more than 24 h (Table 5). Mycotoxins (DON, FB1, OTA, T-2 toxin, and ZEA) produced an increase in cellular ROS and in mitochondrial ROS in the case of FB1, and a reduction in the GSH ratio at concentrations of 120 µM for DON, 0.5 µM for FB1, 100 µM for OTA, 5 and 10 ng/mL for T-2 toxin, and 12.5 μM for α-ZEL and β-ZEL (Table 6).
5. Network Degeneration
Another way to assess how AA exerts effects at a neuronal level is by explaining whether it degrades or impedes the development of the neural network during the process of differentiation; a study found that degeneration was not noticeable for the first 48 h after receiving 1 mM AA treatments, but that the network levels had considerably decreased by the 72 h mark [77]. In this instance, network deterioration could not be stopped by co-treatment with BDNF or calpeptin. Similar results were later reported proving that the number of neurites was significantly reduced after 100 nM following 3 days of exposure and after 6 days of exposure to 10 pM of AA [45], showing an impairment in the neurite outgrowth in a time- and dose-dependent manner in future studies [55].
Furthermore, 0.5 mM caused a shortening in SH-SY5Y neurite morphology, while 1 and 2 mM of AA resulted in cells with no neurite morphological extensions [44]. Similar results were found when cells were treated with 0.25 mM of AA, causing a 50% neurite degeneration at 24 h [78]. At 96 h with 4 mM of AA, SH-SY5Y neurites were reduced by up to 67.7% [53]. Thus, AA induces network degeneration in a dose- and time- dependent manner [79].
In order to obtain more accurate results, Nordin-Andersson et al., 1998 [79], exposed differentiated human neuroblastoma (SH-SY5Y) cells to a series of contaminants, among them AA, studying general cytotoxicity (IC20) and the neurite degenerative effect (ND20), concluding after 72 h that the IC20 was 670 mM and the ND20 250 mM. Thus, the ND20 values for AA were significantly (65%) lower than the IC20, concluding the induction of axonopathy. Later on in 2003, during the AA treatment, there were observations of basal cytotoxicity, morphological modifications, and changes in cell physiological and neurochemical activities in differentiated human neuroblastoma (SH-SY5Y) cells [52]. After 72 h of exposure, AA caused a 20% drop in the number of neurites per cell at 0.21–0.25 mM and a 20% decrease in the rate of protein synthesis at 0.17 mmol/L. Moreover, there was a 49% and 38% rise in the baseline intracellular calcium concentration ([Ca2+]i) fluxes, measuring 0.25 mmol/L and 0.5 mmol/L, respectively. The SH-SY5Y cells recovered 48 h after the AA exposure was stopped; that is, their basal level of [Ca2+], rate of protein synthesis, and number of neurites per cell were all similar to those of control cells.
Taken together, AA impairs neurite outgrowth in the SH-SY5Y cell line during differentiation in a time- and concentration-dependent manner, especially after 72 h of exposure. However, at 48 h after cessation of AA exposure, SH-SY5Y cell recover (Table 7).
6. Signaling Pathways
To fully understand how AA interferes at the neuronal level, various studies scrutinized the involvement of different transcription factors crucial in neurodevelopment, cell differentiation, apoptosis, and inflammatory responses. These included cAMP response element-binding (CREB), mitogen-activated protein kinases (MAPKS), JNK, PERK-eIF2α, and C/EBP homologous protein (CHOP), along with the nuclear factor NF-κB.
AA was studied with the CREB protein signaling during neuronal differentiation, concluding that in the CREB signaling pathway the expression of 17 genes was significantly changed after exposures to 1 or 70 μM, reporting that AA interferes with important cholinergic and dopaminergic neuronal markers during differentiation, which were downregulated after exposure to 70 μM AA [80].
In other studies [41], the intracellular levels of interleukin 6 (IL-6) and tumor necrosis factor alpha (TNF-α) in SH-SY5Y cells were assessed in order to look into the potential pro-inflammatory effects of AA. The findings showed that, in comparison to the control value, the TNF-α content was significantly raised following treatment with 2.5 and 5 mM AA; however, the level of IL-6 was only significantly increased in the 5 mM AA group when compared to the control group. In addition, nuclear NF-κB and the mitogen activated protein kinases (MAPK) signaling pathway with JNK and p38 were activated by AA.
The same research group studied the induction of AA in phosphorylated tau aggregation, phosphorylated CREB protein reduction, and Bax/Bcl-2 ratio upregulation in SH-SY5Y cells at the same concentrations reported above. Furthermore, AA induced glycogen synthase kinase-3β (GSK-3β) and upregulated activating transcription factor 4 (ATF4) and CHOP in SH-SY5Y cells. It also activated the protein kinase RNA-like endoplasmic reticulum kinase (PERK)-Eukaryotic Initiation Factor 2 alpha (eIF2α) signaling [42].
However, 1.25, 2.5, and 5 mM of AA were found to increase the cleavage of caspase-3 and the poly ADP ribose polymerase (PARP) enzyme (the initiator and effector caspases in the intrinsic apoptotic pathway, respectively). They also decreased Akt phosphorylation in SH-SY5Y cells, which prevented the activation of the PI3K/Akt pathway [43]. GSH levels were restored and H2O2 stimulation was inhibited by LA pretreatment, which counteracted AA-induced alterations in GSH loss and H2O2 production. The downregulation of AMP-activated protein kinase (AMPK) and glycogen synthase kinase-3 beta (GSK3β) phosphorylation were induced by AA in a dose-dependent manner; AA elicited energy deficits in the SH-SY5Y cells by regulating the AMPK/GSK3β cascade, resulting in Ca2+ disturbance, ATP depletion, and CREB/BDNF signaling impairment. In addition, Sirtuin 1 (Sirt1) and peroxisome proliferator-activated receptor γ co-activator 1 α (PGC-1α) were downregulated by AA; however, AA elicited cellular autophagy in terms of the conversion of microtubule-associated protein light chain 3 (LC3)-I to LC3-II and beclin-1 protein expression. Also, AA induced the overexpression of prostaglandin-endoperoxide synthase 2 (COX-2) and inducible nitric oxide synthase (iNOS), and AA reduced the phosphorylation of extracellular signal-regulated kinases (ERK) while intensifying the phosphorylation of JNK and p38 in MAPKs. In addition, AA mediated a reduction in nuclear factor erythroid 2–related factor 2 (Nrf2) nuclear translocation and cytoplasmic Kelch-like ECH-associated protein 1 (Keap1) expression, resulting in the downregulation of the expression of phase II enzymes, namely HO-1 and NAD(P)H Quinone Dehydrogenase 1 (NQO1) [43].
In brief, AA modulated several signaling pathways related to differentiation, inflammation, and apoptosis, disturbing transcriptomic factors such as nuclear NF-κB and MAPKs signaling pathway with JNK and p38 activation, COX-2 and iNOS overexpression, and AMPK and GSK3β downregulation. AA also inhibited the activation of the PI3K/Akt pathway and downregulated Sirt1 and PGC-1α. Furthermore, it interfered with the CREB signaling pathway, an important cholinergic and dopaminergic neuronal marker during SH-SY5Y differentiation (Table 8).
7. Gene Expression
7.1. Acrylamide (AA)
The impact of AA on gene expression, as elucidated by recent research, highlights a complex and nuanced response within cellular systems. A comprehensive analysis of differentially expressed genes (DEGs) following exposure to AA revealed distinct patterns of gene dysregulation.
Following exposure to 70 µM AA over a six-day differentiation period, a notable dysregulation was observed in a set of eight genes. Among these genes, NTRK2 (Neurotrophic Receptor Tyrosine Kinase 2, a receptor of BDNF), FGF1, RASD2, BMP7, SEMA3F (Semaphorin 3F), and SEMA5A (Semaphorin 5A) exhibited significant alterations, indicating potential pathways affected by AA-induced toxicity during cellular differentiation [81]. In the same study, they also studied other compounds; therefore, the shared dysregulation of CNR1 (encoding cannabinoid receptor 1) and SEMA5A between AA and valproic acid exposures, as well as OPRD1 (encoding opioid receptor delta 1) between AA and rotenone, underscores the intriguing overlap in genetic response among these neurotoxic compounds [81].
In addition to examining markers linked with CREB signaling pathways, Attoff et al., 2020 [81] opted to incorporate indicators associated with cholinergic (CHAT) and dopaminergic (DRD2 and MAOA) neurons in consideration of their crucial role in the neuronal differentiation process of SH-SY5Y cells. They also included synaptotagmin 1 (SYT1), known for its protein adduct formation with AA, along with genes previously impacted by AA exposure (such as MAOA and FGF1). Additionally, BDNF and tropomyosin receptor kinase B (TrkB), closely associated with the CREB signaling pathway, were part of the selection. The analysis revealed a notable decrease in the expression of 6 out of 16 genes following exposure to 70 μM of AA, with 5 of them demonstrating decreased expression even after exposure to 1 μM of AA. Interestingly, the expression of CHAT, TGFB1, STXBP2, BDNF, and DRD2 showed an increase during differentiation compared to undifferentiated cells. However, these genes were all downregulated upon exposure to AA. Notably, while MAOA demonstrated an increased expression compared to undifferentiated cells, it exhibited significant reduction only after exposure to 70 μM of AA [80].
7.2. Deoxynivalenol (DON)
For DON, Kalagatur et al. [63] studied the ability of these mycotoxins to alter the expression of significant neuronal markers was analyzed, reporting a significant downregulation at 50 and 100 µM of BDNF, AADC, and TH mRNA expression.
7.3. Ochratoxin A (OTA)
Similarly, but at higher concentrations of OTA (130–0.20 nM) and at 7 days of exposure, an alteration in several cell cycle (p21, p53, cyclin B and D) and neuronal differentiation (GAP43, Wnt5a and TUBB3) genes was found [71]. Concerning the gene and protein expression, several genes and proteins were studied, all of them implicated in the cell proliferation (BAX, P53, MAPT, TPPP p21, cyclin B and D, GAP43, Wnt5a, and TUBB3). At the highest dose studied, 1 µM OTA exposure for two days reduced the expression of P53, BAX, and MAPT mRNA at Days 1 and 2. In comparison to the control exposure groups, TPPP mRNA expression rose on Day 2 after exposure to 1 μM OTA but decreased on Day 1 [82]. The duration of exposure and the relationship between the duration of exposure and the 1 μM OTA dose were indicated by the expression of BDNF mRNA. For 11 days, cells exposed to lesser doses (2 fM, 20 fM) showed no change in gene expression [71].
7.4. T-2 Toxin
To investigate the impact of the T-2 toxin on mitochondrial biogenesis in SH-SY5Y cells, researchers measured the mtDNA copy number and the expression levels of NRF2, KEAP1, PGC-1α, NRF1, and TFAM [69]. For cells treated with 5 and 10 ng/mL, the mtDNA copy number decreased to 80.3% and 60.9%, respectively. The expression of NRF2 mRNA increased to 1.7 and 2.8 times, respectively [69]. Conversely, KEAP1’s mRNA expression dropped to 45.4% and 77.0%. The T-2 toxin significantly reduced the expressions of PGC-1α and its downstream targets NRF1 and TFAM. The most notable reductions were observed in the gene levels, which were lowered by 5 and 10 ng/mL of T-2 toxin, respectively, to 56.3% and 21.6% [69].
7.5. Zearalenone (ZEA)
When the concentration of ZEA increased in the comet assay, the tail dispersion increased in a dose-dependent manner. Additionally, a substantial increase in apoptotic nuclei was observed in treated cells compared to control cells at 12 and 24 h after exposure. This “ladder” pattern is indicative of oligonucloesomal DNA fragmentation. Additionally, BDNF and TH mRNA expression was not changed and gradually declined with an increase in toxin concentration for 12 and 24 h after ZEN exposure when gene expression was examined at the lower dose of ZEA (25 µM). Conversely, at 25 µM, AADC mRNA expression was inhibited. Further suppression of AADC mRNA expression was achieved by increasing the concentration of ZEA toxin (50 and 100 µM) [70]. In the case of the metabolites, other genes were studied and similar results were obtained; in α-ZEL treated cells, the mRNA of CASP3 and BAX mRNA were overexpressed at 12.5 and 25 μM. And in the case of β-ZEL, it upregulated Erβ mRNA at 12.5 μM while it downregulated the expression of CASP3 and BCL2 [75].
7.6. Fumonisin B1 (FB1)
Finally, for FB1, the ability to produce DNA damage was studied, through the comet assay, TUNEL assay, and DNA fragmentation assay. In the comet assay and when compared to other treatments, DNA damage was the highest 48 h after FB1 treatment, as indicated by an increased tail length and a decreased head diameter. Furthermore, compared to the control, considerable DNA damage resulted from a 24 h toxin treatment. Additionally, TUNEL assay results showed that FB1 treatment for 12, 24, and 48 h increased TUNEL-positive cells relative to the control [65]. In concordance, DNA ladders were seen after treatment with 30 and 100 µM FB1 for 48 h [77].
To sum up, mycotoxins have demonstrated the capacity to modulate the gene expression in SH-SY5Y cells, as well as to produce DNA damage (Table 9).
8. Protein Expression
8.1. Acrylamide (AA)
Although the study of transcription factors is important to know which signaling pathways can be altered, the importance lies in the final expression or suppression; this is why the protein content and how the presence of AA modulates it was considered.
According to the signaling pathways and transcriptomic factors altered as mentioned above, the proteins involved in processes of stress, neuronal differentiation, inflammation, and cell death were analyzed, such as heat shock proteins (HSPs), microtubule-associated proteins (MAPs), focal adhesion kinase (FAK), and CHOP.
In this sense, on one hand, it has been proved that the treatment of cells with AA increased the cell death through the caspase-3 activity and an increase in cells in the sub-G1 phase. Both caspase-3 activation and the sub-G1 cell population peaked when the cells were exposed to 3 mM AA. Interestingly, a higher dose of AA (4–5 mM) resulted in less caspase-3 activity, even though the cytotoxicity increased. This indicates that the decrease in caspase-3 activity at 5 mM of AA is not solely due to heightened cytotoxicity [48].
One year later, the same research team found that, after exposing human neuroblastoma cells (SH-SY5Y) to 0.5–5 mM AA for 18 h, the levels of HSPs of 90, 70, and 27 kDa (Hsp90, Hsp70, and Hsp27, respectively) were elevated in the incubation media depending on the dose of AA, while only the Hsp70 level increased within cells [83].
According to other work, exposure to AA predominantly causes eukaryotic translation initiation factor 2α (eIF2α) to be phosphorylated. This is followed by the buildup of ATF4, the protein that binds to eIF2α. Additionally, it was demonstrated that CHOP mRNA expression dramatically increased at all investigated time points and doses, with a notable increase of up to 100-fold at 7.5 or 10 mM AA following an 8 h exposure. Conversely, there was no alteration on the protein levels of GRP94, glucose-regulated protein (GRP78), or endoplasmic reticulum (ER) chaperones. These results imply that the AA exposure of SH-SY5Y cells causes the production of the pro-apoptotic CHOP protein but not of the ER chaperones that provide cytoprotection [46].
The effects of AA on the p53 protein and intracellular signal transduction pathways were examined using human neuroblastoma SH-SY5Y cells. p53, phosphorylated p53, and p53-associated protein murine double minute 2 (MDM2) were all upregulated by AA. The Ser15 position was the only location where p53 was phosphorylated. Extracellular signal-regulated protein kinase (ERK) and p38 were phosphorylated by MAPKs at increasing AA doses (0.5–5 mM), but not c-Jun NH2-terminal kinase [48].
Numerous proteins are impacted by AA-induced adduct formation, including SNAP-25 (synaptosome-associated protein) and other proteins found in synaptic vesicles [8]. In order to confirm the decrease in axon quantity when AA was present, cocultures were labelled with antibodies against both III-tubulin and the pan-neuronal marker PGP 9.5 [49]. The number of axon profiles in response to AA decreased in both instances, and the results matched the information obtained from SNAP-25 immunocytochemistry.
According to the findings of other research groups’ in vitro studies, activating SphK1 in SH-SY5Y cells also controlled MAPK signaling. This included raising the phosphorylation of extracellular signal-regulated protein kinases (ERK) and lowering that of JNK and p38 [71]. These findings imply that SphK1 activation can provide nerve cell protection against AA-induced damage.
MAPs are responsible for the polymerization, stabilization, and dynamics of the microtubule network; it has been detected that the expressions of MAP1b and MAP2c in SH-SY5Y cells were reduced by 39% and 64%, respectively, when they treated the cells with 2 mM of AA [44], while the expressions of MAP1b and MAP2c in U-1240 MG cells were reduced by 52% and 57%, respectively. In terms of Janus kinase (JAK)-signal transducer and activator of transcription (STAT) signaling, JAK1 expression was increased by 93% in 10 μM retinoic acid (RA)-stimulated SH-SY5Y cells and by 108% in 10 μM butyric acid (BA)-stimulated U-1240 MG cells. Moreover, JAK1 expression in U-1240 MG cells was reduced by 74% when treated in combination with 10 μM BA and 2 mM AA, whereas JAK1 expression in SH-SY5Y cells was reduced by 68% when treated in combination with 2 mM AA and 10 μM RA. These findings demonstrated that in SH-SY5Y and U-1240 MG cells, AA-inhibited differentiation was mediated through MAPs expression and JAK-STAT signaling, arguing that exposure to AA inhibits cellular differentiation in human neuroblastoma and glioblastoma cells and that downregulation of the JAK-STAT signal pathway may contribute to the understanding of AA-induced neurodegeneration [44].
The differentiating process of neuroblastoma SH-SY5Y cells has also been studied with AA inducing time-dependent tyrosine phosphorylation of FAK [pY397] and Pyk2[pY402] [78].
Shortly, we can conclude that the expressions of MAP1b and MAP2c, typically involved in microtubule networks, were reduced in SH-SY5Y and U-1240 MG cells which indicated a clear impairment of cell shutdown upon AA exposure. In addition, a significant pro-inflammatory response with JAK1 overexpression was observed. Similarly, in vitro transcriptomic analysis showed how AA exposure (2.5–5 mM) induced apoptosis (increased levels of p53, MDM2, and caspase-3 expression), oxidative stress (ATP4 and CHOP overexpression), and inflammation with high levels of IL-6 and TNF- α. It is also necessary to underline the downregulation of SphK1 which is associated with inflammation and antiapoptotic processes (Table 10).
8.2. Mycotoxins
8.2.1. Fumonisin B1 (FB1)
Other studies have evaluated the capacity of this mycotoxin to induce apoptosis; therefore, some authors investigated the protein expression alterations (caspase 9 and 3, p53, Bax, Bcl-2, Bcl-XL, and Mcl-1) when FB1 was applied to SH-SY5Y cells. Initially, exposure to FB1 did not result in significant alterations in caspase-3-like protease activity. However, after a full day, 100 µM FB1 caused a slight but statistically insignificant increase in caspase-3 activity. During either FB1 treatment period, there was no caspase-3 or caspase-9 cleavage. Exposure to 100 µM FB1 for 72 h also did not affect the amounts of p53 in nuclear or cytoplasmic extracts. These findings are consistent with earlier research that did not discover a statistically significant rise in cell mortality at the concentrations examined (0.1–30 µM) [61,65,77].
On the other hand, in comparison to the control cells, FB1 had no effect on the expression of the pro-apoptotic protein Bax at any of the doses or time points. Furthermore, in SH-SY5Y cells, FB1 had no effect on the investigated anti-apoptotic proteins (Bcl-2, Bcl-XL, and Mcl-1) [85]. Another study suggested that mitochondria may be involved in FB1-mediated cell death because Bax expression rose 48 h after FB1 treatment in comparison to the control, whereas cytochrome C expression increased 24 h after FB1 treatment [61]. After exposure of neuroblastoma cells to FB1, there was a significant increase in JNK phosphorylation, which peaked at 48 h. Additionally, there was a significant increase in the expression of IRE1-α and PERK. Lastly, there was a significant activation of CHOP after 24 h of FB1 exposure [65].
8.2.2. Ochratoxin A (OTA)
8.2.3. T-2 Toxin
As for the T-2 toxin, it led to an increase in NRF2 protein expression, potentially indicating an adaptive response to oxidative stress induced by the toxin [69].
Regarding mycotoxins, FB1 significantly increased the phosphorylation of JNK in neuroblastoma cells, as well as significantly increasing the expression of CHOP, IRE1-α, and PERK. OTA treatment in SH-SY5Y activated caspase-9 and caspase-3 in one study but not in another. Finally, the T-2 toxin increased NRF2 protein expression. Therefore, more studies are needed in order to state that FB1, OTA, and the T-2 toxin lead to a modulation in protein expression in SH-SY5Y cells (Table 11).
9. Natural Bioactive Compounds
For all of the above, we can conclude that AA produces toxicity in several neuronal cell lines in a dose- and time- dependent manner; nevertheless, some authors have shown that besides AA toxicity, some natural compounds may reduce this effect on neuronal cells. Pre-treatment with 6 µM curcumin was found to considerably reduce the neuronal toxicity caused by 2.5 mM AA. This was demonstrated by improved cell viability, reduced levels of intracellular ROS and MDA, and increased levels of GSH. Additionally, curcumin pre-treatment eliminated aberrant tau phosphorylation, P-CREB decrease, and CHOP-induced apoptosis in SH-SY5Y cells, further lowered GSK-3β and ATF4 activity, and blocked PERK-dependent eIF2α phosphorylation [42]. In this same line, but with another compound, Chen and Chou 2015 [44] demonstrated that 0.25, 0.5, and 1 mM of caffeine attenuated 2 mM AA-inhibited phosphorylation of MAPKs in U-1240 MG cells. In addition, 50 µM of Z-VAD-fmk, a pan-caspase inhibitor, could be a protective compound against 0 to 5 mM of AA by abolishing caspase-3 activities in cells exposed to AA, lowering LDH leakage and increasing cell viability [50].
One step further, and in order to obtain more accurate results, Ning et al., 2021 [73], showed that 0.014 to 10 µg/mL of triphala, a herbal mixture from India, suppressed 10 mM AA-induced neurotoxicity and scavenged free radicals in a zebrafish model, suggesting that triphala could be a potential agent to treat neurodegenerative diseases associated with oxidative stress (Table 12).
Regarding mycotoxins and possible strategies to mitigate the cytotoxicity of this compound, several studies have reported the cytoprotective capacity of some bioactive compounds, such as Allium sativum L. garlic against BEA and ZEA metabolites [60], coffee by-products against BEA [58], NAC against FB1 [65], lutein, zeaxanthin, and goji berries extract against BEA [62], and beetroot extract against FB1 and OTA [67] (Table 12).
10. Discussion
Overall, all AA studies were carried out in SH-SY5Y, except two that used U-1240 MG and PC12 cells, the range of concentrations went from 0.1 to 10 mM, and to highlight the techniques employed the most widely used was the MTT (13%), followed by the axonopathy assay (9%) and qPCR, Annexin V-FITC/PI apoptosis, GSH, and ROS assays (7% in all cases). Caspase-3 activity, Trypan blue, LDH assays, Calcein-AM, Neurite quantification, and phase-contrast microscopy were used in a proportion of 4% each. Finally, CCK8, SF, ELISA cytometry, DNA fragmentation detection, morphology assay, biochemical indicators, Western blot, immunocytochemistry, immunoprecipitation, immunofluorescence, and cytokine assessment were used in proportions of 2% for each one (Figure 2a).
Regarding mycotoxins, the main cells studied where SH-SY5Y, and the range of concentrations went from 0.009 to 200 µM. The most used techniques were MTT (39%), LDH (22%), ROS (19%), apoptosis, and MMP (17% in both cases), followed by RT-PCR (13%), Western blot, GSH/GSSH ratio, and cell cycle (9% in all cases). DNA fragmentation, lipid peroxidation, enzymes activity (4%), and the rest of the assays performed in SH-SY5Y cells were used in proportions of 2% for each one (Figure 2b).
As for the main MoA studied in SH-SY5Y cells treated with AA, cytotoxicity reached 32%, followed by axonopathy with a 20%, and the study of protein expression achieving 14% of the total of studies.
Concerning the mycotoxins, the main MoA studied in SH-SY5Y cells included cytotoxicity which reached 30%, mitochondrial membrane potential alterations at 16%, and oxidative stress at 15%.
On the other hand, several bioactive compounds were tested to modulate AA toxicity in this review; the use of curcumin, caffein, Z-VAD-fmk, and triphala was reported.
The most studied mycotoxin in SH-SY5Y cells was BEA, followed by ZEA and its metabolites, OTA and FB1.
11. Conclusions
Overall, we could conclude that the common toxic effects reported for both AA and several mycotoxins highlight an interesting field to investigate, not only because of their presence in the diet but also for the possibility of the merged effect on human health and its consequences at the neuronal level. Although there are several assays which report toxic effects, for these compounds the most used assays were MTT followed by axonopathy and qPCR, the less frequent assays were ELISA, SF, and CCK8, among others in the case of AA. For mycotoxins, MTT, LDH, ROS, apoptosis, MMP, and RT-PCR were the most employed techniques and MitoSOX, DAPI staining, Ca2+ measurement, and CCK-8 assay, among others, were less frequently used. The MoA reported were cytotoxicity, axonopathy, protein expression, apoptosis, increased cellular reactive oxygen species, and a reduction in intracellular GSH, impaired neurite outgrowth during differentiation in SH-SY5Y, and other neuronal cells, in a time- and concentration-dependent manner for AA and cytotoxicity, oxidative stress, gene expression, apoptosis, protein expression, cell cycle disruption, and genotoxicity in a in a time- and concentration-dependent manner for mycotoxins. Furthermore, similar to mycotoxins, AA modulated signaling pathways related to inflammation, oxidative stress, apoptosis, and differentiation through changes in the expression of proteins involved in different processes.
Although AA and mycotoxins neurotoxicity has been widely reported in the literature, several bioactive compounds naturally present in food products could reduce the toxic effects of AA and mycotoxins, according to the literature. On one hand, curcumin, caffein, Z-VAD-fmk, and triphala, tested in a similar percentage, have been shown to mitigate AA toxicity. On the other hand, Allium sativum L. garlic, coffee by-products, NAC, lutein, zeaxanthin, goji berries, and beetroot extract have shown to cytoprotect SH-SY5Y cells against mycotoxins like BEA, OTA, and FB1. Nevertheless, more in vivo and in vitro studies are needed to better investigate not only AA and mycotoxins’ neuronal damage but also the possible beneficial role of bioactive compounds and how this mechanism of reduction in damage is happening.
12. Materials and Methods
For this review, a standard systematic literature search in PubMed, Scopus, and Web of Science was conducted by including the terms “acrylamide”, “mycotoxins”, “OTA”, “DON”, “BEA”, “ZEA”, “FB1”, “ENN”, “T-2”, “neurotoxicity”, “toxicity” “neuroblastoma”, “in vitro”, and “SH-SY5Y”. The application of these search terms aimed to cover most of the literature regarding the study of the AA neurotoxicity research in the SH-SY5Y cell line. In order to discard unnecessary, incomplete, or irrelevant literature, the abstracts of the reports obtained were assessed. The search retrieved 97 articles, of which 59 were original, accessible, and AA-specific papers and thus were included in the analysis. The exclusion criteria for the remaining 38 articles were associated to the following: (i) written in a language different from English and/or not available online, (ii) representing a review, or (iii) not specific for AA and mycotoxins.
Author Contributions
Conceptualization, H.B., C.J. and A.J.-G.; methodology, H.B., C.J. and A.J.-G.; formal analysis, H.B., A.J.-G. and L.B.; investigation, H.B., A.J.-G. and L.B.; resources, H.B., C.J. and A.J.-G.; data curation, H.B., L.B. and A.J.-G.; writing—original draft preparation, H.B., A.J.-G. and L.B.; writing—review and editing, H.B., C.J. and A.J.-G.; visualization, H.B. and A.J.-G.; supervision, H.B. and A.J.-G.; project administration, H.B. and A.J.-G.; funding acquisition, H.B., C.J. and A.J.-G. All authors have read and agreed to the published version of the manuscript.
Funding
This research was funded by the Spanish Ministry of Science and Innovation grant number PID2020-115871RB-100-ALI, and Conselleria d´Educació, Universitats i Ocupació from Generalitat Valenciana CIAICO-2022/199 and project AICO/2021/037. L.B.T. would like to acknowledge the pre-PhD scholarship program from the Generalitat Valenciana (CIACIF/2021/203).
Institutional Review Board Statement
Not applicable.
Informed Consent Statement
Not applicable.
Data Availability Statement
Data is contained within the article.
Conflicts of Interest
The authors declare no conflict of interest.
References
- Anese, M. Acrylamide in coffee and coffee substitutes. In Acrylamide in Food: Analysis, Content and Potential Health Effects; Academic Press Elsevier: Waltham, MA, USA, 2016. [Google Scholar] [CrossRef]
- Guenther, H.; Anklam, E.; Wenzl, T.; Stadler, R.H. Acrylamide in Coffee: Review of Progress in Analysis, Formation and Level Reduction. Food Addit. Contam. 2007, 24, 60–70. [Google Scholar] [CrossRef] [PubMed]
- Soares, C.M.D.; Alves, R.C.; Oliveira, M.B.P.P. Factors Affecting Acrylamide Levels in Coffee Beverages. Coffee Health Dis. Prev. 2015, 32, 217–224. [Google Scholar] [CrossRef]
- Rannou, C.; Laroque, D.; Renault, E.; Prost, C.; Sérot, T. Mitigation Strategies of Acrylamide, Furans, Heterocyclic Amines and Browning during the Maillard Reaction in Foods. Food Res. Int. 2016, 90, 154–176. [Google Scholar] [CrossRef] [PubMed]
- Taeymans, D.; Wood, J.; Ashby, P.; Blank, I.; Studer, A.; Stadler, R.H.; Gondé, P.; Eijck, P.; Lalljie, S.; Lingnert, H.; et al. A Review of Acrylamide: An Industry Perspective on Research, Analysis, Formation, and Control. Crit. Rev. Food Sci. Nutr. 2004, 44, 323–347. [Google Scholar] [CrossRef]
- Tareke, E.; Rydberg, P.; Karlsson, P.; Eriksson, S.; Törnqvist, M. Analysis of Acrylamide, a Carcinogen Formed in Heated Foodstuffs. J. Agric. Food Chem. 2002, 50, 4998–5006. [Google Scholar] [CrossRef] [PubMed]
- Xiang, J.; Liu, F.; Wang, B.; Chen, L.; Liu, W.; Tan, S. A Literature Review on Maillard Reaction Based on Milk Proteins and Carbohydrates in Food and Pharmaceutical Products: Advantages, Disadvantages, and Avoidance Strategies. Foods 2021, 10, 1998. [Google Scholar] [CrossRef] [PubMed]
- LoPachin, R.M. Acrylamide Neurotoxicity: Neurological, Morhological and Molecular Endpoints in Animal Models. Adv. Exp. Med. Biol. 2005, 561, 21–37. [Google Scholar] [PubMed]
- Tepe, Y.; Çebi, A. Acrylamide in Environmental Water: A Review on Sources, Exposure, and Public Health Risks. Expo. Health 2019, 11, 3–12. [Google Scholar] [CrossRef]
- Michalak, J.; Czarnowska-Kujawska, M.; Klepacka, J.; Gujska, E. Zbieta Effect of Microwave Heating on the Acrylamide Formation in Foods. Molecules 2020, 25, 4140. [Google Scholar] [CrossRef]
- Acrylamide (IARC Summary & Evaluation, Volume 60, 1994). Available online: https://inchem.org/documents/iarc/vol60/m60-11.html (accessed on 29 June 2023).
- EUR-Lex—32017R2158—EN—EUR-Lex. Available online: https://eur-lex.europa.eu/legal-content/EN/TXT/?uri=CELEX:32017R2158 (accessed on 29 June 2023).
- All News—ECHA. Available online: https://echa.europa.eu/-/one-hazardous-chemical-added-to-the-candidate-list (accessed on 29 June 2023).
- Exon, J.H. A Review of the Toxicology of Acrylamide. J. Toxicol. Environ. Health B Crit. Rev. 2006, 9, 397–412. [Google Scholar] [CrossRef]
- Friedman, M.; Mottram, D. Chemistry and Safety of Acrylamide in Food; Springer: New York, NY, USA, 2005; p. 561. [Google Scholar] [CrossRef]
- Ghanayem, B.I.; McDaniel, L.P.; Churchwell, M.I.; Twaddle, N.C.; Snyder, R.; Fennell, T.R.; Doerge, D.R. Role of CYP2E1 in the Epoxidation of Acrylamide to Glycidamide and Formation of DNA and Hemoglobin Adducts. Toxicol. Sci. 2005, 88, 311–318. [Google Scholar] [CrossRef]
- Nowak, A.; Zakłos-Szyda, M.; Zyzelewicz, D.; Koszucka, A.; Motyl, I. Acrylamide Decreases Cell Viability, and Provides Oxidative Stress, DNA Damage, and Apoptosis in Human Colon Adenocarcinoma Cell Line Caco-2. Molecules 2020, 25, 368. [Google Scholar] [CrossRef] [PubMed]
- Eisenbrand, G. Revisiting the Evidence for Genotoxicity of Acrylamide (AA), Key to Risk Assessment of Dietary AA Exposure. Arch. Toxicol. 2020, 94, 2939–2950. [Google Scholar] [CrossRef] [PubMed]
- Kopańska, M.; Łagowska, A.; Kuduk, B.; Banaś-Ząbczyk, A. Acrylamide Neurotoxicity as a Possible Factor Responsible for Inflammation in the Cholinergic Nervous System. Int. J. Mol. Sci. 2022, 23, 2030. [Google Scholar] [CrossRef] [PubMed]
- LoPachin, R.M.; Gavin, T. Molecular Mechanism of Acrylamide Neurotoxicity: Lessons Learned from Organic Chemistry. Environ. Health Perspect. 2012, 120, 1650–1657. [Google Scholar] [CrossRef] [PubMed]
- Tola, M.; Kebede, B. Occurrence, Importance and Control of Mycotoxins: A Review. Cogent Food Agric. 2016, 2, 1191103. [Google Scholar] [CrossRef]
- Zain, M.E. Impact of Mycotoxins on Humans and Animals. J. Saudi Chem. Soc. 2011, 15, 129–144. [Google Scholar] [CrossRef]
- El-Sayed, R.A.; Jebur, A.B.; Kang, W.; El-Demerdash, F.M. An Overview on the Major Mycotoxins in Food Products: Characteristics, Toxicity, and Analysis. J. Future Foods 2022, 2, 91–102. [Google Scholar] [CrossRef]
- Wang, L.; Huang, Q.; Wu, J.; Wu, W.; Jiang, J.; Yan, H.; Huang, J.; Sun, Y.; Deng, Y. The metabolism and biotransformation of AFB1: Key enzymes and pathways. Biochem. Pharmacol. 2022, 199, 115005. [Google Scholar] [CrossRef]
- Sun, Y.; Jiang, J.; Mu, P.; Lin, R.; Wen, J.; Deng, Y. Toxicokinetics and metabolism of deoxynivalenol in animals and humans. Arch. Toxicol. 2022, 96, 2639–2654. [Google Scholar] [CrossRef]
- Abudayyak, M.; Karaman, E.F.; Ozden, S. Mechanisms Underlying Citrinin-Induced Toxicity via Oxidative Stress and Apoptosis-Mediated by Mitochondrial-Dependent Pathway in SH-SY5Y Cells. Drug Chem. Toxicol. 2022, 46, 944–954. [Google Scholar] [CrossRef]
- Doi, K.; Uetsuka, K. Mechanisms of Mycotoxin-Induced Neurotoxicity through Oxidative Stress-Associated Pathways. Int. J. Mol. Sci. 2011, 12, 5213–5237. [Google Scholar] [CrossRef] [PubMed]
- RASFF. The Rapid Alert System for Food and Feed- 2020 Annual Report. European Commission 2020. 2020. Available online: https://ec.europa.eu/food/system/files/2021-08/rasff_pub_annual-report_2020.pdf (accessed on 8 January 2024).
- Xie, H.R.; Hu, L.S.; Li, G.Y. SH-SY5Y Human Neuroblastoma Cell Line: In Vitro Cell Model of Dopaminergic Neurons in Parkinson’s Disease. Chin. Med. J. 2010, 123, 1086–1092. [Google Scholar] [CrossRef]
- Kalinovskii, A.P.; Osmakov, D.I.; Koshelev, S.G.; Lubova, K.I.; Korolkova, Y.V.; Kozlov, S.A.; Andreev, Y.A. Retinoic Acid-Differentiated Neuroblastoma SH-SY5Y Is an Accessible In Vitro Model to Study Native Human Acid-Sensing Ion Channels 1a (ASIC1a). Biology 2022, 11, 167. [Google Scholar] [CrossRef] [PubMed]
- Singh, J.; Kaur, G. Transcriptional Regulation of Polysialylated Neural Cell Adhesion Molecule Expression by NMDA Receptor Activation in Retinoic Acid-Differentiated SH-SY5Y Neuroblastoma Cultures. Brain Res. 2007, 1154, 8–21. [Google Scholar] [CrossRef]
- IRIS Toxicological Review of Acrylamide (External Review Draft)|Risk Assessment Portal|US EPA. Available online: https://cfpub.epa.gov/ncea/risk/recordisplay.cfm?deid=187729 (accessed on 8 January 2024).
- Rifai, L.; Saleh, F.A. A Review on Acrylamide in Food: Occurrence, Toxicity, and Mitigation Strategies. Int. J. Toxicol. 2020, 39, 93–102. [Google Scholar] [CrossRef]
- Lineback, D.R.; Coughlin, J.R.; Stadler, R.H. Acrylamide in Foods: A Review of the Science and Future Considerations. Annu. Rev. Food Sci. Technol. 2012, 3, 15–35. [Google Scholar] [CrossRef]
- Iqbal, S.Z. Mycotoxins in food, recent development in food analysis and future challenges; a review. Curr. Opin. Food Sci. 2021, 42, 237–247. [Google Scholar] [CrossRef]
- Sebastià, A.; Pallarés, N.; Bridgeman, L.; Juan-García, A.; Castagnini, J.M.; Ferrer, E.; Barba, F.J.; Berrada, H. A Critical Review of Acrylamide Green Extraction and Determination in Food Matrices: Current Insights and Future Perspectives. TrAC Trends Anal. Chem. 2023, 167, 117267. [Google Scholar] [CrossRef]
- Leite, M.; Freitas, A.; Barbosa, J.; Ramos, F. Comprehensive Assessment of Different Extraction Methodologies for Optimization and Validation of an Analytical Multi-Method for Determination of Emerging and Regulated Mycotoxins in Maize by UHPLC-MS/MS. Food Chem. Adv. 2023, 2, 100145. [Google Scholar] [CrossRef]
- Bridgeman, L.; Juan, C.; Juan-García, A.; Berrada, H. Individual and Combined Effect of Acrylamide, Fumitremorgin C and Penitrem A on Human Neuroblastoma SH-SY5Y Cells. Food Chem. Toxicol. 2023, 182, 278–6915. [Google Scholar] [CrossRef]
- Riss, T.; Niles, A.; Moravec, R.; Karassina, N.; Vidugiriene, J. Cytotoxicity Assays: In Vitro Methods to Measure Dead Cells. In Assay Guidance Manual; Eli Lilly & Company and the National Center for Advancing Translational Sciences: Bethesda, MD, USA, 2019. [Google Scholar]
- Gupta, R.; Nanda, S.J. Cloud detection in satellite images with classical and deep neural network approach: A review. Multimed. Tools Appl. 2022, 81, 31847–31880. [Google Scholar] [CrossRef]
- Yan, D.; Pan, X.; Yao, J.; Wang, D.; Wu, X.; Chen, X.; Shi, N.; Yan, H. MAPKs and NF-ΚB-Mediated Acrylamide-Induced Neuropathy in Rat Striatum and Human Neuroblastoma Cells SY5Y. J. Cell Biochem. 2019, 120, 3898–3910. [Google Scholar] [CrossRef] [PubMed]
- Yan, D.; Wang, N.; Yao, J.; Wu, X.; Yuan, J.; Yan, H. Curcumin Attenuates the PERK-EIF2α Signaling to Relieve Acrylamide-Induced Neurotoxicity in SH SY5Y Neuroblastoma Cells. Neurochem. Res. 2022, 47, 1037–1048. [Google Scholar] [CrossRef] [PubMed]
- Song, G.; Liu, Z.; Wang, L.; Shi, R.; Chu, C.; Xiang, M.; Tian, Q.; Liu, X. Protective Effects of Lipoic Acid against Acrylamide-Induced Neurotoxicity: Involvement of Mitochondrial Energy Metabolism and Autophagy. Food Funct. 2017, 8, 4657–4667. [Google Scholar] [CrossRef] [PubMed]
- Chen, J.H.; Chou, C.C. Acrylamide Inhibits Cellular Differentiation of Human Neuroblastoma and Glioblastoma Cells. Food Chem. Toxicol. 2015, 82, 27–35. [Google Scholar] [CrossRef]
- Attoff, K.; Kertika, D.; Lundqvist, J.; Oredsson, S.; Forsby, A. Acrylamide Affects Proliferation and Differentiation of the Neural Progenitor Cell Line C17.2 and the Neuroblastoma Cell Line SH-SY5Y. Toxicol. Vitr. 2016, 35, 100–111. [Google Scholar] [CrossRef] [PubMed]
- Komoike, Y.; Matsuoka, M. Endoplasmic Reticulum Stress-Mediated Neuronal Apoptosis by Acrylamide Exposure. Toxicol. Appl. Pharmacol. 2016, 310, 68–77. [Google Scholar] [CrossRef] [PubMed]
- Chen, J.H.; Wu, K.Y.; Chiu, I.M.; Tsou, T.C.; Chou, C.C. Acrylamide-Induced Astrogliotic and Apoptotic Responses in Human Astrocytoma Cells. Toxicol. Vitr. 2009, 23, 855–861. [Google Scholar] [CrossRef]
- Okuno, T.; Matsuoka, M.; Sumizawa, T.; Igisu, H. Involvement of the Extracellular Signal-Regulated Protein Kinase Pathway in Phosphorylation of P53 Protein and Exerting Cytotoxicity in Human Neuroblastoma Cells (SH-SY5Y) Exposed to Acrylamide. Arch. Toxicol. 2006, 80, 146–153. [Google Scholar] [CrossRef]
- Sumizawa, T.; Igisu, H. Apoptosis Induced by Acrylamide in SH-SY5Y Cells. Arch. Toxicol. 2007, 81, 279–282. [Google Scholar] [CrossRef]
- Hartley, C.L.; Anderson, V.E.R.; Anderson, B.H.; Robertson, J. Acrylamide and 2,5-Hexanedione Induce Collapse of Neurofilaments in SH-SY5Y Human Neuroblastoma Cells to Form Perikaryal Inclusion Bodies. Neuropathol. Appl. Neurobiol. 1997, 23, 364–372. [Google Scholar] [CrossRef]
- Frimat, J.P.; Sisnaiske, J.; Subbiah, S.; Menne, H.; Godoy, P.; Lampen, P.; Leist, M.; Franzke, J.; Hengstler, J.G.; Van Thriel, C.; et al. The Network Formation Assay: A Spatially Standardized Neurite Outgrowth Analytical Display for Neurotoxicity Screening. Lab Chip 2010, 10, 701–709. [Google Scholar] [CrossRef] [PubMed]
- Nordin-Andersson, M.; Walum, E.; Kjellstrand, P.; Forsby, A. Acrylamide-Induced Effects on General and Neurospecific Cellular Functions during Exposure and Recovery. Cell Biol. Toxicol. 2003, 19, 43–51. [Google Scholar] [CrossRef] [PubMed]
- Lourenssen, S.; Miller, K.G.; Blennerhassett, M.G. Discrete Responses of Myenteric Neurons to Structural and Functional Damage by Neurotoxins in Vitro. Am. J. Physiol. Gastrointest Liver Physiol. 2009, 297, G228–G239. [Google Scholar] [CrossRef] [PubMed]
- Popova, D.; Karlsson, J.; Jacobsson, S.O.P. Comparison of Neurons Derived from Mouse P19, Rat PC12 and Human SH-SY5Y Cells in the Assessment of Chemical- and Toxin-Induced Neurotoxicity. BMC Pharmacol. Toxicol. 2017, 18, 42. [Google Scholar] [CrossRef] [PubMed]
- Ban, M.; Shimoda, R.; Chen, J. Investigation of Nanoplastic Cytotoxicity Using SH-SY5Y Human Neuroblastoma Cells and Polystyrene Nanoparticles. Toxicol. Vitr. 2021, 76, 105225. [Google Scholar] [CrossRef] [PubMed]
- Hallier-Vanuxeem, D.; Prieto, P.; Culot, M.; Diallo, H.; Landry, C.; Tähti, H.; Cecchelli, R. New Strategy for Alerting Central Nervous System Toxicity: Integration of Blood–Brain Barrier Toxicity and Permeability in Neurotoxicity Assessment. Toxicol. Vitr. 2009, 23, 447–453. [Google Scholar] [CrossRef] [PubMed]
- Juan-García, A.; Caprioli, G.; Sagratini, G.; Mañes, J.; Juan, C. Coffee Silverskin and Spent Coffee Suitable as Neuroprotectors against Cell Death by Beauvericin and α-Zearalenol: Evaluating Strategies of Treatment. Toxins 2021, 13, 132. [Google Scholar] [CrossRef] [PubMed]
- Juan, C.; de Simone, G.; Sagratini, G.; Caprioli, G.; Mañes, J.; Juan-García, A. Reducing the Effect of Beauvericin on Neuroblastoma SH-SY5Y Cell Line by Natural Products. Toxicon 2020, 188, 164–171. [Google Scholar] [CrossRef]
- Agahi, F.; Font, G.; Juan, C.; Juan-García, A. Individual and Combined Effect of Zearalenone Derivates and Beauvericin Mycotoxins on SH-SY5Y Cells. Toxins 2020, 12, 212. [Google Scholar] [CrossRef] [PubMed]
- Agahi, F.; Penalva-Olcina, R.; Font, G.; Juan-García, A.; Juan, C. Effects of Voghiera Garlic Extracts in Neuronal Human Cell Line against Zearalenone’s Derivates and Beauvericin. Food Chem. Toxicol. 2022, 162, 112905. [Google Scholar] [CrossRef]
- Pérez-Fuentes, N.; Alvariño, R.; Alfonso, A.; González-Jartín, J.; Gegunde, S.; Vieytes, M.R.; Botana, L.M. Single and Combined Effects of Regulated and Emerging Mycotoxins on Viability and Mitochondrial Function of SH-SY5Y Cells. Food Chem. Toxicol. 2021, 154, 112308. [Google Scholar] [CrossRef] [PubMed]
- Montesano, D.; Juan-García, A.; Mañes, J.; Juan, C. Chemoprotective Effect of Carotenoids from Lycium Barbarum L. on SH-SY5Y Neuroblastoma Cells Treated with Beauvericin. Food Chem. Toxicol. 2020, 141, 111414. [Google Scholar] [CrossRef] [PubMed]
- Kalagatur, N.K.; Abd_Allah, E.F.; Poda, S.; Kadirvelu, K.; Hashem, A.; Mudili, V.; Siddaiah, C. Quercetin Mitigates the Deoxynivalenol Mycotoxin Induced Apoptosis in SH-SY5Y Cells by Modulating the Oxidative Stress Mediators. Saudi J. Biol. Sci. 2021, 28, 465–477. [Google Scholar] [CrossRef]
- Stockmann-Juvala, H.; Mikkola, J.; Naarala, J.; Loikkanen, J.; Elovaara, E.; Savolainen, K. Oxidative Stress Induced by Fumonisin B1 in Continuous Human and Rodent Neural Cell Cultures. Free Radic. Res. 2009, 38, 933–942. [Google Scholar] [CrossRef]
- Paul, S.; Jakhar, R.; Bhardwaj, M.; Chauhan, A.K.; Kang, S.C. Fumonisin B1 Induces Poly (ADP-Ribose) (PAR) Polymer-Mediated Cell Death (Parthanatos) in Neuroblastoma. Food Chem. Toxicol. 2021, 154, 112326. [Google Scholar] [CrossRef] [PubMed]
- Domijan, A.M.; Abramov, A.Y. Fumonisin B1 Inhibits Mitochondrial Respiration and Deregulates Calcium Homeostasis--Implication to Mechanism of Cell Toxicity. Int. J. Biochem. Cell Biol. 2011, 43, 897–904. [Google Scholar] [CrossRef]
- Penalva-Olcina, R.; Juan, C.; Fernández-Franzón, M.; Juan-García, A. Effectiveness of Beetroot Extract in SH-SY5Y Neuronal Cell Protection against Fumonisin B1, Ochratoxin A and Its Combination. Food Chem. Toxicol. 2022, 165, 113164. [Google Scholar] [CrossRef]
- Yoon, S.; Cong, W.T.; Bang, Y.; Lee, S.N.; Yoon, C.S.; Kwack, S.J.; Kang, T.S.; Lee, K.Y.; Choi, J.K.; Choi, H.J. Proteome Response to Ochratoxin A-Induced Apoptotic Cell Death in Mouse Hippocampal HT22 Cells. Neurotoxicology 2009, 30, 666–676. [Google Scholar] [CrossRef]
- Pang, Y.; Zhang, L.; Liu, Q.; Peng, H.; He, J.; Jin, H.; Su, X.; Zhao, J.; Guo, J. NRF2/PGC-1α-Mediated Mitochondrial Biogenesis Contributes to T-2 Toxin-Induced Toxicity in Human Neuroblastoma SH-SY5Y Cells. Toxicol. Appl. Pharmacol. 2022, 451, 116167. [Google Scholar] [CrossRef]
- Venkataramana, M.; Chandra Nayaka, S.; Anand, T.; Rajesh, R.; Aiyaz, M.; Divakara, S.T.; Murali, H.S.; Prakash, H.S.; Lakshmana Rao, P.V. Zearalenone Induced Toxicity in SHSY-5Y Cells: The Role of Oxidative Stress Evidenced by N-Acetyl Cysteine. Food Chem. Toxicol. 2014, 65, 335–342. [Google Scholar] [CrossRef]
- Frangiamone, M.; Alonso-Garrido, M.; Font, G.; Cimbalo, A.; Manyes, L. Pumpkin Extract and Fermented Whey Individually and in Combination Alleviated AFB1- and OTA-Induced Alterations on Neuronal Differentiation in Vitro. Food Chem. Toxicol. 2022, 164, 113011. [Google Scholar] [CrossRef]
- Yu, C.P.; Pan, Y.L.; Wang, X.L.; Xin, R.; Li, H.Q.; Lei, Y.T.; Zhao, F.F.; Zhang, D.; Zhou, X.R.; Ma, W.W.; et al. Stimulating the Expression of Sphingosine Kinase 1 (SphK1) Is Beneficial to Reduce Acrylamide-Induced Nerve Cell Damage. Ecotoxicol. Environ. Saf. 2022, 237, 113511. [Google Scholar] [CrossRef]
- Ning, W.; Li, S.; Tsering, J.; Ma, Y.; Li, H.; Ma, Y.; Ogbuehi, A.C.; Pan, H.; Li, H.; Hu, S.; et al. Protective Effect of Triphala against Oxidative Stress-Induced Neurotoxicity. Biomed. Res. Int. 2021, 2021, 6674988. [Google Scholar] [CrossRef]
- Agahi, F.; Juan, C.; Font, G.; Juan-García, A. Neurotoxicity of Zearalenone’s Metabolites and Beauvericin Mycotoxins via Apoptosis and Cell Cycle Disruption. Toxicology 2021, 456, 152784. [Google Scholar] [CrossRef]
- Agahi, F.; Álvarez-Ortega, N.; Font, G.; Juan-García, A.; Juan, C. Oxidative Stress, Glutathione, and Gene Expression as Key Indicators in SH-SY5Y Cells Exposed to Zearalenone Metabolites and Beauvericin. Toxicol. Lett. 2020, 334, 44–52. [Google Scholar] [CrossRef]
- Agahi, F.; Juan-García, A.; Font, G.; Juan, C. Study of Enzymatic Activity in Human Neuroblastoma Cells SH-SY5Y Exposed to Zearalenone’s Derivates and Beauvericin. Food Chem. Toxicol. 2021, 152, 112227. [Google Scholar] [CrossRef] [PubMed]
- Forsby, A. Neurite Degeneration in Human Neuronal SH-SY5Y Cells as an Indicator of Axonopathy. Neuromethods 2011, 56, 255–268. [Google Scholar]
- Nakagawa-Yagi, Y.; Choi, D.K.; Ogane, N.; Shimada, S.I.; Seya, M.; Momoi, T.; Ito, T.; Sakaki, Y. Discovery of a Novel Compound: Insight into Mechanisms for Acrylamide-Induced Axonopathy and Colchicine-Induced Apoptotic Neuronal Cell Death. Brain Res. 2001, 909, 8–19. [Google Scholar] [CrossRef] [PubMed]
- Nordin-Andersson, M.; Forsby, A.; Heldring, N.; DeJongh, J.; Kjellstrand, P.; Walum, E. Neurite Degeneration in Differentiated Human Neuroblastoma Cells. Toxicol. Vitr. 1998, 12, 557–560. [Google Scholar] [CrossRef] [PubMed]
- Attoff, K.; Johansson, Y.; Cediel-Ulloa, A.; Lundqvist, J.; Gupta, R.; Caiment, F.; Gliga, A.; Forsby, A. Acrylamide Alters CREB and Retinoic Acid Signalling Pathways during Differentiation of the Human Neuroblastoma SH-SY5Y Cell Line. Sci. Rep. 2020, 10, 16714. [Google Scholar] [CrossRef] [PubMed]
- Hinojosa, M.G.; Johansson, Y.; Cediel-Ulloa, A.; Ivanova, E.; Gabring, N.; Gliga, A.; Forsby, A. Evaluation of MRNA Markers in Differentiating Human SH-SY5Y Cells for Estimation of Developmental Neurotoxicity. Neurotoxicology 2023, 97, 65–77. [Google Scholar] [CrossRef] [PubMed]
- Sharma, R.; Gettings, S.M.; Hazell, G.; Bourbia, N. In Vitro Study of Ochratoxin A in the Expression of Genes Associated with Neuron Survival and Viability. Toxicology 2023, 483, 153376. [Google Scholar] [CrossRef]
- Zhang, X.; Boesch-Saadatmandi, C.; Lou, Y.; Wolffram, S.; Huebbe, P.; Rimbach, G. Ochratoxin A induces apoptosis in neuronal cells. Genes Nutr. 2009, 4, 41. [Google Scholar] [CrossRef]
- Sumizawa, T.; Igisu, H. Release of Heat Shock Proteins from Human Neuroblastoma Cells Exposed to Acrylamide. J. Toxicol. Sci. 2008, 33, 117–122. [Google Scholar] [CrossRef]
- Stockmann-Juvala, H.; Naarala, J.; Loikkanen, J.; Vähäkangas, K.; Savolainen, K. Fumonisin B1-Induced Apoptosis in Neuroblastoma, Glioblastoma and Hypothalamic Cell Lines. Toxicology 2006, 225, 234–241. [Google Scholar] [CrossRef] [PubMed]
Figure 1.
Proposed mechanism for AA formation as a side reaction of the Maillard reaction.
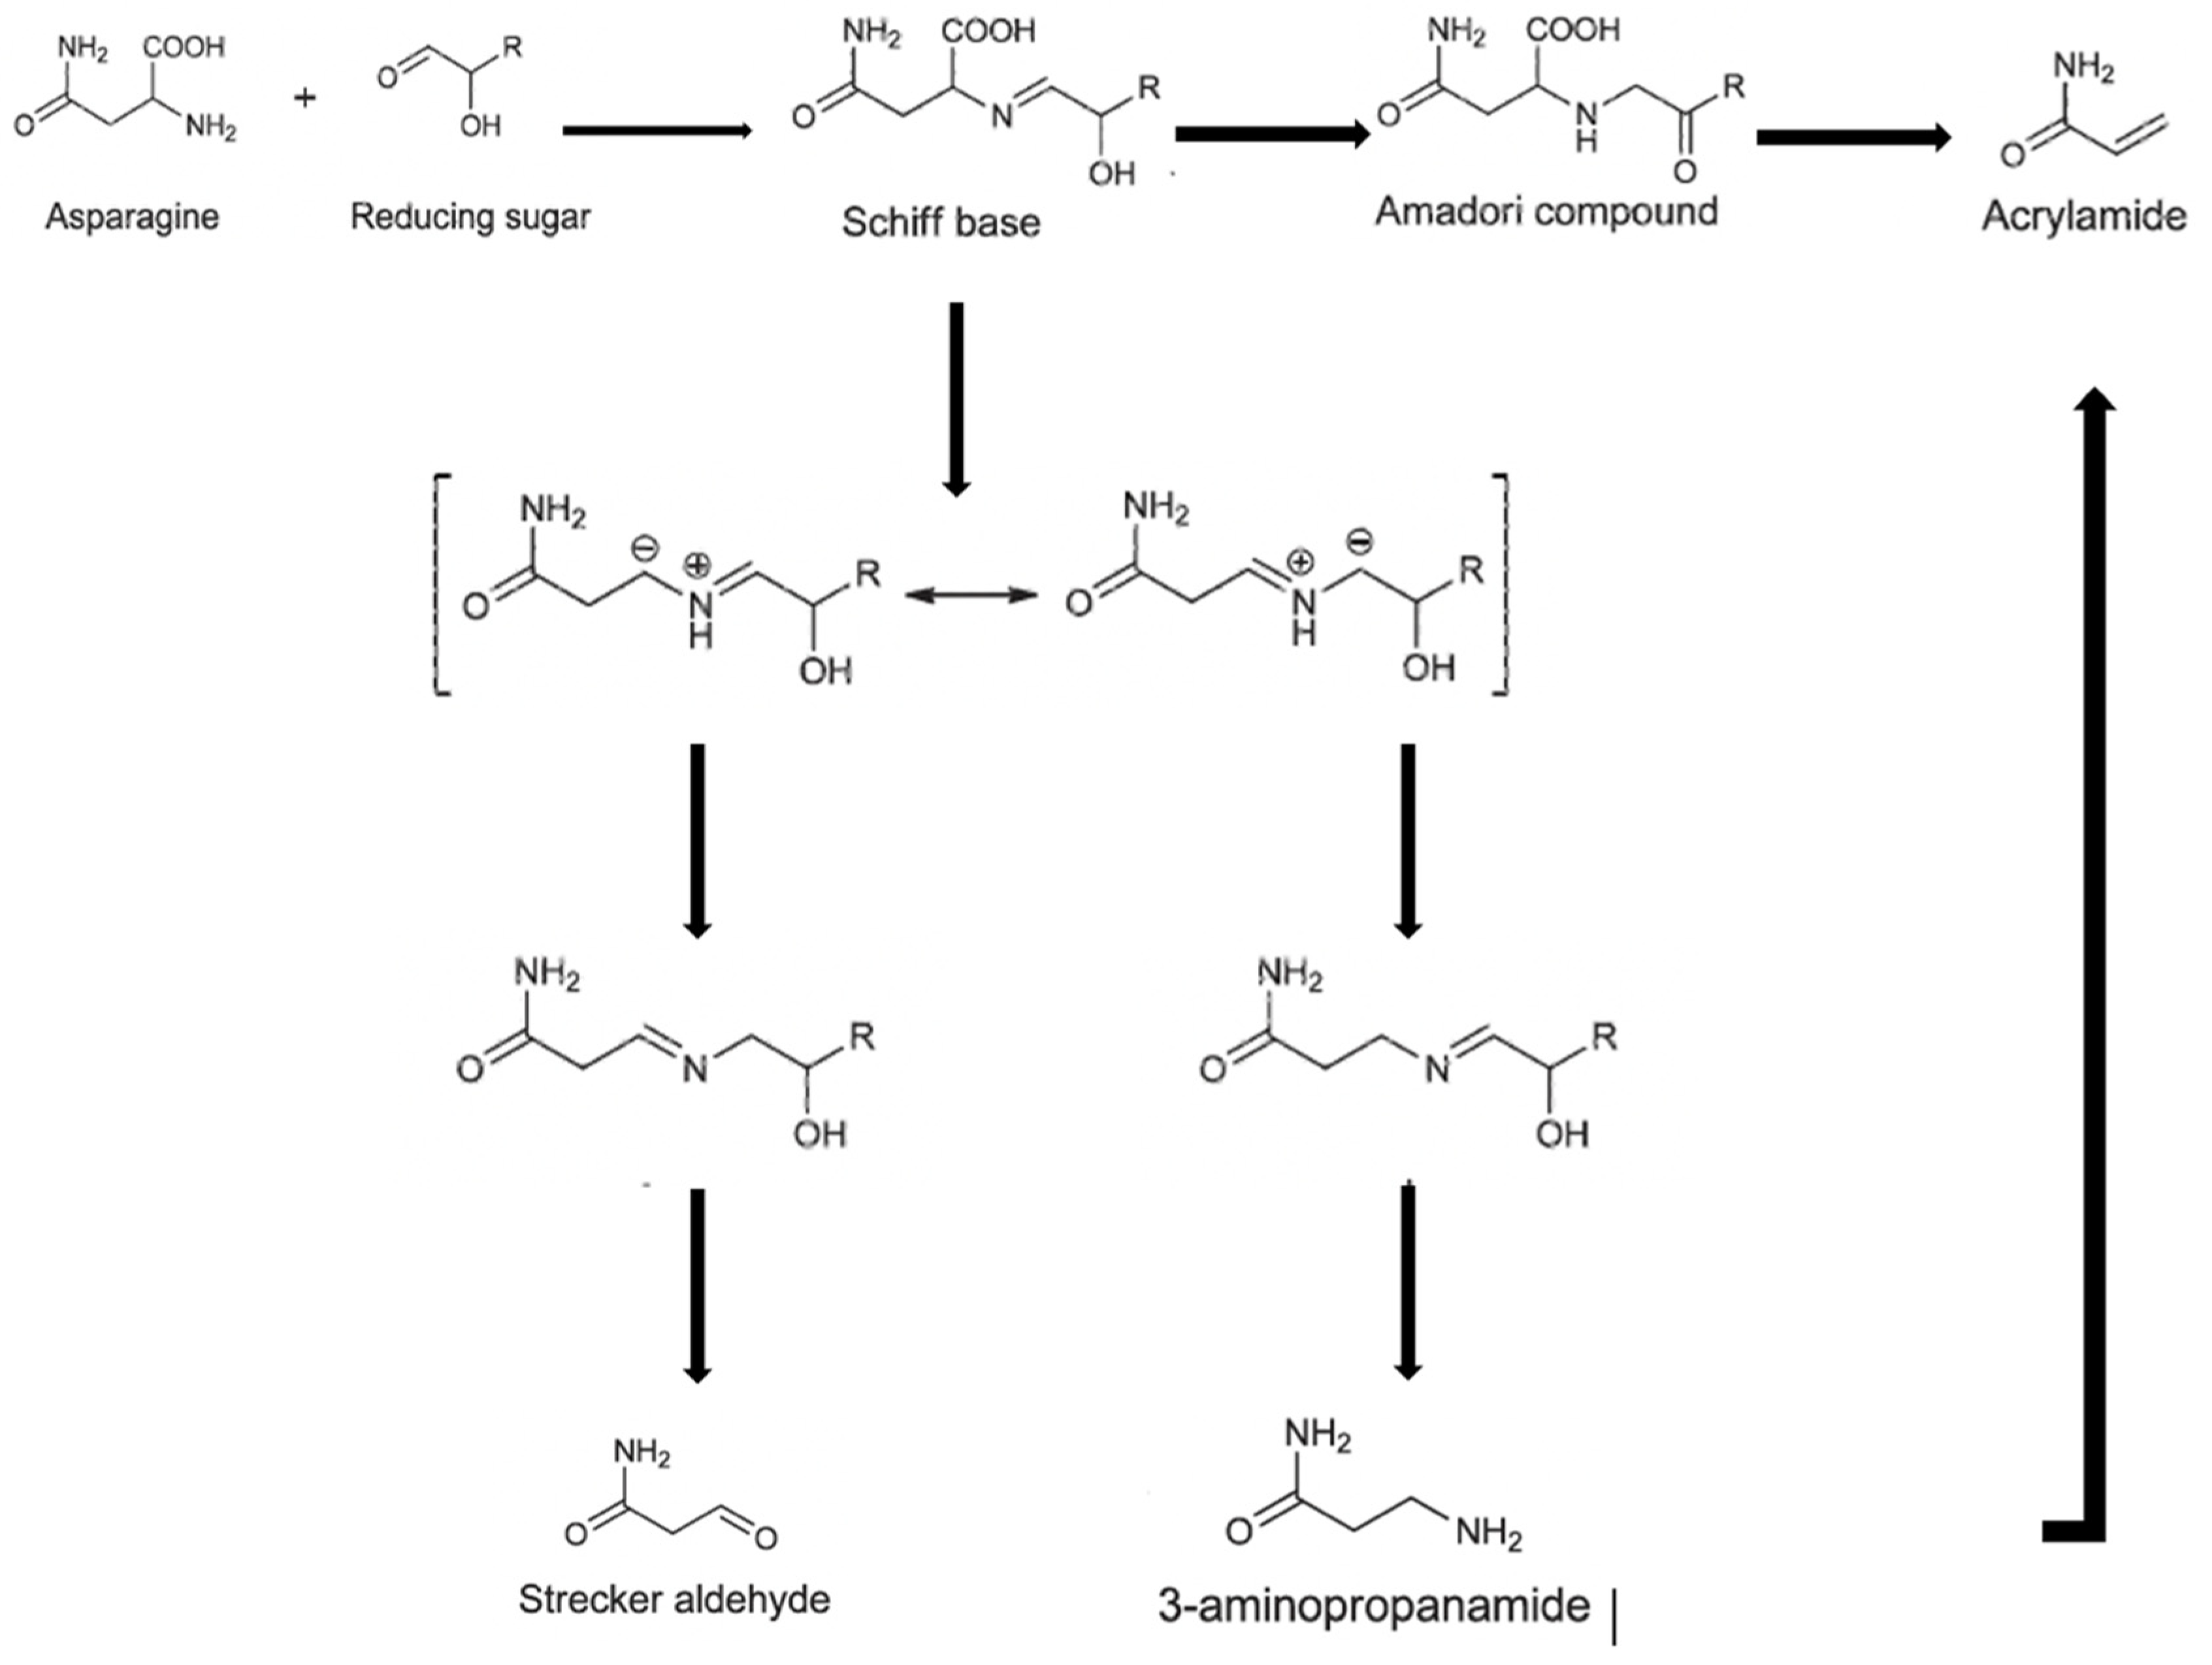
Figure 2.
(a) Percentage of employed assays in SH-SY5Y cells treated with AA according to publications reviewed (n = 27). (b). Percentage of employed assays in SH-SY5Y cells treated with mycotoxins according to publications reviewed (n = 36).
Figure 2.
(a) Percentage of employed assays in SH-SY5Y cells treated with AA according to publications reviewed (n = 27). (b). Percentage of employed assays in SH-SY5Y cells treated with mycotoxins according to publications reviewed (n = 36).
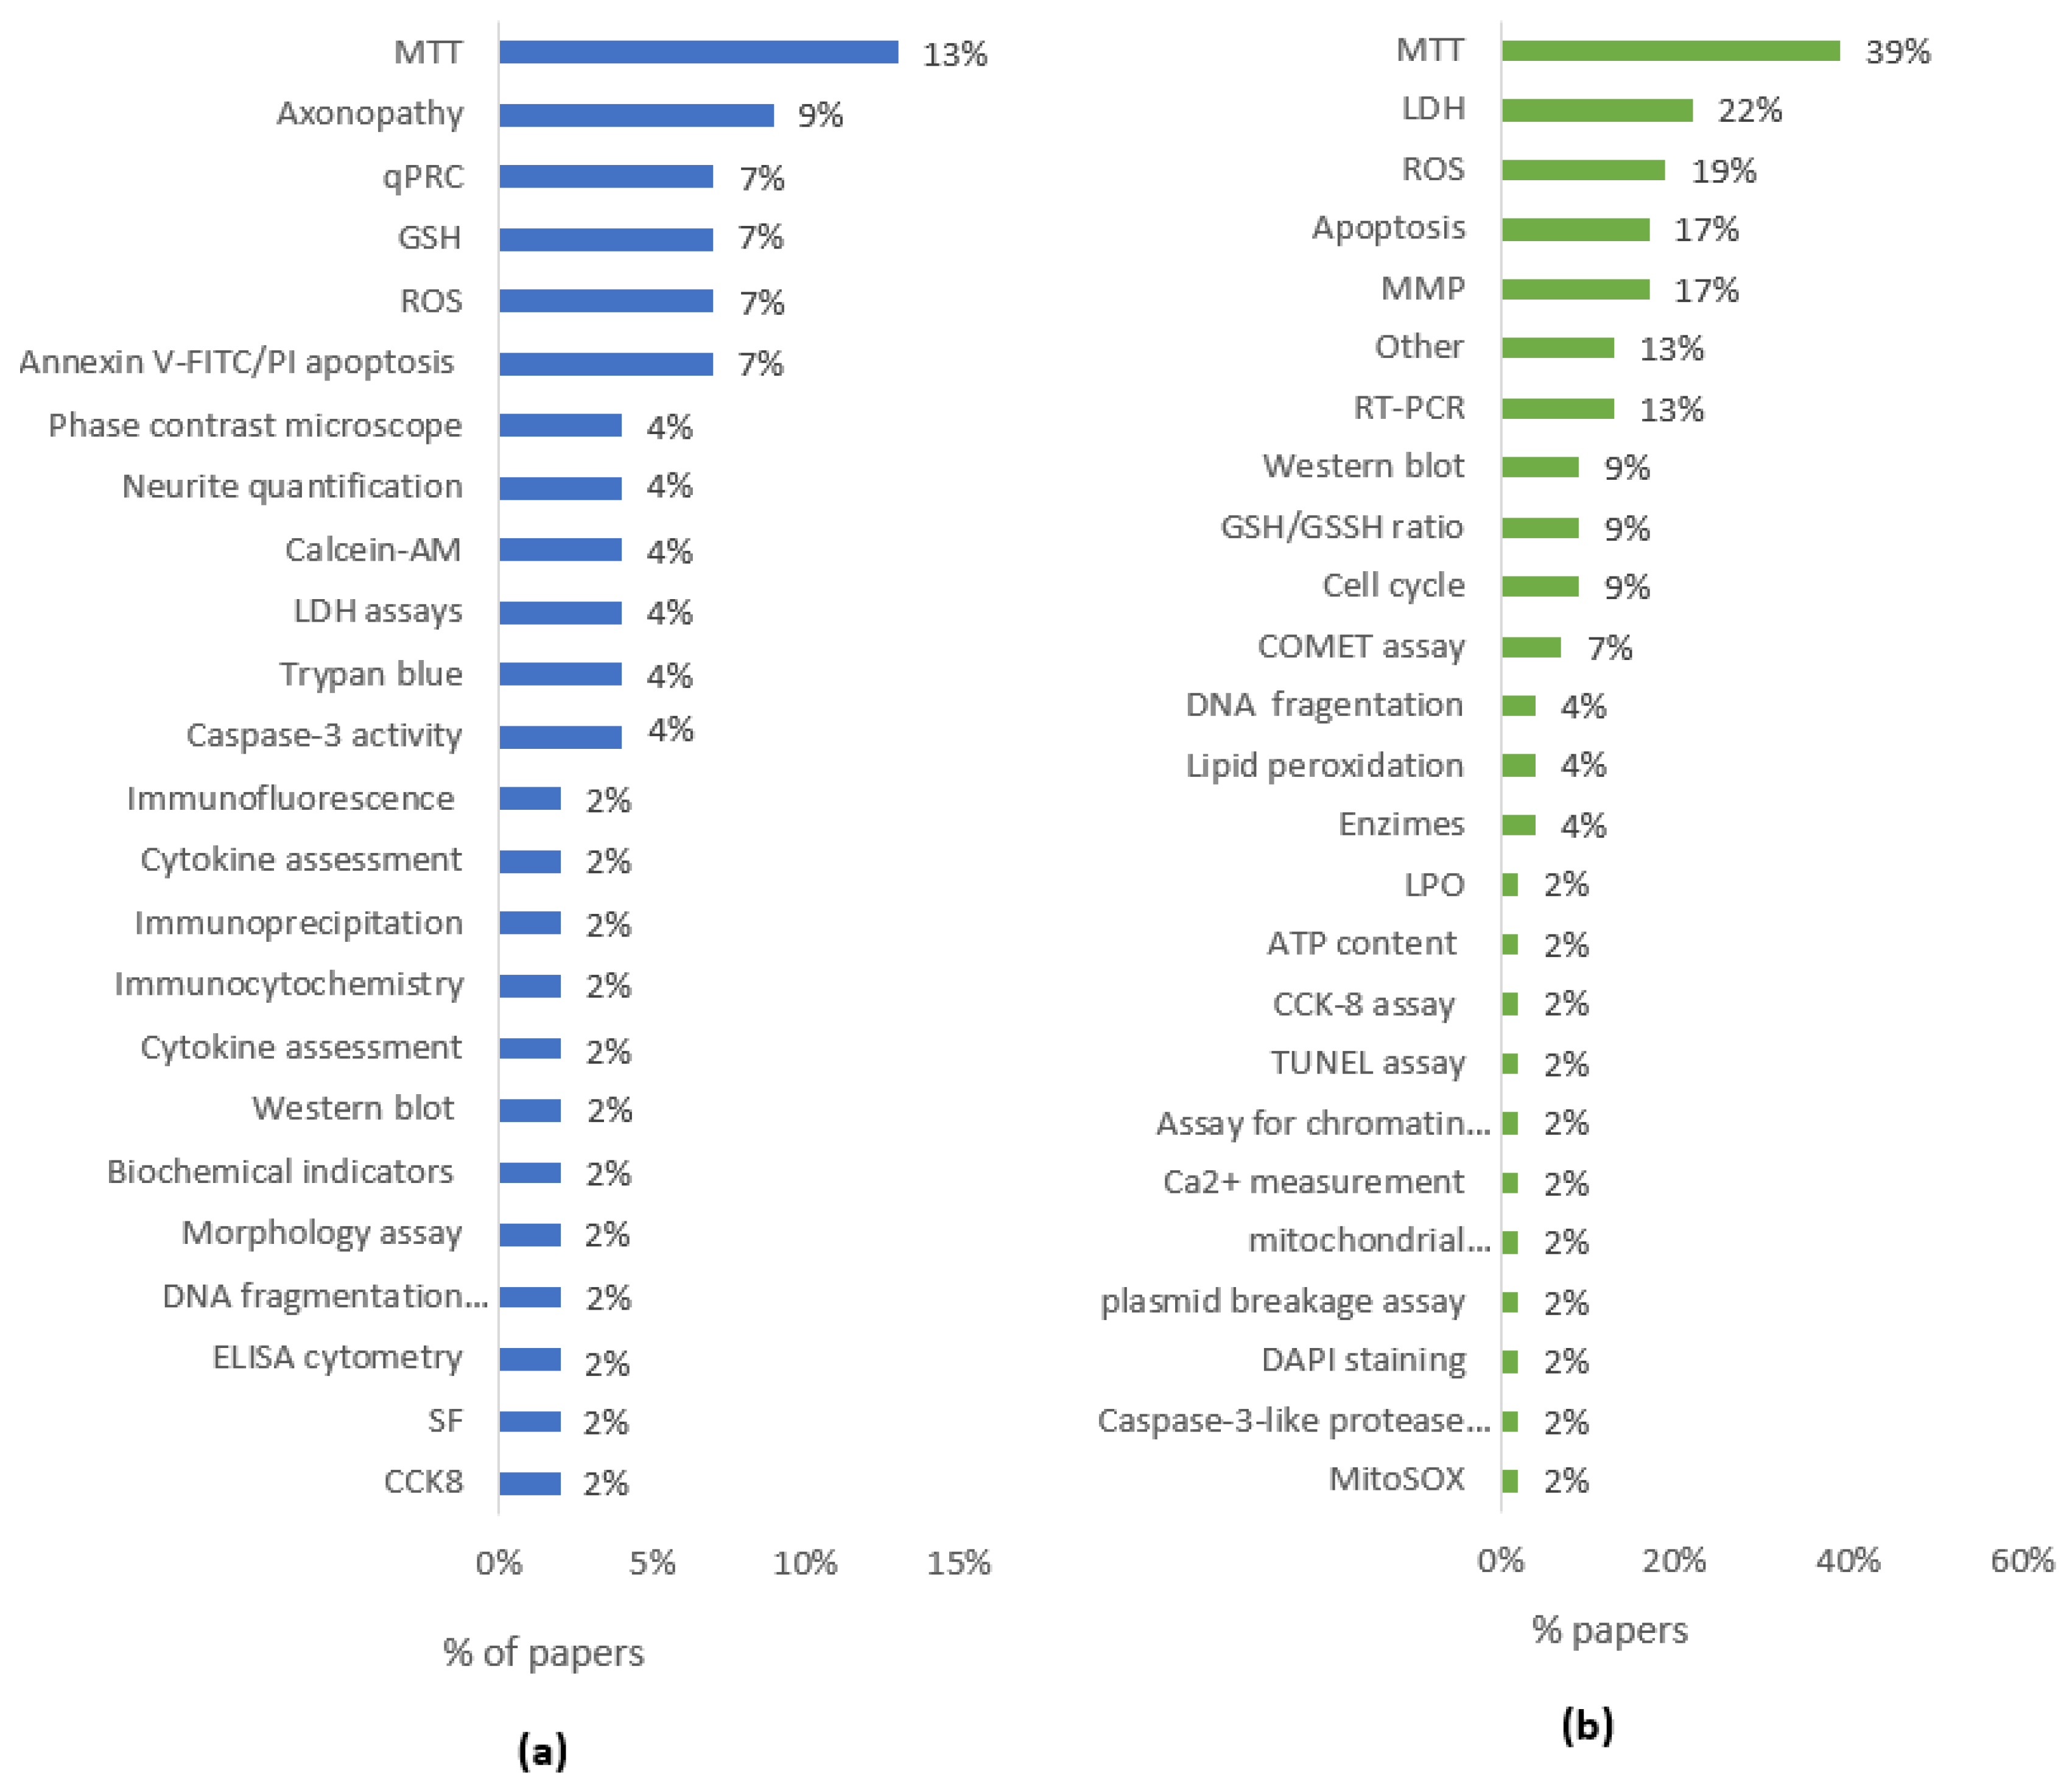

Table 1.
Cytotoxicity in SH-SY5Y cells. AA exposure conditions, assays, and effects.
| Dose | Exposure Time | Assays | Effects | References |
|---|---|---|---|---|
| 1 to 10 mM | 8 h | Cell Count Reagent SF | At 10 mM AA | [46] |
| 1–5 mM | 16 h, 20 h | Caspase-3 activity | At 1–5 mM | [45] |
| 2.5, 5, 7.5, and 10 mM | 24 h | CCK8 | Reduction of 14%, 35%, 48%, and 61%, respectively | [42] |
| 0.8, 20 and 500 μg/mL | 24 h | MTT | Reduction of 60% and 70% at the higher concentrations | [55] |
| 2, 2.5, 3, 4 and 5 mM | 24 h | MTT | Reduction of 10%, 18%, 20%, 25%, and 30% | [41] |
| 1.25, 2.5, 5 mM | 24 h | MTT | Significant loss of cell viability | [43] |
| 0–500 mM | 24 h | CellTiter-Blue Cell Viability Assay | IC50 5 mM NI20 0.26 mM | [52] |
| 1, 10 and 100 μM | 24 h | MTT, ATP, Caspase | 100 μM reduced cell viability | [56] |
| 0.01 mM to 12 mM. | 24 h | Propidium iodide and calcein-AM | 0.5–2.0 mM of AA was not cytotoxic; 4 mM, produced a significant loss of HuD-positive neurons (58 ± 7%), and the number of axons decreased to 21 ± 5% | [42] |
| 0.5–5 mM | 24 h | Trypan blue | Cytotoxic at 5 mM | [48] |
| 0.1–10 mM | 24 h | LDH assays | AA was cytotoxic at 10 mM | [49] |
| 0.1–1000 μM | 48 h | Calcein-AM, βIII-tubulin, and LDH assay | 10% reduction at 1 mM | [54] |
| 0–1000 µM | 72 h | Total protein content | >1000 μM IC50 | [52] |
| 0, 0.5, 1, 2, 5, and 10 mM | 0, 6, 12, 24, 48, and 72 h | Trypan blue and LDH | 10 mM reduced 38% cell viability at 6 h | [47] |
| 0, 0.1, 0.5, 1, and 2 mM | 24, 48, 72 h | MTT | Reduction of 20%, 30%, and 50% | [44] |
| 1–1000 μM. | 24, 48, and 72 h; 3, 6, and 10 days. | BradUrd, Sub-G1, 3H-thimidine, and MTT | Reduction of 30% (48 h) and 90% (72 h) At 100 μM or higher viability decreased at Day 3 and 6. | [45] |
AA: acrylamide, ATP: adenosine triphosphate, CCK8: Cell counting kit-8, IC50: 50% inhibition concentration, LDH: lactate dehydrogenase, MTT: (3-[4,5-dimethylthiazol-2-yl]-2,5 diphenyl tetrazolium bromide), NI20: 20% reduction in network formation.
Table 2.
Cytotoxicity in SH-SY5Y cells. Mycotoxin, exposure conditions, assays, and effects.
| Mycotoxin | Dose | Exposure Time | Assays | Effects | References |
|---|---|---|---|---|---|
| DON | 0–10 µM | 6 h and 24 h | MTT LDH | IC50: 2.25 µM at 24 h; 1.5 at 48 h Not cytotoxic | [61] |
| 0–200 µM | 6 h and 24 h | MTT LDH | IC50: 120 µM at 24 h | [63] | |
| BEA | 0.009–25 µM | 24 h, 48 h, and 72 h | MTT assay | BEA IC50: 2.5 at 72 h | [59] |
| 0.08–2.5 μM | 24 h and 48 h | MTT assay | Decrease of 43% in cell viability at 2.5 μM after 48 h | [60] | |
| 0.08–2.5 µM | 24 h and 48 h | MTT assay | IC50: 2.5 μM at 72 h | [58] | |
| 0.08–25 µM | 24 h and 48 h | MTT assay | IC50: 3.2 μM at 24 h; 5 μM at 48 h | [62] | |
| 0.1–30 µM | 6 h, 24 h, and 48 h | MTT assay LDH assay | IC50: 1.9 µM for 6 h, 1.7 µM for 24 h, and 1.5 µM for 48 h Inducing LDH leakage at 1 μM | [61] | |
| 0–2.5 µM | 24 h, 48 h, and 72 h | MTT assay | IC50 at 72 h was 2.5 µM | [57] | |
| ZEA α-ZEL and β-ZEL | 0.39–100 µM | 24 h, 48 h, and 72 h | MTT assay | IC50: α-ZEL: 20.8 at 48 h, 14.0 at 72 h β-ZEL: 94.3 at 24 h, 9.1 at 48 h, and 7.5 at 72 h | [59] |
| 0.4–12.5 μM | 24 h and 48 h | MTT assay | β-ZEL: 6.25, 12.5, and 25 μM from 31% to 82% | [60] | |
| 0.1–30 µM | 6 h, 24 h, and 48 h | MTT assay LDH assay | ZEA presented a IC50 of 17.4 μM LDH leakage at 20 µM (9.1 ± 8.9%) and 30 μM (19.5 ± 4.3%) at 24 h | [61] | |
| 25, 50, 75, 100 and 200 µM | MTT assay LDH | Decreased by 86% at 200 µM | [70] | ||
| FB1 | 0.1–30 µM | 6 h, 24 h, and 48 h | MTT assay LDH assay | At 30 µM after 48 h LDH not cytotoxic | [61] |
| 50 µM | 12 h, 24 h, and 48 h | LDH assay | FB1 led to LDH release at 12 h | [65] | |
| ENN’s | 0.1–30 µM | 6 h, 24 h, and 48 h | MTT assay LDH assay | ENN A IC50 of 2.4 µM at 6 h and 2.25 µM at 24 h ENN B IC50 of 0.43 μM at 24 h ENN A increased LDH at 5 and 10 μM at 6 h and 24 h ENN B showed LDH release of 20% at 0.25 μM after 24 h | [61] |
| OTA | 1, 10, or 100 µM | 30, 60 min, 24 h, | LDH | LDH at 1, 10, or 100 µM were 128% ± 1%, 125% ± 2%, and 200% ± 1% | [68] |
| 0.2–50 μM | 24 h and 48 h | MTT assay | IC50: 9.1 μM at 24 h; 5.8 μM at 48 h | [67] | |
| 130–0.20 nM | 24 h, 48 h, and 72 h 7 days | MTT assay | No IC50 was reached | [71] | |
| T-2 | 5–20 ng/mL T-2 | 1–48 h | CCK-8 assay LDH assay | Viability reduced 81.9%, at 5 ng/mL, 40.8% at 10 ng/mL, and 35.5% at 20 ng/mL LDH levels were increased by 1.8, 2.9, and 3.2 times | [69] |
BEA: Beauvericin, CCK8: Cell counting kit-8, DON: Deoxynivalenol, ENN’s: enniatin, FB1: Fumonisin B1, IC50: 50%inhibition concentration, LDH: lactate dehydrogenase, MTT: (3-[4,5-dimethylthiazol-2-yl]-2,5 diphenyl tetrazolium bromide), OTA: Ochratoxin A, ZEA: Zearalenone, α-ZEL: alpha-zearalenol, β-ZEL: beta-zearalenol.
Table 3.
Apoptosis in SH-SY5Y cells. AA exposure conditions, assays, and effects.
| Dose | Time | Assays | Effects | References |
|---|---|---|---|---|
| 2.5 mM | 24 h | Annexin V-FITC/PI apoptosis | The early apoptotic rate was 5.5%, the late apoptotic rate was 11.8% | [42] |
| 2.5 mM | 24 h | Annexin V-FITC/PI apoptosis | Induced apoptosis | [41] |
| 0.5–10 mM | 0–72 h | DNA fragmentation detection (mono and oilgonucleosomes) | DNA fragments increased | [47] |
| 1.25–2.5 mM | 24 h | Annexin V-FITC/PI apoptosis | Increased with increasing AA concentrations | [72] |
| 10 mM | 24 h | ELISA and cytometry | AA induced neuroapoptosis in zebrafishes and produced free radicals | [73] |
AA: acrylamide, DNA: deoxyribonucleic Acid, JNK: c-Jun N-terminal kinase, NF-κB: nuclear factor κB, SH-SY5Y: neuroblastoma cell line.
Table 4.
Apoptosis in SH-SY5Y cells. Mycotoxins exposure conditions, assays, and effects.
| Mycotoxin | Dose | Exposure Time | Assays | Effects | References |
|---|---|---|---|---|---|
| DON | 0–10 µM | 6 h and 24 h | Cell cycle, FC | Did not produce cell death | [61] |
| 0–200 µM | 6 h and 24 h | Apoptosis by FC | Induced apoptotic nuclei formation | [63] | |
| BEA | 2.5, 1.25, 0.78 and 0.39 μM | 24 h and 48 h | Cell cycle Apoptosis/necrosis | Cell cycle arrest at G0/G1; Apoptotic/necrotic cells increased up to 89% for 24 h and up to 38.8% for 48 h | [74] |
| 0.1–30 µM | 6 h, 24 h, and 48 h | FC analysis (Apoptosis) | Increase of 55.9 ± 8.6%. in apoptotic cells | [61] | |
| ZEA α-ZEL and β-ZEL | 12.5, 6.25, 3.12, and 1.56 μM | 24 h and 48 h | Cell cycle Apoptosis/necrosis | Concentration-dependent increase in G0/G1 phase at 24 h; α-ZEL increased apoptotic and apoptotic/necrotic cells at 24 h; β-ZEL increase apoptotic cells exposed to 12.5 μM after 24 and 48 h | [73] |
| 0.1–30 µM | 6 h, 24 h, and 48 h | FC analysis (Apoptosis) | Did not produce cell death | [61] | |
| FB1 | 0.1–100 µM | 48 h, 72 h, and 144 h | Cell viability (propidium Iodide) | Viability decreases at 100 µM at 48–144 h | [64] |
| 0.1–30 µM | 6 h, 24 h, and 48 h | FC analysis (Apoptosis) | Did not produce cell death | [61] | |
| 50 µM | 12 h, 24 h, and 48 h | Apoptosis assay (FC) | Induced apoptosis | [65] | |
| ENN’s | 0.1–30 µM | 6 h, 24 h, and 48 h | FC analysis (Apoptosis) | Increase in apoptotic cell death of 49.2 ± 8.2% at 24 h and 46.0 ± 9.3% at 48 h | [61] |
| OTA | 130–0.20 nM | 24 h, 48 h, and 72 h 7 days | Cell cycle (FC) | Low OTA doses altered neuronal differentiation and cell cycle | [71] |
BEA: Beauvericin, DON: Deoxynivalenol, ENN’s: enniatin, FB1: Fumonisin B1, FC: flow cytometry, OTA: Ochratoxin A, ZEA: Zearalenone, α-ZEL: alpha-zearalenol, β-ZEL: beta-zearalenol.
Table 5.
Oxidative stress. AA dose, exposure time, assays, effects, and references.
| Dose | Time | Assays | Effects | References |
|---|---|---|---|---|
| 10 mM | 6 h | ROS | Induces ROS | [46] |
| 2.5 mM and 5 mM | 24 h | GSH, MDA, and ROS | 2.5 and 5 mM decreased intracellular GSH production and increased MDA and ROS generation | [41] |
| 2.5 mM | 24 h | ROS (DCFH-DA) and LPO (MDA, GSH) | Maximal ROS production; 2.5 mM (+40%) MDA content: +100% 2.5 GSH content: −50% 2.5 mM | [42] |
DCFH-DA: Dichloro-dihydro-fluorescein diacetate, GSH: glutatión, LPO: lipid peroxidation, MDA: malondialdehyde, ROS: reactive oxygen species.
Table 6.
Oxidative stress. Mycotoxins dose, exposure time, assays, effects, and references.
| Mycotoxin | Dose | Exposure Time | Assays | Effects | References |
|---|---|---|---|---|---|
| DON | 0–200 µM | 6 h and 24 h | ROS generation by fluorometry LPO and antioxidant enzyme levels MMP | ROS generation for 6 and 24 h Induction of LPO and exhaustion of antioxidant enzymes Induction of MMP loss | [63] |
| BEA | 2.5, 1.25, 0.78, and 0.39 μM | 2 h, 24 h, and 48 h | ROS GSH | ROS decrease at 1.25 and 2.5 μM, from 45 to 120 min; GSH/GSSG ratio increased from 103% to 142% after 24 h | [75] |
| 2.5, 1.25, 0.78, and 0.39 μM | 24 h and 48 h | Glutathione peroxidase activity (GPx) Glutathione S-transferase (GST) activity Catalase (CAT) activity Superoxide dismutase (SOD) activity | GPx activity, BEA promoted a 9- to 17-fold increase after 24 h and a 2- to 9-fold for 48 h; GST activity, a slight increase (4–32% at 48 h) was obtained, while for SOD, a 2.5-fold increase at 48 h was shown; No significant differences for CAT were observed | [76] | |
| 0.1–30 µM | 6 h, 24 h, and 48 h | MMP | Alteration of mitochondrial membrane at 2.5–10 μM during 6–24 h | [61] | |
| ZEA α-ZEL and β-ZEL | 25, 12.5, 6.25, and 3.12 μM | 120 min, 24 h, and 48 h | ROS GSH | α-ZEL: at 25 μM increase from 5 to 60 min; β-ZEL: decrease at 12.5 μM from 5 to 90 min and at 25 μM from 15 to 30 min and from 60 to 120 min; GSH/GSSG ratio increased after 24 h at all concentrations from 111% to 148%, for α-ZEL and from 68% to 131% for β-ZEL | [75] |
| 12.5, 6.25, 3.12 and 1.56 μM | 24 h and 48 h | Glutathione peroxidase activity (GPx) Glutathione S-transferase (GST) activity Catalase (CAT) activity Superoxide dismutase (SOD) activity | GPx activity increased by 13.5- to 23-fold for α-ZEL and 9- to 17-fold for β-ZEL. For 24 h and 48 h; GST increased after 48 h of exposure to β-ZEL at 3.12 and 12.5 μM by 22% and 102%, respectively; CAT activity increased from 0.4- to 1.4-fold for α-ZEL and 1–4.2-fold for β-ZEL exposure after 48 h at all concentrations; SOD activity increased for α-ZEL up to 1.4-fold, and for β-ZEL up to 2.5-fold after 48 h | [76] | |
| 0.1–30 µM | 6 h, 24 h, and 48 h | MMP | ZEA produced a slight decrease at 30 μM after 24 h of incubation | [61] | |
| 25, 50, 75, 100 and 200 µM | ROS Lipid peroxidation assay MMP | ZEN increased ROS generation, LPO, and loss of MMP in a dose-dependent manner | [70] | ||
| FB1 | 0.1–100 µM | 48 h, 72 h, and 144 h | ROS Lipid Peroxidation GSH | Did not affect production of ROS; 100 µM increased MDA concentrations after a 24 h, 10 µM increased MDA levels at 72 h, 100 mM decreased GSH levels (61% of controls) at 144 h | [64] |
| 0.5–200 µM | 24 h and 48 h | ROS MitoSOX | 0.5, 5, and 50 µM, increased ROS production; All doses increased MitoSOX florescence | [66] | |
| 0.1–30 µM | 6 h, 24 h, and 48 h | MMP | No significant changes in ΔΨm | [61] | |
| 50 µM | 12 h, 24 h, and 48 h | ROS Mitochondrial superoxide level Ca2+ measurement | Increase in ROS production, mitochondrial ROS accumulation, and cellular Ca2+ level | [65] | |
| ENN’s | 0.1–30 µM | 6 h, 24 h, and 48 h | MMP | ENN A affected at 5 (79.0 ± 8.9%) and 10 μM (67.7 ± 14.5%,) after 6 h. At 24 h, ENN A affected to ΔΨm at all the concentrations tested; ENN B altered ΔΨm at 5 and 10 μM after 6 h and 24 h | [61] |
| OTA | 1, 10, or 100 µM OTA | 30, 60 min, 24 h, | ROS | 100 µM for 30 and 60 min, indicated the evocation of oxidative stress | [68] |
| T-2 | 5–20 ng/mL T-2 | 1–48 h | ROS level, GSH/GSSH ratio, ATP content, MMP | ROS levels significantly increased to 3.8 times at 5 ng/mL and 5.0 times at 10 ng/mL; The ratio of GSH to GSSG decreased to 79.8% at 5 ng/mL and 60.7% at 10 ng/mL; 5 and 10 ng/mL decreased the ΔΨm to 60.7% and 41.5%, while the ATP content decreased to 66.7% and 51.5% | [69] |
ATP: adenosine triphosphate, BEA: Beauvericin, DON: Deoxynivalenol, ENN’s: enniatin, FB1: Fumonisin B1, GSH: glutatión, LPO: lipid peroxidation, MDA: malondialdehyde, MMP: Mitochondrial membrane potential, ROS: reactive oxygen species, OTA: Ochratoxin A, ZEA: Zearalenone, α-ZEL: alpha-zearalenol, β-ZEL: beta-zearalenol.
Table 7.
Axonopathy in SH-SY5Y cells. AA exposure conditions, assays, and effects.
| Dose | Time | Assays | Effects | References |
|---|---|---|---|---|
| 0.5 mM or 1 mM | 0, 24, 48, and 72 h | Neuronal network integrity (neurites connections) | 1 mM AA, at 72 h network levels reduction | [77] |
| 100 nm and 10 pm | 3 and 6 days | Phase-contrast microscope | Impairs neurite outgrowth in a time- and dose-dependent manner | [45] |
| 0.8, 20 and 500 μg/mL | 24 h | Phase-contrast microscope | Number and the length of processes showed a gradually decreasing tendency | [55] |
| 0.5–2 mM | 24, 48, 72 h | Biochemical indicators for morphologic changes; | 1 and 2 mM resulted in cells with no neurite morphological extensions | [44] |
| 0.1–1 mmol/L | 72 h | Neurite quantification; | ND20 0.21 mmol/L | [52] |
| 0.25 mM | 24 h | Axonopathy (neurite degeneration assay | 0,25 mM 50% neurite degeneration | [78] |
| 4 mM | 24 h and 96 h | Neuronal and axon number | 4 mM reduced neuron number by 96 h, to 67.7% | [53] |
| 6 mM | 8 h | Axonopathy | Dose-dependent from 2.5 to 10 mM | [79] |
| 250 μM 670 μM | 72 h | Axonopathy | Concentration-dependent decrease in the number of neurites/cells. ND20: 250 IC20: 670 | [80] |
| 0.1–10 mM | 4 h, 24 h, and 48 h | Morphology assay | Differentiated cells were more sensitive to 1 mM compared with undifferentiated cells | [50] |
AA: acrylamide, BDNF: brain-derived neurotrophic factor, IC20: concentration causing 20% protein reduction, ND20: concentration causing 20% neurite degeneration.
Table 8.
Signaling pathways in SH-SY5Y cells. AA exposure conditions, assays, and effects.
| Dose | Time | Assays | Effects | References |
|---|---|---|---|---|
| 1–70 µM | 9 days | qPRC | CREB signaling was downregulated | [80] |
| 0, 1.25, 2.5 and 5 mM | 24 h | Cytokine assessment | NF-κB, MAPKs, JNK, and p38 signaling pathway were activated; | [41] |
| 2.5 mM | 24 h | Immunofluorescence (tau hyperphosphorylation (pS262)) | AA: +50% pS262 Activated the PERK-eIF2α signaling, triggered the activation of GSK-3β, and upregulated ATF4 and CHOP; Also, inhibited the activation of the PI3K/Akt pathway | [42] |
| 1.25, 2.5, 5 mM | 24 h | Western blot | Inhibited the activation of the PI3K/Akt pathway; Downregulation of AMPK, Sirt1, PGC-1α, and GSK3β; Phosphorylation by AA in a dose-dependent manner; Overexpression of COX-2 and iNOS | [43] |
AA: acrylamide, AMPK: AMP-activated protein kinase, COX: Prostaglandin-endoperoxide synthase, CREB: cAMP response element binding, CHOP: C/EBP homologous protein, GSK-3β: glycogen synthase kinase-3β, iNOS: inducible nitric oxide synthase, JNK: c-Jun N-terminal kinase, MAPKS: mitogen-activated protein kinases, PERK/eIF2α: protein kinase RNA-like endoplasmic reticulum kinase—Eukaryotic Initiation Factor 2 alpha, Pyk2: proline-rich tyrosine kinase 2 RNA (PKR)-like/Pancreatic ER Kinase, PI3K: phosphatidylinositol 3-kinase, PGC-1α: Peroxisome proliferator-activated receptor-gamma coactivator, qPCR: quantitative polymerase chain reaction, Sirt 1: NAD-dependent deacetylase sirtuin-1.
Table 9.
Gene expression and genotoxicity in SH-SY5Y cells. Mycotoxin dose, exposure conditions, assays, and effects.
Table 9.
Gene expression and genotoxicity in SH-SY5Y cells. Mycotoxin dose, exposure conditions, assays, and effects.
| Mycotoxin | Dose | Exposure Time | Assays | Effects | References |
|---|---|---|---|---|---|
| DON | 0–200 µM | 6 h and 24 h | Comet assay; Gene expression by qRT-PCR | Damage in DNA at 24 h; BDNF and TH mRNA expression were downregulated at 50 and 100 µM; AADC gene expression was downregulated at all concentrations | [63] |
| BEA | 2.5, 1.25, 0.78, and 0.39 μM | 2 h, 24 h, and 48 h | Gene expression assay by RT-PCR | Upregulated BCL2 mRNA | [73] |
| ZEA α-ZEL and β-ZEL | 25, 12.5, 6.25, and 3.12 μM | 120 min, 24 h, and 48 h | Gene expression assay by RT-PCR | α-ZEL: mRNA of CASP3 and BAX mRNA were overexpressed at 12.5 and 25 μM; β-ZEL: upregulated ERβ mRNA at 12.5 μM, while downregulated expression of CASP3 and BCL2 | [75] |
| 25, 50, 75, 100, and 200 µM | 3 h, 24 h | COMET assay; DAPI staining plasmid breakage assay; Gene expression by qRT-PCR | 25 µM increased the tail length by 31% ± 2.6%, and at 100 µM 83% ± 5.3%; Showed DNA fragmentation at 12 h and 24 h; 25 µM of ZEA: BDNF and TH mRNA expression decreased with increased concentration for 12 h and 24 h; AADC mRNA expression was suppressed at 25 µM; The mRNA expression of AADC was further abrogated by 50 and 100 µM | [70] | |
| FB1 | 1, 10, and 100 µM | 12 h, 24 h, 48 h, 72 h, and 144 h | DNA fragmentation | DNA ladders were obtained at 30 and 100 µM for 48 h | [76] |
| 50 µM | 12 h, 24 h and 48 h | Comet assay; TUNEL assay | Increased tail length and decreased head diameter time-dependently; At 24 and 48 h, increased TUNEL-positive cells | [65] | |
| OTA | 2 fM, 20 fM and 2 pM 0.001 μM, 0.01 μM, 0.05 μM, 0.1 μM, 0.5 μM, and 1 μM | 2 and 11 days | Gene expression by RT-qPCR | Expression of P53, BAX, and MAPT mRNA were reduced at Days 1 and 2; TPPP mRNA expression decreased at Day 1 at 1 μM | [82] |
| 0.1, 0.25, 0.5, 1.0 and 2.5 µM | 24 h and 48 h | DNA fragmentation assay | Concentration-dependent DNA laddering | [83] | |
| T-2 | 5–20 ng/mL T-2 | 1–48 h | Quantification of mitochondrial DNA copy number quantification; Gene expression by RT-qPCR | Reduced mtDNA copy number of 80.3% at 5 ng/mL and 60.9%, at 10 ng/mL; NRF2 mRNA expression increased to 1.7-fold at 5 ng/mL and 2.8-fold by 10 ng/mL; The expression of KEAP1 mRNA decreased to 77.0% and 45.4%; The expressions of PGC-1α and its downstream targets NRF1 and TFAM were distinctly inhibited | [69] |
BAX: Bcl-2 Associated X-protein, BCL2: B-cell leukemia/lymphoma 2 protein, BDNF: Brain-derived neurotrophic factor, BEA: Beauvericin, CASP3: cysteine–aspartic acid protease, DON: Deoxynivalenol, ENN’s: enniatin, Erβ: Estrogen receptor beta, FB1: Fumonisin B1, KEAP1: Kelch-like ECH-associated protein 1, NRF1: Nuclear respiratory factor-1, NRF2: nuclear factor erythroid 2–related factor 2, OTA: Ochratoxin A, P53: tumor protein p53, PGC-1α: Peroxisome proliferator-activated receptor-gamma coactivator, qPCR: quantitative polymerase chain reaction, TFAM: Mitochondrial transcription factor A, ZEA: Zearalenone, α-ZEL: alpha-zearalenol, β-ZEL: beta-zearalenol.
Table 10.
Protein expression in SH-SY5Y cells. AA exposure conditions, assays, and effects.
| Dose | Time | Assays | Effects | References |
|---|---|---|---|---|
| 1–5 mM | 16 h and 20 h | Increased the caspase-3 activity | [48] | |
| 0.5–5 mM | 18 h | Protein analysis | Hsp90, 70, and 27 levels increased, dose-depending; HSPs increases as the AA grows | [84] |
| 1–10 mM | 8 h | qPCR | Induction of the pro-apoptotic CHOP protein expression | [47] |
| 0.5–5 mM | 1–24 h | Immunoprecipitation | p53 protein accumulated | [49] |
| 0.01–12 mM. | 24, 96, or 144 h | Immunoblotting | 30% reduction in SNAP-25-positive axon profiles | [53] |
| 0, 0.1, 0.5, 1, and 2 mM | 24, 48, 72 h | Western blot | MAPs expression and JAK-STAT signaling were involved | [45] |
| 6 mM | 8 h | Western blot analysis and PCR | FAK and Pyk2 time-dependent tyrosine phosphorylation | [78] |
AA: acrylamide, CHOP: C/EBP homologous protein, FAK: focal adhesion kinase, HSPs: Heat shock protein, IC20: concentration causing 20% protein reduction, IC50: 50% inhibition concentration, JAK-STAT: Janus kinase–signal transducer and activator of transcription, PERK: protein kinase, Pyk2: proline-rich tyrosine kinase 2 RNA (PKR)-like/Pancreatic ER Kinase, qPCR: quantitative polymerase chain reaction, SNAP: synaptic vesicle protein S-nitroso-N-acetyl penicillamine.
Table 11.
Protein expression in SH-SY5Y cells. Mycotoxin dose, exposure conditions, assays, and effects.
Table 11.
Protein expression in SH-SY5Y cells. Mycotoxin dose, exposure conditions, assays, and effects.
| Mycotoxin | Dose | Exposure Time | Assays | Effects | References |
|---|---|---|---|---|---|
| FB1 | 1, 10, and 100 µM | 12 h, 24 h, 48 h, 72 h, and 144 h | Caspase-3-like protease activity Western blot | No significant changes in caspase-3-like protease activity; 100 µM for 72 h had no effects on p53 levels; Bax Bcl-2, Bcl-XL, and Mcl-1 were not affected. | [85] |
| OTA | 1, 10, and 100 µM | 30, 60 min, and 24 h | Western blot | Activated caspase-3 was not detected; p53 phosphorylation was not detected | [68] |
| 0.1, 0.25, 0.5, 1.0, and 2.5 µM | 24 h, 48 h | Western blot | Activation of caspase-9 and caspase-3 | [78] | |
| T-2 | 5–20 ng/mL | 1–48 h | Western blot | NRF2 protein expression increased 1.2-fold by 5 ng/mL and 1.4-fold by 10 ng/mL. The mRNA protein expression decreased to 95.6% and 85.6% | [69] |
BAX: Bcl-2 Associated X-protein, BEA: Beauvericin, DON: Deoxynivalenol, ENN’s: enniatin, FB1: Fumonisin B1, NRF2: nuclear factor erythroid 2–related factor 2, OTA: Ochratoxin A, P53: tumor protein p53, ZEA: Zearalenone, Z-VAD-fmk: carbobenzoxy-valyl-alanyl-aspartyl-[O-methyl]- fluoromethylketone, Z-DEVD-fmk: Z-D(OMe)E(Ome)VD(OMe)-FMK. Z-DEVD-fluoromethylketone. Z-DEVD-fluoromethyl ketone. specific inhibitor of caspase-3, α-ZEL: alpha-zearalenol, β-ZEL: beta-zearalenol.
Table 12.
Natural bioactive compounds dose, time of pretreatment, compound, and effect.
| Dose | Time | Compound | Effects | References | |
|---|---|---|---|---|---|
| AA | 6 μM | 2 h pretreatment | Curcumin | Increased cell viability; Alleviated oxidative stress; GRP78, P-PERK, and P-eIF2α expression decreased; Blocked PERK-eIF2α signaling activation; Suppressed tau hyperphosphorylation; Mitigated neuronal apoptosis. | [42] |
| 0, 0.25, 0.5, and 1 mM | 30 min pretreatment | Caffeine | Attenuated AA-inhibited phosphorylation of MAPK; | [44] | |
| 50 µM | 1 h | Z-VAD-fmk | Abolished caspase-3 activities, lowered LDH leakage, and increased cell viability | [50] | |
| 0.123, 0.370, 1.11, 3.33, and 10.0 μg/mL | 20 h | Triphala | Decreased the level of free radicals; Neuroprotective | [73] | |
| BEA, α-ZEL and β-ZEL | 24 h and 48 h | Allium sativum L. garlic | Cell viability increased | [60] | |
| BEA | 24 h and 48 h | Coffee by-products (coffee silverskin and spent coffee) | Cytoprotection | [58] | |
| FB1 | 24 h | NAC | ROS generation at 24 h | [65] | |
| BEA | Lutein, zeaxanthin, and goji berries extract | Cytoprotection | [62] | ||
| FB1 and OTA | 24 h | Beetroot extract | Increased cell viability | [67] |
AA: acrylamide, eIF2α: Eukaryotic Initiation Factor 2 alpha, GRP78: glucose regulated protein 78, LDH: lactate dehydrogenase, MAPKs: mitogen-activated protein kinases, P: Phospho, PERK: protein kinase, Pyk2: proline-rich tyrosine kinase 2 RNA (PKR)-like/Pancreatic ER Kinase, U-1240 MG: Human glioblastoma astrocytoma cells. Z-VAD-fmk: Z-Val-Ala-Asp (OMe)-FMK.
Disclaimer/Publisher’s Note: The statements, opinions and data contained in all publications are solely those of the individual author(s) and contributor(s) and not of MDPI and/or the editor(s). MDPI and/or the editor(s) disclaim responsibility for any injury to people or property resulting from any ideas, methods, instructions or products referred to in the content. |
© 2024 by the authors. Licensee MDPI, Basel, Switzerland. This article is an open access article distributed under the terms and conditions of the Creative Commons Attribution (CC BY) license (https://creativecommons.org/licenses/by/4.0/).
Share and Cite
MDPI and ACS Style
Bridgeman, L.; Juan, C.; Berrada, H.; Juan-García, A. Effect of Acrylamide and Mycotoxins in SH-SY5Y Cells: A Review. Toxins 2024, 16, 87. https://doi.org/10.3390/toxins16020087
AMA Style
Bridgeman L, Juan C, Berrada H, Juan-García A. Effect of Acrylamide and Mycotoxins in SH-SY5Y Cells: A Review. Toxins. 2024; 16(2):87. https://doi.org/10.3390/toxins16020087
Chicago/Turabian StyleBridgeman, Luna, Cristina Juan, Houda Berrada, and Ana Juan-García. 2024. "Effect of Acrylamide and Mycotoxins in SH-SY5Y Cells: A Review" Toxins 16, no. 2: 87. https://doi.org/10.3390/toxins16020087
Note that from the first issue of 2016, this journal uses article numbers instead of page numbers. See further details here.