Salt Reductions in Some Foods in The Netherlands: Monitoring of Food Composition and Salt Intake

Abstract
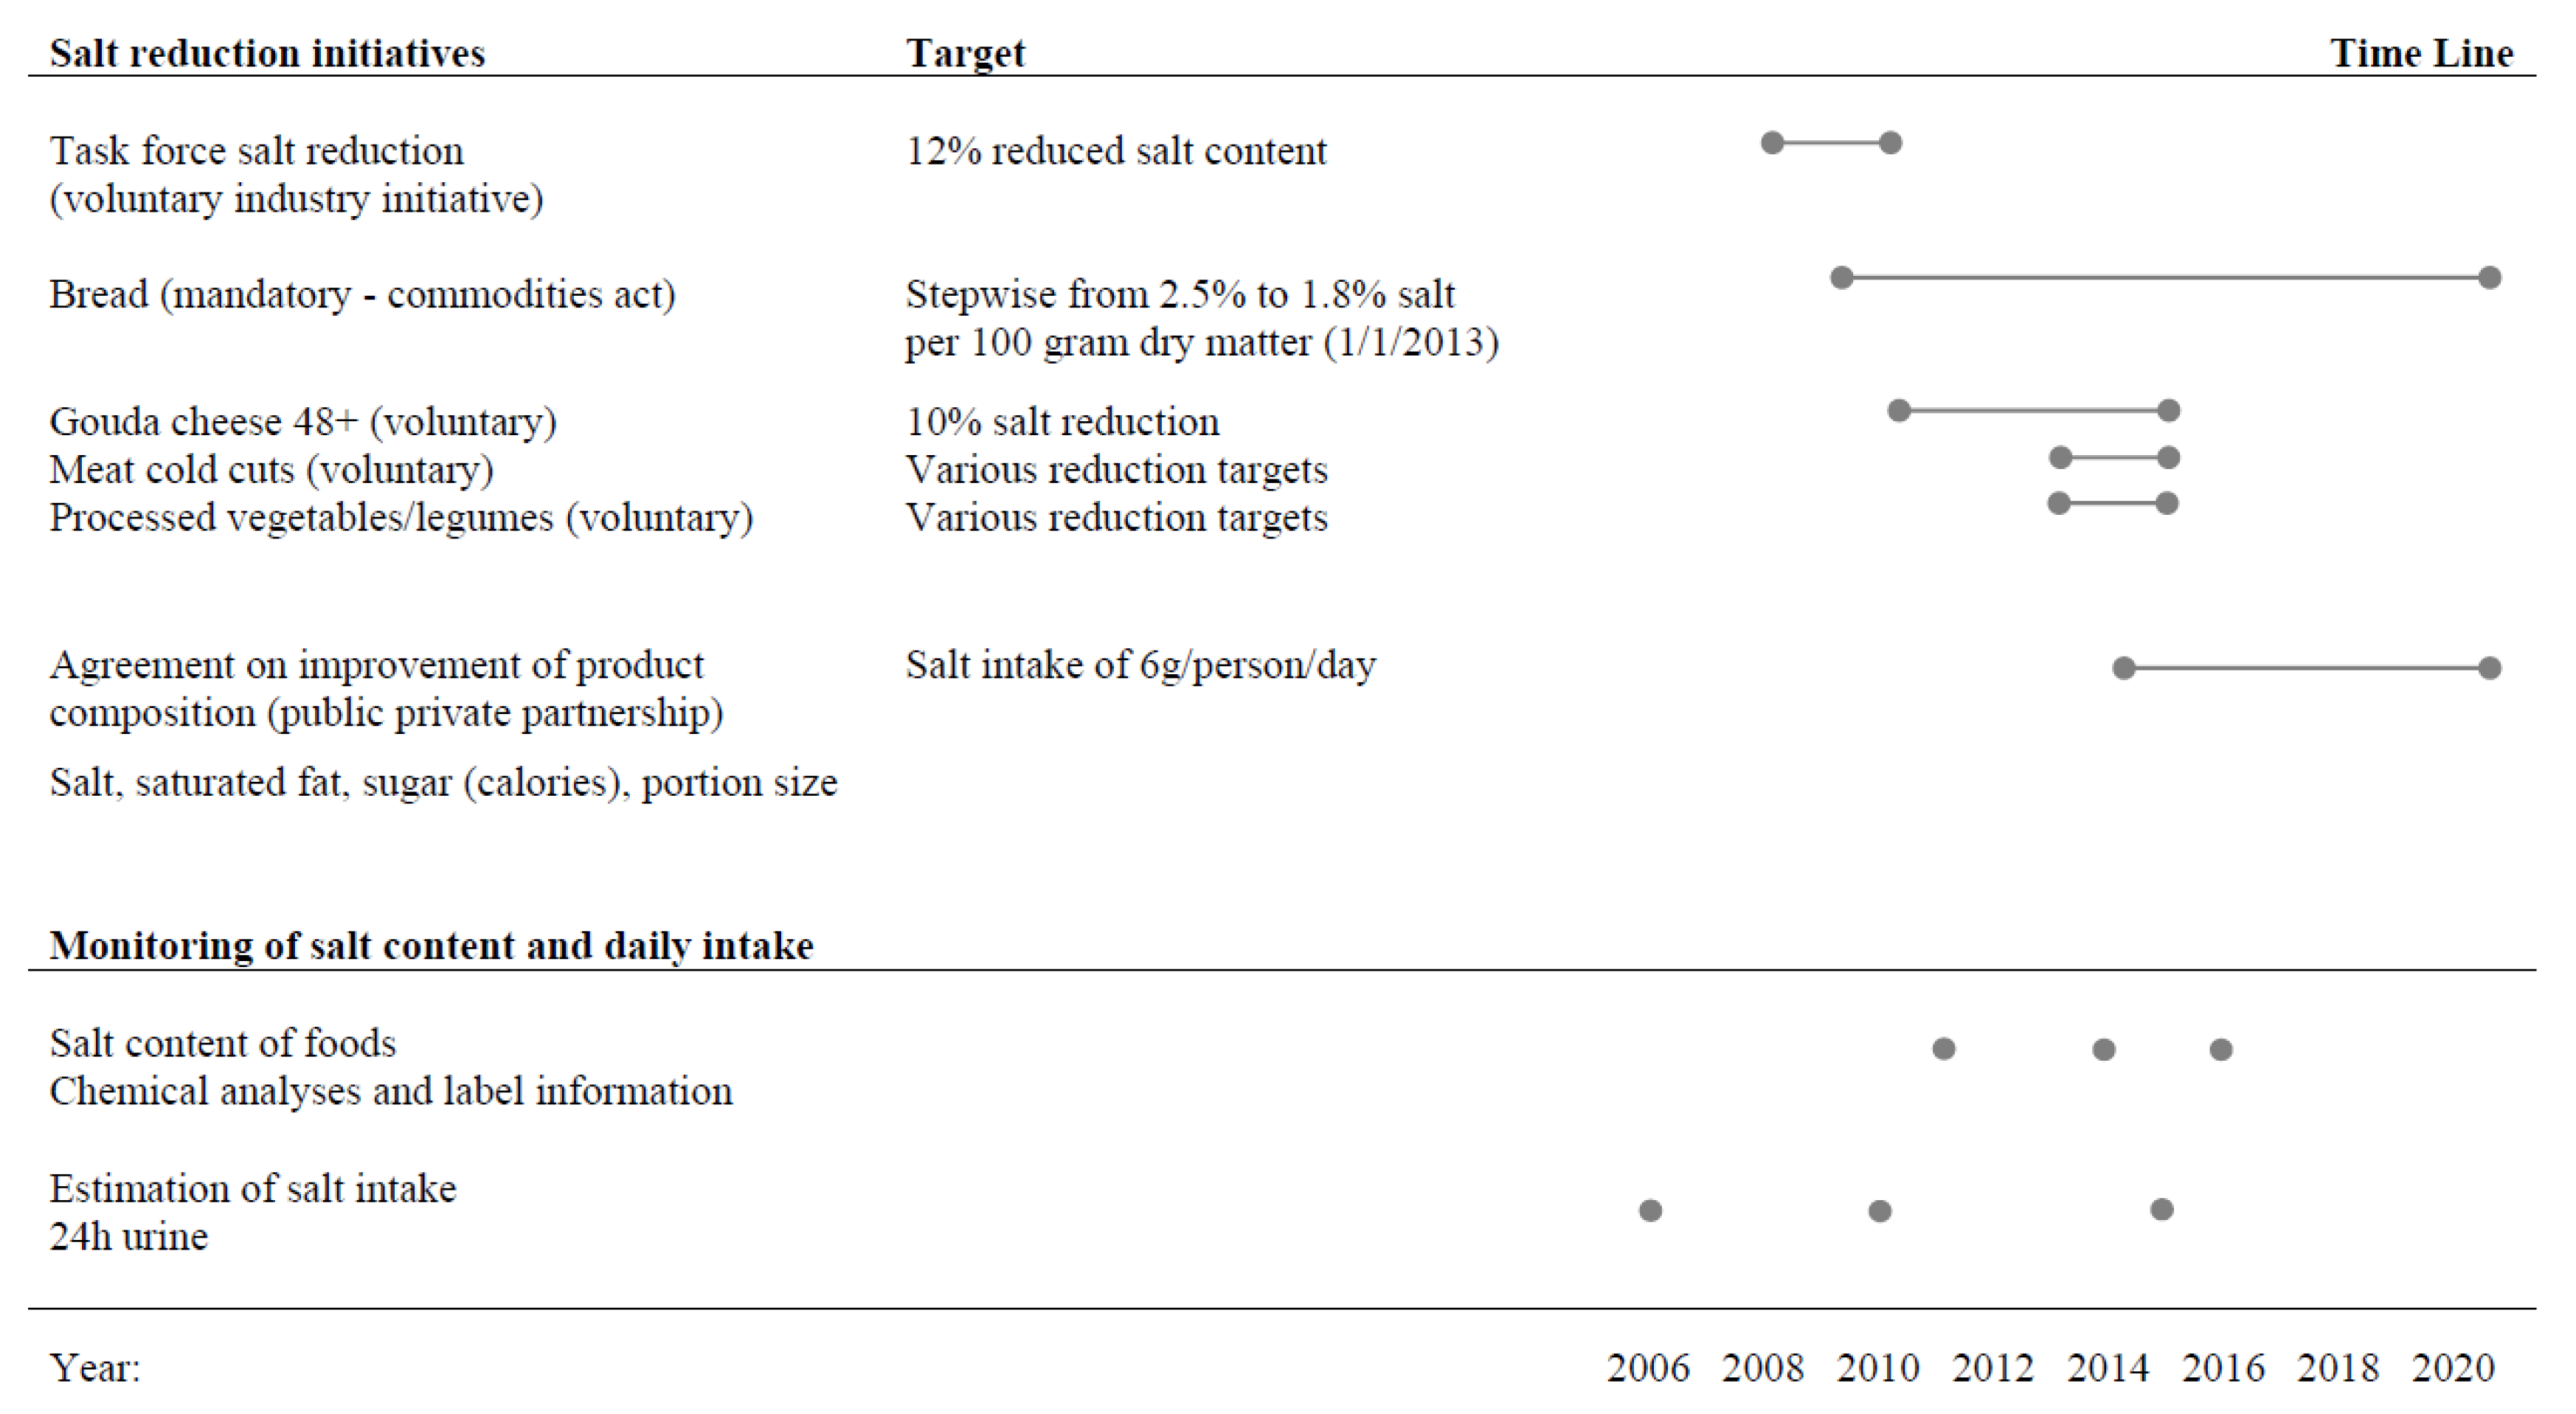
:1. Introduction
2.1. Evaluation of Salt Content of Foods
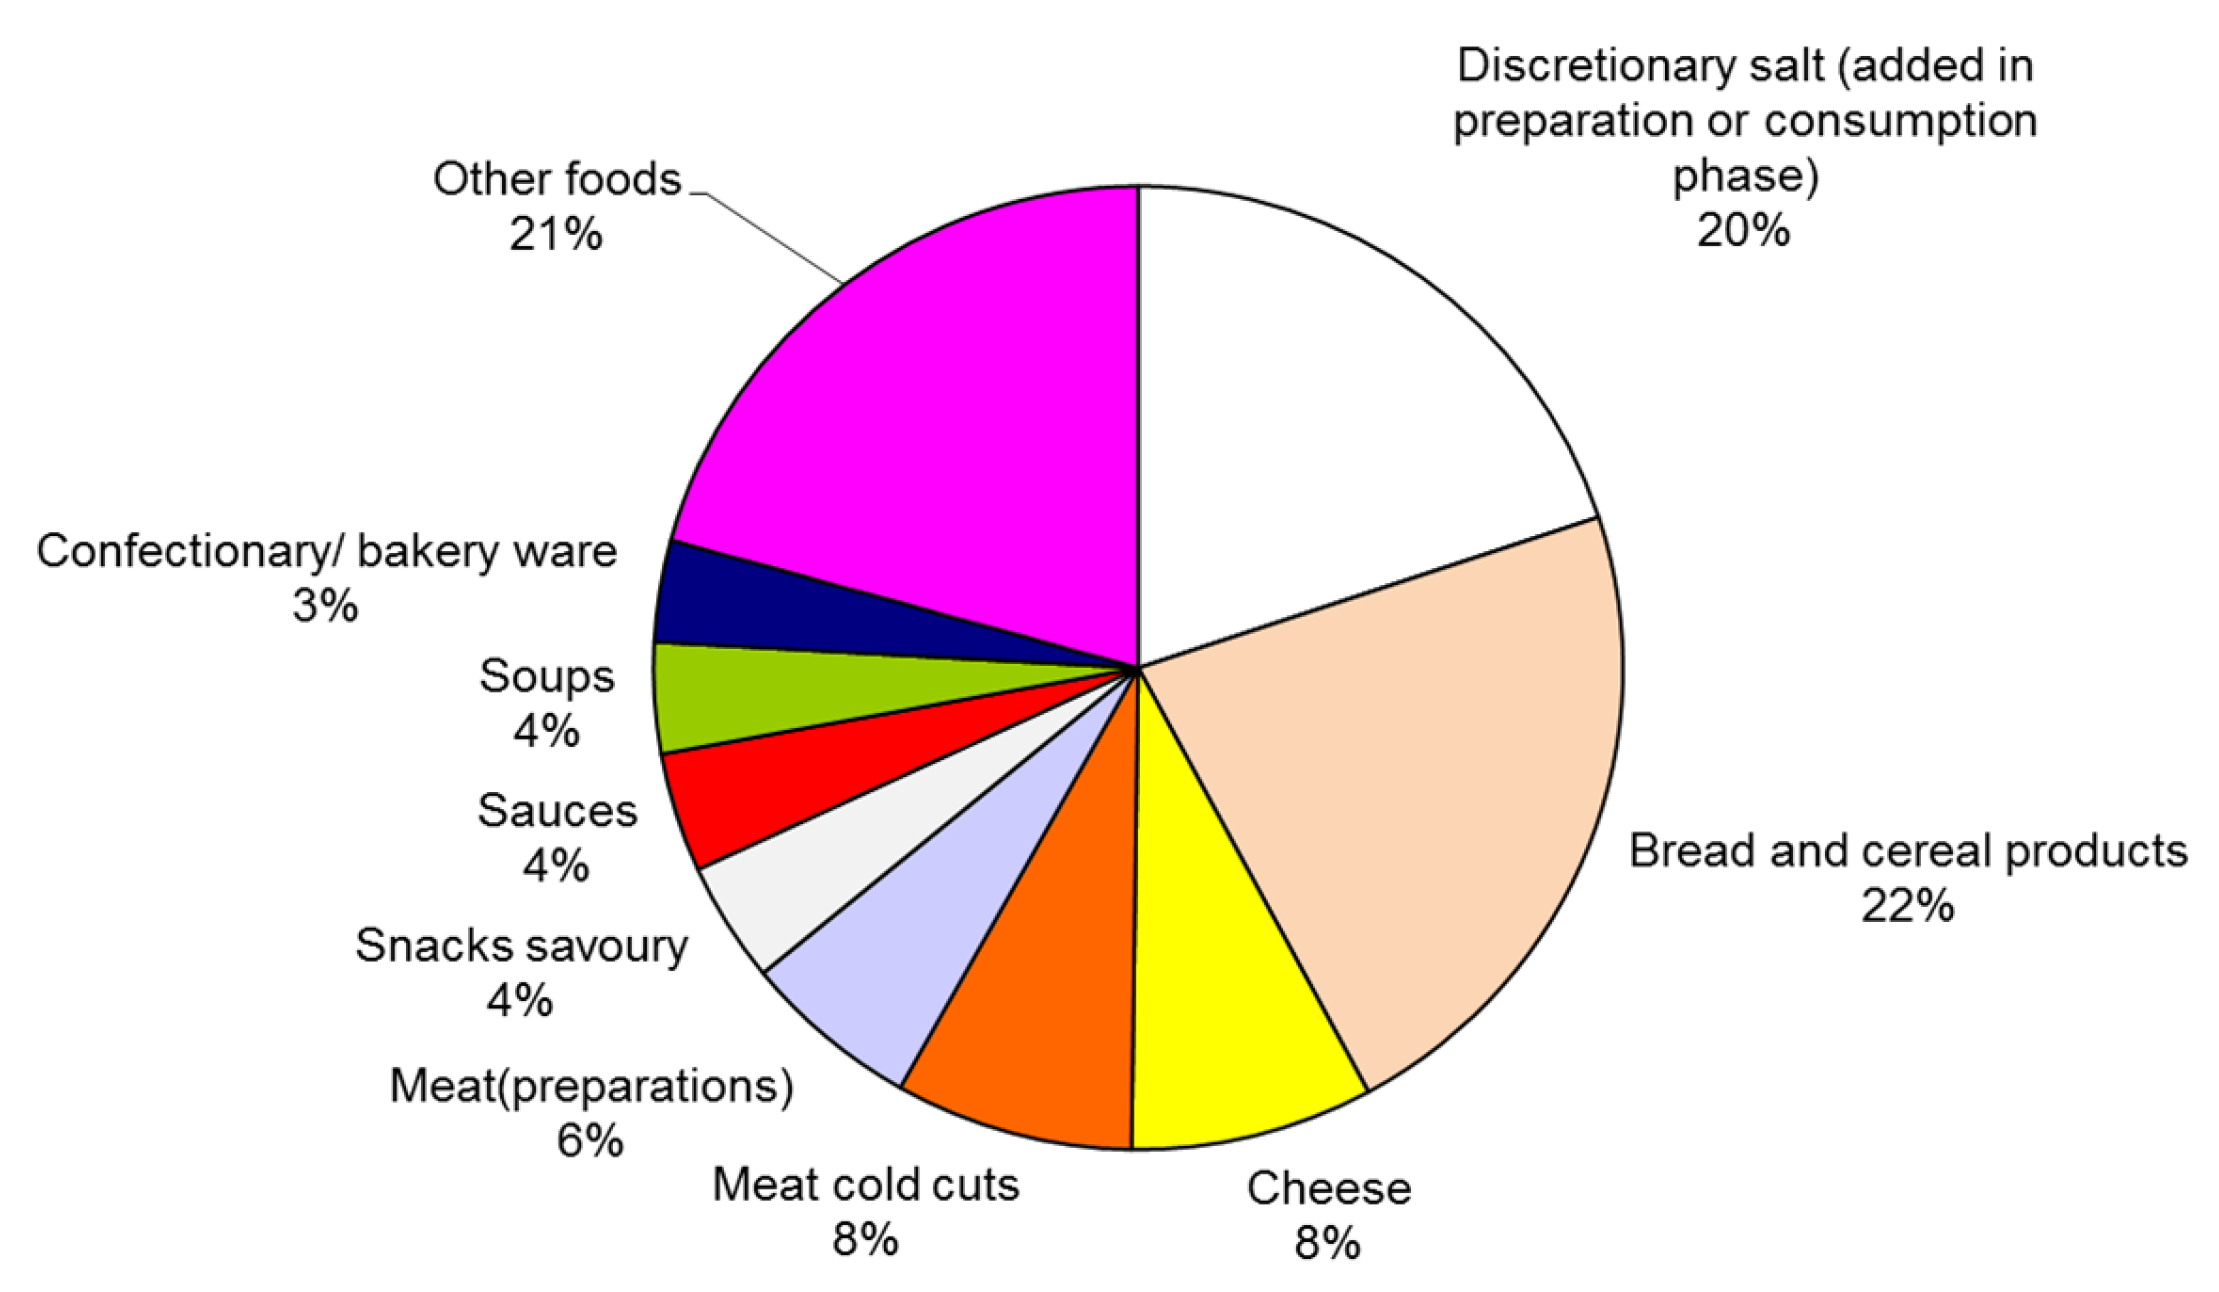
2.1.1. Selecting Major Processed Foods Contributing to Salt Intake
- Foods that can be reformulated for their salt content. For example, the food group “milk products” is excluded from the salt analyses, because the foods in this group do not contain added salt, and thus reformulation for salt is not feasible.
- Food groups with at least 10 comparable foods in the newly collected food composition data.
2.1.2. Salt Content of Selected Processed Foods; New Data Collection and Selection
- -
- The name and/or description of the food was clear enough to allow categorization (based on expert judgement).
- -
- The food was aimed at individual consumers (contrary to foods for catering, clinical use, and bulk-sales).
- -
- Foods were unique (identical foods with different packaging size were included only once).
- -
- Data was available for on the amount of salt and/or sodium in the food.
2.1.3. Statistical Analyses
2.2. Estimation of Salt Intake Via 24 h Urinary Sodium Excretion
2.2.1. Study Population, Recruitment
2.2.2. 24 hr Urine Collection and Assessment of Use of Discretionary Salt
2.2.3. Statistical Analyses
3. Results
3.1. Selecting Major Processed Foods Contributing to Salt Intake
3.2. Salt Content of Selected Processed Foods
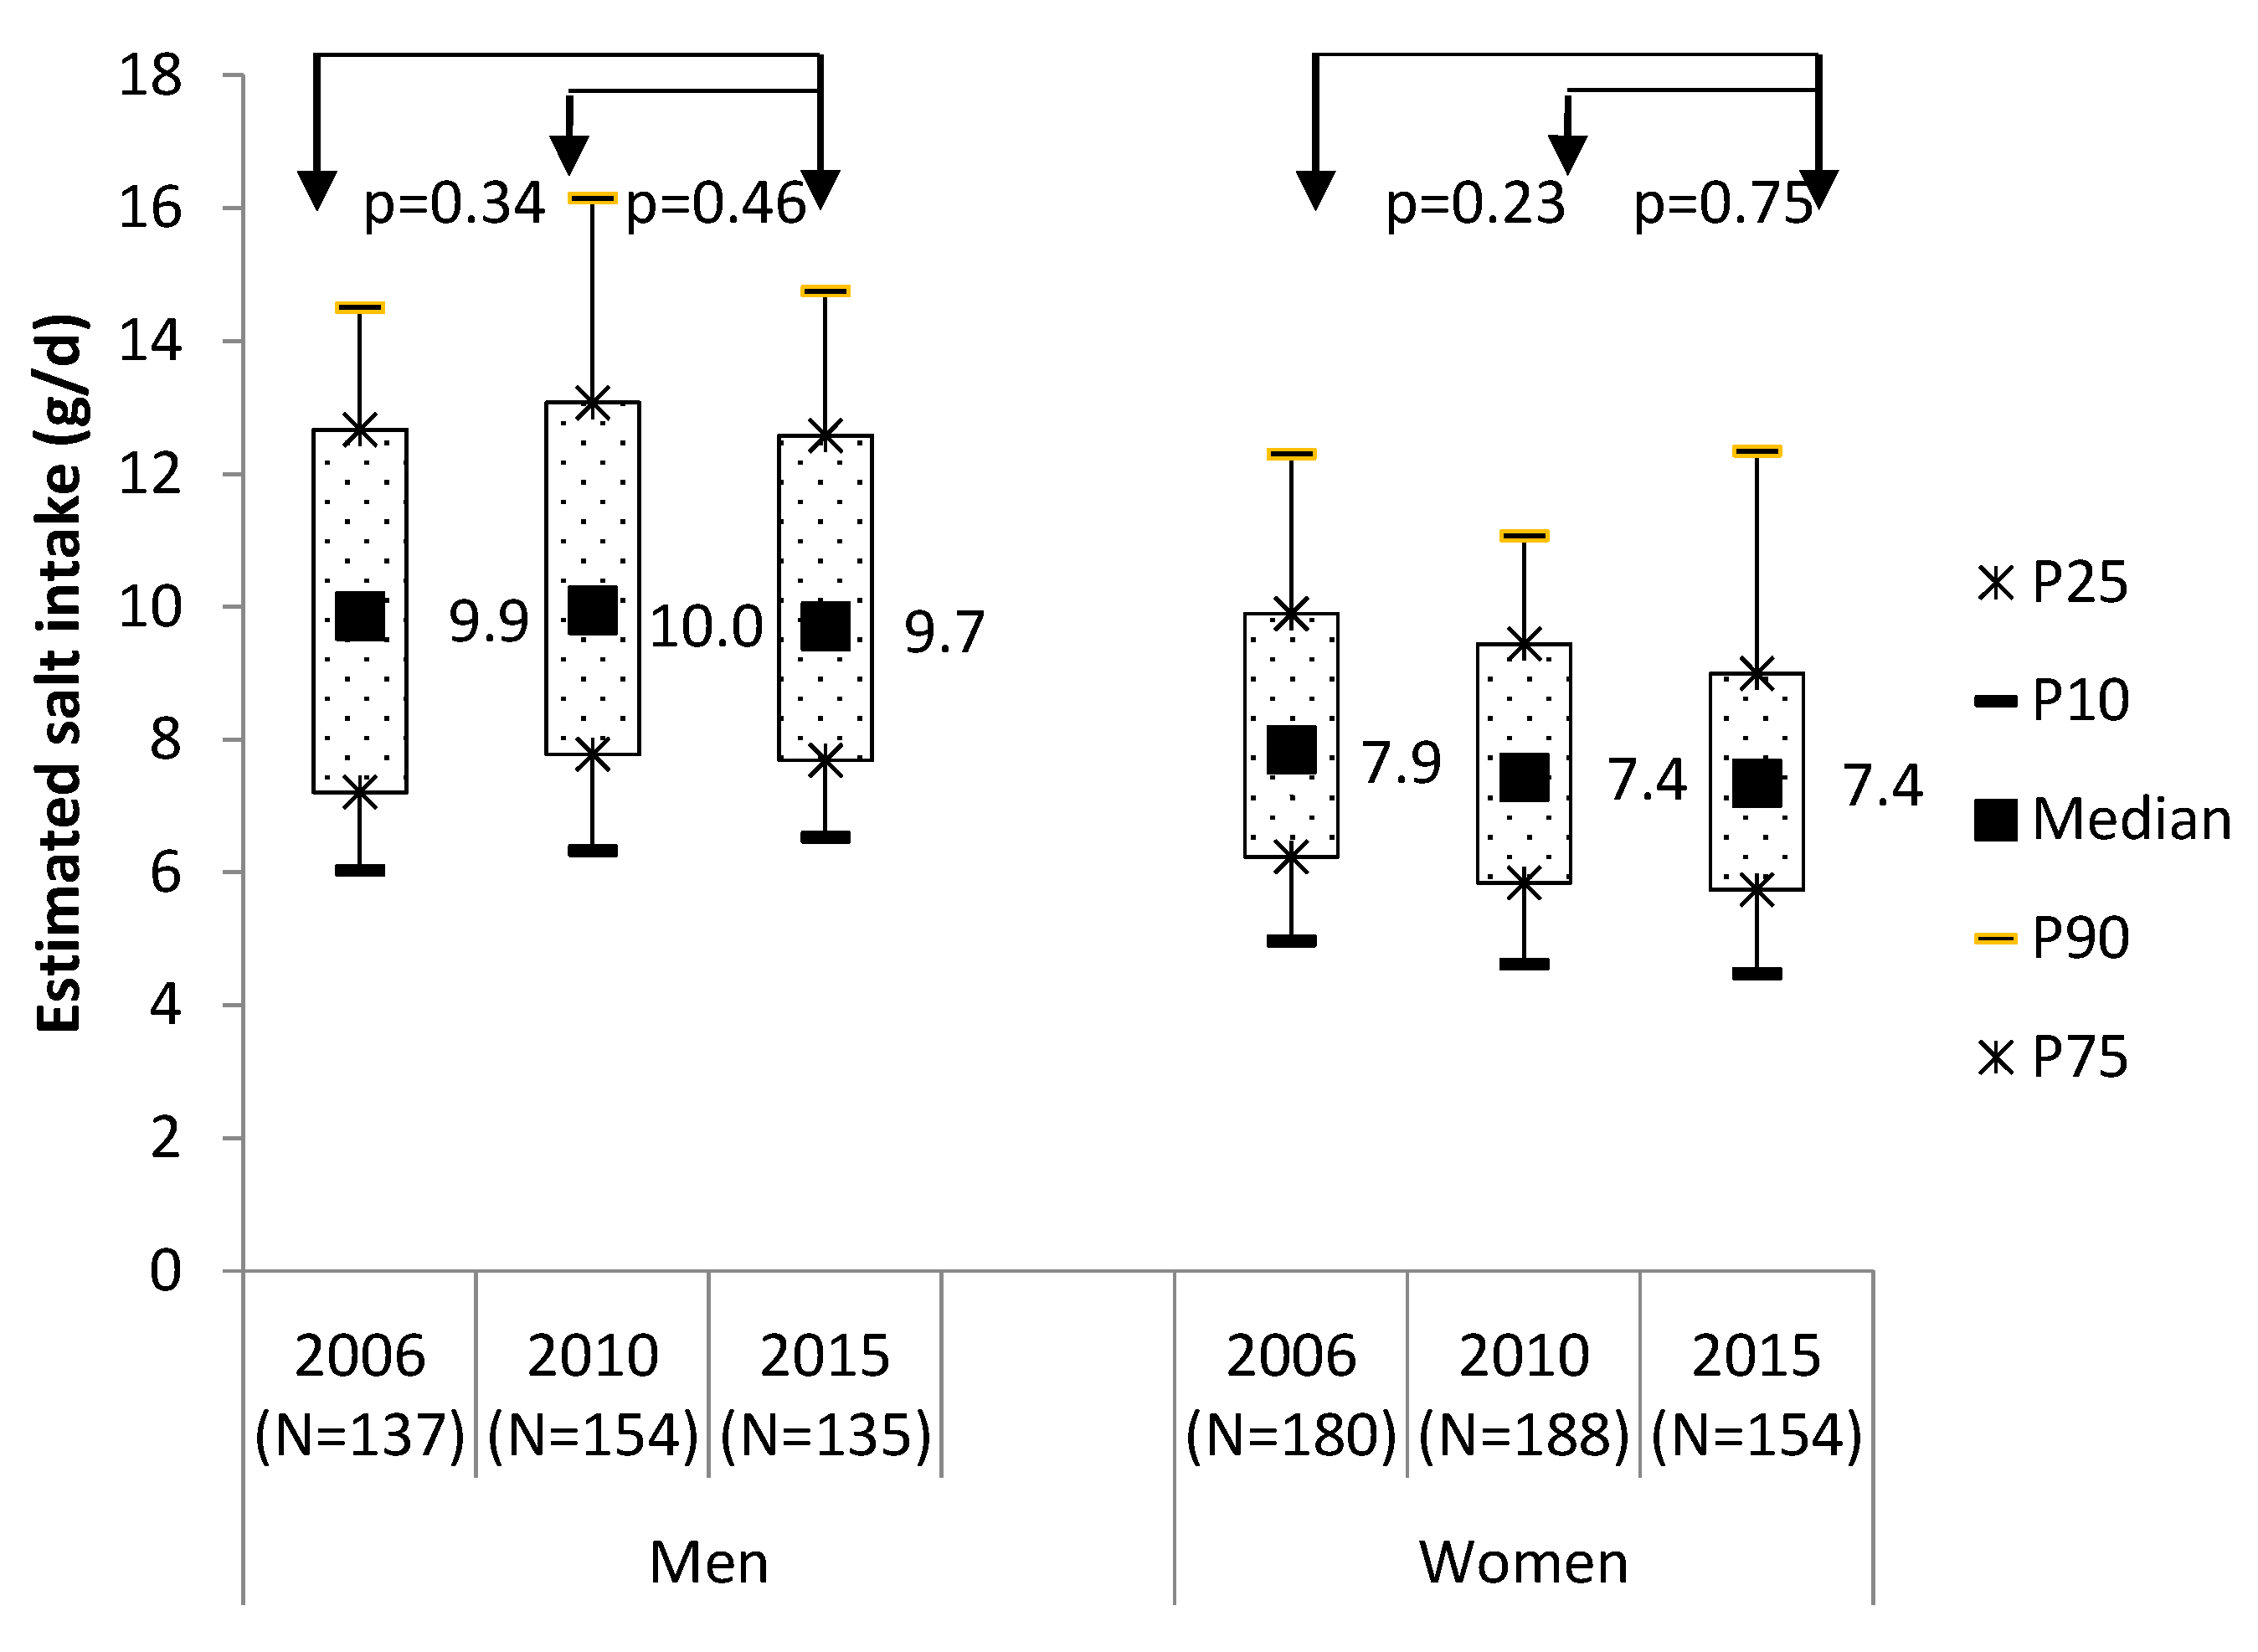
3.3. Estimated Daily Salt Intake from 24 h Urinary Salt Excretion
4. Discussion
Limitations and Strengths
5. Conclusions
Acknowledgments
Author Contributions
Conflicts of Interest
References
- Global Burden of Disease, Risk Factors Collaborators. Global, regional, and national comparative risk assessment of 79 behavioural, environmental and occupational, and metabolic risks or clusters of risks in 188 countries, 1990–2013: A systematic analysis for the Global Burden of Disease Study 2013. Lancet 2015, 386, 2287–2323. [Google Scholar]
- World Health Organization. Global action plan for the prevention and control of noncommunicable diseases 2013–2020; WHO: Geneva, Switzerland, 2013. [Google Scholar]
- Kromhout, D.; Spaaij, C.J.; de Goede, J.; Weggemans, R.M. The 2015 Dutch food-based dietary guidelines. Eur. J. Clin. Nutr. 2016, 70, 869–878. [Google Scholar] [CrossRef] [PubMed]
- Hendriksen, M.A.; van Raaij, J.M.; Geleijnse, J.M.; Wilson-van den Hooven, C.; Ocke, M.C.; van der A, D.L. Monitoring salt and iodine intakes in Dutch adults between 2006 and 2010 using 24 h urinary sodium and iodine excretions. Public Health Nutr. 2014, 17, 1431–1438. [Google Scholar] [CrossRef] [PubMed]
- Van Rossum, C.T.M.; Fransen, H.P.; Verkaik-Kloosterman, J.; Buurma-Rethans, E.J.M.; Ocke, M.C. Dutch National Food Consumption Survey 2007–2010. Diet of Children and Adults Aged 7 to 69 Years. RIVM Rapport 350050006; National Institute for Public Health and the Environment: Bilthoven, The Netherlands, 2011. [Google Scholar]
- Micha, R.; Khatibzadeh, S.; Shi, P.; Fahimi, S.; Lim, S.; Andrews, K.G.; Engell, R.E.; Powles, J.; Ezzati, M.; Mozaffarian, D. Global, regional, and national consumption levels of dietary fats and oils in 1990 and 2010: A systematic analysis including 266 country-specific nutrition surveys. BMJ 2014, 348, g2272. [Google Scholar] [CrossRef] [PubMed] [Green Version]
- Powles, J.; Fahimi, S.; Micha, R.; Khatibzadeh, S.; Shi, P.; Ezzati, M.; Engell, R.E.; Lim, S.S.; Danaei, G.; Mozaffarian, D. Global, regional and national sodium intakes in 1990 and 2010: A systematic analysis of 24 h urinary sodium excretion and dietary surveys worldwide. BMJ Open 2013, 3, e003733. [Google Scholar] [CrossRef] [PubMed] [Green Version]
- Temme, E.H.M.; Westenbrink, S.; Toxopeus, I.B.; Hendriksen, M.A.H.; Werkman, A.M.; Klostermann, V.L.C. Natrium en Verzadigd Vet in Beeld [Sodium and Saturated Fat Content of Foods]. RIVM Briefrapport 350022002; National Institute for Public Health and the Environment: Bilthoven, The Netherlands, 2013. [Google Scholar]
- Auestad, N.; Hurley, J.S.; Fulgoni, V.L., 3rd; Schweitzer, C.M. Contribution of Food Groups to Energy and Nutrient Intakes in Five Developed Countries. Nutrients 2015, 7, 4593–4618. [Google Scholar] [CrossRef] [PubMed]
- World Health Organisation. Global Action Plan for the Prevention and Control of Noncommunicable Diseases 2013–2020; World Health Organisation: Geneva, Switzerland, 2013. [Google Scholar]
- McLaren, L.; Sumar, N.; Barberio, A.M.; Trieu, K.; Lorenzetti, D.L.; Tarasuk, V.; Webster, J.; Campbell, N.R. Population-level interventions in government jurisdictions for dietary sodium reduction. Cochrane Database Syst. Rev. 2016, 9, CD010166. [Google Scholar] [PubMed]
- Hendriksen, M.A.; Verkaik-Kloosterman, J.; Noort, M.W.; van Raaij, J.M. Nutritional impact of sodium reduction strategies on sodium intake from processed foods. Eur. J. Clin. Nutr. 2015, 69, 805–810. [Google Scholar] [CrossRef] [PubMed]
- McLaren, L.; McIntyre, L.; Kirkpatrick, S. Rose’s population strategy of prevention need not increase social inequalities in health. Int. J. Epidemiol. 2010, 39, 372–377. [Google Scholar] [CrossRef] [PubMed]
- Actieplan Zout in Levensmiddelen. Action Plan. In Salt in Foods; FNLI: Rijkwijk, The Netherlands, 2008. [Google Scholar]
- Besluit van 15 november 2012, houdende wijziging van het Warenwetbesluit Meel en brood inzake het maximale zoutgehalte van brood. Staatsblad van het Koninkrijk der Nederlanden, nr 598, Den Haag, 2012. Commodities Act with Regulation on the Maximum Level of Salt in Bread. Available online: https://zoek.officielebekendmakingen.nl/stb-2012-598.html (accessed on 20 July 2017).
- Vijfde Landelijke Steekproef Zoutgehalte in Brood, maart–mei 2013 (Fifth annual sampling of salt content of bread, March-May 2013). NBC (Netherlands Bakery Centre): Wageningen, The Netherlands.
- Zesde Landelijke Steekproef Zoutgehalte in Brood, februari–april 2015 (Sixth annual sampling of salt content of bread, February-April 2015). NBC (Netherlands Bakery Centre): Wageningen, The Netherlands.
- Akkoord Verbetering Productsamenstelling Zout, Verzadigd Vet, Suiker (Calorieën) (National agreement o Improve Product Composition: Salt, Saturated Fat, Sugar (Calories)). Supervisory committee of agreement: Den Haag, The Netherlands, 2014. Available online: http://www.akkoordverbeteringproductsamenstelling.nl/en (accessed on 20 July 2017).
- Temme, E.H.M.; Milder, I.E.J.; Westenbrink, S.; Toxopeus, I.B.; Van den Bogaard, C.H.M.; Van Raaij, J.M.A. Monitoring Productsamenstelling Voor Zout, Verzadigd Vet en Suiker. RIVM Herformuleringsmonitor 2014. RIVM Briefrapport 2015–0034 (Monitoring Product Composition for Salt, Saturated Fatty Acid and Sugar. RIVM Reformulation Monitor 2014, RIVM Letter Report 2015–0034). National Institute for Public Health and the Environment: Bilthoven, The Netherlands, 2015. [Google Scholar]
- NEVO-online (Nederlands Voedingsstoffenbestand), NEVO-online versie 2011. (Dutch Food Composition Database NEVO-online version 2011). National institute for Public Health and the Environment: Bilthoven, The Netherlands, 2011.
- Website Akkoord Verbetering Productsamenstelling (Website National Agreement to Improve Product Composition). Available online: http://www.akkoordverbeteringproductsamenstelling.nl (accessed on 20 July 2017 ).
- Voedingscentrum. Richtlijnen Voedselkeuze; Voedingscentrum: Den Haag, Dutch, 2011. [Google Scholar]
- Innova Innova’s Food & Beverage Database. Available online: http://www.innovadatabase.com/home/index.rails (accessed on 1 May 2014).
- Voedingscentrum Levensmiddelendatabank (LEDA) (Food Database LEDA). Dutch Nutrition Centre: Den Haag, The Netherlands. Available online: http://www.voedingscentrum.nl/professionals/productaanbod-en-levensmiddelendatabank.aspx (accessed on 13 July 2017).
- Monitoring Van Het Gehalte Aan Keukenzout in Diverse Levensmiddelen 2015 (Monitoring the Content of Salt in Several Foods 2015). Dutch Food Safety Autority (NVWA): Utrecht, The Netherlands, 2016.
- NVWA. Monitoring Van Het Keukenzoutgehalte in Diverse Levensmiddelen 2016 (Monitoring the Content of Salt in Several Foods 2016); Dutch Food Safety Autority (NVWA): Utrecht, The Netherlands, 2017; Available online: https://www.nvwa.nl/documenten/communicatie/inspectieresultaten/eten-drinken/2017m/rapport-monitoring-van-het-gehalte-aan-keukenzout-in-diverse-levensmiddelen-2016 (accessed on 6 April 2017).
- Monitoring Van Het Keukenzout- en Verzadigd Vetgehalte in Levensmiddelen Waarvoor Afspraken Zijn Gemaakt in Het Akkoord Verbetering Productsamenstelling 2016 (Monitoring the Content of Salt and Saturated Fatty Acids in Several Foods with Reduction Targets 2016). Dutch Food Safety Autority (NVWA): Utrecht, The Netherlands, 2017.
- Chemistry Information Sheet CREm Creatinine. Beckman Coulter Synchron LX System(s). Available online: www.beckmancoulter.com (accessed on 20 July 2017).
- Chemistry Information Sheet NA Sodium. Beckman Coulter Synchron LX System(s). Available online: www.beckmancoulter.com (accessed on 20 July 2017).
- Trieu, K.; Neal, B.; Hawkes, C.; Dunford, E.; Campbell, N.; Rodriguez-Fernandez, R.; Legetic, B.; McLaren, L.; Barberio, A.; Webster, J. Salt Reduction Initiatives around the World—A Systematic Review of Progress towards the Global Target. PLoS ONE 2015, 10, e0130247. [Google Scholar] [CrossRef] [PubMed]
- Bryden, A.; Petticrew, M.; Mays, N.; Eastmure, E.; Knai, C. Voluntary agreements between government and business—A scoping review of the literature with specific reference to the Public Health Responsibility Deal. Health Policy 2013, 110, 186–197. [Google Scholar] [CrossRef] [PubMed]
- Willems, A.A.; van Hout, D.H.; Zijlstra, N.; Zandstra, E.H. Effects of salt labelling and repeated in-home consumption on long-term liking of reduced-salt soups. Public Health Nutr. 2014, 17, 1130–1137. [Google Scholar] [CrossRef] [PubMed]
- Bolhuis, D.P.; Temme, E.H.; Koeman, F.T.; Noort, M.W.; Kremer, S.; Janssen, A.M. A salt reduction of 50% in bread does not decrease bread consumption or increase sodium intake by the choice of sandwich fillings. J. Nutr. 2011, 141, 2249–2255. [Google Scholar] [CrossRef] [PubMed]
- Janssen, A.M.; Kremer, S.; van Stipriaan, W.L.; Noort, M.W.; de Vries, J.H.; Temme, E.H. Reduced-sodium lunches are well-accepted by uninformed consumers over a 3-week period and result in decreased daily dietary sodium intakes: A randomized controlled trial. J. Acad. Nutr. Diet. 2015, 115, 1614–1625. [Google Scholar] [CrossRef] [PubMed]
- Buttriss, J.L. Food reformulation: The challenges to the food industry. Proc. Nutr. Soc. 2013, 72, 61–69. [Google Scholar] [CrossRef] [PubMed]
- Laatikainen, T.; Pietinen, P.; Valsta, L.; Sundvall, J.; Reinivuo, H.; Tuomilehto, J. Sodium in the Finnish diet: 20-Year trends in urinary sodium excretion among the adult population. Eur. J. Clin. Nutr. 2006, 60, 965–970. [Google Scholar] [CrossRef] [PubMed]
- Shankar, B.; Brambila-Macias, J.; Traill, B.; Mazzocchi, M.; Capacci, S. An evaluation of the UK Food Standards Agency’s salt campaign. Health Econ. 2013, 22, 243–250. [Google Scholar] [CrossRef] [PubMed]
- Trieu, K.; McLean, R.; Johnson, C.; Santos, J.A.; Raj, T.S.; Campbell, N.R.C.; Webster, J. The Science of Salt: A Regularly Updated Systematic Review of the Implementation of Salt Reduction Interventions (November 2015 to February 2016). J. Clin. Hypertens. 2016, 18, 1194–1204. [Google Scholar] [CrossRef] [PubMed]
- He, F.J.; Brinsden, H.C.; MacGregor, G.A. Salt reduction in the United Kingdom: A successful experiment in public health. J. Hum. Hypertens. 2014, 28, 345–352. [Google Scholar] [CrossRef] [PubMed]
- Pietinen, P.; Valsta, L.M.; Hirvonen, T.; Sinkko, H. Labelling the salt content in foods: A useful tool in reducing sodium intake in Finland. Public Health Nutr. 2008, 11, 335–340. [Google Scholar] [CrossRef] [PubMed]
- WHO. Mapping Salt Reduction Initiatives in the WHO European Region; World Health Organization, Regional Office for Europe: Copenhagen, Denmark, 2013. [Google Scholar]
- Van Rossum, C.; Buurma-Rethans, E.; Vennemann, F.; Beukers, M.; Brants, H.; de Boer, E.; Ocké, M. The Diet of the Dutch : Results of the First Two Years of the Dutch National Food Consumption Survey 2012–2016; RIVM: Bilthoven, The Netherlands, 2016. [Google Scholar]
- Gillespie, C.; Maalouf, J.; Yuan, K.; Cogswell, M.E.; Gunn, J.P.; Levings, J.; Moshfegh, A.; Ahuja, J.K.; Merritt, R. Sodium content in major brands of US packaged foods, 2009. Am. J. Clin. Nutr. 2015, 101, 344–353. [Google Scholar] [CrossRef] [PubMed]
- Poti, J.M.; Dunford, E.K.; Popkin, B.M. Sodium reduction in US households’ packaged food and beverage purchases, 2000 to 2014. JAMA Intern. Med. 2017, 177, 986–994. [Google Scholar] [CrossRef] [PubMed]
- Menard, C.; Dumas, C.; Goglia, R.; Spiteri, M.; Gillot, N.; Combris, P.; Ireland, J.; Soler, L.G.; Volatier, J.L. OQALI: A French database on processed foods. J. Food Compos. Anal. 2011, 24, 744–749. [Google Scholar] [CrossRef]

| Reference 2011-Salt Content | New Data 2016-Salt Content | Difference | ||||||||
|---|---|---|---|---|---|---|---|---|---|---|
| Food Group | N | Uval | AVG | SD | n | AVG | SD | (%) | ||
| Bread and cereal products | ||||||||||
| Bread ◊ | 25 | 82 | 1.29 | 0.24 | 194 | 1.04 | 0.13 | −9% | ¥ | |
| Bread luxury natural and sweet b | 11 | 37 | 0.97 | 0.17 | 41 | 0.90 | 0.17 | −7% | ||
| Bread replacements b | 21 | 2 | 1.23 | 0.59 | 61 | 1.23 | 0.60 | 0% | ||
| Breakfast cereal b | 24 | 2 | 0.60 | 0.54 | 76 | 0.51 | 0.48 | −15% | ||
| Cheese | ||||||||||
| Cheese, semi hard and hard ◊ | 18 | 26 | 2.04 | 0.41 | 175 | 1.87 | 0.40 | −9% | ||
| Cheese, melted and spreadable b | 12 | 2 | 1.52 | 0.52 | 73 | 1.33 | 0.49 | −13% | ||
| Meat cold cuts | ||||||||||
| Single prepared ◊ | 13 | 8 | 2.54 | 0.58 | 153 | 2.36 | 0.55 | −7% | ||
| Composed prepared ◊ | 23 | 7 | 2.20 | 0.25 | 250 | 2.10 | 0.33 | −5% | ||
| Single raw smoked/dried b | 5 | 9 | 3.92 | 0.87 | 44 | 3.96 | 1.36 | 1% | ||
| Composed raw smoked/dried ◊ | 9 | 7 | 3.15 | 0.58 | 105 | 3.04 | 0.90 | −4% | ||
| Meat(preparations) | ||||||||||
| Meat preparations unprepared | 14 | 10 | 1.56 | 0.62 | 111 | 1.83 | 0.56 | 18% | ||
| Snacks savoury | ||||||||||
| Ragout snack (“kroket” type) | 1 | 6 | 1.40 | 53 | 1.32 | 0.34 | −6% | |||
| Snacks savoury with meat | 2 | 5 | 1.78 | 0.17 | 28 | 1.88 | 0.35 | 5% | ||
| Cut potato crisps | 8 | 7 | 1.75 | 0.49 | 37 | 1.29 | 0.28 | −26% | ¥ | |
| Pelleted crisps | 9 | 5 | 2.18 | 0.85 | 91 | 2.06 | 0.79 | −6% | ||
| Salted biscuits | 6 | 6 | 2.15 | 1.20 | 31 | 2.22 | 0.58 | 3% | ||
| Sauces | ||||||||||
| Tomato/vegetable meal sauces *,◊ | 38 | 7 | 1.13 | 0.27 | 87 | 0.96 | 0.41 | −15% | ¥ | |
| Tomato/vegetable based cold sauces ◊ | 8 | 3 | 2.19 | 0.60 | 115 | 1.94 | 0.84 | −11% | ||
| Emulsion based sauces | 15 | 4 | 1.53 | 0.37 | 121 | 1.40 | 0.56 | −8% | ||
| Sauces, peanut * | 10 | 4 | 1.70 | 0.35 | 16 | 1.50 | 0.50 | −12% | ||
| Meal sauces with a binder *,b | 40 | 10 | 1.35 | 0.48 | 36 | 1.09 | 0.30 | −19% | ¥ | |
| Soups ◊ | ||||||||||
| Soups sold as liquid * | 48 | 7 | 0.89 | 0.23 | 109 | 0.78 | 0.12 | −12% | ¥ | |
| Soups instant prepared * | 28 | 7 | 0.90 | 0.24 | 52 | 0.87 | 0.17 | −3% | ||
| Confectionary and bakery ware | ||||||||||
| Cakes b | 4 | 4 | 0.79 | 0.44 | 51 | 0.75 | 0.35 | −4% | ||
| Biscuits b | 28 | 3 | 0.57 | 0.28 | 24 | 0.77 | 0.18 | 36% | ¥ | |
| Shortbreads | 7 | 11 | 0.80 | 0.28 | 68 | 0.60 | 0.29 | −25% | ||
| Pies and pastries (sweet) b | 9 | 8 | 0.44 | 0.17 | 70 | 0.35 | 0.21 | −20% | ||
| Food Group | Food with Maximum Salt Targets | Maximum | Start and End Date | <Max Salt Level | |
|---|---|---|---|---|---|
| g/100 g | % of Foods | ||||
| Bread and cereal products | 2010–01/01/2013 | ||||
| Bread | White, brown, wholemeal, multigrain bread; both large and small and baguette | 1, 8% ‡ | n.a. | ||
| Cheese | 2010–/12/2015 | ||||
| Cheese | Gouda cheese 48+ | −10% ∏ | |||
| Meat cold cuts | 06/2013–06/2015 | 90% | |||
| Single prepared | Bacon, grilled | 2.80 | |||
| Others | 2.54 | ||||
| Composed prepared | 2.36 | ||||
| Composed raw smoked/dried | Filet American | 2.25 | |||
| Others | 3.20 | ||||
| Sauces | 01/01/2015–30/06/2016 | ||||
| Tomato/vegetable meal sauces | Sauce for pasta | 1.30 | 96% | ||
| Tomato/vegetable based cold sauces | Ketchup | 2.49 | 87% | ||
| Curry ketchup | 2.06 | 93% | |||
| Soups | 01/01/2015–30/06/2016 | ||||
| Soups sold as liquid and instant prepared | Soups | 0.89 | 79% | ||
| Processed vegetables and legumes | 2011–2013 | n.a. | |||
| Processed vegetables | Peas and/or carrots, bean | 0.38 | |||
| Butter beans, haricots, mushrooms | 0.46 | ||||
| Processed legumes | Legumes | 0.51 | |||
| Food Group | Food with Maximum Salt Targets | Reference 2011-Salt Content | New Data 2016-Salt | Difference | ||||||
|---|---|---|---|---|---|---|---|---|---|---|
| N | Uval | AVG | SD | n | AVG | SD | (%) | |||
| Bread and cereal products | ||||||||||
| Bread | White, brown, wholemeal, multigrain bread; both large and small and baguette | 19 | 99 | 1.27 | 0.27 | 161 | 1.02 | 0.11 | −21% | ¥ |
| Cheese | ||||||||||
| Cheese | Gouda cheese 48+ | 7 | 58 | 2.09 | 0.35 | 80 | 1.89 | 0.35 | −11% | |
| Meats cold cuts | ||||||||||
| Single prepared | Bacon, grilled | 2 | 3 | 2.76 | 1.41 | 26 | 2.46 | 0.83 | −12% | |
| Others | 11 | 9 | 2.45 | 0.42 | 127 | 2.34 | 0.47 | −6% | ||
| Composed prepared | 23 | 5 | 2.17 | 0.25 | 250 | 2.10 | 0.33 | −5% | ||
| Composed raw smoked/dried | Filet American | 1 | 13 | 2.26 | 0.00 | 25 | 1.82 | 0.32 | −21% | |
| Others | 8 | 7 | 3.21 | 0.51 | 80 | 3.42 | 0.64 | 5% | ||
| Sauces | ||||||||||
| Tomato/vegetable meal sauces | Sauce for pasta | 38 | 7 | 1.12 | 0.26 | 87 | 0.96 | 0.41 | −15% | ¥ |
| Tomato/vegetable based cold sauces | Ketchup | 2 | 5 | 2.63 | 0.53 | 18 a | 1.58 | 0.36 | −41% | ¥ |
| Curry ketchup | 1 | 2 | 1.69 | 0.00 | 19 | 1.69 | 0.41 | −1% | ||
| Soups | ||||||||||
| Soups sold as liquid and instant prepared | 76 | 0.89 | 0.23 | 204 | 0.82 | 0.17 | −9% | ¥ | ||
| Processed vegetables and legumes | ||||||||||
| Processed vegetables | Peas and/or carrots, bean | 4 | 0.47 | 0.12 | 44 | 0.35 | 0.10 | −25% | ¥ | |
| Butter beans, haricots, mushrooms | 2 | 0.64 | 0.02 | 17 | 0.41 | 0.16 | −37% | |||
| Processed legumes | Legumes | 2 | 1 | 0.88 | 0.32 | 21 | 0.52 | 0.13 | −42% | ¥ |
© 2017 by the authors. Licensee MDPI, Basel, Switzerland. This article is an open access article distributed under the terms and conditions of the Creative Commons Attribution (CC BY) license (http://creativecommons.org/licenses/by/4.0/).
Share and Cite
Temme, E.H.M.; Hendriksen, M.A.H.; Milder, I.E.J.; Toxopeus, I.B.; Westenbrink, S.; Brants, H.A.M.; Van der A, D.L. Salt Reductions in Some Foods in The Netherlands: Monitoring of Food Composition and Salt Intake. Nutrients 2017, 9, 791. https://doi.org/10.3390/nu9070791
Temme EHM, Hendriksen MAH, Milder IEJ, Toxopeus IB, Westenbrink S, Brants HAM, Van der A DL. Salt Reductions in Some Foods in The Netherlands: Monitoring of Food Composition and Salt Intake. Nutrients. 2017; 9(7):791. https://doi.org/10.3390/nu9070791
Chicago/Turabian StyleTemme, Elisabeth H. M., Marieke A. H. Hendriksen, Ivon E. J. Milder, Ido B. Toxopeus, Susanne Westenbrink, Henny A. M. Brants, and Daphne L. Van der A. 2017. "Salt Reductions in Some Foods in The Netherlands: Monitoring of Food Composition and Salt Intake" Nutrients 9, no. 7: 791. https://doi.org/10.3390/nu9070791