1. Introduction
Colorectal cancer is a major cause of cancer morbidity and mortality worldwide, and food intake plays a central role in the course of its development [
1,
2]. Dietary risk factors for colorectal cancer are complex. On the one hand, high consumption of meat and processed meat, but not white meat or fish, is positively correlated with the development of colorectal cancer [
2,
3,
4,
5,
6]. The risk of colorectal cancer is increased by 18% per 50 g intake of processed meat, and by 17% per 100 g intake of red meat, on a daily basis [
3]. In particular, heme iron in red meat and its nitrosylated form in processed meat are of concern, given their catalytic effect on the formation of
N-nitroso-compounds and lipid peroxidation products [
3,
7,
8]. Mutagenic compounds generated during the cooking of meat at high temperatures (heterocyclic aromatic amines and polycyclic aromatic hydrocarbons) might also interfere in this formation process [
3,
9]. On the other hand, other components of diet such as calcium, fruits, vegetables, and dietary fiber are considered protective against developing colorectal cancer [
2,
10,
11,
12,
13].
Results from animal and in vitro studies indicate that omega-3 fatty acids, especially the long-chain polyunsaturated fatty acids eicosapentaenoic and docosahexaenoic acids, which are mainly present in fatty fish, inhibit carcinogenesis [
5]. Dietary antioxidants might counteract the effect of heme iron and it was recently shown that the association between heme-iron and colorectal adenoma risk depends also on the non-enzymatic dietary antioxidant capacity [
11]. This illustrates the need for assessing dietary patterns and interactions between foods when evaluating dietary risk factors in relation to chronic diseases.
Several dietary assessment methods, i.e., the 24-h dietary recall, the dietary record, and the food frequency questionnaire (FFQ), are available for epidemiological purposes. FFQs are often used in epidemiological studies to estimate long-term dietary exposure, mainly due to their applicability in large samples and their ability to categorize subjects based on their intake [
14,
15,
16]. Measurement errors in FFQs can be estimated through relative validity studies, in which dietary intake assessed using FFQ is compared with a more precise method, such as weighted dietary records [
14].
An FFQ records the intake of a limited list of carefully selected food items, and, as such, has been developed for a specific purpose and a specific dietary risk factor. In addition, as food intake and dietary habits vary by population groups, FFQs are often developed and used for specific populations. Therefore, it is important to consider the specific diet of older adults when assessing dietary risk factors of colorectal cancer accurately since more than 80% of cases of colorectal cancer are diagnosed in people aged 50 or over [
1].
To date, the validity of a comprehensive FFQ to assess dietary risk factors for colorectal cancer has not been evaluated in older adults. The existing studies, albeit with some conflicting results, have been able to highlight important associations between diet and colorectal cancer using an FFQ. However, these instruments either did not provide validity estimates [
17,
18,
19] or were validated for use in general cancer studies in which all specific dietary risk factors for colorectal cancer were not considered [
20,
21,
22,
23]. Therefore, the purpose of the present research was to evaluate the reproducibility and validity of an FFQ, which includes all dietary factors related to colorectal cancer in a population >50 years old in the Flemish region of Belgium.
2. Materials and Methods
The validation consisted of comparing the FFQ with the 3-day diary record for assessing the intake of foods and nutrients, while the reproducibility test consisted of comparing the food and nutrient intake calculated using the same FFQ administered within two weeks (FFQ1 and FFQ2). The 3-day diary record was distributed after the second FFQ (FFQ2) had been completed in order to avoid bias introduced by increased awareness when completing a 3-day diary.
2.1. Study Participants
A total number of 300 participants were contacted via oral (in person, and via telephone) and e-mail communication and invited to participate in this study conducted in the Flemish region of Belgium. Purposive sampling (specifically the snowball method) was used to select those participants through family, friends, acquaintances, colleagues, and associations. Out of this number, 176 participants replied, agreed to participate, and were enrolled in the study. Age ≥50 years and not being vegetarian were the main inclusion criteria. Data were collected from 1 March till 1 April 2015. First the FFQ was collected in a two-week interval (FFQ1 then FFQ2) followed by the diary method.
Ethical clearance was obtained from the Ethics Committee of Ghent University (number EC/2013/1124). Informed consent was obtained from the participants, and the anonymity of the participants was ensured at all times.
2.2. Development of the FFQ
A self-administered semi-quantitative food frequency questionnaire was developed for the purpose of the study (
Supplementary material: Table S1). The FFQ included specific questions to measure the intake of food sources associated with the development of colorectal cancer. Protective and propagating foods and dietary components were identified from existing meta-analyses and systematic reviews [
2,
4,
5,
24,
25,
26]. Specifically, heme-iron, nitrite/nitrate, and fat intake from red and processed meat were included because these are established or putative risk factors for the development of colorectal cancer. As vitamin D, calcium, fiber, and omega-3 fatty acids are considered to be protective compounds, vegetables, dairy, fruits, fish, and whole grain products were also included. All possible foods and food groups containing these nutrients were identified from the Belgian food consumption survey conducted in 2004 [
27]. For each food and nutrient associated with colorectal cancer, a regression model was fitted. The model contained the total nutrient intake as a dependent variable and the corresponding nutritional composition of the foods consumed and their consumption frequency as independent variables. Using stepwise regression analysis, food items that contributed significantly to the variability of intake of each nutrient were considered for the FFQ. A total of 109 food items were listed for inclusion in the FFQ.
The foods in this list were organized into 22 food groups (
Supplementary material: Table S2) on the basis of similar nutritional properties and considering the scientific facts related to the development of colorectal cancer. For fish and meat, when appropriate, the preparation method (i.e., baked in the pan, baked in the oven, grilled, and deep-fried) and the degree of doneness (i.e., rare, medium rare, medium, medium-well, and well done) was specified, as cooking method and degree of doneness are considered important in relation to the intake of polycyclic aromatic hydrocarbons and heterocyclic amines.
The FFQ asked participants to recall the consumption frequency for the past year. Participants estimated the intake of each food with seven possible options: never or <once per month, once a month, 2–3 times per month, once a week, 2–3 times per week, 4–6 times per week, and daily consumption. The FFQ also assessed the average quantity consumed per day. Examples and photographs of different portion sizes were provided with the FFQ to assist participants when estimating the average quantity of food consumed per day.
2.3. 3-Day Diary
A 3-day dietary record was used as a reference method for relative validity analysis. Unlike the FFQ, the diary method is a prospective method and allows the respondent to record any food intake (quantitatively and qualitatively). For the 3-day dietary record in this study, the participants were asked to select two days during the week and one during the weekend. The days were not consecutive to increase the possibility of variety in meal consumption. For composite dishes, the participants were asked to mention the different ingredients and their quantities so that the nutrient composition could be calculated.
A detailed explanation with examples and pictures was provided to guide participants in recording their food item and portion size accurately. Despite clear instructions, however, the majority of the respondents (>50%) did not report the doneness and cooking methods of fish and meat intake. As a result, we were unable to consider the food groups related to fish and meat preparation, and meat doneness for the assessment of validity. The final number of food groups was reduced to 18 for this reason.
2.4. Data Management and Analysis
Data from the FFQs were extracted using TeleForm designer software 10.2 (Digital Vision, Hewlett Packard, Palo Alto, CA, USA). Errors or missing values were detected by the program and reviewed case by case. For the 3-day diary, Lucille software version 0.1 [
28] was used for data entry and processing. The raw data were corrected for errors that occurred during completion and data-entering of the FFQ. In the case of absence of a response in one of the two FFQ’s, the day with recorded items was used for the validity study.
2.5. Calculation of Daily Food and Nutrient Intake
The average frequency of food intake per week and month of the FFQ was converted to a daily intake value (e.g., frequency of 2–3 times per month = 2.5/30.5 times per day). Values were considered missing if both the frequency and the amounts were not completed. If either the amount or the frequency only was reported, we first considered the trend in a similar food group that would estimate the amount of intake or the frequency. If this was not possible, we took the median value from distribution of that particular variable, i.e., food or nutrient intake. However, this happened for only a few variables. Once the average daily intake of each food type was calculated, the nutrient intake per day was computed using the following formula: nutrient intake per day = ∑ (daily intake of food (consumption frequency) × amount of nutrient in the food × amount of consumed food).
For the 3-day diary, to account for non-uniform intake of some nutrients throughout the week, e.g., alcohol, a weighting factor was assigned to compensate for the difference in dietary intake between weekdays and weekend days. To calculate the average intake per day, the weighting factor was multiplied by the amount consumed per foodstuff, i.e., average daily intake = ((weekend intake × 2) + (average weekday intake × 5))/7.
The nutritional composition of foods consumed (calcium, vitamin D, fiber, omega-3 fatty acids (protective association), and fat, alcohol, heme-iron and nitrate/nitrites (propagative association)) was obtained from the Belgian [
29] or the Dutch [
30] food composition table. In the absence of specific data in the latter databases, a heme-iron database was created from the values reported by Cross et al. [
31]. Nitrate/nitrite was obtained from specific analysis of food from the Belgian Scientific Institute of Public Health. An overview of the data on nitrate and nitrite in various foods (including different types of vegetables, fruits, potatoes, meat, and dairy products) as used in present study has been described previously [
32].
2.6. Data Analysis
Estimates of dietary intake from the FFQs and 3-day diary, as well as the differences estimated by the two methods, were verified for normality. As both distributions deviated significantly from a normal distribution, in addition to the mean value, median and inter-quartile range (IQR) were used to describe the estimates.
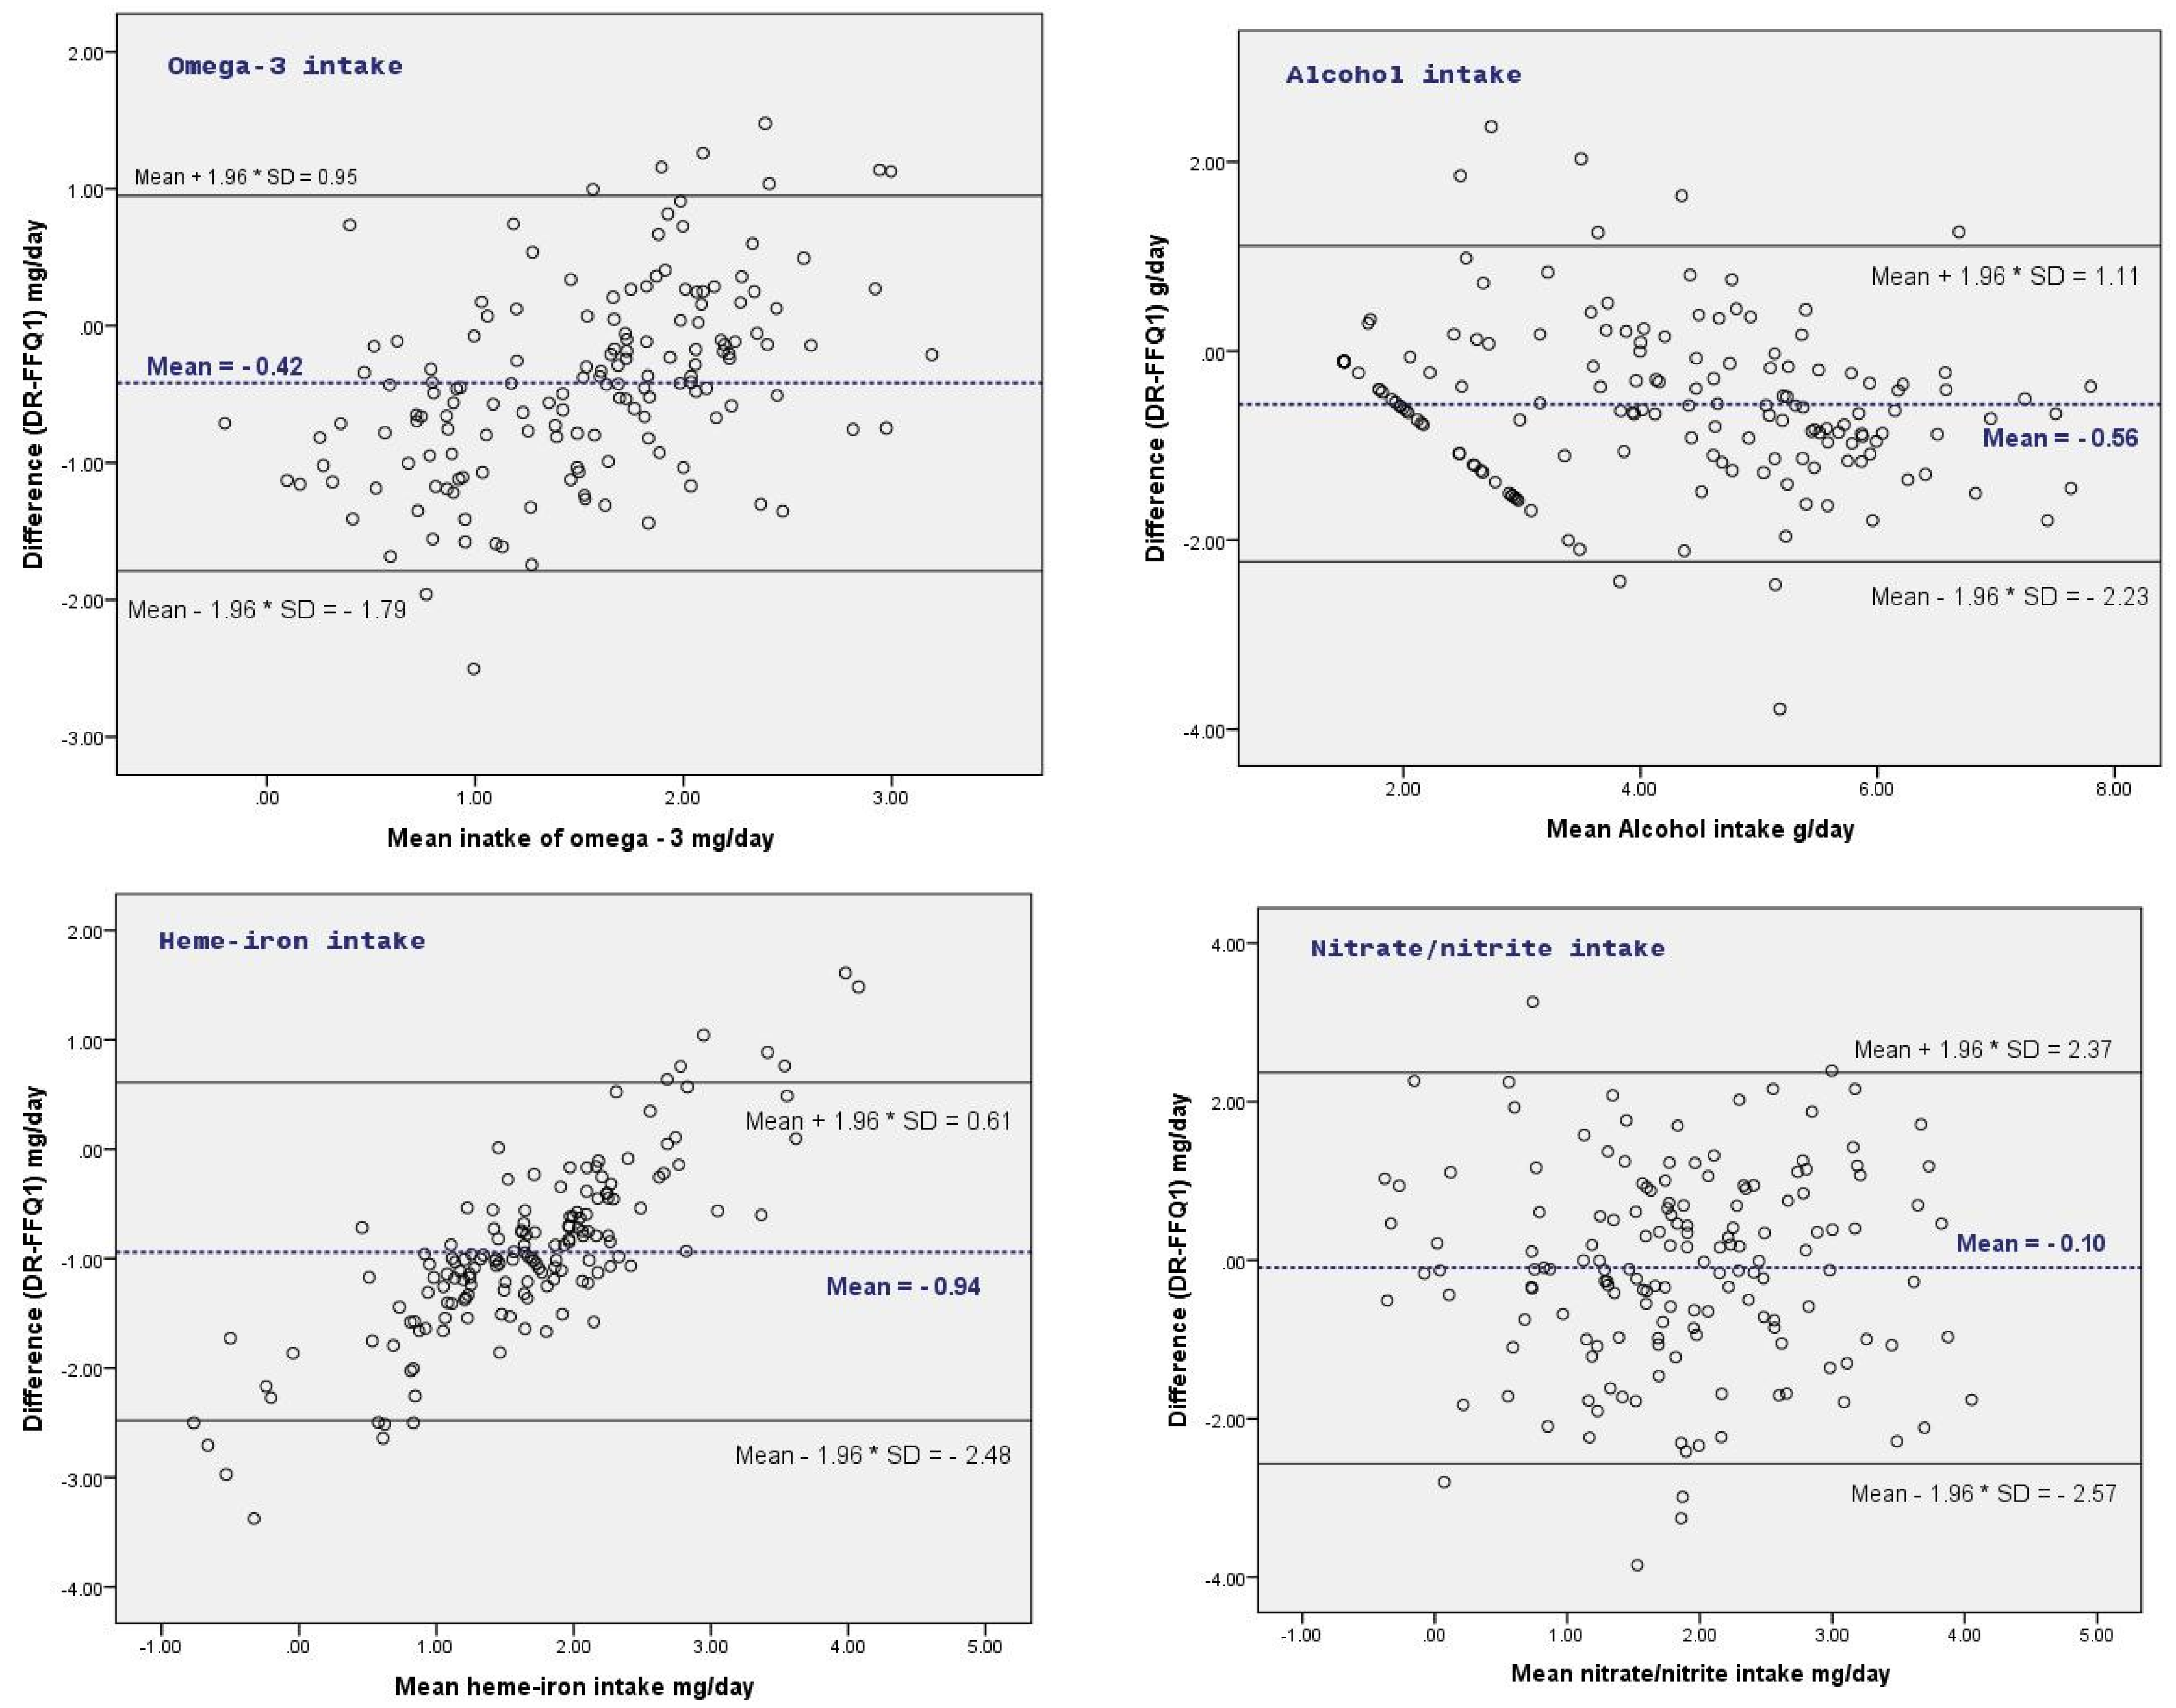
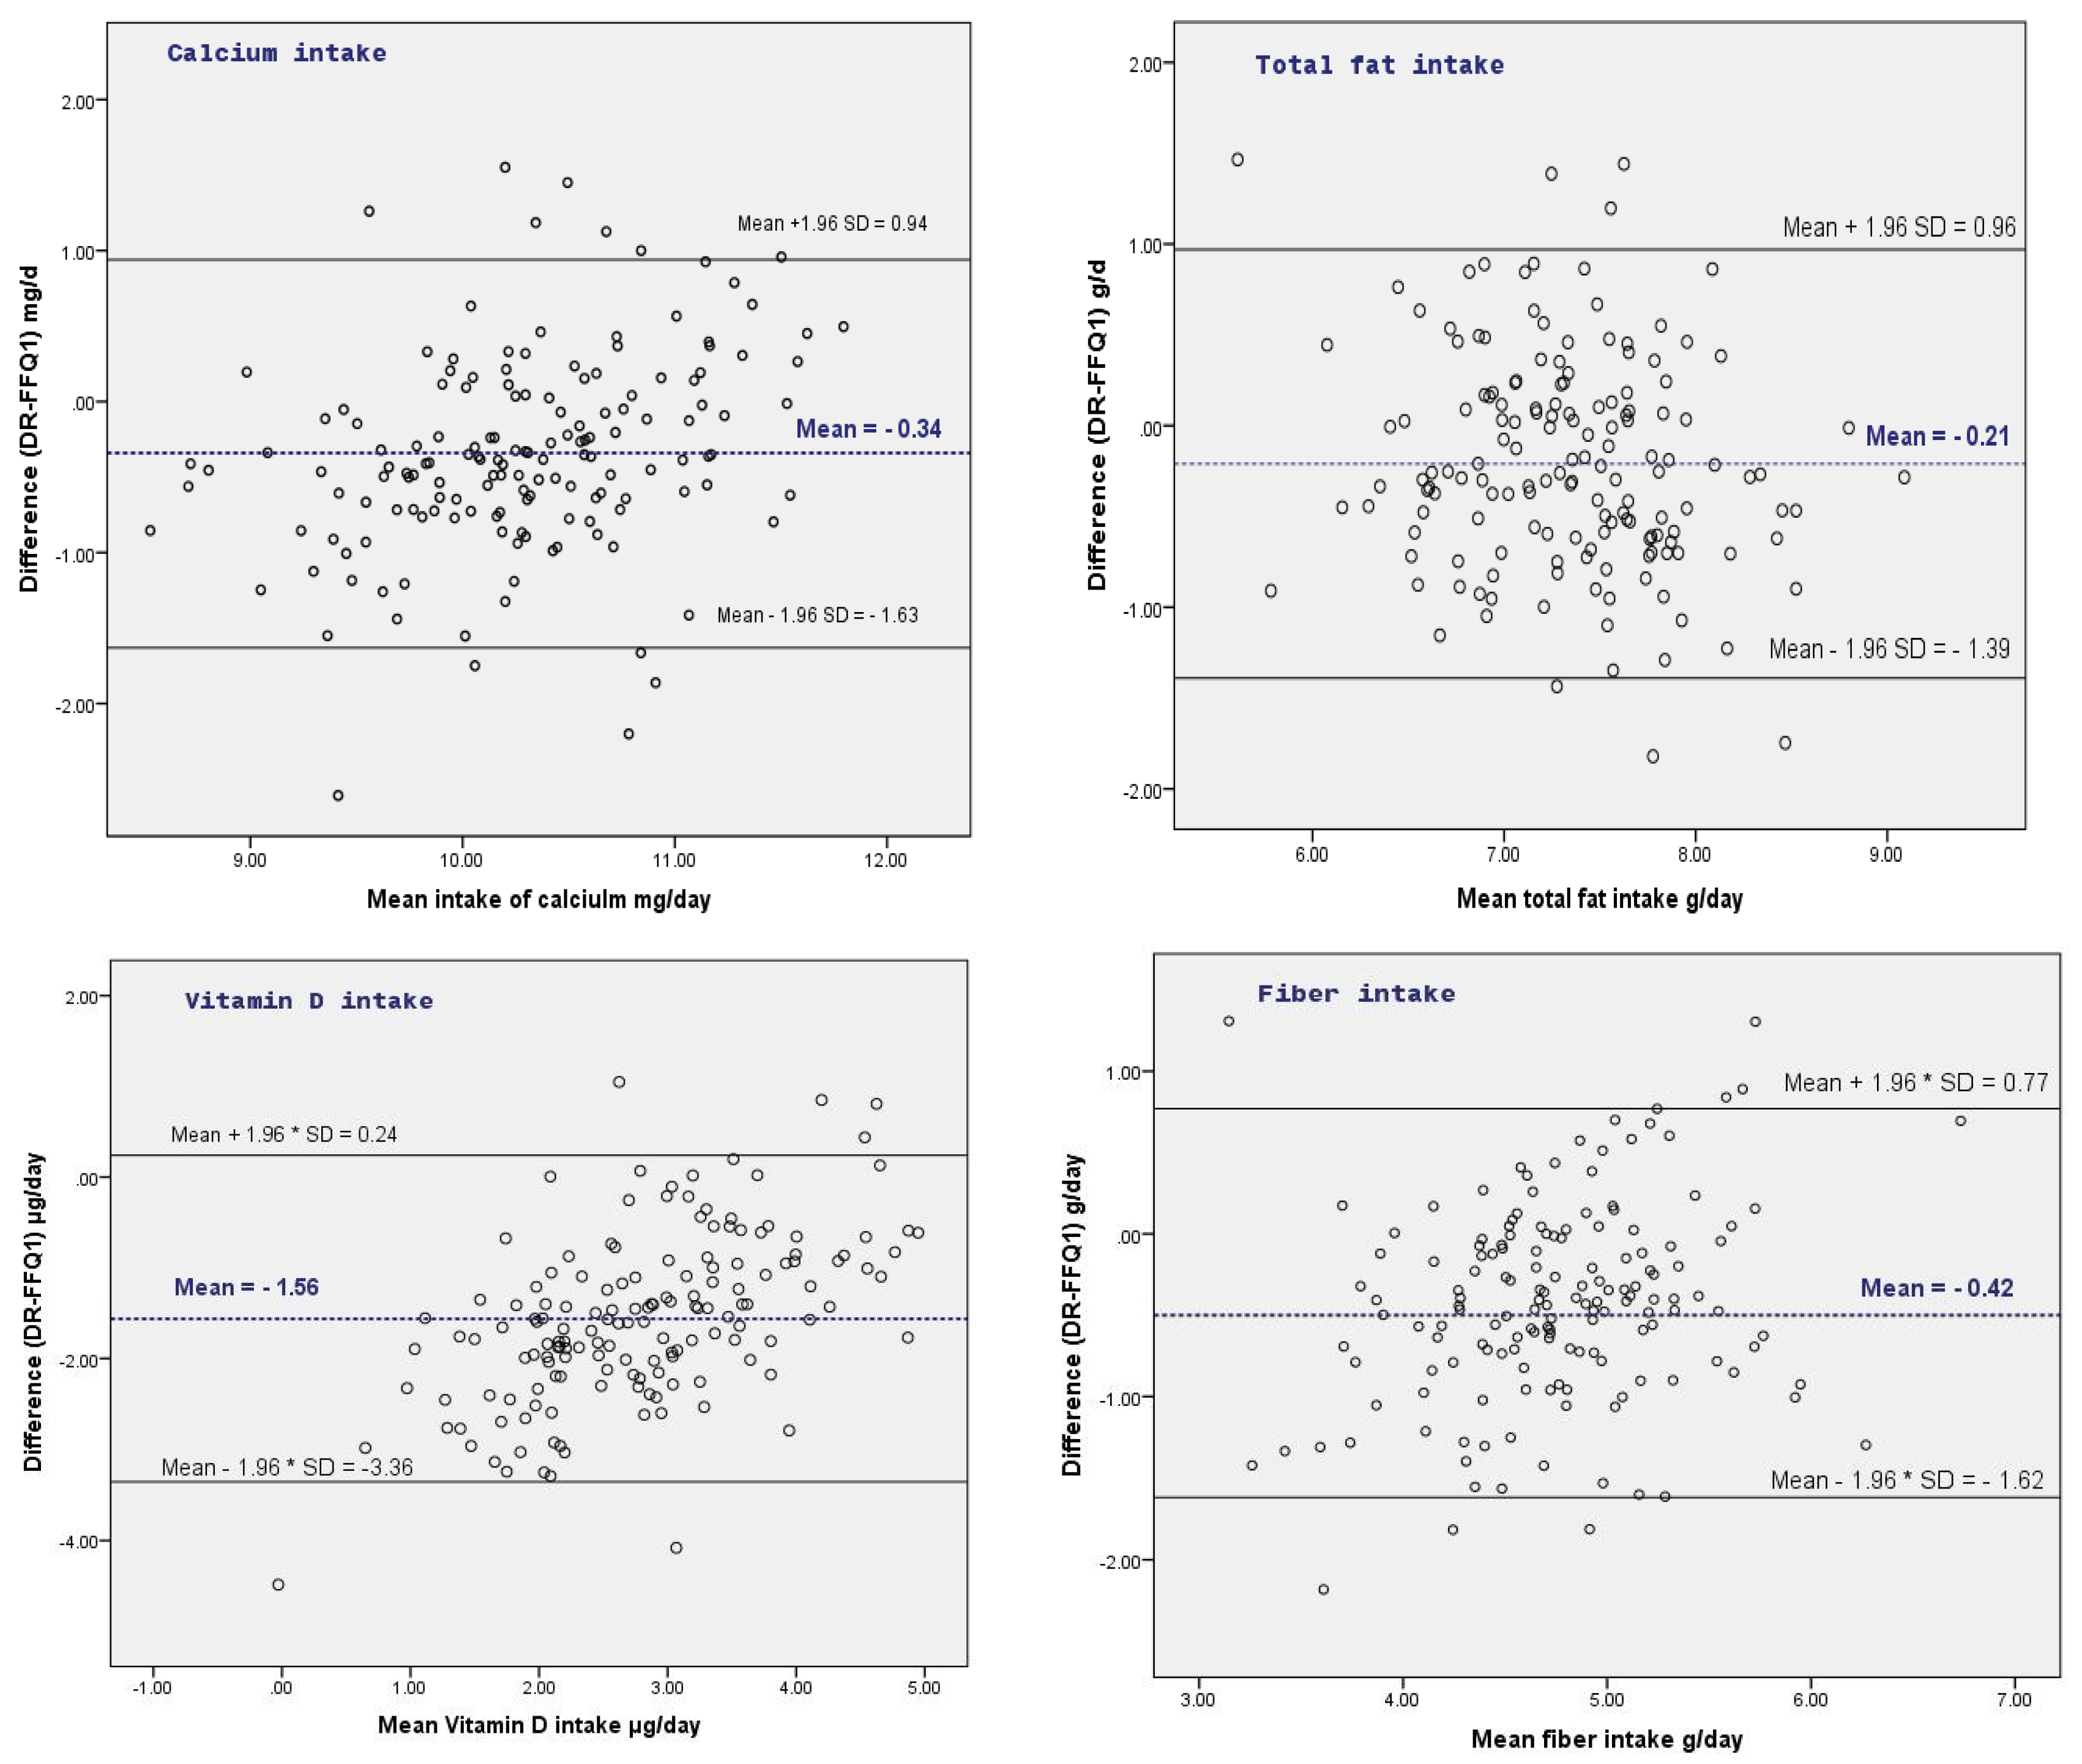
Measurement agreement for the reproducibility and validity was assessed using the Bland-Altman plots, whereby the difference of food and nutrient intake between methods was plotted against the average intake estimated by both methods [
33]. In case mean differences were associated with the estimated intake level, data were log-transformed prior to assessing measurement agreement. Although the use of correlation tests to assess measurement agreement has limitations [
33,
34], Spearman correlation statistics are provided to enable comparison with previous studies.
Cohen’s kappa statistic was used to assess the agreement of classifying participants into similar quartiles of daily intake. To enable comparison with other validity studies, we applied a Wilcoxon signed rank test and Spearman correlation to compare both methods. STATA (version 13, Stata Corp LP, College Station, TX, USA) was used to analyze the data.
4. Discussion
The aim of this study was to assess the reproducibility of the FFQ and assess relative validity against a 3-day diary method in a population of older adults in Flanders. The overall dietary intake was considered in the present study by assessing the intake of 109 food items related to colorectal cancer in a FFQ.
In terms of reproducibility, the estimated intake of foods and nutrients by FFQ1 was comparable to FFQ2. Although a few systematic differences were observed, these were small overall compared to the average daily intake. Good reproducibility was also observed from the correlations and classification agreement tests. Reproducibility in the present study was higher compared to most other studies investigating reproducibility of FFQs where correlation coefficients typically range between 0.5 and 0.7 [
14]. However, these high correlations may be explained by the design and study population. First, the period between administering the FFQs was relatively short, resulting in higher reproducibility [
14]. Second, the reproducibility of an FFQ in older adults is commonly higher compared to other populations, as dietary habits are more established in this population group and hence easier to recall [
35,
36].
In the present study, the correlation coefficients for food and nutrient intakes derived from FFQ1 and FFQ2 ranged from 0.74–0.94, which is higher than the studies by Forster et al. [
37] and Jackson et al. [
15], who reported coefficients ranging from 0.65–0.90 and 0.42–0.71 for food and nutrient intake, respectively. Measurement differences from individual respondents, however, varied widely and indicate that satisfactory results for reproducibility applied particularly at population group level.
Compared to the 3-day diary, however, the estimated mean intake of various foods (i.e., meat products and vegetables) and nutrients (i.e., calcium, fat, and vitamin D), as measured by the FFQ, were substantially higher. Previous studies have reported that FFQs usually overestimate the food and nutrient values of calcium and vitamins compared to other dietary assessment methods [
15,
38,
39].
Except for vegetables, alcoholic drinks, processed red meat, and total processed meat intake, other food groups were overestimated by the FFQ compared to the diary. This overestimation might be mainly related to some food items in the FFQ that may not have been consumed during the three days of recall, and also the differences in terms of data collection, questionnaire structure, and time between the surveys. Although the difference was not statistically significant, large mean difference between the FFQ and the diary was observed for alcohol intake (135.4 g/day). This is in contrast to a previous validation study in Flanders that found similar estimates for alcohol intake on a daily basis from an FFQ compared to a dietary record and high correlation coefficient (
ρ = 0.94) between both methods [
40]. Validity estimates of foods that are frequently consumed have been reported as higher than foods that are periodically consumed [
41].
A validation study of an FFQ in older adults in the Netherlands reported similar correlation coefficients (
r = 0.78) as observed in the present study, and lower estimated alcohol intake as assessed by the FFQ compared to the 24 h recall on a daily basis (196 g vs. 217 g, respectively) [
42]. We hypothesize that the FFQ estimations of usual alcohol intake are an underestimation of the actual consumption [
43].
A low correlation coefficient was found between the FFQ and 3-day diary for the majority of food groups (<0.30). Only alcohol (0.71) and fiber (0.44) intake showed a strong and moderate correlation, respectively. The lowest classification agreement was observed for omega-3 fatty acids and nitrite/nitrate, and the highest for alcohol intake. The present findings are comparable to other studies conducted among adults or older age groups. Previous FFQ validation studies reported a correlation coefficient ≥0.3 [
44,
45] and a kappa ≥0.4 [
45,
46] for the majority of food groups considered.
The wide limits of agreement for the estimated food group and nutrient intakes between FFQ and 3-day diary indicated that the measurement agreement was inadequate at the individual level. Inconsistency was also observed across the intake level of food groups and nutrients whereby the mean differences increased as the intake level further increased, indicating the agreement between FFQ and 3-day diary was better at lower, rather than higher, average intake values. As such, the FFQ can be considered appropriate to estimate the absolute intakes at group level. After log transformation, however, the limit of agreement for nutrients was much improved (quite small), indicating the satisfactory measurement agreement at individual level.
Strengths of the present study are the use of multiple statistical methods used to assess the validity and reproducibility of the FFQ and the use of 3 non-consecutive days of dietary recording. The sample size of the present study corresponds to median sample size (
n = 255) of FFQ validation studies [
14]. However, there are some limitations that need to be considered when interpreting the results. First, the FFQ contained 109 food items, which imposed a considerable burden on the participants. The low number of questionnaires that had to be discarded due to insufficient data indicates satisfactory compliance of the participants. Although this food list was substantial, it is only slightly higher than the median number of 88 food items in FFQs [
14]. Second, total energy intake was not assessed by the FFQ and could not be used to adjust validity estimates. Third, both the FFQ and diary were self-reported. Although care was taken to provide clear instructions on how to fill out the form, some misreporting cannot be ruled out. It should also be noted that the results obtained and the conclusions drawn from this study are limited to the older age groups (≥50 years). In addition, seasonal effects were not assessed. It should also be noted that the 3-day diary has limitations, particularly for estimating usual intakes of foods not consumed on a daily or regular basis such as fish intake and the intake of other specific food groups. Therefore, the relative validity results should be interpreted with caution as low correlations and large differences may also be due to measurement errors in the 3-day diaries for estimating specific foods and food groups. Finally, the FFQ was developed and validated for dietary risk factors of colorectal cancer. As risk factors for other cancers differ, the validity of the FFQ for other types of cancers or tumors remains to be investigated.

 ,
, 
