Impact of Food Rations and Supplements on Micronutrient Status by Trimester of Pregnancy: Cross-Sectional Studies in the Maela Refugee Camp in Thailand

 , , ,
, , ,  ,
,
Abstract
:1. Introduction
2. Materials and Methods
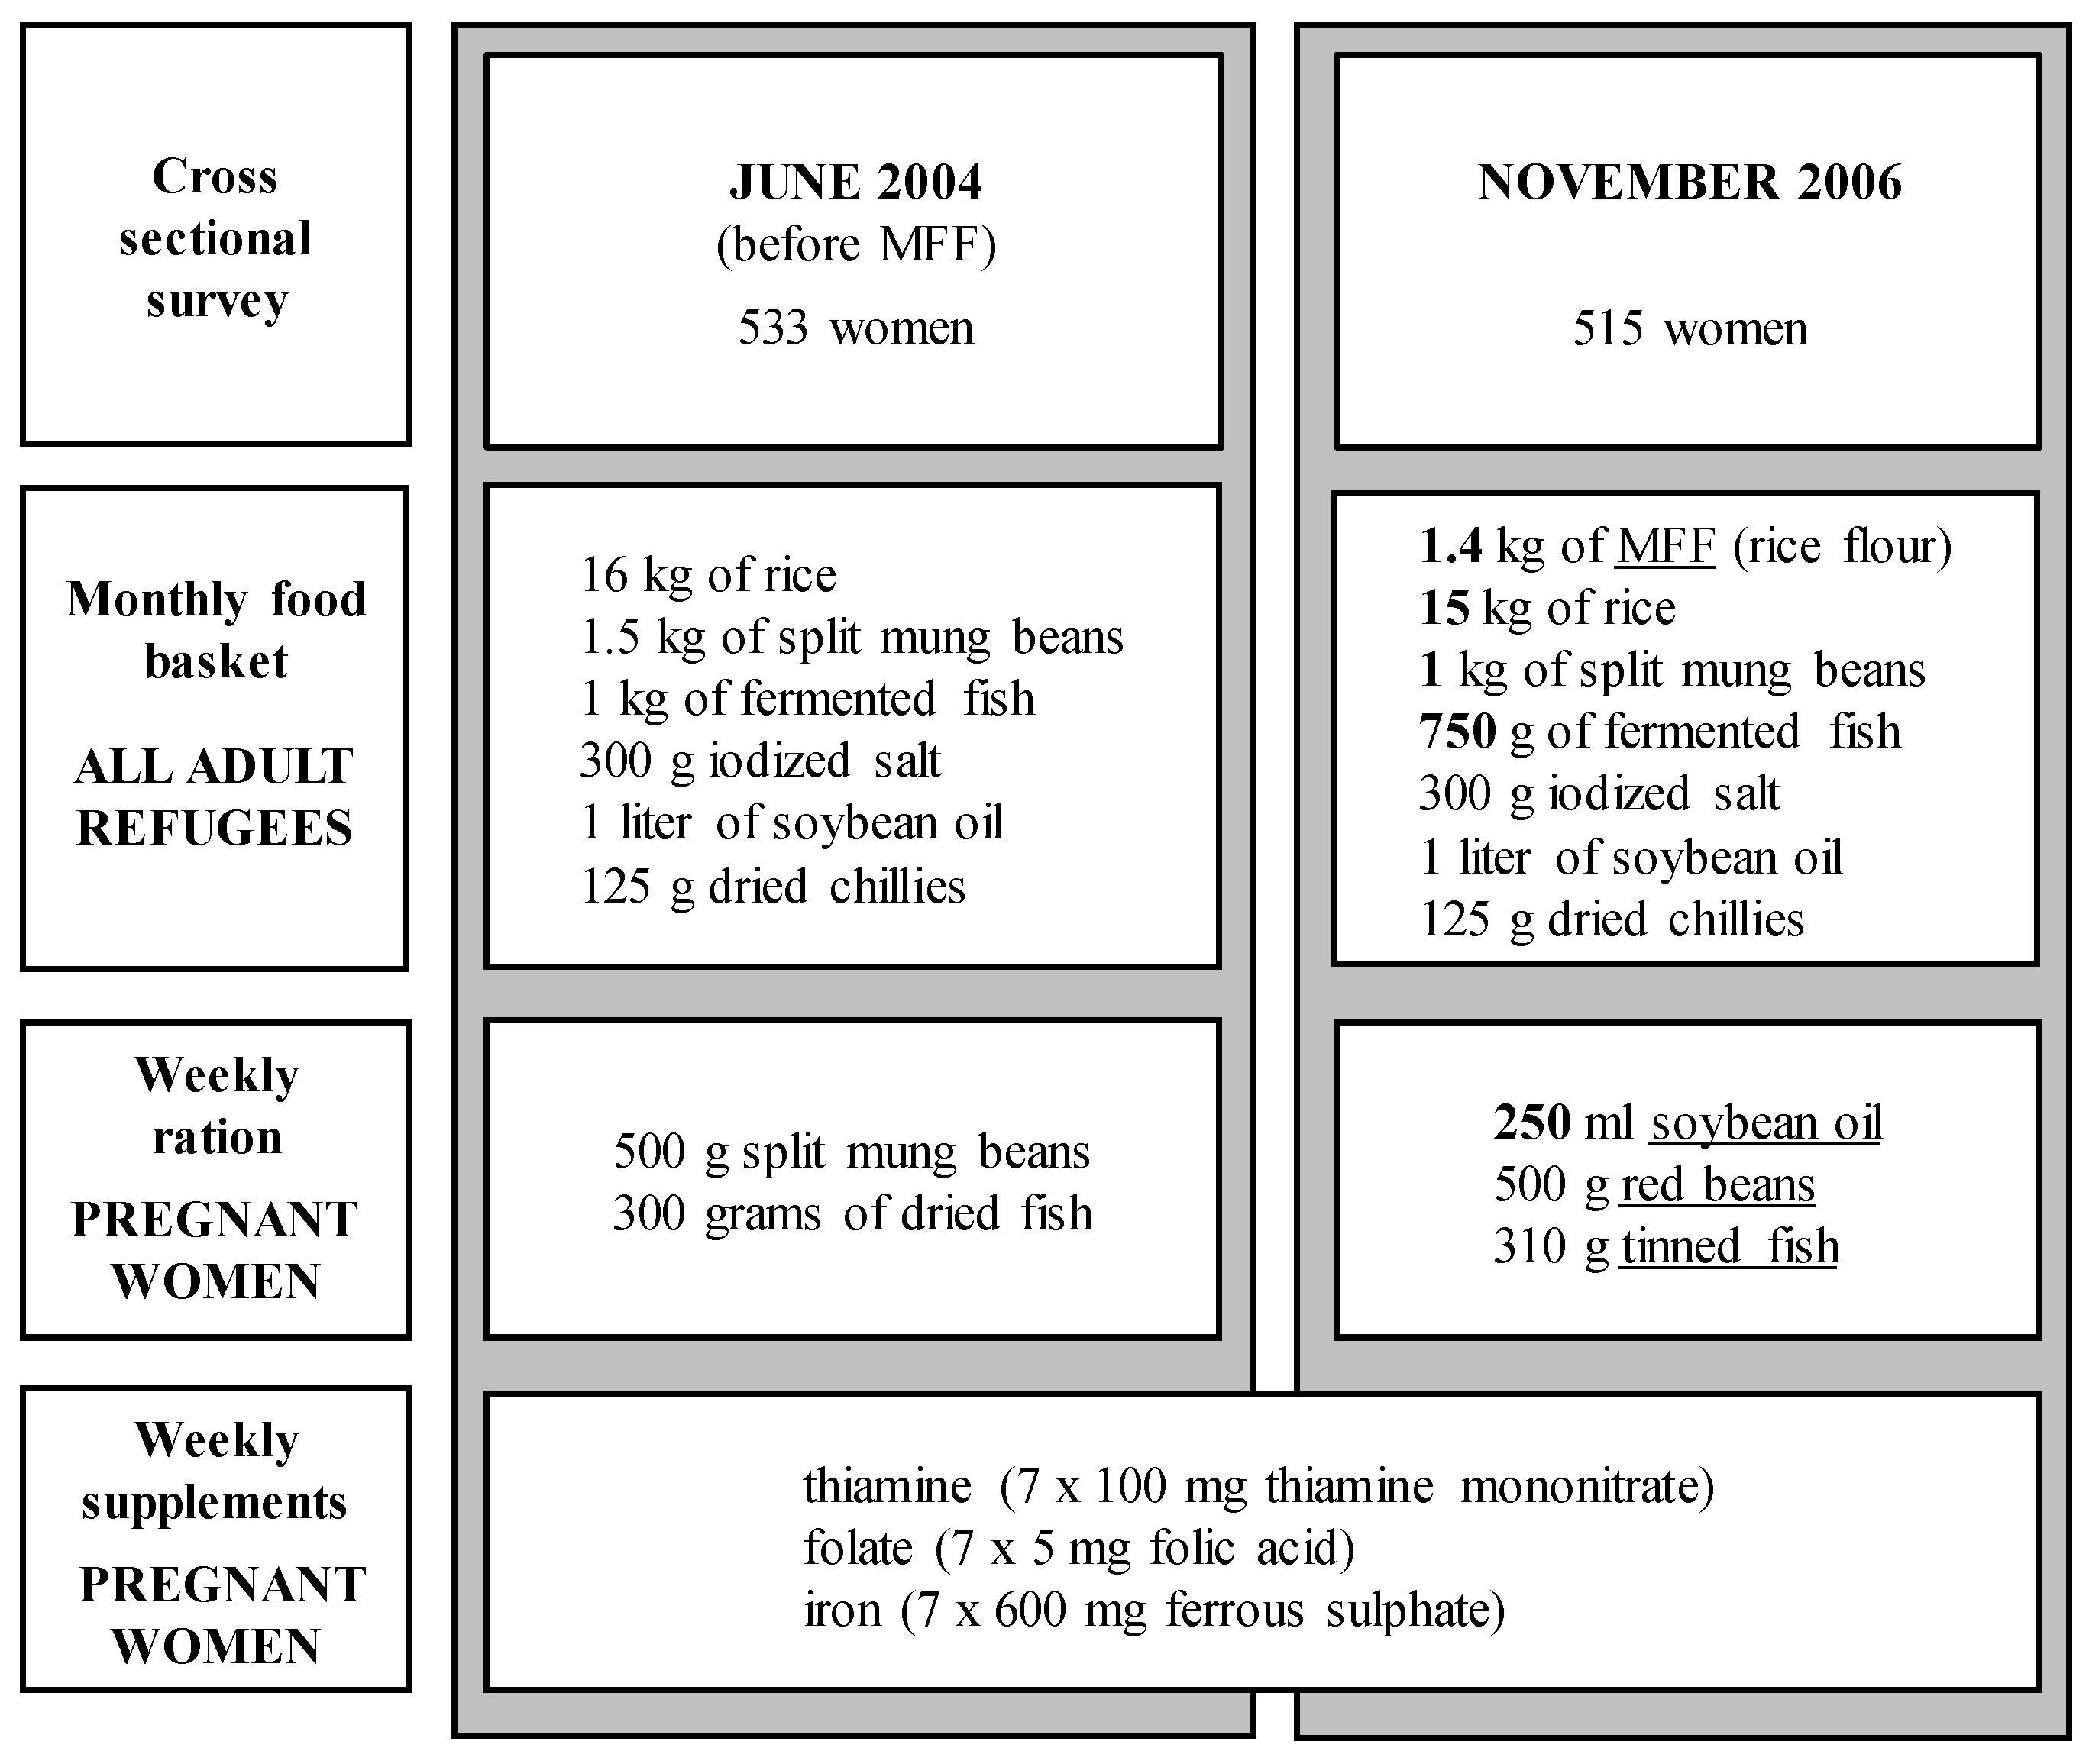
2.1. Study Population and Field Procedure
2.2. Gestational Age and Maternal Anthropometry
2.3. Dietary Changes
2.4. Laboratory Investigations
2.5. Statistical Analysis
3. Results

| Characteristics | 2004 (n = 533) | 2006 (n = 515) | p |
|---|---|---|---|
| Age (years) 1 | 26.4 ± 6.3 | 27.0 ± 7.2 | 0.173 |
| Years in Thailand (years) 2 | 10.0 (5, 15) | 10.0 (6, 16) * | 0.471 |
| Years in Maela (years) | 7.0 (4, 9) | 8.0 (5, 11) * | <0.001 |
| Weeks of MN suppl. (weeks) | 12.0 (5, 18) | 14.0 (6, 21) | 0.001 |
| Religion, n (%) 3 | |||
| Buddhist | 226 (42.4) | 243 (47.2) | |
| Muslim | 90 (16.9) | 84 (16.3) | 0.378 |
| Christian | 216 (40.5) | 186 (36.1) | (3 df) |
| Other/unknown | 1 (0.2) | 2 (0.4) | |
| Smoker, n (%) | 150 (28.1) | 138 (26.8) | 0.625 |
| Daily use of betel nut, n (%) | 105 (19.7) | 142 (27.7) * | 0.002 |
| Daily use of fermented fish-paste, n (%) | 302 (56.7) | 281 (54.8) * | 0.540 |
| Own garden (fruits/vegetables), n (%) | 248 (46.5) | 203 (39.6) * | 0.023 |
| Own chickens or ducks, n (%) | 106 (19.9) | 32 (6.2) * | <0.001 |
| Own pigs or goats, n (%) | 95 (17.8) | 157 (30.6) * | <0.001 |
| Parity, n (%) | |||
| 0 | 110 (20.6) | 134 (26.0) | |
| 1 | 135 (25.3) | 100 (19.4) | 0.025 |
| ≥2 | 288 (54.0) | 281 (54.6) | (2 df) |
| Trimester at time of x-sectional survey | |||
| 1st trimester, n (%) | 89 (16.7) | 64 (12.4) | |
| 2nd trimester, n (%) | 249 (46.7) | 225 (43.7) | 0.026 |
| 3rd trimester, n (%) | 195 (36.6) | 226 (43.9) | (2 df) |
| Height (cm) | 151.2 ± 5.3 | 150.9 ± 5.5 | 0.370 |
| Weight, if 1st trimester (kg) | 49.3 ± 7.6 | 47.5 ± 7.4 | 0.151 |
| Weight, if 2nd trimester (kg) | 51.0 ± 6.9 | 51.5 ± 7.7 | 0.485 |
| Weight, if 3rd trimester (kg) | 54.8 ± 6.9 | 55.7 ± 8.1 | 0.222 |
| BMI, if 1st trimester (kg/m2) | 21.6 ± 3.0 | 20.9 ± 2.6 | 0.143 |
| BMI, if 2nd trimester (kg/m2) | 22.2 ± 2.8 | 22.5 ± 2.9 | 0.292 |
| BMI, if 3rd trimester (kg/m2) | 24.0 ± 2.8 | 24.4 ± 3.0 | 0.149 |
| BMI < 18.5 kg/m2, n (%) 4 | 24 (4.5) | 19 (3.7) | |
| BMI ≥ 18.5 to 23 kg/m2, n (%) 4 | 280 (52.5) | 241 (46.8) | 0.180 |
| BMI ≥ 23 to 27.5 kg/m2, n (%) 4 | 192 (36.0) | 209 (40.6) | (3 df) |
| BMI ≥ 27.5 kg/m2, n (%) 4 | 37 (6.9) | 46 (8.9) |
| Micronutrient 1 | Basic Food 2 Basket 04 | Total Food 3 June 2004 | Basic Food 2 Basket 06 | Total Food 3 November 2006 | RDI 4 |
|---|---|---|---|---|---|
| Vitamin A, µg RE 1 (%) | 158 (20) | 179 (22) | 390 (49) | 504 (63) | 800 |
| α-TEs 1, mg (%) | 8.5 (57) | 10.0 (67) | 8.6 (57) | 15.2 (101) | 15 |
| Thiamine, mg (%) | 0.7 (50) | 1.2 (83) | 1.1 (78) | 1.4 (100) | 1.4 |
| Riboflavin, mg (%) | 0.4 (29) | 0.7 (47) | 1.1 (81) | 1.4 (99) | 1.4 |
| Nicotinamide, mg (%) | 10.3 (57) | 14.0 (78) | 12.5 (70) | 19.0 (105) | 18 |
| Folic acid, µg (%) | 334 (56) | 715 (119) | 326 (54) | 668 (111) | 600 |
| Cobalamin, µg (%) | 1.1 (42) | 3.3 (126) | 1.4 (53) | 3.1 (118) | 2.6 |
| Ascorbic acid, mg (%) | 5.6 (10) | 13.6 (25) | 26.2 (48) | 29.2 (53) | 55 |
| Zinc, mg (%) | 7.6 (76) | 9.9 (99) | 9.9 (99) | 13.1 (131) | 10 |
| Copper, mg (%) | 1.7 (174) | 2.5 (248) | 1.5 (149) | 2.6 (259) | 1.0 |
| Iron, mg (%) | 9.0 (33) | 14.7 (54) | 16.2 (60) | 22.0 (82) | 27 |
| Calcium, mg (%) | 138 (12) | 263 (22) | 183 (15) | 336 (28) | 1200 |
| Supplements | |||||
| Thiamine, mg (%) | 92 (6571) | 92 (6571) | 1.4 | ||
| Folic acid, µg (%) | 5000 (833) | 5000 (833) | 600 | ||
| Iron, mg (%) | 221 (221) | 221 (221) | 100 |
| Nutritional Markers | Tr | n | 2004 | n | 2006 | p |
|---|---|---|---|---|---|---|
| Hemoglobin (g/L) | 1 | 89 | 115.9 ± 11.0 | 64 | 113.7 ± 10.0 | 0.209 |
| 2 | 249 | 107.5 ± 11.1 | 223 | 107.8 ± 11.2 | 0.758 | |
| 3 | 195 | 109.0 ± 11.8 | 226 | 107.9 ± 11.6 | 0.356 | |
| (trimester trend) | P | <0.001 | <0.001 | |||
| CRP > 5 mg/L, n (%) | 1 | 88 | 20 (22.7) | 64 | 9 (14.1) | 0.179 |
| 2 | 248 | 49 (19.8) | 225 | 49 (21.8) | 0.588 | |
| 3 | 195 | 33 (16.9) | 226 | 40 (17.7) | 0.834 | |
| P | 0.459 | 0.303 | ||||
| AGP > 1 g/L, n (%) | 1 | 88 | 9 (10.2) | 64 | 8 (12.5) | 0.661 |
| 2 | 248 | 7 (2.8) | 225 | 1 (0.4) | 0.045 | |
| 3 | 195 | 2 (1.0) | 226 | 2 (0.9) | 0.882 | |
| P | <0.001 | <0.001 | ||||
| Ferritin (µg/L) | 1 | 88 | 57.0 (33.0, 80.6) | 64 | 70.1 (49.4, 108.6) | 0.023 |
| 2 | 248 | 39.5 (20.3, 68.1) | 225 | 39.9 (22.0, 64.3) | 0.923 | |
| 3 | 195 | 30.2 (15.2, 49.8) | 226 | 24.7 (12.5, 43.8) | 0.034 | |
| P | <0.001 | <0.001 | ||||
| sTfR (mg/L) | 1 | 88 | 5.81 (4.50, 7.05) | 64 | 5.52 (4.72, 6.63) | 0.811 |
| 2 | 248 | 5.96 (4.88, 7.55) | 225 | 6.04 (5.16, 7.46) | 0.284 | |
| 3 | 195 | 7.27 (5.70, 8.99) | 226 | 7.25 (5.97, 8.80) | 0.456 | |
| P | <0.001 | <0.001 | ||||
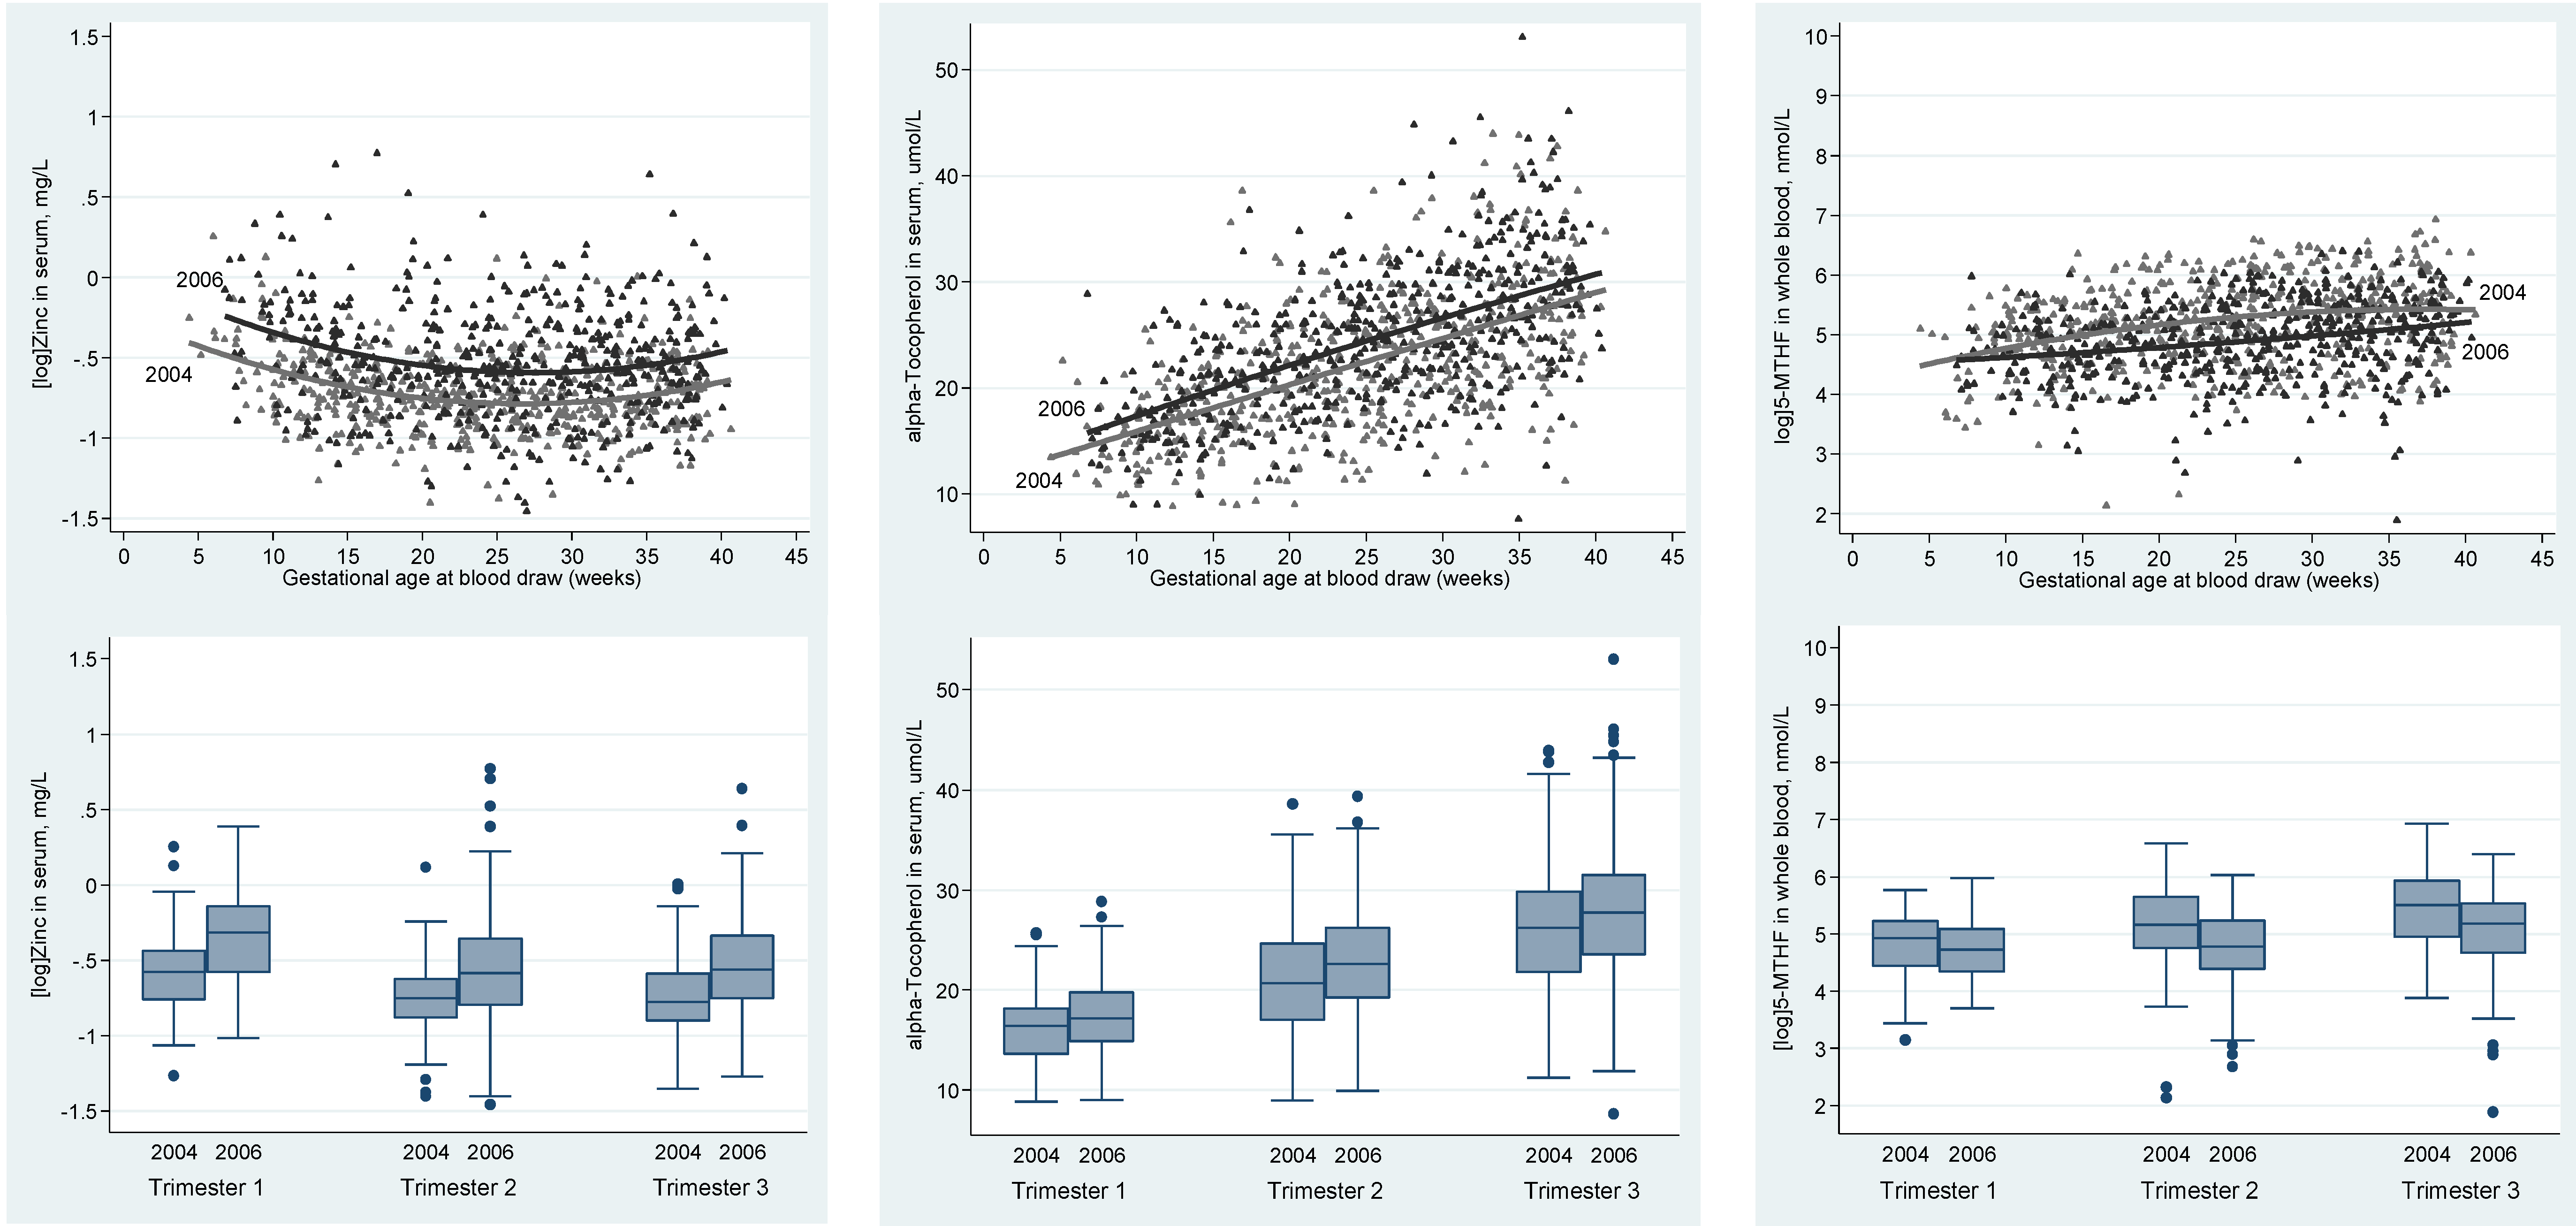
| Zinc (mg/L) | 1 | 88 | 0.560 (0.47, 0.65) | 64 | 0.726 (0.54, 0.87) | <0.001 |
| 2 | 248 | 0.471 (0.41, 0.54) | 225 | 0.558 (0.45, 0.70) | <0.001 | |
| 3 | 195 | 0.460 (0.40, 0.55) | 226 | 0.571 (0.47, 0.71) | <0.001 | |
| P | <0.001 | <0.001 | ||||
| Copper (mg/L) | 1 | 88 | 1.61 (1.40, 1.85) | 64 | 1.68 (1.45, 2.02) | 0.307 |
| 2 | 248 | 2.07 (1.82, 2.31) | 225 | 2.22 (1.87, 2.65) | <0.001 | |
| 3 | 195 | 2.14 (1.87, 2.41) | 226 | 2.28 (1.95, 2.80) | <0.001 | |
| P | <0.001 | <0.001 | ||||
| Cholesterol (mmol/L) | 1 | 88 | 3.80 ± 0.66 | 64 | 4.03 ± 0.73 | 0.041 |
| 2 | 248 | 4.66 ± 1.03 | 225 | 4.95 ± 1.03 | 0.002 | |
| 3 | 195 | 5.73 ± 1.17 | 226 | 5.95 ± 1.32 | 0.071 | |
| P | <0.001 | <0.001 | ||||
| Triglycerides (mmol/L) | 1 | 88 | 1.16 (0.90, 1.52) | 64 | 1.20 (0.91, 1.55) | 0.690 |
| 2 | 248 | 2.05 (1.55, 2.57) | 225 | 2.07 (1.65, 2.75) | 0.176 | |
| 3 | 195 | 2.93 (2.36, 3.67) | 226 | 3.10 (2.38, 3.87) | 0.325 | |
| P | <0.001 | <0.001 | ||||
| α-Tocopherol (µmol/l) | 1 | 88 | 16.19 ± 3.54 | 64 | 17.60 ± 4.28 | 0.028 |
| 2 | 248 | 20.86 ± 5.49 | 225 | 22.85 ± 5.25 | <0.001 | |
| 3 | 195 | 26.25 ± 6.34 | 226 | 28.06 ± 6.73 | 0.005 | |
| P | <0.001 | <0.001 | ||||
| α-Tocopherol/fat (µmol/g) | 1 | 88 | 3.17 ± 0.47 | 64 | 3.33 ± 0.61 | 0.073 |
| 2 | 248 | 3.13 ± 0.55 | 225 | 3.26 ± 0.60 | 0.012 | |
| 3 | 195 | 3.09 ± 0.54 | 226 | 3.21 ± 0.56 | 0.027 | |
| P | 0.505 | 0.327 | ||||
| γ-Tocopherol (µmol/L) | 1 | 88 | 2.26 (1.55, 3.07) | 64 | 2.19 (1.56, 2.96) | 0.528 |
| 2 | 248 | 2.54 (1.73, 3.41) | 225 | 2.61 (1.78, 3.45) | 0.730 | |
| 3 | 195 | 2.90 (2.04, 3.73) | 226 | 2.60 (1.98, 3.70) | 0.332 | |
| P | 0.001 | 0.003 | ||||
| Retinol (µmol/L) | 1 | 88 | 1.40 ± 0.33 | 64 | 1.28 ± 0.34 | 0.042 |
| 2 | 248 | 1.48 ± 0.41 | 225 | 1.35 ± 0.32 | <0.001 | |
| 3 | 195 | 1.35 ± 0.40 | 226 | 1.25 ± 0.39 | 0.013 | |
| P | 0.001 | 0.016 | ||||
| α-Carotene (µmol/L) | 1 | 88 | 0.040 (0.02, 0.06) | 64 | 0.064 (0.04, 0.10) | <0.001 |
| 2 | 248 | 0.042 (0.03, 0.07) | 225 | 0.069 (0.05, 0.11) | <0.001 | |
| 3 | 195 | 0.041 (0.03, 0.06) | 226 | 0.071 (0.05, 0.11) | <0.001 | |
| P | 0.294 | 0.774 | ||||
| β-Carotene (µmol/L) | 1 | 88 | 0.267 (0.18, 0.40) | 64 | 0.200 (0.17, 0.32) | 0.060 |
| 2 | 248 | 0.249 (0.16, 0.37) | 225 | 0.221 (0.16, 0.31) | 0.052 | |
| 3 | 195 | 0.216 (0.13, 0.32) | 226 | 0.216 (0.14, 0.31) | 0.946 | |
| P | 0.035 | 0.875 | ||||
| TDP (nmol/L) | 1 | 89 | 96.96 (75.15, 119.4) | 63 | 107.7 (84.93, 131.9) | 0.062 |
| 2 | 249 | 109.6 (83.96, 140.5) | 225 | 108.6 (87.42, 139.7) | 0.890 | |
| 3 | 195 | 111.0 (83.99, 145.5) | 226 | 110.8 (79.36, 139.2) | 0.246 | |
| P | 0.009 | 0.842 | ||||
| 5-MTHF (nmol/L) | 1 | 89 | 138.4 (83.72, 190.6) | 63 | 112.4 (72.44, 162.9) | 0.165 |
| 2 | 248 | 174.3 (115.3, 284.9) | 225 | 119.2 (79.72, 190.1) | <0.001 | |
| 3 | 195 | 246.2 (142.2, 376.0) | 226 | 178.2 (108.5, 252.5) | <0.001 | |
| P | <0.001 | <0.001 | ||||
| Tryptophan (µmol/L) | 1 | 89 | 27.96 ± 5.71 | 63 | 28.53 ± 8.46 | 0.621 |
| 2 | 248 | 25.72 ± 6.86 | 225 | 28.07 ± 5.98 | <0.001 | |
| 3 | 195 | 24.20 ± 5.58 | 226 | 26.51 ± 4.98 | <0.001 | |
| P | <0.001 | 0.006 |
| Anemia, MN Deficiencies | Tr | n | 2004 | n | 2006 | p |
|---|---|---|---|---|---|---|
| Anemia, n (%) | 1 | 89 | 29 (32.6) | 64 | 24 (37.5) | 0.528 |
| 2 | 249 | 93 (37.3) | 223 | 79 (35.4) | 0.665 | |
| 3 | 195 | 118 (60.5) | 226 | 134 (59.3) | 0.799 | |
| (trimester trend) | P | <0.001 | <0.001 | |||
| Iron deficiency, n (%) | 1 | 88 | 13 (14.8) | 64 | 6 (9.4) | 0.320 |
| 2 | 248 | 57 (23.0) | 225 | 39 (17.3) | 0.127 | |
| 3 | 195 | 75 (38.5) | 226 | 87 (38.5) | 0.994 | |
| P | <0.001 | <0.001 | ||||
| Zinc deficiency, n (%) | 1 | 88 | 44 (50.0) | 64 | 17 (26.6) | 0.004 |
| 2 | 248 | 164 (66.1) | 225 | 73 (32.4) | <0.001 | |
| 3 | 195 | 117 (60.0) | 226 | 69 (30.5) | <0.001 | |
| P | 0.026 | 0.660 | ||||
| Retinol <1.05 µmol/L, n (%) | 1 | 88 | 15 (17.0) | 64 | 15 (23.4) | 0.328 |
| 2 | 248 | 33 (13.3) | 225 | 39 (17.3) | 0.223 | |
| 3 | 195 | 44 (22.6) | 226 | 75 (33.2) | 0.016 | |
| P | 0.038 | 0.001 | ||||
| TDP <65 nmol/L, n (%) | 1 | 89 | 14 (15.7) | 63 | 6 (9.5) | 0.265 |
| 2 | 249 | 27 (10.8) | 225 | 17 (7.6) | 0.218 | |
| 3 | 195 | 16 (8.2) | 226 | 28 (12.4) | 0.162 | |
| P | 0.162 | 0.228 |
| MN Status Marker | Beta | 95% CI |
|---|---|---|
| Hemoglobin, g/L | ||
| Betel | −2.90 | −4.62 to −1.16 |
| (log) Ferritin, µg/L | ||
| AGP > 1 g/L | 0.320 | 0.002 to 0.637 |
| CRP > 5 mg/L | 0.201 | 0.068 to 0.334 |
| Fish paste (daily) | 0.141 | 0.038 to 0.244 |
| MN suppl., weeks | −0.022 | −0.028 to −0.016 |
| (log) sTfR, mg/L | ||
| Owns pigs or goats | −0.048 | −0.094 to −0.002 |
| MN suppl., weeks | 0.008 | 0.005 to 0.010 |
| (log) Zinc, mg/L | - | - |
| Copper, mg/L | ||
| CRP > 5 mg/L | 0.329 | 0.248 to 0.409 |
| α-Tocopherol, µmol/L | ||
| Owns pigs or goats | 0.582 | 0.005 to 1.16 |
| AGP > 1 g/L | −2.28 | −3.83 to −0.733 |
| CRP > 5 mg/L | 1.30 | 0.656 to 1.95 |
| Total serum fat, g/L | 2.79 | 2.65 to 2.93 |
| Fish paste (daily) | −0.908 | −1.41 to −0.405 |
| (log) γ-Tocopherol, µmol/L | ||
| AGP > 1g/L | −0.287 | −0.474 to −0.101 |
| CRP > 5mg/L | 0.144 | 0.065 to 0.222 |
| Fish paste (daily) | −0.074 | −0.134 to −0.013 |
| Retinol, µmol/L | ||
| AGP > 1 g/L | −0.288 | −0.429 to −0.147 |
| CRP > 5 mg/L | −0.113 | −0.173 to −0.054 |
| Owns chickens or ducks | 0.075 | 0.008 to 0.141 |
| Fish paste (daily) | 0.069 | 0.024 to 0.115 |
| (log) α-carotene, µmol/L | ||
| Betel (daily) | 0.765 | 0.608 to 0.923 |
| CRP > 5 mg/L | −0.249 | −0.414 to −0.084 |
| AGP > 1 g/L | −0.886 | −1.28 to −0.495 |
| Owns chickens or ducks | −0.202 | −0.386 to −0.017 |
| Owns pigs or goats | 0.280 | 0.134 to 0.425 |
| (log) β-carotene, µmol/L | ||
| AGP > 1 g/L | −0.422 | −0.670 to −0.174 |
| CRP > 5 mg/L | −0.117 | −0.221 to −0.012 |
| Own garden | 0.116 | 0.036 to 0.196 |
| Fish paste (daily) | 0.106 | 0.025 to 0.186 |
| TDP, nmol/L | ||
| MN suppl., weeks | 0.436 | 0.144 to 0.729 |
| (log) 5-MTHF, nmol/L | ||
| MN suppl., weeks | 0.022 | 0.017 to 0.027 |
| Own garden | 0.090 | 0.008 to 0.171 |
| Betel (daily) | −0.133 | -0.234 to −0.031 |
| Tryptophan, µmol/L | ||
| Owns pigs or goats | 0.920 | 0.040 to 1.80 |
| CRP > 5 mg/L | −1.19 | −2.18 to −0.203 |
| AGP > 1 g/L | −3.93 | −6.29 to −1.58 |
4. Discussion
5. Conclusions
Acknowledgments
Author Contributions
Conflicts of Interest
Appendix
References
- Prinzo, Z.W.; de Benoist, B. Meeting the challenges of micronutrient deficiencies in emergency-affected population. Proc. Nutr. Soc. 2002, 61, 251–257. [Google Scholar] [CrossRef] [PubMed]
- TBBC. Thailand Burmese Border Consortium: Programme Report for January to June 2006. Available online: http://www.Theborderconsortium.Org/media/9913/2006-6-mth-rpt-jan-jun-1-.pdf (accessed on 20 May 2009).
- Banjong, O.; Menefee, A.; Sranacharoenpong, K.; Chittchang, U.; Eg-kantrong, P.; Boonpraderm, A.; Tamachotipong, S. Dietary assessment of refugees living in camps: A Case Study of Mae La Camp, Thailand. Food Nutr. Bull. 2003, 24, 360–367. [Google Scholar] [CrossRef] [PubMed]
- McGready, R.; Simpson, J.A.; Cho, T.; Dubowitz, L.; Changbumrung, S.; Bohm, V.; Munger, R.G.; Sauberlich, H.E.; White, N.J.; Nosten, F. Postpartum thiamine deficiency in a Karen displaced population. Am. J. Clin. Nutr. 2001, 74, 808–813. [Google Scholar] [PubMed]
- Stuetz, W.; Carrara, V.I.; McGready, R.; Lee, S.J.; Erhardt, J.G.; Breuer, J.; Biesalski, H.K.; Nosten, F.H. Micronutrient status in lactating mothers before and after introduction of fortified flour: Cross-Sectional Surveys in Maela Refugee Camp. Eur. J. Nutr. 2012, 51, 425–434. [Google Scholar] [CrossRef] [PubMed]
- Christian, P.; Jiang, T.; Khatry, S.K.; le Clerq, S.C.; Shrestha, S.R.; West, K.P., Jr. Antenatal supplementation with micronutrients and biochemical indicators of status and subclinical infection in rural Nepal. Am. J. Clin. Nutr. 2006, 83, 788–794. [Google Scholar] [PubMed]
- Friis, H.; Gomo, E.; Koestel, P.; Ndhlovu, P.; Nyazema, N.; Krarup, H.; Michaelsen, K.F. HIV and other predictors of serum folate, serum ferritin, and hemoglobin in pregnancy: A Cross-Sectional Study in Zimbabwe. Am. J. Clin. Nutr. 2001, 73, 1066–1073. [Google Scholar] [PubMed]
- Abbassi-Ghanavati, M.; Greer, L.G.; Cunningham, F.G. Pregnancy and laboratory studies: A reference table for clinicians. Obstet. Gynecol. 2009, 114, 1326–1331. [Google Scholar] [CrossRef] [PubMed]
- Wheeler, S. Assessment and interpretation of micronutrient status during pregnancy. Proc. Nutr. Soc. 2008, 67, 437–450. [Google Scholar] [CrossRef] [PubMed]
- Baker, H.; DeAngelis, B.; Holland, B.; Gittens-Williams, L.; Barrett, T., Jr. Vitamin profile of 563 gravidas during trimesters of pregnancy. J. Am. Coll. Nutr. 2002, 21, 33–37. [Google Scholar] [CrossRef] [PubMed]
- Yamini, S.; West, K.P., Jr.; Wu, L.; Dreyfuss, M.L.; Yang, D.X.; Khatry, S.K. Circulating levels of retinol, tocopherol and carotenoid in Nepali pregnant and postpartum women following long-term beta-carotene and vitamin A supplementation. Eur. J. Clin. Nutr. 2001, 55, 252–259. [Google Scholar] [CrossRef] [PubMed]
- Jiang, T.; Christian, P.; Khatry, S.K.; Wu, L.; West, K.P., Jr. Micronutrient deficiencies in early pregnancy are common, concurrent, and vary by season among rural Nepali pregnant women. J. Nutr. 2005, 135, 1106–1112. [Google Scholar] [PubMed]
- Cikot, R.J.; Steegers-Theunissen, R.P.; Thomas, C.M.; de Boo, T.M.; Merkus, H.M.; Steegers, E.A. Longitudinal vitamin and homocysteine levels in normal pregnancy. Br. J. Nutr. 2001, 85, 49–58. [Google Scholar] [CrossRef] [PubMed]
- Rijken, M.J.; Mulder, E.J.H.; Papageorghiou, A.T.; Thiptharakun, S.; Wah, N.; Paw, T.K.; Dwell, S.L.M.; Visser, G.H.A.; Nosten, F.H.; McGready, R. Quality of ultrasound biometry obtained by local health workers in a refugee camp on the Thai-Burmese border. Ultrasound Obstet. Gynecol. 2012, 40, 151–157. [Google Scholar] [CrossRef] [PubMed]
- WHO Expert Consultation. Appropriate body-mass index for Asian populations and its implications for policy and intervention strategies. Lancet 2004, 363, 157–163. [Google Scholar]
- World Health Organization. Iron Deficiency Anaemia: Assessment, Prevention, and Control; WHO: Geneva, Switzerland, 2001; Volume WHO/NHD/01.3. [Google Scholar]
- Centers for disease control and prevention. Recommendations to prevent and control iron deficiency in the United States. MMWR Recomm. Rep. 1989, 47, 1–29. [Google Scholar]
- Cook, J.D.; Baynes, R.D.; Skikne, B.S. Iron deficiency and the measurement of iron status. Nutr. Res. Rev. 1992, 5, 198–202. [Google Scholar] [CrossRef] [PubMed]
- Semba, R.D.; Muhilal; West, K.P., Jr.; Natadisastra, G.; Eisinger, W.; Lan, Y.; Sommer, A. Hyporetinolemia and acute phase proteins in children with and without xerophthalmia. Am. J. Clin. Nutr. 2000, 72, 146–153. [Google Scholar] [PubMed]
- Hotz, C.; Peerson, J.M.; Brown, K.H. Suggested lower cutoffs of serum zinc concentrations for assessing zinc status: Reanalysis of the second National Health and Nutrition Examination Survey data (1976–1980). Am. J. Clin. Nutr. 2003, 78, 756–764. [Google Scholar] [PubMed]
- Stuetz, W.; Carrara, V.I.; McGready, R.; Lee, S.J.; Biesalski, H.K.; Nosten, F.H. Thiamine diphosphate in whole blood, thiamine and thiamine monophosphate in breast-milk in a refugee population. PLoS ONE 2012, 7, e36280. [Google Scholar] [CrossRef] [PubMed]
- World Health Organization. Indicators for Assessing Vitamin A Deficiency and Their Application in Monitoring and Evaluating Intervention Programmes; World Health Organization (WHO): Geneva, Switzerland, 1996; Volume WHO/NUT/96.10. [Google Scholar]
- Rylander, L.; Nilsson-Ehle, P.; Hagmar, L. A simplified precise method for adjusting serum levels of persistent organohalogen pollutants to total serum lipids. Chemosphere 2006, 62, 333–336. [Google Scholar] [CrossRef] [PubMed]
- Weber, D.; Stuetz, W.; Bernhard, W.; Franz, A.; Raith, M.; Grune, T.; Breusing, N. 5-methyltetrahydrofolate and thiamine diphosphate in cord-blood erythrocytes of preterm versus term newborns. Eur. J. Clin. Nutr. 2013, 67, 1029–1035. [Google Scholar] [CrossRef] [PubMed]
- Olsen, S.J.; Ungchusak, K.; Birmingham, M.; Bresee, J.; Dowell, S.F.; Chunsuttiwat, S. Surveillance for avian influenza in human beings in Thailand. Lancet Infect. Dis. 2006, 6, 757–758. [Google Scholar] [CrossRef]
- United States Department of Agriculture, Agricultural Research Service. National Nutrient Database for Standard Reference Release 28. Available online: http://ndb.nal.usda.gov/ndb/search/list (accessed on 29 September 2015).
- Souci, S.W.; Fachmann, W.; Kraut, H. Food Composition and Nutrition Tables; Med Pharm Scientific Publishers: Stuttgart, Germany, 2008. [Google Scholar]
- Food and Agriculture Organization (FAO). Human Vitamin and Mineral Requirements Report of a Joint FAO/WHO Expert Consultation in Bangkok, Thailand; Food and Nutrition Division, FAO: Rome, Italy, 2001. [Google Scholar]
- Bieri, J.G.; Evarts, R.P. Gamma tocopherol: Metabolism, biological activity and significance in human vitamin E nutrition. Am. J. Clin. Nutr. 1974, 27, 980–986. [Google Scholar] [PubMed]
- Jiang, Q.; Christen, S.; Shigenaga, M.K.; Ames, B.N. Gamma-tocopherol, the major form of vitamin E in the USA diet, deserves more attention. Am. J. Clin. Nutr. 2001, 74, 714–722. [Google Scholar] [PubMed]
- Hughes, C.F.; Ward, M.; Hoey, L.; McNulty, H. Vitamin B12 and ageing: Current issues and interaction with folate. Ann. Clin. Biochem. 2013, 50, 315–329. [Google Scholar] [CrossRef] [PubMed]
- Steer, P.J. Maternal hemoglobin concentration and birth weight. Am. J. Clin. Nutr. 2000, 71, 1285S–1287S. [Google Scholar] [PubMed]
- Schrocksnadel, K.; Widner, B.; Bergant, A.; Neurauter, G.; Schennach, H.; Schrocksnadel, H.; Fuchs, D. Longitudinal study of tryptophan degradation during and after pregnancy. Life Sci. 2003, 72, 785–793. [Google Scholar] [CrossRef]
- Scaife, A.R.; McNeill, G.; Campbell, D.M.; Martindale, S.; Devereux, G.; Seaton, A. Maternal intake of antioxidant vitamins in pregnancy in relation to maternal and fetal plasma levels at delivery. Br. J. Nutr. 2006, 95, 771–778. [Google Scholar] [CrossRef] [PubMed]
- Ladipo, O.A. Nutrition in pregnancy: Mineral and vitamin supplements. Am. J. Clin. Nutr. 2000, 72, 280S–290S. [Google Scholar] [PubMed]
- Seshadri, S. Prevalence of micronutrient deficiency particularly of iron, zinc and folic acid in pregnant women in South East Asia. Br. J. Nutr. 2001, 85, S87–S92. [Google Scholar] [CrossRef] [PubMed]
- Boel, M.; Carrara, V.I.; Rijken, M.; Proux, S.; Nacher, M.; Pimanpanarak, M.; Paw, M.K.; Moo, O.; Gay, H.; Bailey, W.; et al. Complex interactions between soil-transmitted helminths and malaria in pregnant women on the Thai-Burmese border. PLoS Negl. Trop. Dis. 2010, 4, e887. [Google Scholar] [CrossRef] [PubMed]
- Shi, Z.; Zhen, S.; Wittert, G.A.; Yuan, B.; Zuo, H.; Taylor, A.W. Inadequate riboflavin intake and anemia risk in a Chinese population: Five-year follow up of the Jiangsu Nutrition Study. PLoS ONE 2014, 9, e88862. [Google Scholar] [CrossRef] [PubMed]
- Ma, A.G.; Schouten, E.G.; Zhang, F.Z.; Kok, F.J.; Yang, F.; Jiang, D.C.; Sun, Y.Y.; Han, X.X. Retinol and riboflavin supplementation decreases the prevalence of anemia in Chinese pregnant women taking iron and folic acid supplements. J. Nutr. 2008, 138, 1946–1950. [Google Scholar] [PubMed]
- Abel, R.; Rajaratnam, J.; Kalaimani, A.; Kirubakaran, S. Can iron status be improved in each of the three trimesters? A community-based study. Eur. J. Clin. Nutr. 2000, 54, 490–493. [Google Scholar] [CrossRef] [PubMed]
- Muslimatun, S.; Schmidt, M.K.; Schultink, W.; West, C.E.; Hautvast, J.A.; Gross, R.; Muhilal. Weekly supplementation with iron and vitamin A during pregnancy increases hemoglobin concentration but decreases serum ferritin concentration in Indonesian pregnant women. J. Nutr. 2001, 131, 85–90. [Google Scholar] [PubMed]
- Berger, J.; Thanh, H.T.; Cavalli-Sforza, T.; Smitasiri, S.; Khan, N.C.; Milani, S.; Hoa, P.T.; Quang, N.D.; Viteri, F. Community mobilization and social marketing to promote weekly iron-folic acid supplementation in women of reproductive age in Vietnam: Impact on anemia and iron status. Nutr. Rev. 2005, 63, S95–S108. [Google Scholar] [CrossRef] [PubMed]
- Chue, A.L.; Carrara, V.I.; Paw, M.K.; Pimanpanarak, M.; Wiladphaingern, J.; van Vugt, M.; Lee, S.J.; Nosten, F.; McGready, R. Is areca innocent? The effect of areca (betel) nut chewing in a population of pregnant women on the Thai-Myanmar border. Int. Health 2012, 4, 204–209. [Google Scholar] [CrossRef] [PubMed]
- Gamble, M.V.; Ahsan, H.; Liu, X.; Factor-Litvak, P.; Ilievski, V.; Slavkovich, V.; Parvez, F.; Graziano, J.H. Folate and cobalamin deficiencies and hyperhomocysteinemia in Bangladesh. Am. J. Clin. Nutr. 2005, 81, 1372–1377. [Google Scholar] [PubMed]
- Raju, M.; Varakumar, S.; Lakshminarayana, R.; Krishnakantha, T.P.; Baskaran, V. Carotenoid composition and vitamin A activity of medicinally important green leafy vegetables. Food Chem. 2007, 101, 1598–1605. [Google Scholar] [CrossRef]
- Dye, T.D. Contemporary prevalence and prevention of micronutrient deficiencies in refugee settings worldwide. J. Refug. Stud. 2007, 20, 108–119. [Google Scholar] [CrossRef]
- World Health Organization. Protein and Amino Acid Requirements in Human Nutrition: Report of a Joint WHO/FAO/UNU Expert Consultation; WHO Technical Report Series 935; World Health Organization: Geneva, Switzerland, 2007. [Google Scholar]
- Fu, C.S.; Swendseid, M.E.; Jacob, R.A.; McKee, R.W. Biochemical markers for assessment of niacin status in young men: Levels of erythrocyte niacin coenzymes and plasma tryptophan. J. Nutr. 1989, 119, 1949–1955. [Google Scholar] [PubMed]
© 2016 by the authors; licensee MDPI, Basel, Switzerland. This article is an open access article distributed under the terms and conditions of the Creative Commons by Attribution (CC-BY) license (http://creativecommons.org/licenses/by/4.0/).
Share and Cite
Stuetz, W.; Carrara, V.I.; Mc Gready, R.; Lee, S.J.; Sriprawat, K.; Po, B.; Hanboonkunupakarn, B.; Grune, T.; Biesalski, H.K.; Nosten, F.H. Impact of Food Rations and Supplements on Micronutrient Status by Trimester of Pregnancy: Cross-Sectional Studies in the Maela Refugee Camp in Thailand. Nutrients 2016, 8, 66. https://doi.org/10.3390/nu8020066
Stuetz W, Carrara VI, Mc Gready R, Lee SJ, Sriprawat K, Po B, Hanboonkunupakarn B, Grune T, Biesalski HK, Nosten FH. Impact of Food Rations and Supplements on Micronutrient Status by Trimester of Pregnancy: Cross-Sectional Studies in the Maela Refugee Camp in Thailand. Nutrients. 2016; 8(2):66. https://doi.org/10.3390/nu8020066
Chicago/Turabian StyleStuetz, Wolfgang, Verena I. Carrara, Rose Mc Gready, Sue J. Lee, Kanlaya Sriprawat, Basi Po, Borimas Hanboonkunupakarn, Tilman Grune, Hans K. Biesalski, and François H. Nosten. 2016. "Impact of Food Rations and Supplements on Micronutrient Status by Trimester of Pregnancy: Cross-Sectional Studies in the Maela Refugee Camp in Thailand" Nutrients 8, no. 2: 66. https://doi.org/10.3390/nu8020066
APA StyleStuetz, W., Carrara, V. I., Mc Gready, R., Lee, S. J., Sriprawat, K., Po, B., Hanboonkunupakarn, B., Grune, T., Biesalski, H. K., & Nosten, F. H. (2016). Impact of Food Rations and Supplements on Micronutrient Status by Trimester of Pregnancy: Cross-Sectional Studies in the Maela Refugee Camp in Thailand. Nutrients, 8(2), 66. https://doi.org/10.3390/nu8020066