Comparison of the Effect of Two Human Milk Fortifiers on Clinical Outcomes in Premature Infants


Abstract
:1. Introduction
2. Patients and Methods
2.1. Participants and Study Design
2.2. Comparison and Use of Human Milk Fortifiers

| 24-Calorie-Per-Ounce Fortified Premature Human Milk [16,17] | ||
|---|---|---|
| Per 100 mL | Powder HMF | Liquid HMF |
| Protein (g) | 2.35 | 3.2 |
| Iron (mg) | 0.46 | 1.85 |
| Calcium (mg) | 138 | 141 |
| Phosphorus (mg) | 78 | 78 |
| Vitamin D (IU) | 119 | 200 |
| pH | - | 4.7 |
| Primary Fortifier Macronutrient Ingredients | nonfat milk, whey protein concentrate, corn syrup solids, medium-chain triglycerides (MCT oil) | water, whey protein isolate hydrolysate (milk), medium chain triglycerides (MCT oil), vegetable oil (soy and high oleic sunflower oils) |
2.3. Data Collection
2.4. Demographics
2.5. Anthropometrics
2.6. Nutrition
2.7. Laboratory Measurements
2.8. Data Analysis
3. Results
| Variable | PHMF | ALHMF | p-value | ||||
|---|---|---|---|---|---|---|---|
| n | Mean | SD (±) | n | Mean | SD (±) | ||
| CGA at Birth | 46 | 29.5 | 3.0 | 23 | 30.3 | 2.5 | 0.21 |
| Birth Weight (g) | 46 | 1293.7 | 407.5 | 23 | 1437.3 | 375.6 | 0.13 |
| Birth Weight Percentile | 46 | 31.4 | 24.7 | 23 | 36 | 26.5 | 0.82 |
| Weight at 36 Weeks CGA (g) # | 44 | 2245.9 | 450.72 | 18 | 2071.2 | 367.4 | 0.17 |
| Weight Percentile at 36 Weeks CGA # | 44 | 18.6 | 24.4 | 18 | 10.3 | 13.8 | 0.22 |
| HC at Birth (cm) | 46 | 27.2 | 3.4 | 22 | 27.9 | 2.1 | 0.19 |
| HC Percentile at Birth | 46 | 29.9 | 23.1 | 22 | 33.6 | 26.3 | 0.7 |
| HC at 36 Weeks CGA (cm) # | 42 | 32.5 | 2.6 | 19 | 31.9 | 1.5 | 0.37 |
| HC Percentile at 36 Weeks CGA # | 42 | 38.8 | 30.7 | 19 | 31.4 | 24.6 | 0.5 |
| Length at Birth (cm) | 46 | 38.6 | 3.9 | 21 | 40.4 | 2.8 | 0.07 |
| Length Percentile at Birth | 46 | 31.4 | 24.6 | 22 | 32.8 | 21.9 | 0.68 |
| Length at 36 Weeks CGA (cm) # | 42 | 44.2 | 3.3 | 19 | 43.5 | 4.6 | 0.44 |
| Length Percentile at 36 Weeks CGA # | 42 | 17.3 | 22.3 | 19 | 21.3 | 28.1 | 0.93 |
| Variable | PHMF | ALHMF | p-Value | ||||
|---|---|---|---|---|---|---|---|
| N | Median | N | Median | ||||
| Average Daily Provision of Protein per kg Weight | 42 | 3.9 | 18 | 4.3 | 0.0014 | ||
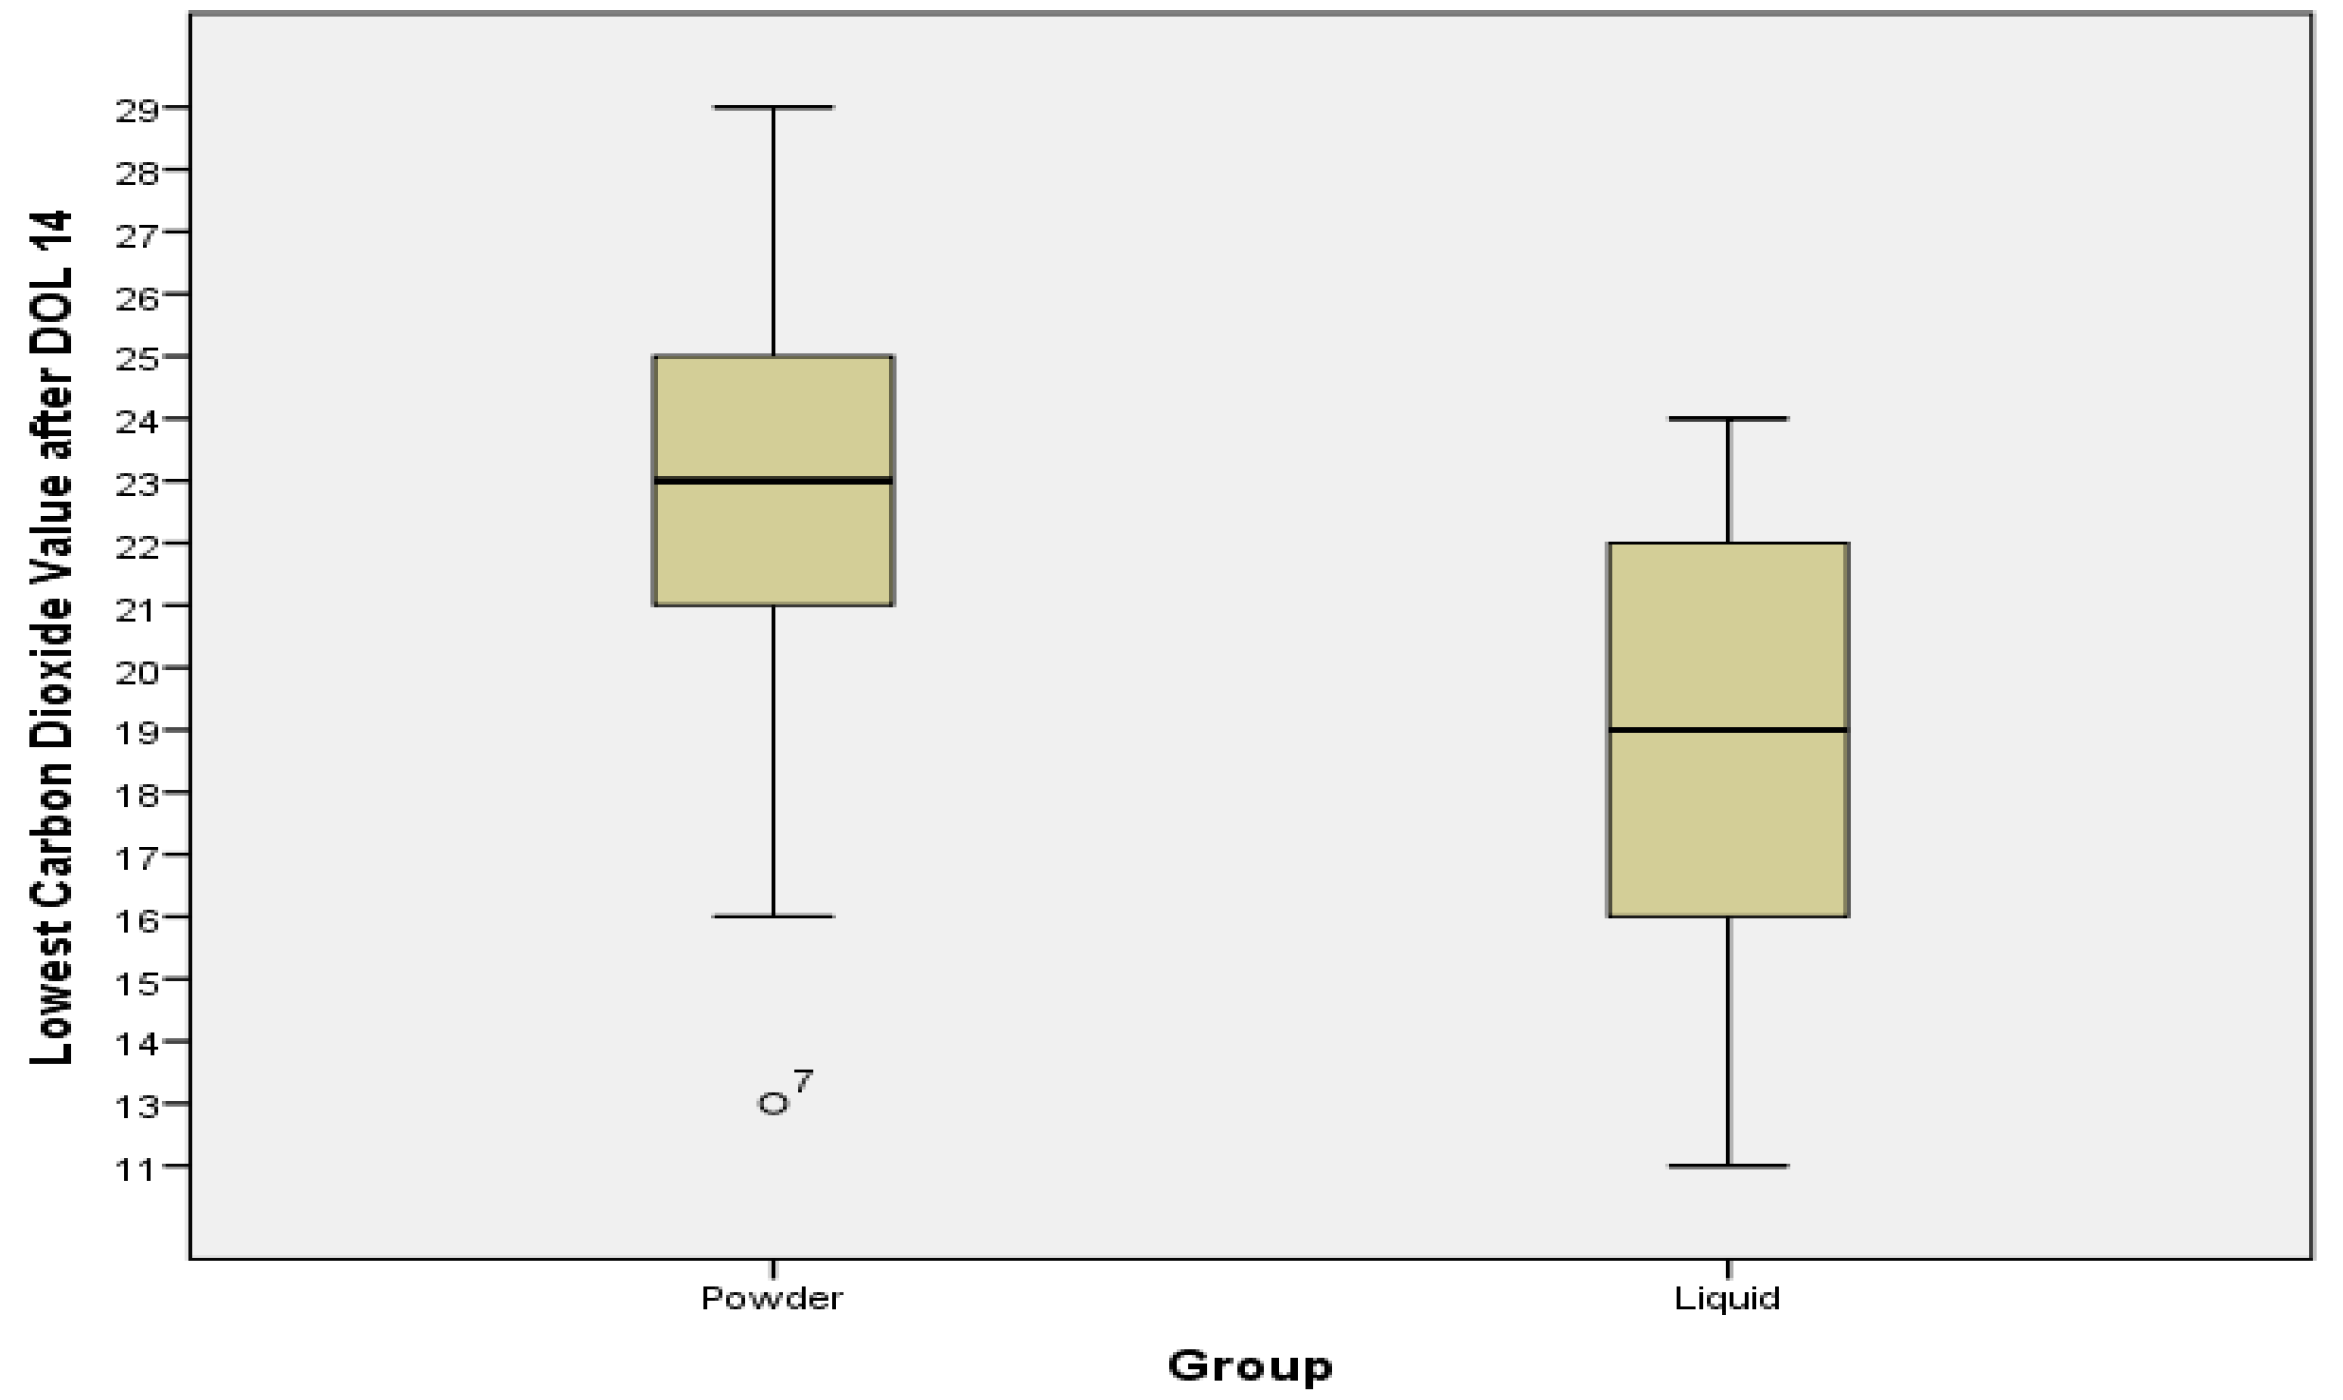
| CO2 Minimum after DOL 14 | 33 | 23 | 16 | 18.5 | 0.002 | ||
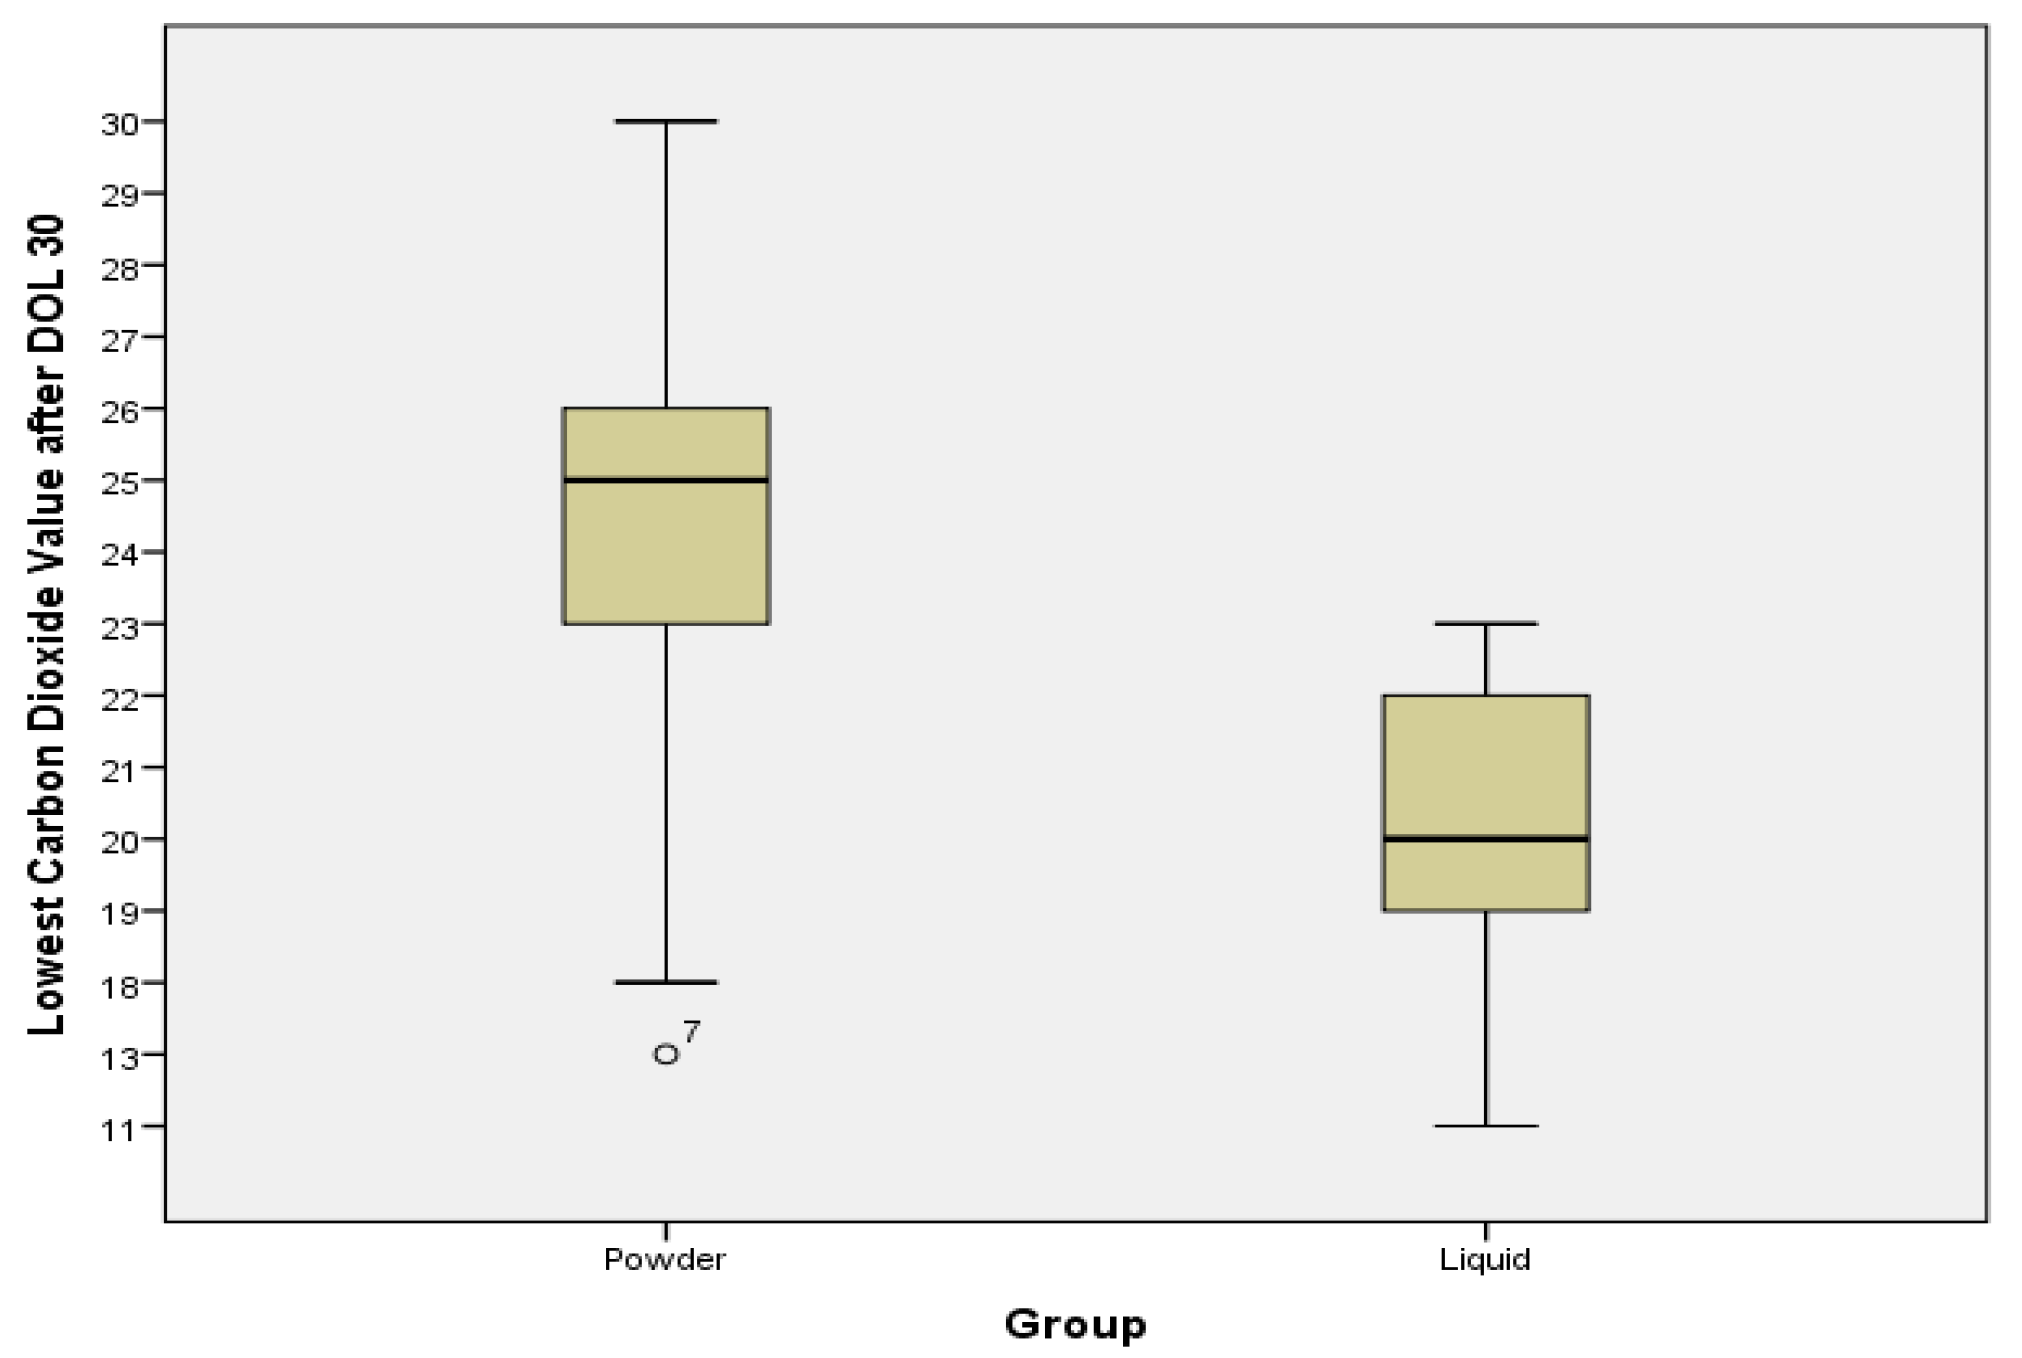
| CO2 Minimum after DOL 30 | 23 | 25 | 8 | 20 | 0.002 | ||
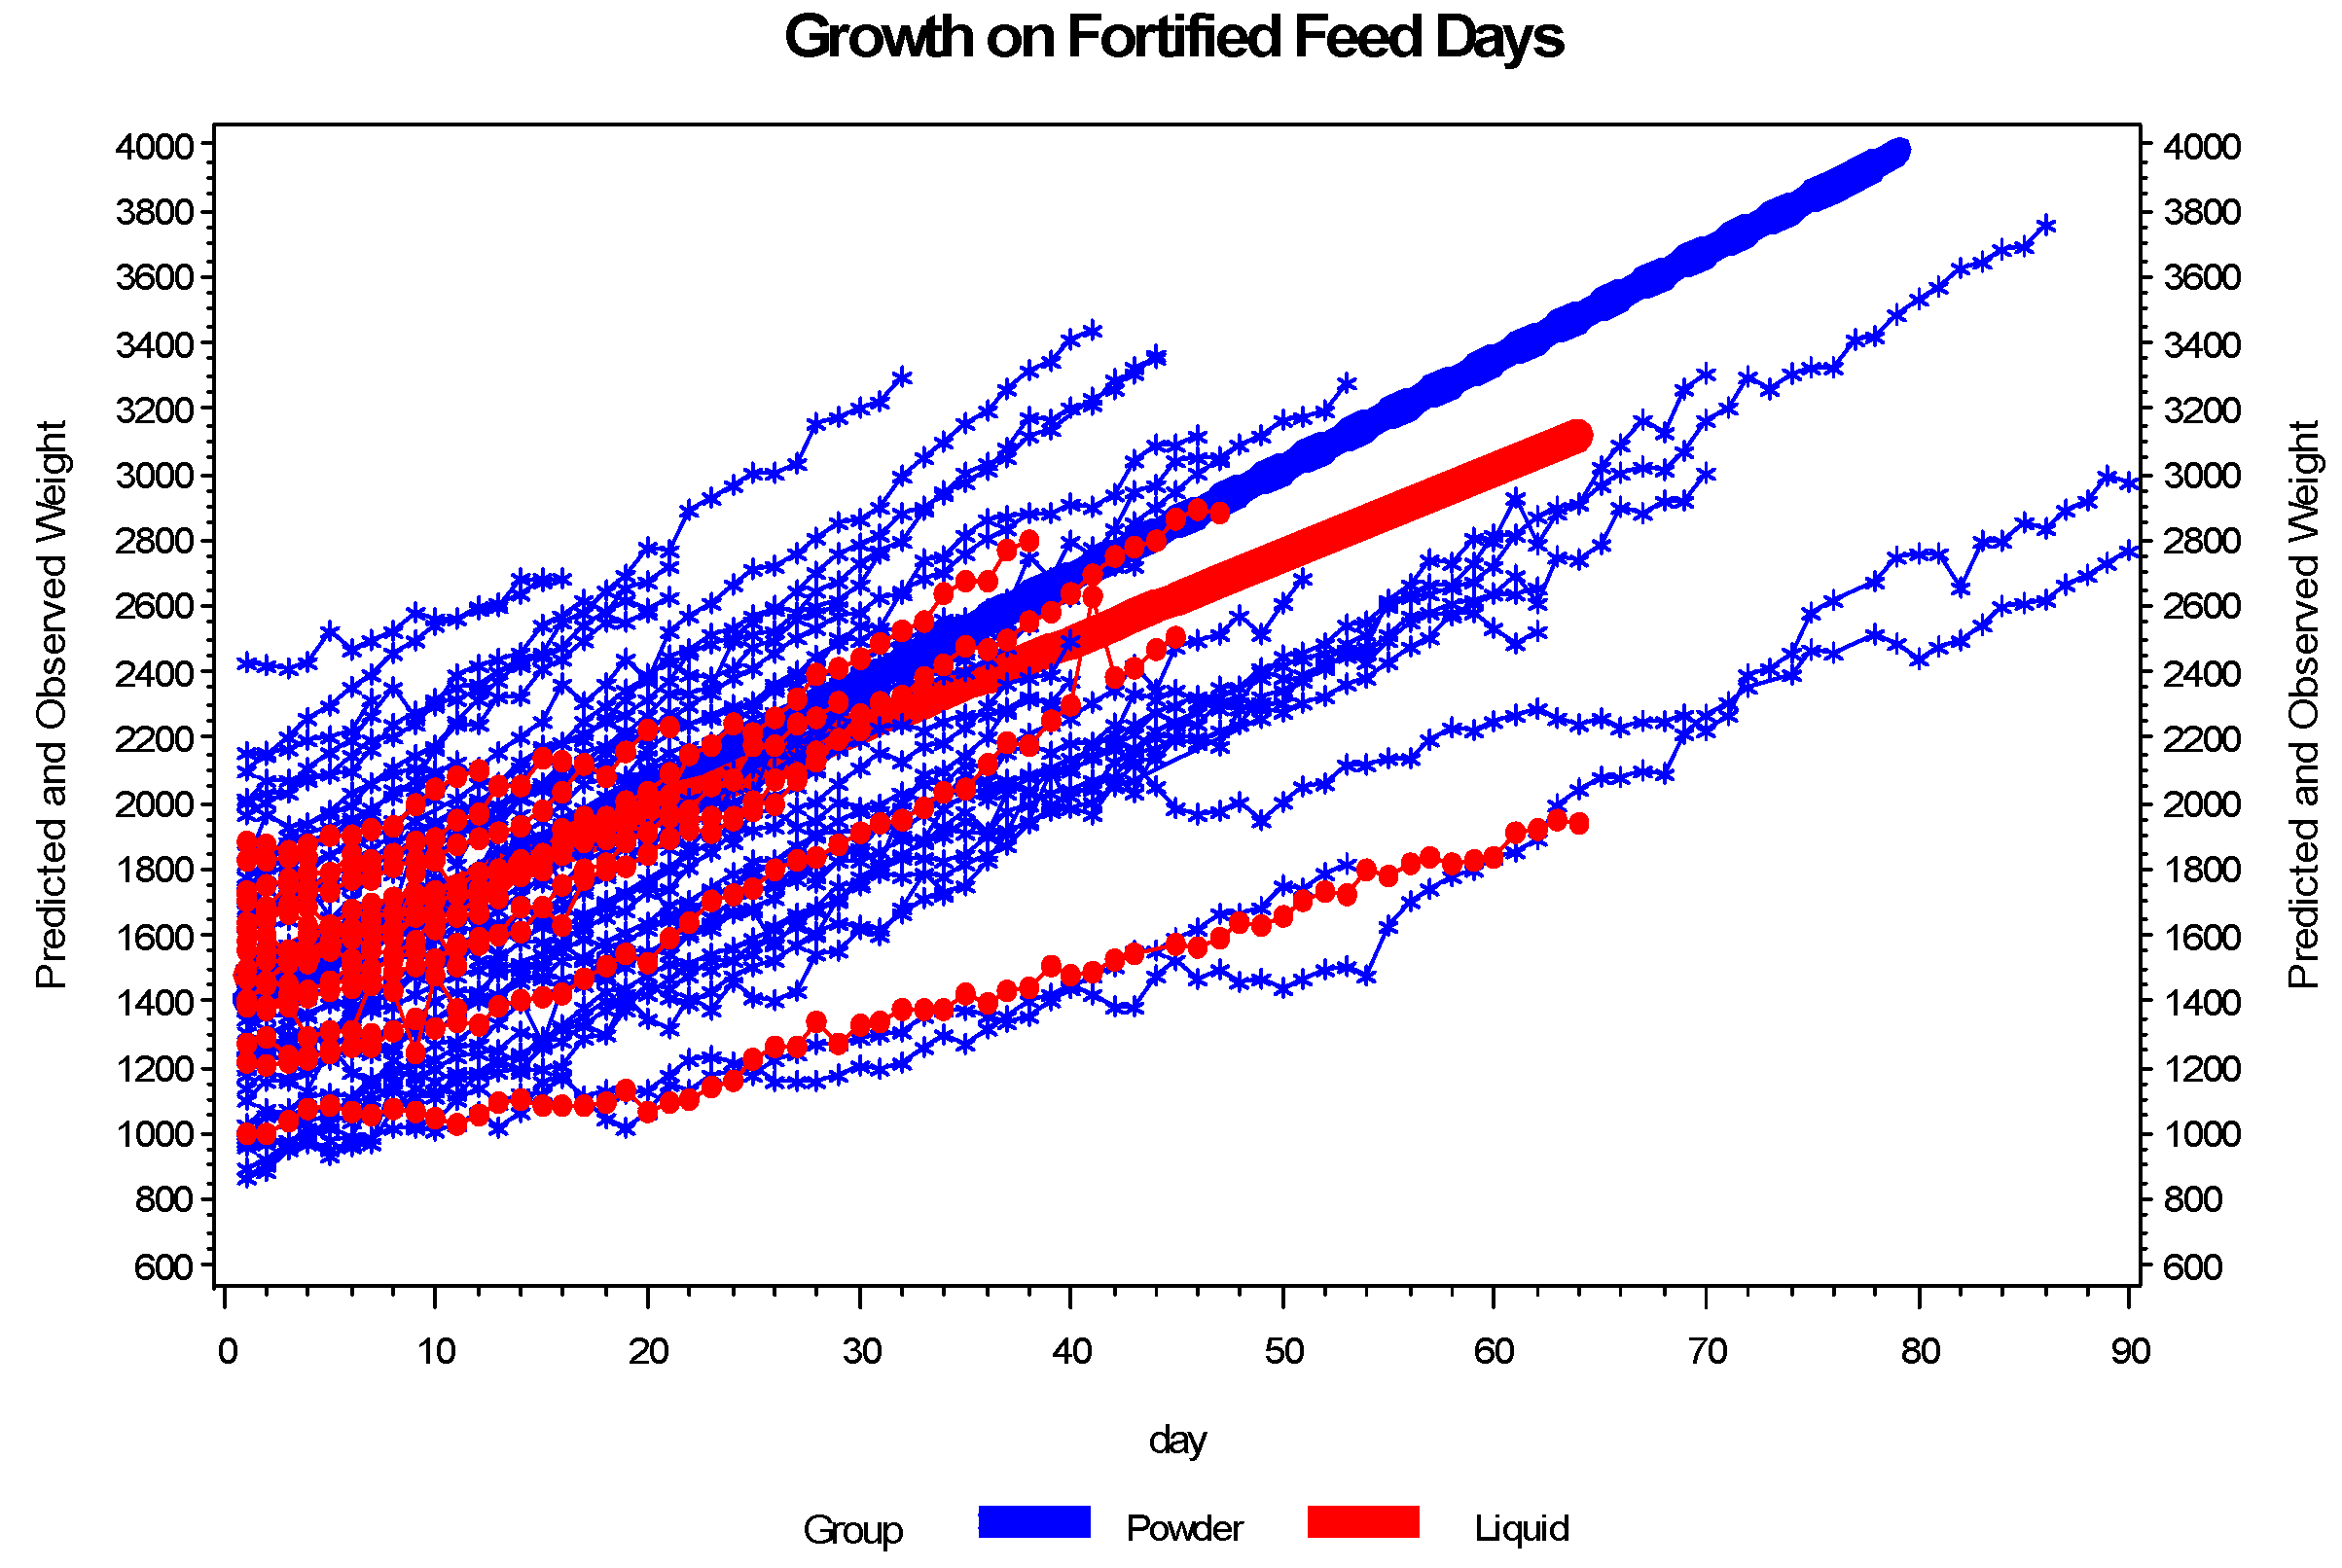
| Growth Velocity (g/kg/day) while on HMF | 46 | 15.37 | 21 | 10.59 | <0.0001 | ||
| Growth (g/day, while on HMF) | 46 | 31.27 | 21 | 23.66 | 0.0001 | ||
| DOL Enteral Feedings Started | 46 | 3.0 | 22 | 1.1 | 0.12 | ||
| Calcium Maximum | 34 | 10.3 | 16 | 10.45 | 0.17 | ||
| BUN Maximum after DOL 14 | 33 | 18 | 16 | 20 | 0.28 | ||
| BUN Maximum after DOL 30 | 23 | 18 | 8 | 16 | 0.91 | ||
| Creatinine Maximum | 46 | 0.92 | 22 | 0.9 | 0.52 | ||
| Variable | PHMF | LHMF | p-Value |
|---|---|---|---|
| n (%) | n (%) | ||
| NEC | 0 (0%) | 3 (13%) | 0.03 |
| ROP | 16 (35%) | 3 (13%) | 0.09 |
| ROP Procedure | 3 (7%) | 2 (9%) | 1.00 |
| IVH (any) | 18 (39%) | 4 (17%) | 0.10 |
| Dexamethasone Treatment | 9 (20%) | 1 (5%) | 0.15 |
| Bicitra Treatment | 0 (0%) | 1 (5%) | 0.31 |
| Death | 0 (0%) | 1 (4%) | 0.33 |
| Diaper Dermatitis | 5 (11%) | 4 (18%) | 0.46 |
| BPD | 9 (20%) | 3 (14%) | 0.74 |
3.1. Safety and Clinical Outcomes


3.2. Enteral Nutrition and Growth

4. Discussion
4.1. Acidosis
4.2. Enteral Nutrition and Growth
4.3. NEC
4.4. Metabolic Acidosis
4.5. Summary
5. Strengths and Limitations
5.1. Strengths
5.2. Limitations
6. Conclusions
Acknowledgments
Conflicts of Interest
References
- American Academy of Pediatrics. Pediatric Nutrition Handbook; American Academy of Pediatrics: Washington, DC, USA, 2009, 6th ed.
- Groh-Wargo, S.; Thompson, M.; Cox, J.H. Nutritional Care for High-Risk Newborns, 3rd ed.; Hartline, J.V., Ed.; Precept Press: Chicago, IL, USA, 2000. [Google Scholar]
- Sullivan, S.; Schanler, R.J.; Kim, J.H.; Patel, A.L.; Trawöger, R.; Kiechl-Kohlendorfer, U.; Chan, G.M.; Blanco, C.L.; Abrams, S.; Cotton, C.M.; et al. An exclusively human milk-based diet is associated with a lower rate of necrotizing enterocolitis than a diet of human milk and bovine milk-based products. J. Pediatr. 2010, 156, 562–567. [Google Scholar] [CrossRef]
- Tsang, R.C. Nutrition of the Premature Infant: Scientific Basis and Practical Guidelines, 2nd ed.; Uauy, R., Koletzko, B., Zlotkin, S.H., Eds.; Digital Education Publishing: Cincinnati, OH, USA, 2005. [Google Scholar]
- Clark, R.H.; Thomas, P.; Peabody, J. Extrauterine growth restriction remains a serious problem in prematurely born neonates. Pediatrics 2003, 111, 986–990. [Google Scholar] [CrossRef]
- Section on Breastfeeding. Breastfeeding and the use of human milk. Pediatrics 2012, 129, e827–e841. [CrossRef]
- Hawthorne, K.M.; Abrams, S.A. Safety and efficacy of human milk fortification for very-low-birthweight infants. Nutr. Rev. 2004, 62, 482–485. [Google Scholar] [CrossRef]
- Valentine, C.J.; Fernandez, S.; Rogers, L.K.; Gulati, P.; Hayes, J.; Lore, P.; Puthoff, T.; Dumm, M.; Jones, A.; Collins, K.; et al. Early amino-acid administration improves premature infant weight. J. Perinatol. 2009, 29, 428–432. [Google Scholar] [CrossRef]
- Stephens, B.E.; Walden, R.V.; Gargus, R.A.; Tucker, R.; Mckinley, L.; Mance, M.; Nye, J.; Vohr, B.R. First-week protein and energy intakes are associated with 18-month developmental outcomes in extremely low birth weight infants. Pediatrics 2009, 123, 1337–1343. [Google Scholar] [CrossRef]
- Maggio, L.; Costa, S.; Gallini, F. Human milk fortifiers in very low birth weight infants. Early Hum. Dev. 2009, 85, S59–S61. [Google Scholar] [CrossRef]
- Kuschel, C.A.; Harding, J.E. Multicomponent fortified human milk for promoting growth in premature infants. Cochrane Database Syst. Rev. 2004, 1, CD000343. [Google Scholar]
- Hanson, C.; Sundermeier, J.; Dugick, L.; Lyden, E.; Anderson-Berry, A.L. Implementation, process, and outcomes of nutrition best practices for infants < 1500g. Nutr. Clin. Pract. 2011, 26, 614–624. [Google Scholar]
- Ehrenkranz, R.A.; Dusick, A.M.; Vohr, B.R.; Wright, L.L.; Wrage, L.A.; Poole, W.K. Growth in the neonatal intensive care unit influences neurodevelopmental and growth outcomes of extremely low birth weight infants. Pediatrics 2006, 117, 1253–1261. [Google Scholar] [CrossRef]
- Himelright, I.; Harris, E.; Lorch, V.; Anderson, M.; Jones, T.; Craig, A.; Kuehnert, M.; Forster, T.; Arduino, M.; Jensen, B.; et al. Enterobacter sakazakii infections associated with the use of powdered infant formula—Tennessee, 2001. MMWR 2002, 51, 297–300. [Google Scholar]
- Berseth, C.L.; Mitmesser, S.H.; Stolz, S.; Harris, F.M.; Sisk, P. Growth and safety of premature infants fed a new liquid human milk fortifier. FASEB J. 2011, 25, 589.3. [Google Scholar]
- Enfamil. Enfamil Human Milk Fortifier Acidified Liquid Website. Available online: http://www.enfamil.com/app/iwp/enf10/content.do?dm=enf&id=/Consumer_Home3/FeedingSolutions/EnfamilHumanMilkFortifier2&iwpst=B2C&ls=0&csred=1&r=3508452874 (accessed on 6 March 2012).
- Similac Human Milk Fortifier Website. Available online: http://abbottnutrition.com/products/similac-human-milk-fortifier (accessed on 6 March 2012).
- Fenton, T.R. A new growth chart for premature babies: Babson and Benda’s chart updated with recent data and a new format. BMC Pediatr. 2003, 3, 13. [Google Scholar] [CrossRef]
- Fenton, T.R.; Sauve, R.S. Using the LMS method to calculate z-scores for the Fenton premature infant growth chart. Eur. J. Clin. Nutr. 2007, 61, 1380–1385. [Google Scholar] [CrossRef]
- Patel, A.; Engstrom, J.; Meier, P.; Kimura, R. Accuracy of methods for calculating postnatal growth velocity for extremely low birth weight infants. Pediatrics 2005, 116, 1466–1473. [Google Scholar] [CrossRef]
- Kalhoff, H.; Manz, F.; Kiwull, P.; Kiwull-Schone, H. Food composition and acid-base balance: Alimentary acid load and clinical implications in neonates. Open Nutr. J. 2008, 2, 5–8. [Google Scholar] [CrossRef]
- Manz, F.; Kalhoff, H.; Remer, T. Renal acid excretion in early infancy. Pediatr. Nephrol. 1997, 11, 231–243. [Google Scholar] [CrossRef]
- Erickson, T.; Gill, G.; Chan, G.M. The effects of acidification on human milk’s cellular and nutritional content. J. Perinatol. 2013, 33, 371–373. [Google Scholar]
- Moya, F.; Sisk, P.M.; Walsh, K.R.; Berseth, C.L. A new liquid human milk fortifier and linear growth in preterm infants. Pediatrics 2012, 130, 928–935. [Google Scholar] [CrossRef]
- Cibulskis, C.C.; Bowles, M. Metabolic Acidosis Associated with Liquid Acidified Human Milk Fortifier. In Proceedings of the AAP Section on Perinatal Pediatrics Scientific and Educational Program Abstract and Poster Presentations, Orlando, FL, USA, 25–29 October 2013.
- Caso, G.; Garlick, B.A.; Casella, G.A.; Sasvary, D.; Garlick, P.J. Acute metabolic acidosis inhibits muscle protein synthesis in rats. Am. J. Physiol. Endocrinol. Metab. 2004, 287, E90–E96. [Google Scholar] [CrossRef]
- Reaich, D.; Channon, S.M.; Scrimgeour, C.M.; Goodship, T.H.J. Ammonium chloride-induced acidosis increases protein breakdown and amino acid oxidation in humans. Am. J. Physiol. 1992, 263, E735–E739. [Google Scholar]
- Kalhoff, H.; Manz, F. Nutrition, acid-base status and growth in early childhood. Eur. J. Nutr. 2001, 40, 221–230. [Google Scholar] [CrossRef]
- Kalhoff, H.; Manz, F.; Diekmann, L.; Kunz, C.; Stock, G.J.; Weisser, F. Decreased growth rate of low-birth-weight infants with prolonged maximum renal acid stimulation. Acta Paediatr. 1993, 82, 522–527. [Google Scholar] [CrossRef]
- Kalhoff, H.; Rascher, W.; Diekmann, L.; Stock, G.J.; Manz, F. Urinary excretion of aldosterone, arginine vasopressin and cortisol in premature infants with maximum renal acid stimulation. Acta Paediatr. 1995, 84, 490–494. [Google Scholar] [CrossRef]
- Kalhoff, H.; Diekmann, L.; Rudloff, S.; Manz, F. Renal excretion of calcium and phosphorus in premature infants with incipient late metabolic acidosis. J. Pediatr. Gastroenterol. Nutr. 2001, 33, 565–569. [Google Scholar] [CrossRef]
- Rochow, N.; Jochum, F.; Redlich, A.; Korinekova, Z.; Linnemann, K.; Weitmann, K.; Boehm, G.; Müler, H.; Kalhoff, H.; Topp, H.; et al. Fortification of breast milk in VLBW infants: Metabolic acidosis is linked to the composition of fortifiers and alters weight gain and bone mineralization. Clin. Nutr. 2011, 30, 99–105. [Google Scholar] [CrossRef]
© 2014 by MDPI, Basel, Switzerland This article is an open access article distributed under the terms and conditions of the Creative Commons Attribution license (http://creativecommons.org/licenses/by/3.0/).
Share and Cite
Thoene, M.; Hanson, C.; Lyden, E.; Dugick, L.; Ruybal, L.; Anderson-Berry, A. Comparison of the Effect of Two Human Milk Fortifiers on Clinical Outcomes in Premature Infants. Nutrients 2014, 6, 261-275. https://doi.org/10.3390/nu6010261
Thoene M, Hanson C, Lyden E, Dugick L, Ruybal L, Anderson-Berry A. Comparison of the Effect of Two Human Milk Fortifiers on Clinical Outcomes in Premature Infants. Nutrients. 2014; 6(1):261-275. https://doi.org/10.3390/nu6010261
Chicago/Turabian StyleThoene, Melissa, Corrine Hanson, Elizabeth Lyden, Laura Dugick, Leslie Ruybal, and Ann Anderson-Berry. 2014. "Comparison of the Effect of Two Human Milk Fortifiers on Clinical Outcomes in Premature Infants" Nutrients 6, no. 1: 261-275. https://doi.org/10.3390/nu6010261
APA StyleThoene, M., Hanson, C., Lyden, E., Dugick, L., Ruybal, L., & Anderson-Berry, A. (2014). Comparison of the Effect of Two Human Milk Fortifiers on Clinical Outcomes in Premature Infants. Nutrients, 6(1), 261-275. https://doi.org/10.3390/nu6010261