Article

Modulation of Saliva Microbiota through Prebiotic Intervention in HIV-Infected Individuals

by
Nuria Jiménez-Hernández
1,2,
Sergio Serrano-Villar
3,
Alba Domingo
1,
Xavier Pons
1,
Alejandro Artacho
1,
Vicente Estrada
4,
Andrés Moya
1,2,5 and
María José Gosalbes
1,2,*
1
Área de Genómica y Salud, Fundación para el Fomento de la Investigación Sanitaria y Biomédica de la Comunitat Valenciana (FISABIO), 46020 Valencia, Spain
2
CIBER en Epidemiología y Salud Pública, 28029 Madrid, Spain
3
Departamento de Enfermedades Infecciosas, Hospital Universitario Ramón y Cajal, 28034 Madrid, Spain
4
Unidad de Enfermedades Infecciosas/Medicina Interna, Hospital Clínico San Carlos-IdiSSC, Universidad Complutense, 28040 Madrid, Spain
5
Instituto de Biología Integrativa de Sistemas, Universidad de Valencia y CSIC, 46980 Paterna, Valencia, Spain
*
Author to whom correspondence should be addressed.
Nutrients 2019, 11(6), 1346; https://doi.org/10.3390/nu11061346
Submission received: 9 May 2019 / Revised: 7 June 2019 / Accepted: 12 June 2019 / Published: 14 June 2019

Abstract

:
Human immunodeficiency virus (HIV) infection is characterized by an early depletion of the mucosal associated T helper (CD4+) cells that impair the host immunity and impact the oral and gut microbiomes. Although, the HIV-associated gut microbiota was studied in depth, few works addressed the dysbiosis of oral microbiota in HIV infection and, to our knowledge, no studies on intervention with prebiotics were performed. We studied the effect of a six-week-long prebiotic administration on the salivary microbiota in HIV patients and healthy subjects. Also, the co-occurrence of saliva microorganisms in the fecal bacteria community was explored. We assessed salivary and feces microbiota composition using deep 16S ribosomal RNA (rRNA) gene sequencing with Illumina methodology. At baseline, the different groups shared the same most abundant genera, but the HIV status had an impact on the saliva microbiota composition and diversity parameters. After the intervention with prebiotics, we found a drastic decrease in alpha diversity parameters, as well as a change of beta diversity, without a clear directionality toward a healthy microbiota. Interestingly, we found a differential response to the prebiotics, depending on the initial microbiota. On the basis of 100% identity clustering, we detected saliva sequences in the feces datasets, suggesting a drag of microorganisms from the upper to the lower gastrointestinal tract.

1. Introduction

The oral microbiome was established along evolution-specific symbiotic interactions with the host, such that the microbiota of the oral cavity plays an important role in pathogen colonization resistance and local immune system modulation, as well as in the entero-salivary nitrate reduction cycle [1]. In the last few years, due to a decrease in the effectiveness of conventional antimicrobial therapy, new strategies such as the application of probiotics or prebiotics were investigated to prevent different oral diseases [2,3,4,5,6,7]. However, different studies suggested that probiotic strains, widely used to provide health benefits in the gut, are not as efficient in the care of oral health [3,4]. Recently, oral Streptococcus strains, isolated from caries-free cavities, were proposed as effective probiotics in caries prevention due to their inhibitory action of the major oral pathogens and their buffering of acidic pH [5,7]. However, the use of prebiotics in oral health is in its infancy. Recently, Slomka et al. [8,9] evaluated different potential oral prebiotics and two compounds (beta-methyl-d-galactoside and N-acetyl-d-mannosamine) were identified as substrates with a stimulatory effect on beneficial oral bacteria growth and the subsequent suppression of pathogens. In caries management, compounds such as urea or arginine are considered to be prebiotics since their metabolism by oral bacteria produces alkali that increase the pH, inhibiting acidogenic and aciduric pathogens. Other studies indicated that dietary nitrate increases the abundance of Neisseria and Rothia species associated with oral health [10]. Changes in acid–alkali balance lead to an oral dysbiotic microbiota. High pH is associated with a high abundance of proteolytic bacteria, promoting gingival or periodontal inflammation. On the other hand, an acidic environment correlates with a saccharolytic microbiota, resulting in caries. Thus, nutritional strategies should be individually tailored to obtain higher benefits.
The explosion of the microbiome field shook our understanding of the pathogenesis of HIV, in which the participation of bacteria in the course of the disease was far from suspected. There is emerging consensus, however, that disturbances in the gut microbial ecology during HIV infection correlate with chronic immune defects and inflammation [11]. Some studies assessing dietary supplementation with different products, including prebiotics [12,13,14], probiotics [15], bovine colostrum [16], or a combination of different ingredients [17], collectively suggested that these strategies may exert some systemic beneficial immunological effects introducing changes in the HIV-associated gut microbiome. Studies on HIV-associated oral microbiota [18,19,20,21,22] relying on culture-dependent and -independent techniques, indicated an effect of both HIV infection and antiretroviral treatment on the bacterial community composition. However, the scope of HIV-associated dysbiosis in the oral cavity, the associations with systemic predictors of clinical progression, and the interplay between oral and gut microbiome remain poorly defined. Moreover, no studies were done on the role of prebiotic application aimed at manipulating the HIV-associated oral microbiome.
In a previous work [14], we studied the effect of a mixture of prebiotics (short-chain galacto-oligosaccharides, long-chain fructo-oligosaccharides, and glutamine) on the HIV-associated gut microbiota. During this nutritional intervention, we collected fecal and salivary samples from HIV-infected patients. Thus, in the present study, we characterized, for the first time, the compositional changes associated with prebiotic intervention on salivary microbiota in HIV-infected individuals. Furthermore, we studied the interplay between oral and gut microbiota determining the bacterial co-occurrences in both habitats.

2. Material and Methods

2.1. Subjects and Sample Collection

We conducted the study with participants belonging to a previously described cohort [14]. Briefly, we recruited 95 individuals from two University hospitals in Madrid, Spain (University Hospital Clínico San Carlos and University Hospital Ramón y Cajal) with 35 of them being ineligible (Figure S1, Supplementary Materials). Exclusion criteria were the concomitant use of medications, the use of systemic antibiotics, probiotics, or prebiotics during the previous three months, and any acute or chronic condition other than chronic HIV infection, including gastrointestinal symptoms or co-infections with hepatitis B or C viruses. The inclusion criteria were serologically documented HIV infection, age 18 years or older, and, for antiretroviral therapy (ART)-treated patients, at least two years under ART-mediated HIV RNA suppression. The controls were healthy non-HIV-infected volunteers. From the 60 individuals included in the cohort, we obtained salivary samples for 53 individuals at baseline that were grouped in viremic ART-untreated (VU, n = 12), immunological ART responders (IR, n = 18), immunological ART non-responders (INR, n = 9), and HIV-uninfected individuals as controls (n = 14) (Table 1). A total of 32 individuals completed the six-week prebiotic intervention. The prebiotics (20 g) consisted of a mixture of short-chain galacto-oligosaccharides (5 g), long-chain fructo-oligosaccharides (10 g), and glutamine (5 g), which is an energy source for enterocytes. The prebiotics supplier was Nutricia (Nutricia, S.R.L., Dirección Ctra. de Andalucía, Km. 25.6, 28340, Madrid). The study individuals completed a dietary survey and no differences were detected among the groups in dietary habits [14]. The safety of the intervention was evaluated in the previous work [14]. Clinical parameters, such as plasma metabolic profile, T-cell markers, thymic function, endothelial function, bacterial translocation, inflammation, and thrombosis, were measured in previous work [14].
Unstimulated salivary samples (approximately 2 mL) were collected in sterile tubes at midday (after 5 h of personal oral hygiene) during the visit of the patients to the HIV unit in the hospitals at baseline and after six weeks. The salivary samples were kept at −80 °C until use. Collection of fecal samples was described in Reference [14].
All subjects gave their informed consent for inclusion before they participated in the study. The study was conducted in accordance with the Declaration of Helsinki, and the protocol was approved by the Ethics Committee of the Public Health Department and the Center for Public Health Research (DGSP-CSISP), Valencia, Spain and by the Ethics Committees of both recruiting institutions (University Hospital Clínico San Carlos, [email protected] and University Hospital Ramón y Cajal, [email protected]) (approval number 11/284).

2.2. Bacterial DNA Extraction and Sequencing

Total DNA was extracted in the robotic workstation MagNA Pure LC Instrument (Roche) using the MagNA Pure LC DNA isolation kit III (Bacteria, Fungi) (Roche). Previously, salivary samples (300 μL of saliva) were centrifuged at maximum speed at 4 °C for 5 min to pellet the cells. Bacterial pellets were resuspended in lysis buffer (MagNA Pure LC DNA isolation kit III) and treated for one hour at 37 °C with an enzymatic cocktail (lysozyme 25 mg/mL, lysostaphin 1.25 mg/mL, mutanolysin 625 U/mL). Then, the samples were treated for 15 min at 65 °C with proteinase K according to the instructions of MagNA Pure LC DNA isolation kit III. Total DNA was quantified with a Qubit Fluorometer (ThermoFisher) and its integrity was verified by standard agarose gel electrophoresis.
We amplified the V3–V4 region of the 16S rRNA gene from total DNA obtained from salivary and fecal samples. The amplicon libraries were constructed following Illumina instructions. The libraries were quantified with a Qubit Fluorometer (ThermoFisher) and sequenced using the Kit v3 (2 × 230 cycles) in a MiSeq platform (Illumina) at FISABIO-Salud Pública. All the sequences were deposited in the European Bioinformatics Institute (EBI) database under the number PRJEB25569.

2.3. Analysis of 16S rRNA Gene Amplicons

A quality assessment of the raw reads was performed using the prinseq-lite program [23] applying the following parameters: min_length: 50, trim_qual_right: 30, trim_qual_type: mean, and trim_qual_window: 20. R1 and R2 reads from Illumina sequencing were joined using the FLASH program applying default parameters [24]. The 16S rDNA sequences were processed using the QIIME pipeline (v2-2017.12). Operational taxonomic units (OTUs) were obtained at 97% sequence similarity by clustering with the USEARCH software in the QIIME pipeline. Taxonomic information of the 16S rDNA sequences was obtained using the Ribosomal Database Project (RDP) naïve Bayesian classifier algorithm with the GreenGenes database (version gg_13_5) in the QIIME pipeline. The annotation was accepted when the bootstrap confidence estimation value was over 0.8, and the assignation was stopped at the last well-identified phylogenetic level. To obtain weighted and unweighted UniFrac distance matrices, we firstly generated a phylogenetic tree and then applied the core-metrics-phylogenetic method using the QIIME pipeline.

2.4. Quantitative PCR

To quantify the bacterial load in salivary samples, we performed real-time PCR using LightCycler 480 instrument (Roche) and SYBR Premix ExTaq (Tli RNaseH Plus) (Takara Bio Europe). Amplification reactions were performed in 20 μL final volume with 1 μL of total DNA purified from salivary samples as a template and using the universal bacterial primers 16S-U515F and 16S-U789R. All the reactions were made in duplicate. The bacterial load was calculated by comparison with the crossing point (cp) values obtained from a standard curve. The standard curve was prepared using serial dilutions of DNA extracted from a bacterial suspension that contained 10 million cells. The bacteria were quantified and sorted by flow cytometry as described previously [25]. The results were expressed as number of cells per mL of saliva.

2.5. Statistical Analysis

The alpha diversity was determined at the OTU level using the vegan library (function reny and diversity) from the R package version 3.2.0 [26] that gives, as default, observed OTUs, Shannon diversity index, Simpson index of diversity (1-D), Chao1 richness estimator, and an Abundance-based Coverage Estimator (ACE). To analyze beta diversity, we applied principal coordinate analysis (PCoA) based on weighted and unweighted UniFrac distances. Box plots, sample clustering, canonical correspondence analysis (CCA), and heatmaps were generated with in-house R scripts. To statistically assess the effect of the environmental factors on the bacterial composition, a multivariate analysis of variance based on dissimilarity test (ADONIS) was applied using the vegan library from the R package (adonis function). To evaluate differences between groups in continuous variables, we used the Kruskal–Wallis test. The pairwise comparisons of continuous variables were analyzed using the Wilcoxon rank-sum test. The alpha values for both tests were set to 0.05.
To correlate species abundances to the clinical features for HIV-infected individuals, we performed a generalized linear model (GLM) by setting the clinical variables as the response variable and the species matrix as the predictors using the cv. glmnet function in the “glmnet” R package. The results were validated using the Spearman correlation index.
The linear discriminant analysis (LDA) effect size (LEfSe) algorithm was applied to identify biomarkers of the microbiota composition from the different groups [27]. Default parameters were used for significance (p-value <0.05) and linear discriminant analysis threshold (>2.0).
To control for the false discovery rate, we corrected the statistical tests adjusting all p-values using the Benjamini–Hochberg correction (library “stats”, function “p.adjust”) (q-value).
To determine if the sample size of the groups before and after prebiotics offered sufficient statistical power to detect differences through a bilateral Student’s t-test with a significance of 5%, we applied the function “pwr.t2n.test” (two-sample t-tests with unequal sample sizes) from the pwr R package. We verified that the estimated average sample size needed to achieve 90% and 85% power was similar to the real sample size that we had for the groups before and after prebiotic intervention, respectively (Tables S2–S5, Supplementary Materials).

2.6. Co-Occurrence of Bacterial Taxa in Salivary and Gut Microbiota

We performed a cluster analysis at 100% similarity to search for identical 16S rRNA sequences in paired samples of saliva (S)/feces (F). For each OTU, we counted how many read-pairs (S–F) from the same individual were contained in that OTU. In order to quantify to what extent the co-occurrence events were biologically driven or, on the contrary, simply random, we estimated for each OTU the following log-likelihood ratio, log2(Prob(S,F)/(Prob(F) × Prob(S)), which was based on the Bayes formula. Thus, the OTUs presenting such a log-likelihood ratio above zero would represent a biological phenomenon. However, to be conservative, we considered the OTUs with a log-likelihood ratio (log2(Prob(S,F)/Prob(F) × Prob(S))) higher than 0.5 as biological events.

3. Results

3.1. General Features of the Patients and Samples

A total of 32 participants completed the six-week-long prebiotic intervention: 7 controls, 6 INR, 10 IR, and 9 VU (Figure S1, Supplementary Materials). Thus, we analyzed 85 salivary samples corresponding to 53 salivary samples at baseline (F1 samples) and 32 salivary samples collected after the prebiotic intervention (F2 samples). We also analyzed the stools from 52 subjects at baseline and from 35 individuals after prebiotics (Table 1).
We determined at baseline the differences between the four groups (IR, INR, VU, and HIV−) in plasma metabolic profile, T-cell markers, thymic function, endothelial function, bacterial translocation, inflammation, and thrombosis (Table 2). We found significant differences between healthy controls and HIV-infected groups (INR, IR, VU) in T-cell markers (T helper CD4+ cells/μL and CD8+ cells/μL) and thymic function measured as signal joint/beta T-cell receptor excision circles (sj/β-TREC) ratio (Table 2).
We also determined the clinical variables after prebiotics (Table 2). We observed a decrease in both bacterial translocation markers and in T-cell activation markers for the four groups.

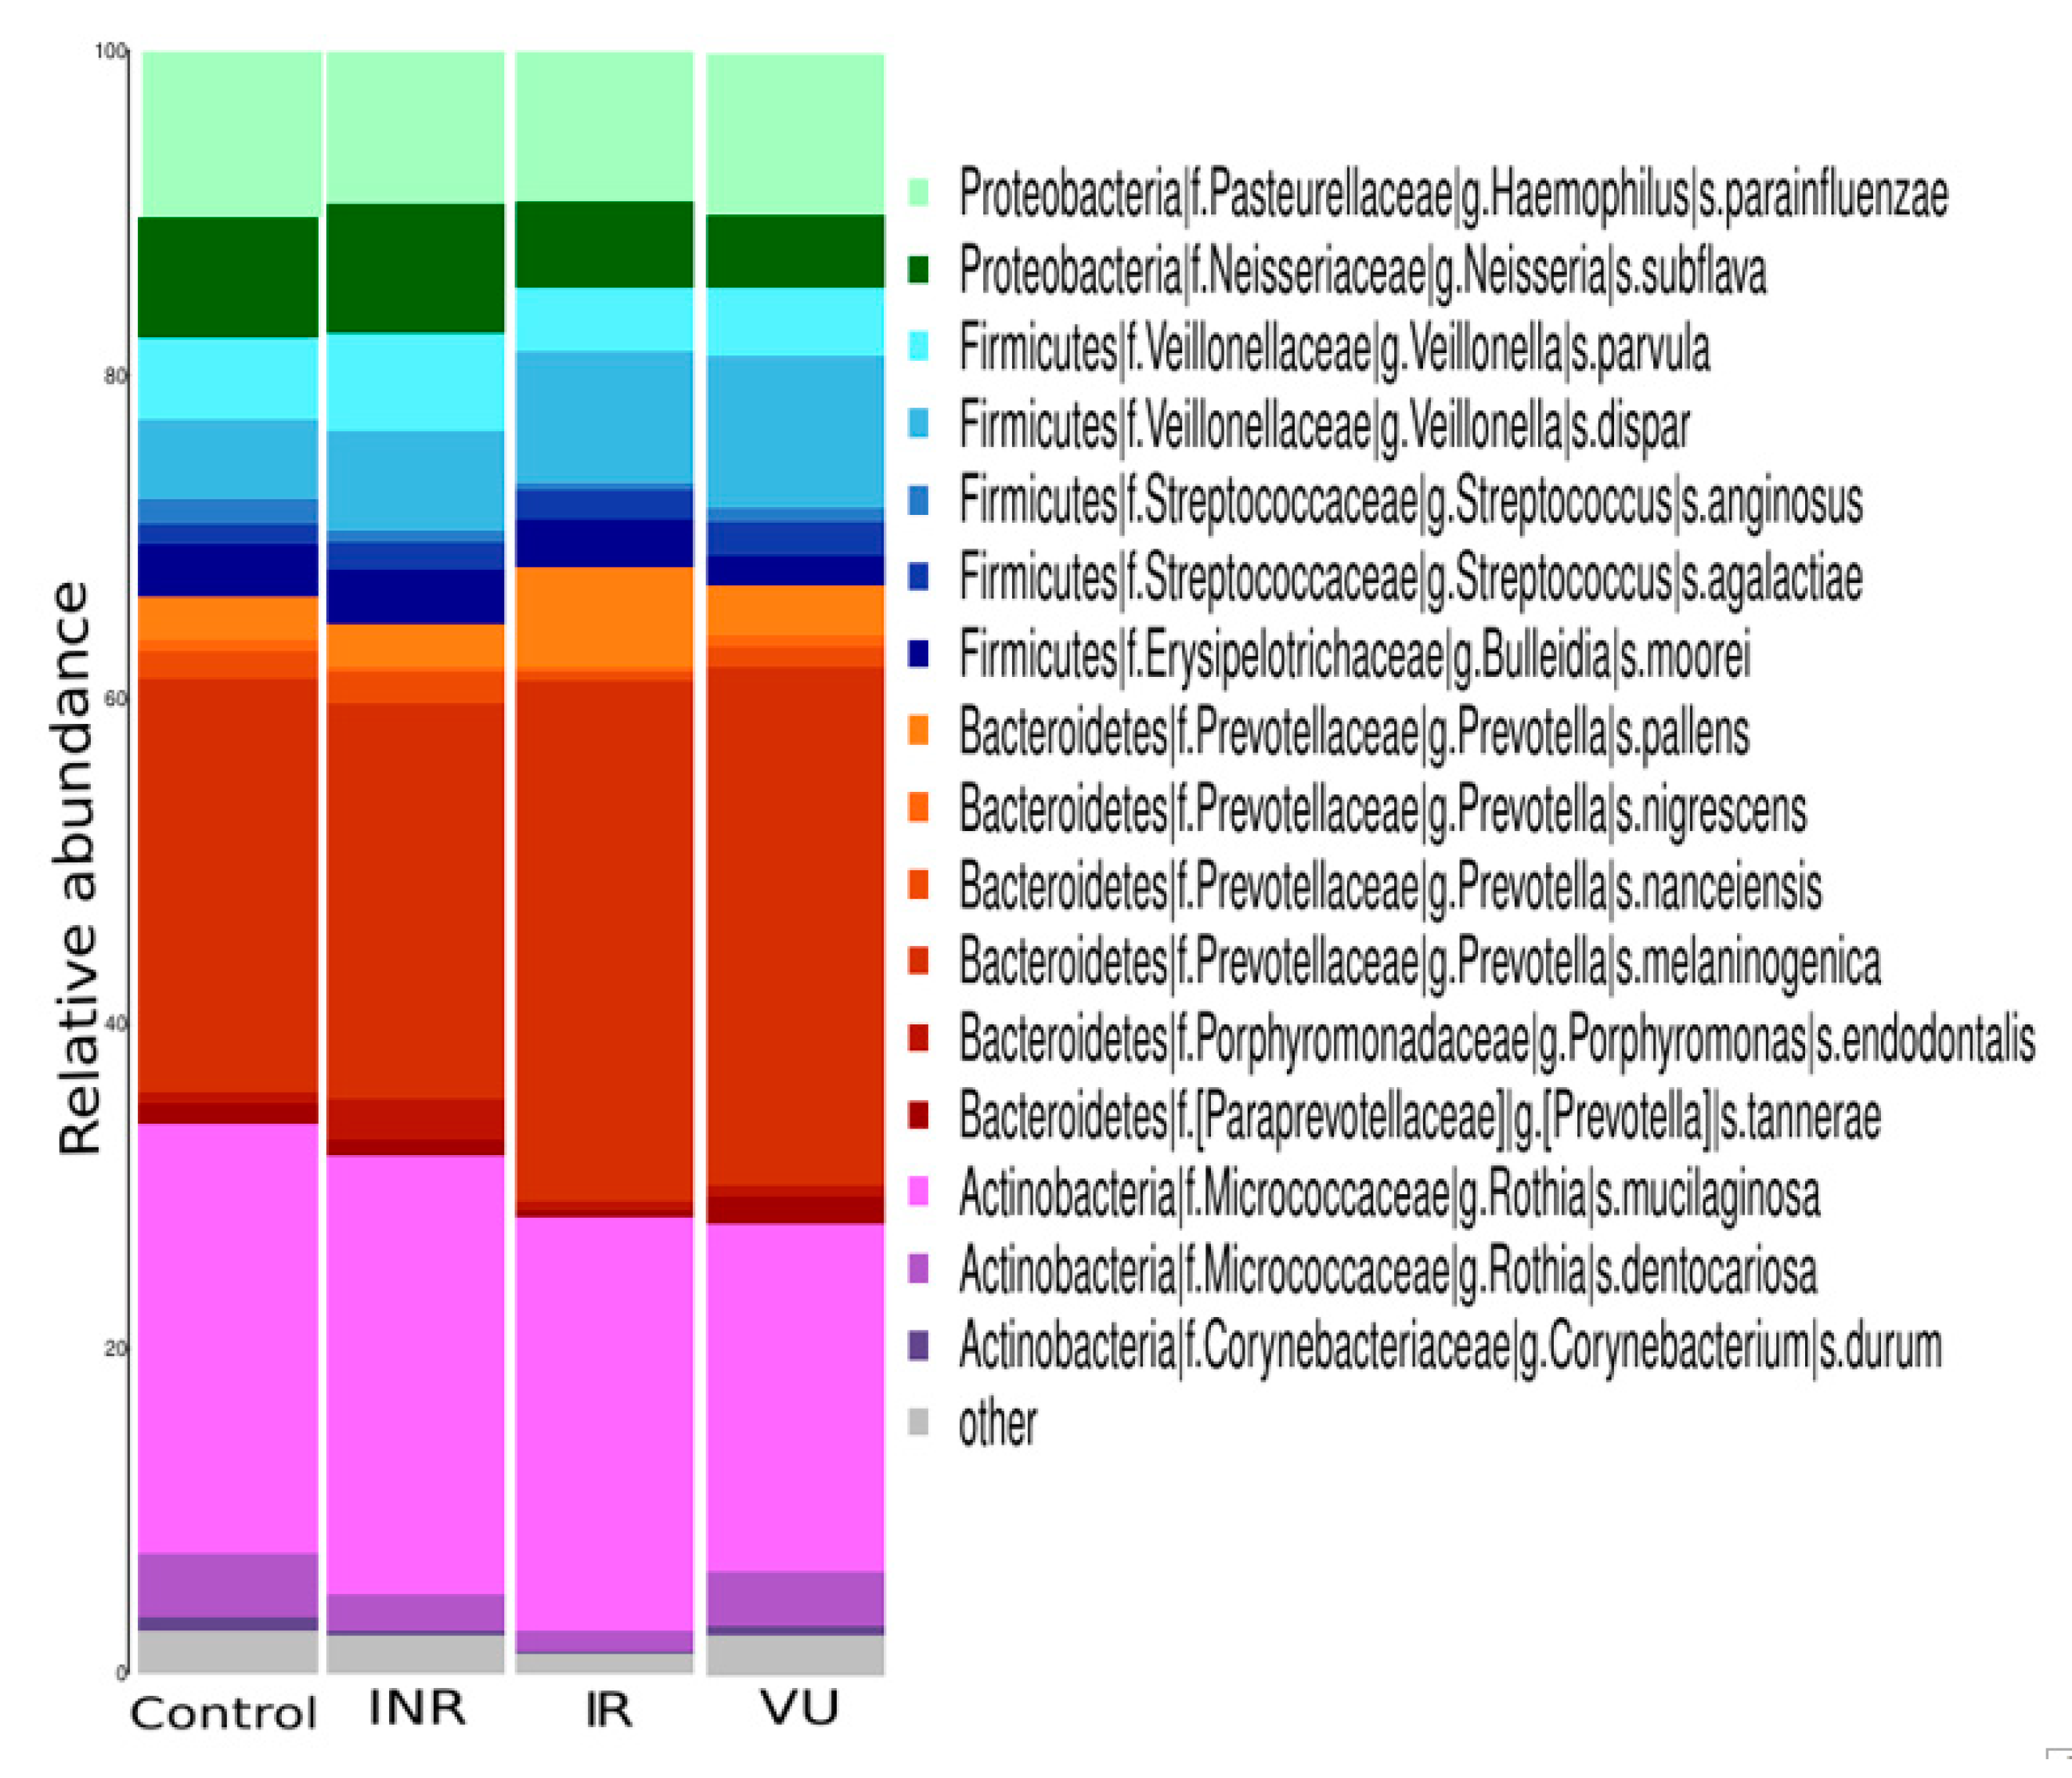
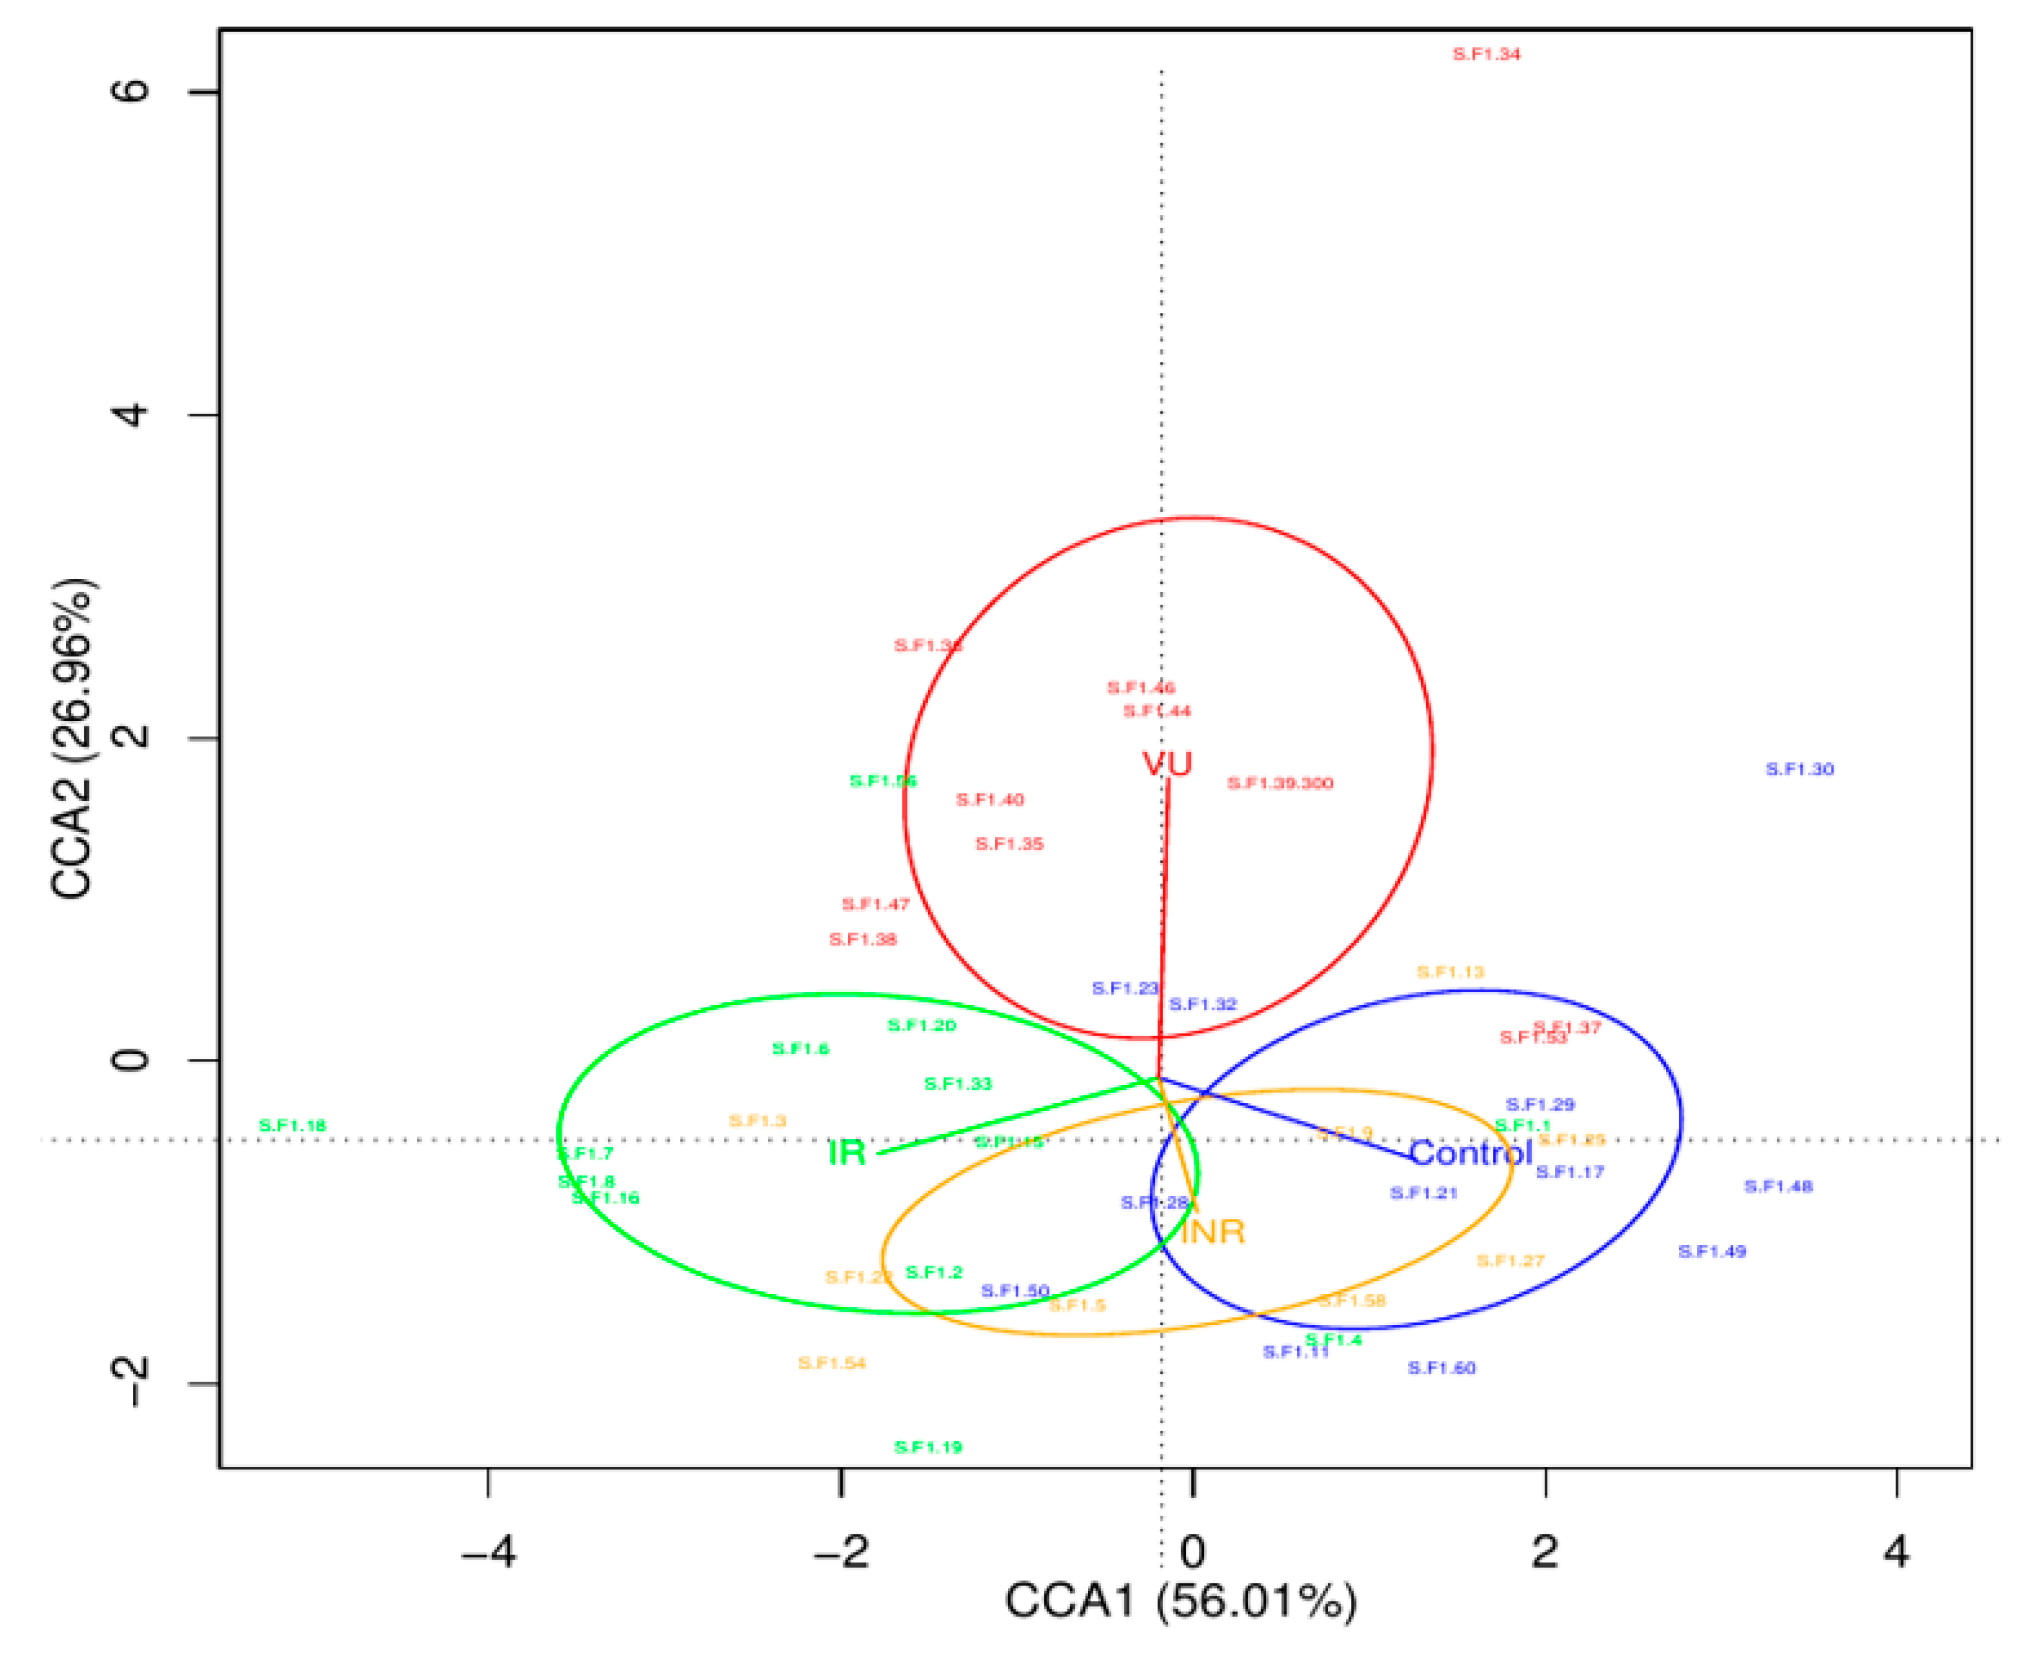
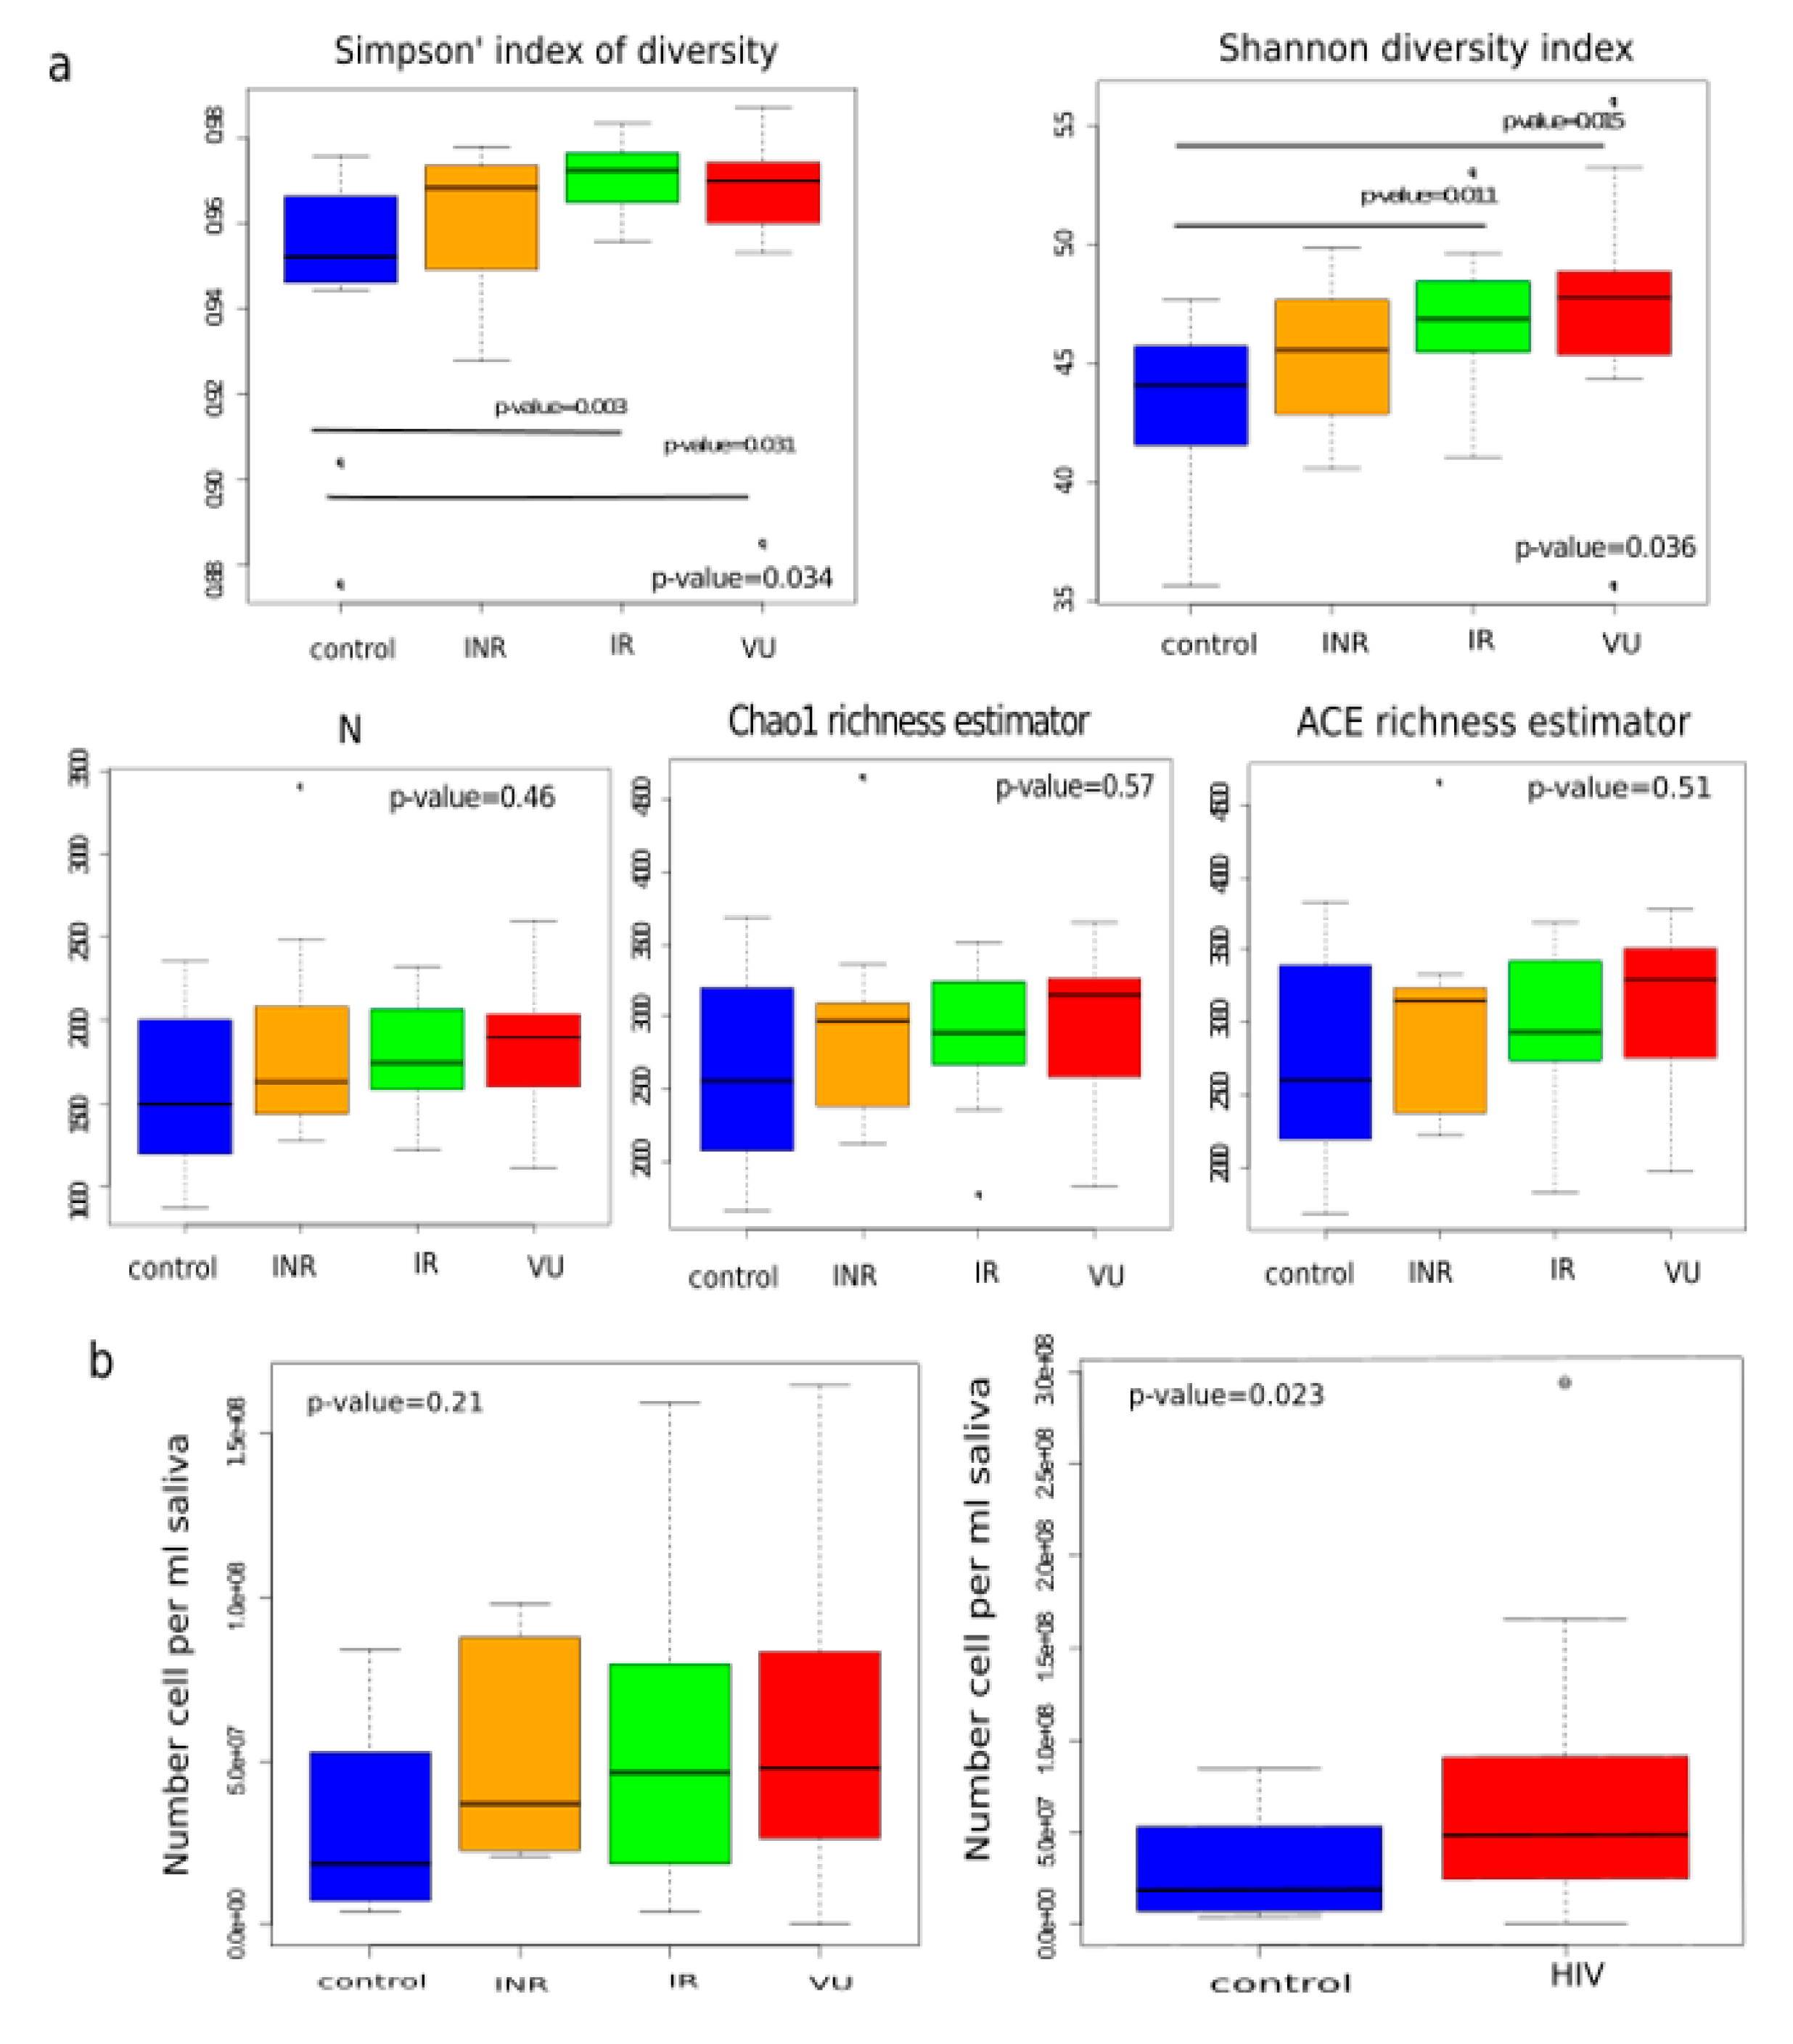
3.2. Salivary Microbiota Analysis in HIV-Infected Individuals

To characterize the salivary microbiota composition at baseline, we sequenced 53 samples obtaining 1,878,045 high-quality 16S rRNA sequences with an average of 42,682 sequences per sample.
The taxonomic analysis (Figure 1) revealed that the most abundant bacteria were similar in all the groups: Corynebacterium (C. durum) and Rothia (R. mucilaginosa and R. dentocariosa) from the Actinobacteria phylum, Porphyromonas (P. endodontalis) and Prevotella (P. pallens, P. nigrescens, P. nanceiensis, P. melaninogenica, and P. tannerae) from the Bacteroidetes, Bulleidia (B. moorei), Streptococcus (S. anginosus and S. agalactiae), and Veillonella (V. parvula and V. dispar) from the Firmicutes, and Neisseria (N. subflava) and Haemophilus (H. parainfluenzae) from the Proteobacteria.
We applied the ADONIS test to evaluate whether the HIV status is a factor that influences the microbiota structure. This test validated (p-value = 0.04) the compositional differences observed at the OTU level in the CCA analysis (Figure 2). This ordination technique showed that the first axis, explaining 56.01% of variability, separated the IR and control groups from the rest, while the second axis, explaining 26.96% of variability, split the VU group from the other three groups. To identify the OTUs that explained the differences between the four groups, we used LEfSe analysis. We found that the VU group presented as biomarkers Streptococcus agalactiae and V. parvula, while IR had different species of Streptococcus. OTUs belonging to Actinobacteria were characteristic for INR and control groups (Figure S2a, Supplementary Materials). We also applied LefSe analysis between HIV+ and HIV− groups (Figure S2b, Supplementary Materials). We found that the HIV-associated salivary microbiota presented a significantly higher abundance of potential pathogens as S. agalactiae (p-value = 0.0091), Corynebacterium durum (p-value = 0.013), and OTUs assigned to species of Prevotella (p-value = 0.046), Leptotrichia (p-value = 0.048), Tannerella (p-value = 0.004), and Catonella (p-value = 0.028).
When we analyzed the diversity (Simpson’s index of diversity and Shannon index) and richness (Chao1 and ACE estimator) of the salivary microbiota in each group at the OTU level, we observed that the VU group presented the highest value for these two parameters, followed by the IR group (Figure 3a). Moreover, both groups were significantly more diverse than the control group. Additionally, the bacterial load in salivary samples from HIV-infected patients was higher than in HIV− samples (Figure 3b). The impaired immunological system of VU individuals could explain the higher number of bacterial cells per mL of saliva and the higher diversity parameters.

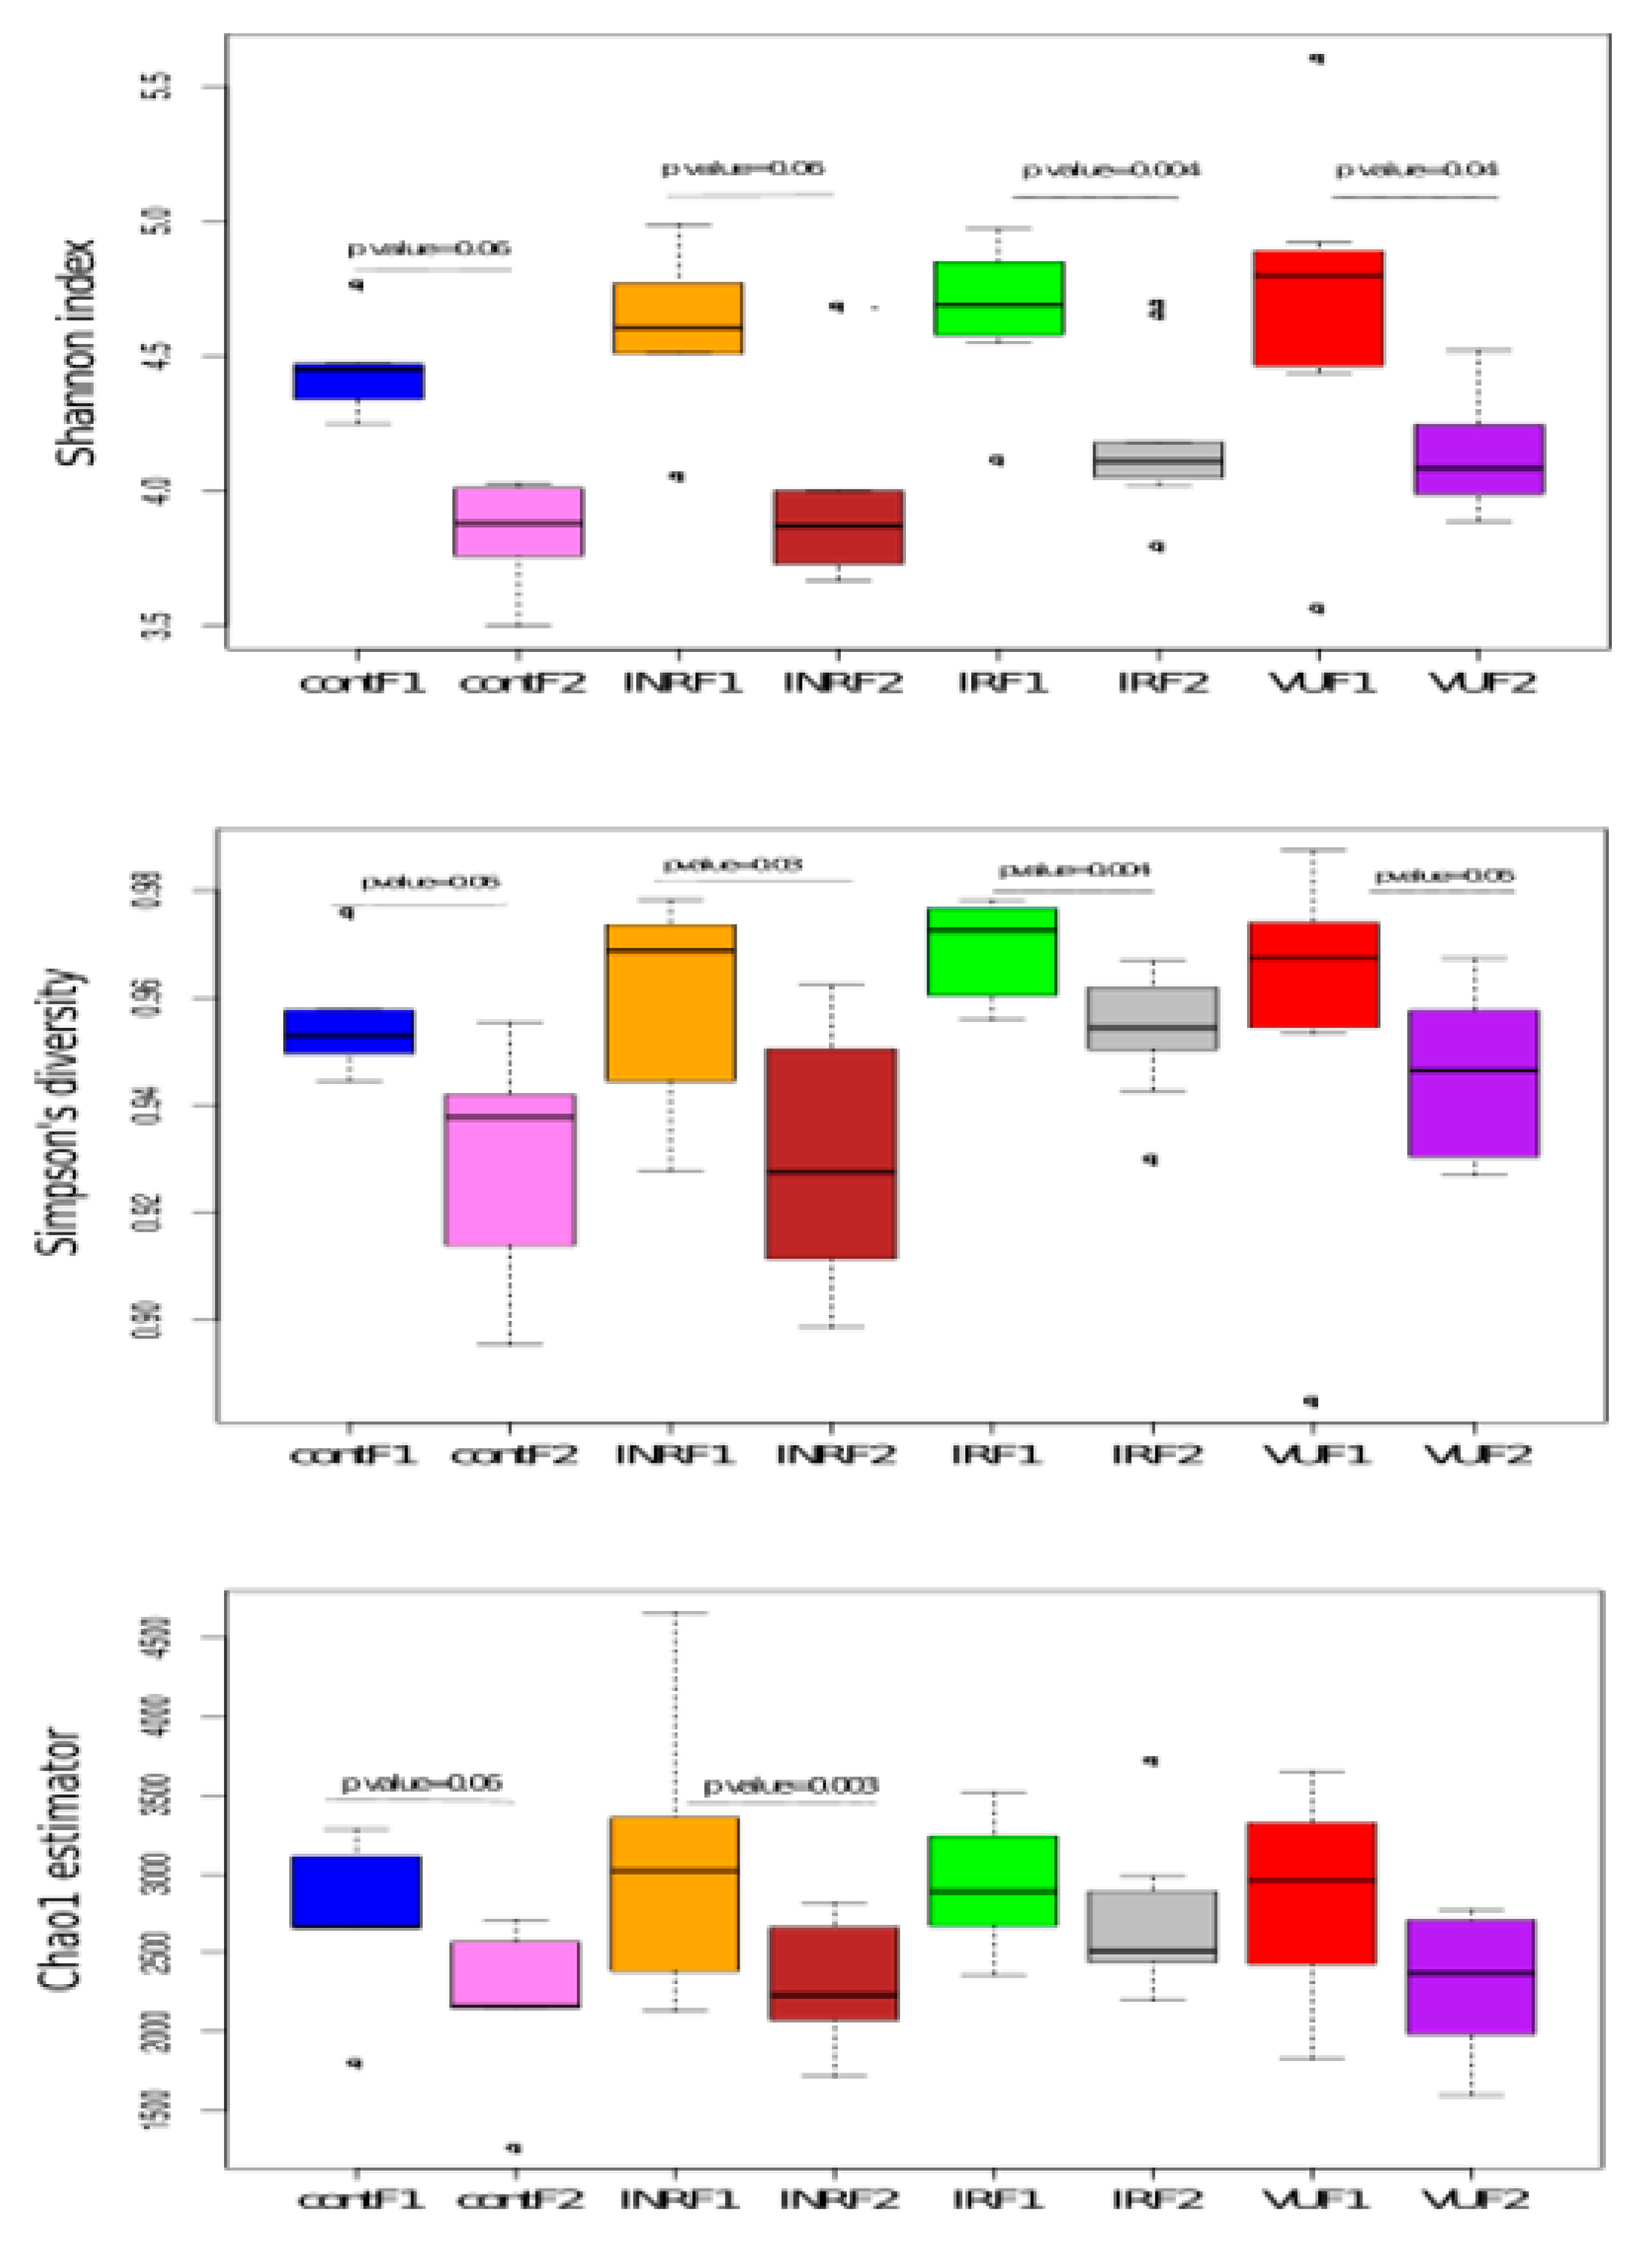
3.3. Effect of Prebiotics on Salivary Microbiota

After nutritional intervention, the IR and VU groups presented higher diversity parameters (Simpson’s index of diversity, Shannon index, and Chao1 richness estimator) than INR and control individuals (Figure 4), as it occurred at baseline. To assess the effect of prebiotics on alpha diversity, we compared F1 and F2 samples in each group. Interestingly, we observed a drastic decrease in both diversity and richness parameters after prebiotic intervention with a similar fold change for the four groups (Figure 4).
To evaluate the changes in the overall community structure in each group, we used the within-group weighted Unifrac distances. We found that prebiotic intervention modified the microbiota structure in all the groups, increasing the heterogeneity (Figure 5a). Then, we hypothesized that prebiotics could ameliorate the HIV-associated dysbiosis observed in salivary microbiota. To address this point, we considered the HIV− group at baseline as a healthy reference (F1.Control) and we calculated the weighted UniFrac distances between F1.Control and F1 or F2 for each group. We found that the weighted UniFrac distance between the F1.Control and F1.VU groups was slightly higher than that between F1.Control and F2.VU, which suggested a trend of the microbiota composition toward the microbiota of the healthy reference (Figure 5b and Figure S3, Supplementary Materials). In the IR group, we did not observe a clear approximation to the healthy reference after prebiotics. However, we observed an increase of the distance to the F1.Control for the F2.INR group (Figure 5b and Figure S3, Supplementary Materials).
Then, we used LEfSe analysis to identify the OTUs that presented significant differences between F1 and F2 in the four groups. Interestingly, we only found a change of microbiota composition in the VU group (Figure 6). Thus, the viremic ART-naïve individuals, after prebiotics, showed a microbiota enriched in the Actinobacteria Rothia mucilaginosa, a commensal bacterium of the oral cavity associated with dental and periodontal health. In addition, although the genus Mogibacterium was increased in F2, we found after prebiotics a depletion of other potential pathogens such as Corynebacterium, Fusobacterium, or Prevotella melaninogenica.

3.4. Association between Salivary Microbiota and Clinical Markers before and after Prebiotic Intervention

GLM analysis showed significant correlations between specific bacterial members of salivary microbiota and markers of bacterial translocation, adaptive immunity, and plasma metabolites (Table 3). At baseline, Streptococcus anginosus correlated with CD4+ T cells, Veillonella parvula with CD4+ CD25+ T cells, and Prevotella pallens, P. copri, and P. nigrencens with markers of adaptive immunity such as CD4+ CD25+ T cells, CD4+ CD57+ T cells, and CD4+ HLADR+ (Human Leukocyte Antigen –DR isotype) CD38+ T cells, respectively. Also, another major species Haemophilus parainfluenzae presented a significant positive correlation with the concentration of creatinine in plasma. Additionally, we found significant correlations between minor species and other clinical variables. After prebiotic intervention, we observed that different species of Lactobacillus and Streptococcus correlated negatively with inflammatory marker interleukin-6 (IL-6) and bacterial translocation (soluble CD14, sCD14). Also, Ruminococcus gnavus correlated negatively with T-cell activation markers.

3.5. Comparison between Salivary and Gut Microbiota: Bacterial Co-Occurrence

Firstly, we compared salivary and fecal bacterial populations by applying a PCoA analysis, in which, as expected, the two microbiotas presented highly different structures (Figure S4, Supplementary Materials). On the basis of the connection between the oral cavity and the gut, we explored the bacterial co-occurrence in both environments. To this aim, we searched for 100% identical 16S rRNA sequences in salivary and feces samples in each group (control, INR, IR, VU) at baseline and after prebiotic intervention, which yielded 330,120 and 272,622 total OTUs, respectively. We selected those OTUs that presented at least one pair of saliva and feces sequences from the same individual, representing the co-occurrence events. As we observe in Table S1 (Supplementary Materials), the co-occurrence events took place in the four groups, but they were not very frequent. This result is congruent with the different microbiota structure that is present in each habitat.
We observed a decrease in the frequency of co-occurrences after prebiotics in the HIV-infected patients (Table S1, Supplementary Materials). At baseline, the bacterial composition analysis showed that the more frequent co-occurrences were detected for the major bacterial genera and species of the salivary microbiota such as Haemophilus parainfluenzae, Streptococcus, and Veillonella (V. dispar, V. parvula) (Figure 7). Surprising, we also found co-occurrences of colonic bacteria such as Faecalibacterium prausnitzii, Dialister, and Bifidobacterium. The clustering analysis (Figure S5, Supplementary Materials) showed that IR and VU grouped together before and after prebiotic intervention, while the control presented a differential profile. Moreover, we identified specific bacterial taxa that only occurred in each of the groups. After prebiotics, we observed an increase of co-occurrences of Lactobacillus, Streptococcus, and Ruminococcus genera.

4. Discussion

In the last few years, high-throughput sequencing allowed deep and holistic studies of complex environments such as the human body. The oral cavity is no exception, with more than 700 species detected in the mouth microbiome [1,28]. Furthermore, other studies revealed the oral microbiota as a clear determinant of systemic inflammation and cardiovascular risk [28,29,30].
Currently, HIV infection is considered as a chronic inflammatory disease that alters the interplay between the gut microbiota and immune system. HIV-associated gut dysbiosis was studied in depth, and different nutritional approaches with prebiotics, probiotics, and synbiotics showed changes in immunity parameters and microbiota composition. However, few works addressed the dysbiosis of the oral microbiota in HIV infection and, to our knowledge, no studies on intervention with prebiotics were performed.
According to previous works [18,19,20,21,22], differences in the relative abundance of several bacterial taxa between HIV-infected subjects and healthy controls were observed, but the overall salivary microbiota structure was similar in all groups. However, the ordination analysis showed that the HIV infection had a considerable impact on the salivary microbiota. Unlike Li et al. [18], we detected an increase of diversity parameters for salivary microbiota in HIV-infected patients, mainly in viremic ART-naïve subjects (VU group) as we previously described in HIV-associated fecal microbiota [14]. A similar effect of HIV infection on bacterial community diversity was also described in the HIV-associated genital microbiota of women with vaginosis [31]. Furthermore, Presti et al. [22] described a correlation between viral suppression and decrease of diversity in HIV-associated salivary microbiota. Thus, the impairment of the immune system produced by HIV infection allowed the growth and colonization of opportunistic bacteria and pathogens in the oral cavity, suggesting that the composition of the oral bacterial community could reflect the HIV status. Although, we observed correlations between the microbiota and biomarkers of immunity, bacterial translocation, and thymic function, we could not establish a causal influence between the oral microbiome and the immune system.
In the last few years, the modulation of the microbiome by probiotics and prebiotics appeared as a promising tool to drive a dysbiotic microbiota toward a healthy status. In oral health, probiotics interventions were applied in the prevention of different diseases such as dental caries, gingivitis, and periodontitis [1,2,10]. However, few studies focused on the application of prebiotics. A recent work screened potential nutritional compounds for the stimulation of commensal bacteria growth with beneficial effects on oral health [8,9]. Even though different surveys applied prebiotics, probiotics, or synbiotics to modify the dysbiotic gut microbiome in HIV patients [12,13,14,15,16,17], no such studies were performed for oral HIV-associated microbiota. In the present work, we evaluated the modulatory effect of six weeks of prebiotic intervention on the salivary microbiota in the cohort previously described by Serrano-Villar et al. [14]. We are aware that the low number of enrolled patients hinders the interpretation of the effects of prebiotics on the salivary microbiota and demands caution in conclusions. In spite of this, our survey is the first study on the prebiotic modulation of the salivary microbiota in HIV-infected patients with diverse immunopathogenesis.
The decrease in alpha diversity of the saliva bacterial community after dietary intervention suggested a growth stimulation of specific bacteria that could inhibit pathogenic species. Although the prebiotics changed the beta diversity of salivary bacterial communities, no clear restoration of a healthy microbiota was detected. Our findings suggested that the response to prebiotics might depend on the HIV status. In fact, in the viremic ART-naïve group, we observed an approximation to the healthy condition, but contradictory responses were observed in ART-treated individuals. Furthermore, in accordance with what we previously described in the gut microbiota [14], the modulation of prebiotics was more apparent in the viremic ART naïve group (VU) with an enrichment in commensal bacteria and a depletion in potential pathogens. To validate our results and to extend the understanding of the mechanisms of action of prebiotics on the oral microbiota and their relationship with the gut microbiome, more studies will be needed with larger number of patients.
Due to the anatomical and physiological link between saliva and the gastrointestinal tract, we tackled the potential bacterial exchange between the salivary and gut microbiome. Several studies identified oral bacteria in the fecal microbiota in different diseases such as Crohn’s disease, liver cirrhosis, or colorectal carcinoma [32,33,34,35,36], suggesting a role of the oral microbiota in the inflammatory process. Recently, Atarashi et al. [37] showed that the oral genus, Klebsiella, colonized the gut inducing intestinal inflammation. However, the knowledge of the underlying basis for the bacterial exchange between both habitats is scarce [38,39]. In this work, we assessed the bacterial co-occurrences between salivary and fecal HIV-associated microbiota. The major salivary taxa would flow through the intestinal tract and would survive in the colon, albeit at a low abundance. Furthermore, in accordance with Franzosa et al. [39], we also detected co-occurrences of gut commensal bacteria such as Dialister and Faecalibacterium in healthy and HIV-infected individuals, suggesting a potential bidirectional flux for some bacteria. Interestingly, the bacterial exchange profile of HIV-infected subjects clustered separately from those of healthy individuals, which may suggest that the HIV infection modifies the bacterial exchange between the oral and gut microbiome. A better understanding of the interplay between the oral and gut microbiome may encourage the design of new nutritional strategies to modulate dysbiotic microbiota in inflammatory diseases.

Supplementary Materials

The following are available online at https://www.mdpi.com/2072-6643/11/6/1346/s1, Figure S1: Study profile; Figure S2: Linear discriminative analysis (LDA) effect size (LEfSe) at OTU level between (a) four groups: control, IR, INR, VU; (b) HIV− and HIV-infected groups at baseline. LDA scores for the significant taxa in HIV-infected group are represented on the positive scale (green) and LDA-negative scores represent enriched taxa in control group (red); Figure S3: (a) Principal coordinate analysis (PCoA) based on weighted Unifrac distances between F1.Control, F1.VU, and F2.VU groups. (b) Principal coordinate analysis (PCoA) based on weighted Unifrac distances between F1.Control, F1.IR, and F2.IR groups. (c) Principal coordinate analysis (PCoA) based on weighted Unifrac distances between F1.Control, F1.INR, and F2.INR groups; Figure S4: Principal coordinate analysis (PCoA) based on weighted Unifrac distances between saliva and feces microbiota; Figure S5: Heatmap based on the percentage of taxa that co-occurred (a) at baseline, (b) after prebiotics. We only considered the taxa that presented a percentage, in all the groups, higher than 5%. INR, immunological ART non-responders; IR, immunological ART responders; VU, viremic untreated; Table S1: Statistics of co-occurrence events at baseline and after prebiotic intervention; Table S2: Sample size determination (n1) for groups before prebiotic intervention; Table S3: Sample size determination (n2) for groups before prebiotic intervention; Table S4: Sample size determination (n1) for groups after prebiotic intervention; Table S5. Sample size determination (n2) for groups after prebiotic intervention.

Author Contributions

Conceptualization, S.S.-V., V.E., A.M., and M.J.G.; data curation, M.J.G.; formal analysis, A.A. and M.J.G.; funding acquisition, S.S.-V., A.M., and M.J.G.; investigation, N.J.-H. and A.D.; methodology, N.J.-H.; project administration, M.J.G.; resources, N.J.-H., S.S.-V., and V.E.; software, X.P. and A.A.; supervision, N.J.-H.; writing—original draft, M.J.G.; writing—review and editing, S.S.-V., A.M., and M.J.G.

Funding

This work was supported by a grant from the Fundación para el Fomento de la Investigación Sanitaria y Biomédica de la Comunidad Valenciana (UGP-15-170), by the Spanish Ministry of Economy and Competitiveness (SAF2015-65878-R), by the Instituto de Salud Carlos III (PI15/00345) and the Spanish AIDS Research Network (RD16/0025/0001 project), and co-financed by the European Development Regional Fund “A way to achieve Europe” (ERDF). The present investigation was also funded by the Fundación Asociación Española contra el Cáncer within the ERANET TRANSCAN-2 program, grant number AC17/00022.

Acknowledgments

We thank the participants who took part in the study and Nutrición Médica NM, SL, that manufactured and packaged the nutritional product under investigation.

Conflicts of Interest

The authors declare no conflicts of interest.

References

  1. Marsh, P.D. In Sickness and in Health—What Does the Oral Microbiome Mean to Us? An Ecological Perspective. Adv. Dent. Res. 2018, 29, 60–65. [Google Scholar] [CrossRef] [PubMed]
  2. Devine, D.A.; Marsh, P.D. Prospects for the development of probiotics and prebiotics for oral applications. J. Oral Microbiol. 2009, 1, 1–11. [Google Scholar] [CrossRef] [PubMed]
  3. Laleman, I.; Detailleur, V.; Slot, D.E.; Slomka, V.; Quirynen, M.; Teughels, W. Probiotics reduce mutans streptococci counts in humans: A systematic review and meta-analysis. Clin. Oral Investig. 2014, 18, 1539–1552. [Google Scholar] [CrossRef] [PubMed]
  4. Gruner, D.; Paris, S.; Schwendicke, F. Probiotics for managing caries and periodontitis: Systematic review and meta-analysis. J. Dent. 2016, 48, 16–25. [Google Scholar] [CrossRef] [PubMed]
  5. Huang, X.; Palmer, S.R.; Ahn, S.J.; Richards, V.P.; Williams, M.L.; Nascimento, M.M.; Burne, R.A. A highly arginolytic Streptococcus species that potently antagonizes Streptococcus mutans. Appl. Environ. Microbiol. 2016, 82, 2187–2201. [Google Scholar] [CrossRef]
  6. Saxena, D.; Li, Y.; Devota, A.; Pushalkar, S.; Abrams, W.; Barber, C.; Corby, P.; Poles, M.; Phelan, J.; Malamud, D. Modulation of the orodigestive tract microbiome in HIV-infected patients. Oral Dis. 2016, 22, 73–78. [Google Scholar] [CrossRef] [Green Version]
  7. López-López, A.; Camelo-Castillo, A.; Ferrer, M.D.; Simon-Soro, A.; Mira, A. Health-associated niche inhabitants as oral probiotics: The case of Streptococcus dentisani. Front. Microbiol. 2017, 8, 1–12. [Google Scholar] [CrossRef]
  8. Slomka, V.; Hernandez-Sanabria, E.; Herrero, E.R.; Zaidel, L.; Bernaerts, K.; Boon, N.; Quirynena, M.; Teughelsa, W. Nutritional stimulation of commensal oral bacteria suppresses pathogens: The prebiotic concept. J. Clin. Periodontol. 2017, 44, 344–352. [Google Scholar] [CrossRef]
  9. Slomka, V.; Herrero, E.R.; Boon, N.; Bernaerts, K.; Trivedi, H.M.; Daep, C.; Quirynen, M.; Teughels, W. Oral prebiotics and the influence of environmental conditions in vitro. J. Periodontol. 2018, 89, 708–717. [Google Scholar] [CrossRef]
  10. Rosier, B.T.; Marsh, P.D.; Mira, A. Resilience of the oral microbiota in health: Mechanisms that prevent dysbiosis. J. Dent. Res. 2018, 97, 371–380. [Google Scholar] [CrossRef]
  11. Dillon, S.M.; Frank, D.N.; Cara, C.W. The gut microbiome and HIV-1 pathogenesis: A two way street. AIDS 2016, 30, 2737–2751. [Google Scholar] [CrossRef] [PubMed]
  12. Gori, A.; Rizzardini, G.; Van’T Land, B.; Amor, K.B.; Van Schaik, J.; Torti, C.; Quirino, T.; Tincati, C.; Bandera, A.; Knol, J.; et al. Specific prebiotics modulate gut microbiota and immune activation in HAART-naive HIV-infected adults: Results of the “COPA” pilot randomized trial. Mucosal Immunol. 2011, 4, 554–563. [Google Scholar] [CrossRef] [PubMed]
  13. Vázquez-Castellanos, J.F.; Serrano-Villar, S.; Latorre, A.; Artacho, A.; Ferrús, M.L.; Madrid, N.; Vallejo, A.; Sainz, T.; Martínez-Botas, J.; Ferrando-Martínez, S.; et al. Altered metabolism of gut microbiota contributes to chronic immune activation in HIV-infected individuals. Mucosal Immunol. 2015, 8, 760–772. [Google Scholar] [CrossRef] [PubMed]
  14. Serrano-Villar, S.; Vázquez-Castellanos, J.F.; Vallejo, A.; Latorre, A.; Sainz, T.; Ferrando-Martínez, S.; Rojo, D.; Martínez-Botas, J.; del Romero, J.; Madrid, N.; et al. The effects of prebiotics on microbial dysbiosis, butyrate production and immunity in HIV-infected subjects. Mucosal Immunol. 2017, 10, 1279–1293. [Google Scholar] [CrossRef] [PubMed]
  15. Villar-García, J.; Güerri-Fernández, R.; Moya, A.; Gonzalez, A.; Hernandez, J.J.; Lerma, E.; Guelar, A.; Sorli, L.; Horcajada, J.P.; Artacho, A.; et al. Impact of probiotic Saccharomyces boulardii on the gut microbiome composition in HIV-treated patients: A double-blind, randomised, placebo-controlled trial. PLoS ONE 2017, 12, e0173802. [Google Scholar] [CrossRef] [PubMed]
  16. Asmuth, D.M.; Ma, Z.M.; Albanese, A.; Sandler, N.G.; Devaraj, S.; Knight, T.H.; Flynn, N.M.; Yotter, T.; Garcia, J.C.; Tsuchida, E.; et al. Oral serum-derived bovine immunoglobulin improves duodenal immune reconstitution and absorption function in patients with HIV enteropathy. AIDS 2013, 27, 2207–2217. [Google Scholar] [CrossRef] [PubMed] [Green Version]
  17. Cahn, P.; Ruxrungtham, K.; Gazzard, B.; Diaz, R.S.; Gori, A.; Kotler, D.P.; Vriesema, A.; Georgiou, N.A.; Garssen, J.; Clerici, M.; et al. The immunomodulatory nutritional intervention NR100157 reduced CD4+ T-cell decline and immune activation: A 1-year multicenter randomized controlled double-blind trial in HIV-infected persons not receiving antiretroviral therapy (The BITE Study). Clin. Infect. Dis. 2013, 57, 139–146. [Google Scholar] [CrossRef] [PubMed]
  18. Li, Y.; Saxena, D.; Chen, Z.; Liu, G.; Abrams, W.R.; Phelan, J.A.; Norman, R.G.; Fisch, G.S.; Corby, P.M.; Dewhirst, F.; et al. HIV infection and microbial diversity in saliva. J. Clin. Microbiol. 2014, 52, 1400–1411. [Google Scholar] [CrossRef] [PubMed]
  19. Kistler, J.O.; Arirachakaran, P.; Poovorawan, Y.; Dahlén, G.; Wade, W.G. The oral microbiome in human immunodeficiency virus (HIV)-positive individuals. J. Med. Microbiol. 2015, 64, 1094–1101. [Google Scholar] [CrossRef]
  20. Lewy, T.; Hong, B.Y.; Weiser, B.; Burger, H.; Tremain, A.; Weinstock, G.; Anastos, K.; George, M.D. Oral Microbiome in HIV-infected women: Shifts in the abundance of pathogenic and beneficial bacteria are associated with aging, HIV load, CD4 count, and antiretroviral therapy. AIDS Res. Hum. Retrovir. 2019, 35, 276–286. [Google Scholar] [CrossRef]
  21. Mukherjee, P.K.; Chandra, J.; Retuerto, M.; Tatsuoka, C.; Ghannoum, M.A.; McComsey, G.A. Dysbiosis in the oral bacterial and fungal microbiome of HIV-infected subjects is associated with clinical and immunologic variables of HIV infection. PLoS ONE 2018, 13, e0200285. [Google Scholar] [CrossRef] [PubMed]
  22. Presti, R.M.; Handley, S.A.; Droit, L.; Ghannoum, M.; Jacobson, M.; Shiboski, C.H.; Webster-Cyriaque, J.; Brown, T.; Yin, M.T.; Overton, E.T. Alterations in the oral microbiome in HIV-infected participants after antiretroviral therapy administration are influenced by immune status. AIDS 2018, 32, 1279–1287. [Google Scholar] [CrossRef] [PubMed]
  23. Schmieder, R.; Edwards, R. Quality control and preprocessing of metagenomic datasets. Bioinformatics 2011, 27, 863–864. [Google Scholar] [CrossRef] [PubMed] [Green Version]
  24. Magoc, T.; Salzberg, S.L. FLASH: Fast length adjustment of short reads to improve genome assemblies. Bioinformatics 2011, 27, 2957–2963. [Google Scholar] [CrossRef] [PubMed]
  25. Boix-Amorós, A.; Collado, M.C.; Mira, A. Relationship between milk microbiota, bacterial load, macronutrients, and human cells during lactation. Front. Microbiol. 2016, 7, 1–9. [Google Scholar] [CrossRef] [PubMed]
  26. R Core Team. R: A Language and Environment for Statistical Computing; R Foundation for Statistical Computing: Vienna, Austria, 2013. [Google Scholar]
  27. Segata, N.; Izard, J.; Waldron, L.; Gevers, D.; Miropolsk, L.; Garrett, W.S.; Huttenhower, C. Metagenomic biomarker discovery and explanation. Genome Biol. 2011, 12, R60. [Google Scholar] [CrossRef] [PubMed]
  28. Zaura, E.; Mira, A. The oral microbiome in an ecological perspective. Front. Cell. Infect. Microbiol. 2015, 5, 2014–2015. [Google Scholar] [CrossRef]
  29. Saito, T.; Shimazaki, Y.; Sakamoto, M. Obesity and Periodontitis. N. Engl. J. Med. 1998, 339, 482–483. [Google Scholar] [CrossRef]
  30. Koren, O.; Spora, A.; Felinb, J.; Fåkb, F.; Stombaughd, J.; Tremaroli, V.; Behre, C.J.; Knight, R.; Fagerberg, B.; Ley, R.E.; et al. Human oral, gut, and plaque microbiota in patients with atherosclerosis. Proc. Natl. Acad. Sci. USA 2011, 108 (Suppl. 1), 4592–4598. [Google Scholar] [CrossRef]
  31. Spear, G.T.; Sikaroodi, M.; Zariffard, M.R.; Landay, A.L.; French, A.L.; Gillevet, P.M. Comparison of the diversity of the vaginal microbiota in HIV-infected and HIV-uninfected women with or without bacterial vaginosis. J. Infect. Dis. 2008, 198, 1131–1140. [Google Scholar] [CrossRef]
  32. Qin, N.; Yang, F.; Li, A.; Prifti, E.; Chen, Y.; Shao, L.; Guo, J.; Le Chatelier, E.; Yao, J.; Wu, L.; et al. Alterations of the human gut microbiome in liver cirrhosis. Nature 2014, 513, 59–64. [Google Scholar] [CrossRef] [PubMed]
  33. Said, H.S.; Suda, W.; Nakagome, S.; Chinen, H.; Oshima, K.; Kim, S.; Kimura, R.; Iraha, A.; Ishida, H.; Fujita, J.; et al. Dysbiosis of salivary microbiota in inflammatory bowel disease and its association with oral immunological biomarkers. DNA Res. 2014, 21, 15–25. [Google Scholar] [CrossRef] [PubMed]
  34. Zhang, X.; Zhang, D.; Jia, H.; Feng, Q.; Wu, X.; Li, J.; Wang, D.; Liang, D.; Tang, L.; Li, Y.; et al. The oral and gut microbiomes are perturbed in rheumatoid arthritis and partly normalized after treatment. Nat. Med. 2015, 21, 895–905. [Google Scholar] [CrossRef] [PubMed]
  35. Moyes, D.L.; Saxena, D.; John, M.D.; Malamud, D. The gut and oral microbiome in HIV disease: A workshop report. Oral Dis. 2016, 22, 166–170. [Google Scholar] [CrossRef] [PubMed]
  36. Lira-Junior, R.; Boström, E.A. Oral-gut connection: One step closer to an integrated view of the gastrointestinal tract? Mucosal Immunol. 2018, 11, 316–318. [Google Scholar] [CrossRef] [PubMed]
  37. Atarashi, K.; Suda, W.; Luo, C.; Kawaguchi, T.; Motoo, I.; Narushima, S. Ectopic colonization of oral bacteria in the intestine drives TH1 cell induction and inflammation. Science 2017, 358, 359–365. [Google Scholar] [CrossRef] [PubMed]
  38. Faust, K.; Sathirapongsasuti, J.F.; Izard, J.; Segata, N.; Gevers, D.; Raes, J.; Huttenhower, C. Microbial co-occurrence relationships in the human microbiome. PLoS Comput. Biol. 2012, 8, e1002606. [Google Scholar] [CrossRef]
  39. Franzosa, E.A.; Morgan, X.C.; Segata, N.; Waldron, L.; Reyes, J.; Earl, A.M.; Giannoukos, G.; Boylanc, M.R.; Ciulla, D.; Gevers, D.; et al. Relating the metatranscriptome and metagenome of the human gut. Proc. Natl. Acad. Sci. USA 2014, 111, E2329–E2338. [Google Scholar] [CrossRef] [Green Version]
Figure 1. Oral microbiota composition in HIV-infected groups and controls. Species distribution of the salivary microbiota in each group. INR, immunological antiretroviral therapy (ART) non-responders; IR, immunological ART responders; VU, viremic untreated.
Nutrients 11 01346 g001
Figure 2. Canonical correspondence analysis (CCA) based on operational taxonomic unit (OTU) abundance. INR, immunological ART non-responders (yellow); IR, immunological ART responders (green); VU, viremic untreated (red); and controls (blue).
Nutrients 11 01346 g002
Figure 3. Alpha diversity and bacterial load in saliva. (a) Simpson’s index of diversity, Shannon diversity index, number of OTUs observed (N), Chao1 richness estimator, and Abundance-based Coverage Estimator (ACE) in the four groups. (b) Bacterial load expressed as number of cells per mL of saliva in the four groups. and bacterial load expressed as number of cells per mL of saliva in HIV-infected individuals (HIV) and controls. To calculate differences across groups, we used the Kruskal–Wallis test (p-value = 0.05) and, for differences between groups, we used the Wilcoxon rank-sum test (p-value = 0.05). INR, immunological ART non-responders (yellow); IR, immunological ART responders (green); VU, viremic untreated (red); and controls (blue).
Nutrients 11 01346 g003
Figure 4. Alpha diversity before and after prebiotic intervention. Shannon diversity index, Simpson’s index of diversity, and Chao1 richness estimator in the four groups. To calculate differences between groups, we used the Wilcoxon rank-sum test (p-value = 0.05). F1, at baseline; F2, after prebiotics. INR, immunological ART non-responders; IR, immunological ART responders; VU, viremic untreated; cont, controls.
Nutrients 11 01346 g004
Figure 5. (a) Beta diversity at baseline (F1) and after prebiotics (F2) for control (red), INR (orange), IR (green), and VU (blue) groups. (b) Weighted UniFrac distances between Control.F1 and F1 or F2 of INR (orange), IR (green), and VU (blue). INR, immunological ART non-responders; IR, immunological ART responders; VU, viremic untreated.
Nutrients 11 01346 g005
Figure 6. Linear discriminative analysis (LDA) effect size (LEfSe) at the OTU level in viremic untreated group (VU) before (F1) and after (F2) prebiotic intervention. LDA scores for the significant taxa in F2 are represented on the positive scale (green), and LDA-negative scores represent enriched taxa in F1 (red).
Nutrients 11 01346 g006
Figure 7. Taxa distribution of co-occurrences in each group: (a) at baseline; (b) after prebiotics. INR, immunological ART non-responders; IR, immunological ART responders; VU, viremic untreated.
Nutrients 11 01346 g007
Table 1. Saliva and fecal samples used in the study.
Saliva F1 aSaliva F2 bFeces F1 aFeces F2 bHIV Group c
S-F1-11 F1-11 Control
S-F1-17 F1-17 Control
S-F1-21 F1-21 Control
S-F1-23S-F2-23F1-23F2-23Control
S-F1-28S-F2-28F1-28F2-28Control
S-F1-29S-F2-29F1-29F2-29Control
S-F1-30 F1-30 Control
S-F1-31 F1-31 Control
S-F1-32 F1-32 Control
S-F1-45S-F2-45F1-45F2-45Control
S-F1-48 F1-48 Control
S-F1-49S-F2-49F1-49F2-49Control
S-F1-50S-F2-50F1-50F2-50Control
S-F1-60S-F2-60F1-60F2-60Control
S-F1-13S-F2-13F1-13F2-13INR
S-F1-22S-F2-22F1-22F2-22INR
S-F1-25S-F2-25F1-25F2-25INR
S-F1-27S-F2-27F1-27F2-27INR
S-F1-3 F1-3 INR
S-F1-5S-F2-5F1-5F2-5INR
S-F1-54 F1-54 INR
S-F1-58 F1-58F2-58INR
S-F1-9S-F2-9F1-9F2-9INR
S-F1-1S-F2-1F1-1 IR
S-F1-10 F1-10 IR
S-F1-12 F1-12 IR
S-F1-14S-F2-14F1-14F2-14IR
S-F1-15 F1-15F2-15IR
S-F1-16S-F2-16F1-16F2-16IR
S-F1-18S-F2-18F1-18F2-18IR
S-F1-19 F1-19F2-19IR
S-F1-2S-F2-2F1-2F2-2IR
S-F1-20S-F2-20F1-20F2-20IR
S-F1-24 F1-24 IR
S-F1-26 F1-26 IR
S-F1-33S-F2-33F1-33F2-33IR
S-F1-4S-F2-4F1-4F2-4IR
S-F1-56 F1-56 IR
S-F1-6 F1-6 IR
S-F1-7S-F2-7F1-7F2-7IR
S-F1-8S-F2-8F1-8F2-8IR
S-F1-34 VU
S-F1-35S-F2-35F1-35F2-35VU
S-F1-36S-F2-36F1-36F2-36VU
S-F1-37 F1-37 VU
S-F1-38 F1-38F2-38VU
S-F1-39S-F2-39F1-39F2-39VU
S-F1-40S-F2-40F1-40F2-40VU
S-F1-44S-F2-44F1-44F2-44VU
S-F1-46S-F2-46F1-46F2-46VU
S-F1-47S-F2-47F1-47F2-47VU
S-F1-51S-F2-51F1-51F2-51VU
S-F1-53S-F2-53F1-53F2-53VU
a: baseline level, b: after prebiotics, c: INR, immunological antiretroviral therapy (ART) non-responder; IR, immunological ART responder; VU, viremic untreated.
Table 2. Clinical variables at baseline and after prebiotic intervention in studied subjects.
ControlINRIRVU
BaselinePrebioticsBaselinePrebioticsBaselinePrebioticsBaselinePrebioticsp.value Baseline aAdj.fdr p.value Baseline ap.value Prebiotics bAdj.fdr p.value Prebiotics b
Metabolic profile in plama
Glucose (mg/dL)91
(88–94)
90(83–98)93(89–96)94(88–108)93(89–97)90(86–99)85(82–87)92(85–94)0.06150.12850.61810.6476
Creatinine (mg/dL)0.97
(0.82–1)
0.91
(0.84–0.99)
1(0.95–1)1.1
(0.96–1.2)
1(0.96–1.1)0.97
(0.93–1.1)
1(0.94–1.2)0.96(0.89–1)0.31940.40810.10240.1733
Total cholesterol (mg/dL)207
(160–220)
149
(136–192)
148
(145–198)
155
(135–185)
185
(153–208)
190
(156–220)
158
(147–184)
164
(160–177)
0.09240.17710.22990.3161
HDL-cholesterol (mg/dL)54(49–75)55(52–76)50(44–57)49(43–61)53(47–58)56(48–60)48(41–53)49(40–53)0.31410.40810.30280.3918
LDL-cholesterol (mg/dL)116
(82–134)
89
(74–126)
78
(71–116)
81
(69–99)
105
(93–119)
115
(89–132)
88
(86–100)
94
(86–103)
0.14230.25170.38670.4477
Triglycerides (mg/dL)80
(66–161)
67(54–76)102(87–147)97(75–120)102(81–127)104(75–152)107(63–158)110
(103–135)
0.92660.96870.91880.9188
T cell markers
CD4+T-cell counts (cells/μl)716
(601–862)
742
(629–880)
271
(204–321)
289
(227–319)
561
(426–667)
534
(432–668)
521
(385–738)
549
(458–645)
0.00010.00070.00310.0115
%HLADR+
CD38+
1(0.7–1.1)1.2
(0.89–1.4)
3.4(3–4)3.3(2.6–3.8)2.3(1.8–2.6)1.9(1.5–2)3.8(3.6–7.8)3.4(2.8–3.6)0.00000.00000.00000.0001
%CD25+2.6(2–4)2.6(2.1–3.2)6.1(5.5–8.3)6.6(6–7.5)4.7(4.2–6.6)4.5(4.2–6.4)8.2(5.4–10)6.2(4.6–7.3)0.00280.01080.00130.0058
%CD57+3.2
(2.2–5.9)
5.1(2.4–5.9)11(3.7–12)8.3(4.3–11)5.7(4–8.6)6.8(3.3–10)13(5.7–22)9.3(8.7–22)0.02110.04850.04980.1095
CD8+ T-cell counts (cells/μl)403
(306–552)
429
(308–541)
404
(377–695)
434
(226–566)
606
(480–730)
532
(436–670)
1004
(794–1114)
1075
(829–1271)
0.00790.02280.01400.0439
%HLADR
+CD38+
2(1.2–2.1)1.5(0.6–1.6)4.8(4.4–6.3)4.9(3.7–8)3.3(2.6–8.3)4.8(3.8–5.7)13(10–17)10(8.1–11)0.00000.00000.00010.0004
%CD25+0.33
(0.095–0.41)
0.19
(0.13–0.23)
0.73
(0.57–1.6)
0.84
(0.47–1.2)
0.47
(0.32–0.74)
0.46
(0.26–0.6)
0.95
(0.93–1.1)
0.77
(0.72–0.85)
0.00220.01020.01840.0507
%CD57+24(16–46)18(18–57)27(18–34)29(19–34)26(18–42)31(21–47)42(39–55)46(36–56)0.23090.35400.38010.4477
CD4/CD8 ratio1.5
(1.2–1.7)
1.7
(1.3–2)
0.65
(0.36–0.89)
0.88
(0.36–2.2)
1(0.91–1.2)1.2(1.1–1.3)0.54
(0.45–0.74)
0.56
(0.51–0.62)
0.00010.00060.00110.0058
Thymic function
sj/β-TREC c ratio9(8.2–9.5)8.8(7.1–8.9)7.8(7.6–8.4)8.2
(7.9–8.8)
8.2(7.7–9.2)9.1(8.3–9.6)8.7(8.3–9)8.4
(7.4–8.8)
0.01950.04850.54800.6029
Endotelial function
ADMA d
(μM/L)
1.1
(1.1–1.1)
1(0.9–1.1)0.97
(0.86–1.2)
1.2(1–1.3)0.97
(0.96–1.1)
0.99(0.95–1)0.96
(0.92–1.1)
1.1(1–1.2)0.25060.36020.20740.3042
Bacterial translocation
BPI e
(ng/mL)
35(12–35)8.3(2.6–9.1)13(4.1–49)3(2.3–5.7)28(1.3–114)6(1.8–8.6)17(5.3–60)9.8(5.3–17)0.97680.97680.00000.0002
SCD14 f
(ng/mL)
1424
(1254–1484)
1272
(1162–1362)
1636
(1454–1999)
1894
(1641–2402)
1663
(1483–1732)
1610
(1251–1750)
1552
(1360–1613)
1507
(1295–1721)
0.15870.26070.04630.1095
Inflammation
IL6 g (pg/mL)2(2–4.1)2(2–2)2(2–2.2)7.3(5.3–8.1)2(2–2)2(2–2.7)2(2–2)2(2–4.3)0.38110.46140.06650.1329
Hs-CRP h
(mg/L)
0.095
(0.055–0.3)
0.07
(0.035–0.22)
0.11
(0.06–0.15)
0.57
(0.28–1.3)
0.18
(0.09–0.29)
0.19
(0.062–0.34)
0.09
(0.053–0.18)
0.15
(0.07–0.26)
0.68380.74890.08350.1530
Thrombosis
Dimers-D
(ng/mL)
180
(120–274)
240
(209–304)
202
(113–306)
261
(237–290)
215
(176–293)
202
(184–232)
280
(202–322)
238
(216–397)
0.40320.46370.14280.2244
a, Analysis was performed using Kruskal–Wallis test to compare median values across all groups at baseline. b, Analysis was performed using Kruskal–Wallis test to compare median values among control at baseline and HIV-infected patients after prebiotics. The p-value represents probability at α = 0.05. The p-values were adjusted by the Benjamini–Hochberg method. c, signal joint/beta T-cell receptor excision circles ratio; d, asymetric dymethilarginine; e, bactericidal permeability increasing protein; f, soluble CD14; g, interleukin-6; h, high-sensitivity C-reactive protein. INR, immunological ART non-responders; IR, immunological ART responders; VU, viremic untreated.
Table 3. Correlations between saliva microbiota and clinical parameters at baseline and after treatment. Analysis was performed using Kruskal–Wallis test to compare median values across all groups. The p-value is the probability at α = 0.05. The p-values were adjusted by the Benjamini–Hochberg method.
Correlations Before Prebiotic Intervention
Clinical VariableTaxaSpearman Correlation Indexp.valueAdj.fdr_p.value
Plasma Metabolite
CreatinineFaecalibacterium prausnitzii0.58930.00040.0344
CreatinineHaemophilus parainfluenzae0.56700.00070.0376
CreatinineActinobacillus porcinus0.49440.00400.0710
HDL-cholesterolPrevotella tannerae−0.46640.00710.1025
HDL-cholesterolLactobacillus coleohominis−0.41360.01860.1346
HDL-cholesterolPyramidobacter piscolens−0.39850.02390.1356
HDL-cholesterolLactobacillus reuteri−0.39550.02500.1356
HDL-cholesterolPasteurella multocida−0.38510.02950.1356
T cell markers
CD4+T cellStreptococcus
anginosus
−0.39650.02470.1356
CD4+T cellPyramidobacter piscolens−0.36820.03810.1356
CD4+ CD25+T cellVeillonella parvula0.41700.01760.1346
CD4+ CD25+T cellPrevotella pallens−0.37360.03520.1356
CD4+ CD57+T cellPrevotella copri0.38640.02890.1356
CD4+ CD57+T cellPasteurella multocida0.35870.04380.1356
CD4+ HLADR+ CD38+T cellPrevotella nigrescens0.35920.04420.1356
Thymic function
sj/β-TREC ratio aActinomyces hyovaginalis0.58520.00040.0344
sj/β-TREC ratioStreptococcus sobrinus−0.50770.00300.0680
sj/β-TREC ratioStreptococcus agalactiae0.47800.00620.0975
sj/β-TREC ratioPyramidobacter piscolens−0.37100.03660.1356
Bacterial translocation
BPI bStreptobacillus moniliformis0.35500.04620.1356
Correlations After Prebiotic Intervention
Clinical VariableTaxaSpearman Correlation Indexp.valueAdj.fdr p.value
Plasma Metabolite
CreatinineCampylobacter rectus0.37410.03490.0689
GlucoseActinomyces
hyovaginalis
−0.40220.02250.0689
GlucoseCollinsella aerofaciens0.35750.04460.0689
HDL-cholesterolLactobacillus coleohominis−0.38390.03010.0689
HDL-cholesterolPrevotella melaninogenica0.37610.03390.0689
LDL-cholesterolPasteurella multocida−0.38930.02760.0689
TriglyceridesPasteurella multocida−0.45010.00980.0689
TriglyceridesLactobacillus coleohominis0.42110.01640.0689
TriglyceridesLactobacillus reuteri0.37140.03640.0689
T cell markers
CD4+T cellRuminococcus gnavus0.53210.00170.0283
CD4+ HLADR+ CD38+T cellBifidobacterium adolescentis0.39280.02620.0689
CD4+ HLADR+ CD38+T cellRuminococcus gnavus−0.36180.04190.0689
CD4+ HLADR+ CD38+T cellCapnocytophaga ochracea0.35900.04360.0689
CD4+ CD25+T cellRuminococcus gnavus−0.53930.00140.0283
CD4+ CD25+T cellActinobacillus porcinus0.39160.02670.0689
CD4+ CD25+T cellPrevotella_intermedia0.39010.02730.0689
CD4+ CD25+T cellSelenomonas_noxia−0.38210.03090.0689
CD4+ CD57+T cellNeisseria_subflava−0.46210.00780.0689
CD4+ CD57+T cellAtopobium_rimae0.45220.00940.0689
CD4+ CD57+T cellHaemophilus_parainfluenzae−0.43590.01330.0689
CD4+ CD57+T cellVeillonella dispar0.42450.01620.0689
CD4+ CD57+T cellPasteurella multocida−0.40360.02200.0689
CD4+ CD57+T cellPrevotella intermedia0.39790.02410.0689
CD4+ CD57+T cellBifidobacterium adolescentis0.36120.04230.0689
CD8+T cellCapnocytophaga ochracea0.39830.02400.0689
CD8+ CD25+T cellPseudomonas veronii−0.47730.00570.0672
CD8+ CD25+T cellBulleidia moorei−0.37960.03210.0689
CD8+ CD25+T cellBifidobacterium longum−0.36990.03720.0689
CD8+ CD57+T cellPasteurella multocida−0.54690.00120.0283
CD8+ CD57+T cellFlexispira rappini−0.38000.03190.0689
CD8+ CD57+T cellNeisseria subflava−0.35980.04310.0689
CD8+ CD57+T cellStreptobacillus moniliformis−0.35770.04440.0689
CD4/CD8 ratioRuminococcus gnavus0.45740.00850.0689
Endotelial function
ADMA cFaecalibacterium prausnitzii0.42190.01620.0689
ADMAPrevotella tannerae0.38590.02920.0689
ADMALactobacillus coleohominis0.36170.04200.0689
Bacterial translocation
BPILactobacillus helveticus0.36420.04050.0689
SCD14 dLactobacillus vaginalis−0.43070.01390.0689
sCD14Streptococcus sobrinus−0.39780.02420.0689
sCD14Lactobacillus salivarius−0.35840.04400.0689
a, signal joint/beta T-cell receptor excision circles ratio; b, bactericidal permeability increasing protein; c, asymetric dymethilarginine; d, soluble CD14.

