Evaluation of the Validity and Reliability of the Chinese Healthy Eating Index


Abstract
1. Introduction
2. Materials and Methods
2.1. Data Source
2.2. Evaluation Plan
2.3. Statistical Analyses
3. Results
3.1. Validity
3.2. Reliability
4. Discussion
5. Conclusions
Supplementary Materials
Acknowledgments
Author Contributions
Conflicts of Interest
References
- Kant, A.K. Indexes of overall diet quality: A review. J. Am. Diet. Assoc. 1996, 96, 785–791. [Google Scholar] [CrossRef]
- Wirt, A.; Collins, C.E. Diet quality—what is it and does it matter? Public Health Nutr. 2009, 12, 2473–2492. [Google Scholar] [CrossRef] [PubMed]
- Schwingshackl, L.; Hoffmann, G. Diet quality as assessed by the healthy eating index, the alternate healthy eating index, the dietary approaches to stop hypertension score, and health outcomes: A systematic review and meta-analysis of cohort studies. J. Acad. Nutr. Diet. 2015, 115, 780–800. [Google Scholar] [CrossRef] [PubMed]
- Sotos-Prieto, M.; Bhupathiraju, S.N.; Mattei, J.; Fung, T.T.; Li, Y.; Pan, A.; Willett, W.C.; Rimm, E.B.; Hu, F.B. Association of changes in diet quality with total and cause-specific mortality. N. Engl. J. Med. 2017, 377, 143–153. [Google Scholar] [CrossRef] [PubMed]
- Liese, A.D.; Krebs-Smith, S.M.; Subar, A.F.; George, S.M.; Harmon, B.E.; Neuhouser, M.L.; Boushey, C.J.; Schap, T.E.; Reedy, J. The dietary patterns methods project: Synthesis of findings across cohorts and relevance to dietary guidance. J. Nutr. 2015, 145, 393–402. [Google Scholar] [CrossRef] [PubMed]
- Guenther, P.M.; Reedy, J.; Krebssmith, S.M. Development of the healthy eating index-2005. J. Am. Diet. Assoc. 2008, 108, 1896–1901. [Google Scholar] [CrossRef] [PubMed]
- Guenther, P.M.; Casavale, K.O.; Reedy, J.; Kirkpatrick, S.I.; Hiza, H.A.B.; Kuczynski, K.J.; Kahle, L.L.; Krebs-Smith, S.M. Update of the healthy eating index: Hei-2010. J. Acad. Nutr. Diet. 2013, 113, 569–580. [Google Scholar] [CrossRef] [PubMed]
- Kennedy, E.T.; Ohls, J.; Carlson, S.; Fleming, K. The healthy eating index: Design and applications. J. Am. Diet. Assoc. 1995, 95, 1103–1108. [Google Scholar] [CrossRef]
- Taechangam, S.; Pinitchun, U.; Pachotikarn, C. Development of nutrition education tool: Healthy eating index in thailand. Asia Pac. J. Clin. Nutr. 2008, 17, 365–367. [Google Scholar] [PubMed]
- Woodruff, S.J.; Hanning, R.M. Development and implications of a revised Canadian healthy eating index (HEIC-2009). Public Health Nutr. 2010, 13, 820–825. [Google Scholar] [CrossRef] [PubMed]
- Previdelli, A.N.; Andrade, S.C.; Pires, M.M.; Ferreira, S.R.; Fisberg, R.M.; Marchioni, D.M. A revised version of the healthy eating index for the brazilian population. Rev. Saude Publ. 2011, 45, 794–798. [Google Scholar] [CrossRef]
- Roy, R.; Hebden, L.; Rangan, A.; Allman-Farinelli, M. The development, application, and validation of a healthy eating index for australian adults (HEIFA-2013). Nutrition 2016, 32, 432–440. [Google Scholar] [CrossRef] [PubMed]
- Andrade, S.C.; Previdelli, A.N.; Marchioni, D.M.; Fisberg, R.M. Evaluation of the reliability and validity of the brazilian healthy eating index revised. Rev. Saude Publ. 2013, 47, 675–683. [Google Scholar] [CrossRef] [PubMed]
- Sotos-Prieto, M.; Bhupathiraju, S.N.; Mattei, J.; Fung, T.T.; Li, Y.; Pan, A.; Willett, W.C.; Rimm, E.B.; Hu, F.B. Changes in diet quality scores and risk of cardiovascular disease among US men and women. Circulation 2015, 132, 2212–2219. [Google Scholar] [CrossRef] [PubMed]
- De Koning, L.; Chiuve, S.E.; Fung, T.T.; Willett, W.C.; Rimm, E.B.; Hu, F.B. Diet-quality scores and the risk of type 2 diabetes in men. Diabetes Care 2011, 34, 1150–1156. [Google Scholar] [CrossRef] [PubMed]
- Glanz, K.; Hersey, J.; Cates, S.; Muth, M.; Creel, D.; Nicholls, J.; Fulgoni, V., 3rd; Zaripheh, S. Effect of a nutrient rich foods consumer education program: Results from the nutrition advice study. J. Acad. Nutr. Diet. 2012, 112, 56–63. [Google Scholar] [CrossRef] [PubMed]
- Fung, T.T.; Pan, A.; Hou, T.; Chiuve, S.E.; Tobias, D.K.; Mozaffarian, D.; Willett, W.C.; Hu, F.B. Long-term change in diet quality is associated with body weight change in men and women. J. Nutr. 2015, 145, 1850–1856. [Google Scholar] [CrossRef] [PubMed]
- Livingstone, K.M.; McNaughton, S.A. Diet quality is associated with obesity and hypertension in australian adults: A cross sectional study. BMC Public Health 2016, 16, 1037. [Google Scholar] [CrossRef] [PubMed]
- Yuan, Y.-Q.; Li, F.; Dong, R.-H.; Chen, J.-S.; He, G.-S.; Li, S.-G.; Chen, B. The development of a chinese healthy eating index and its application in the general population. Nutrients 2017, 9, 977. [Google Scholar] [CrossRef] [PubMed]
- Popkin, B.M.; Du, S.; Zhai, F.; Zhang, B. Cohort profile: The china health and nutrition survey—Monitoring and understanding socio-economic and health change in china, 1989–2011. Int. J. Epidemiol. 2010, 39, 1435–1440. [Google Scholar] [CrossRef] [PubMed]
- Xu, X.; Hall, J.; Byles, J.; Shi, Z. Dietary pattern is associated with obesity in older people in china: Data from china health and nutrition survey (CHNS). Nutrients 2015, 7, 8170–8188. [Google Scholar] [CrossRef] [PubMed]
- Wang, S.S.; Lay, S.; Yu, H.N.; Shen, S.R. Dietary guidelines for Chinese residents (2016): Comments and comparisons. J. Zhejiang Univ. Sci. B 2016, 17, 649–656. [Google Scholar] [CrossRef] [PubMed]
- Chinese Medical Association Geriatric Branch; Editorial Department of the Chinese Journal of Geriatrics. Standard on chinese healthy elderly (2013). Chin. J. Geriatr. 2013, 32, 801. [Google Scholar]
- Looman, M.; Feskens, E.J.; de Rijk, M.; Meijboom, S.; Biesbroek, S.; Temme, E.H.; de Vries, J.; Geelen, A. Development and evaluation of the dutch healthy diet index 2015. Public Health Nutr. 2017, 20, 2289–2299. [Google Scholar] [CrossRef] [PubMed]
- McKnight, P.E.; Najab, J. Mann-Whitney U Test. In The Corsini Encyclopedia of Psychology; John Wiley & Sons, Inc.: New York, NY, USA, 2010. [Google Scholar]
- Jolliffe, I.; Jolliffe, N.A. Principal component analysis. In Springer Series in Statistics, 2nd ed.; Springer: New York, NY, USA, 2002. [Google Scholar]
- Guenther, P.M.; Kirkpatrick, S.I.; Reedy, J.; Krebs-Smith, S.M.; Buckman, D.W.; Dodd, K.W.; Casavale, K.O.; Carroll, R.J. The healthy eating index-2010 is a valid and reliable measure of diet quality according to the 2010 dietary guidelines for Americans. J. Nutr. 2014, 144, 399–407. [Google Scholar] [CrossRef] [PubMed]
- Sakia, R.M. The box-cox transformation technique: A review. J. R. Stat. Soc. 1992, 41, 169–178. [Google Scholar] [CrossRef]
- Fulgoni, V.L., 3rd; Keast, D.R.; Drewnowski, A. Development and validation of the nutrient-rich foods index: A tool to measure nutritional quality of foods. J. Nutr. 2009, 139, 1549–1554. [Google Scholar] [CrossRef] [PubMed]
- Guenther, P.M.; Reedy, J.; Krebs-Smith, S.M.; Reeve, B.B. Evaluation of the healthy eating index-2005. J. Am. Diet. Assoc. 2008, 108, 1854–1864. [Google Scholar] [CrossRef] [PubMed]
- Yang, G.; Wang, Y.; Zeng, Y.; Gao, G.F.; Liang, X.; Zhou, M.; Wan, X.; Yu, S.; Jiang, Y.; Naghavi, M.; et al. Rapid health transition in china, 1990–2010: Findings from the global burden of disease study 2010. Lancet 2013, 381, 1987–2015. [Google Scholar] [CrossRef]
- Li, Y.; Wang, D.D.; Ley, S.H.; Vasanti, M.; Howard, A.G.; He, Y.; Hu, F.B. Time trends of dietary and lifestyle factors and their potential impact on diabetes burden in China. Diabetes Care 2017, 40, 1685–1694. [Google Scholar] [CrossRef] [PubMed]
- Nicklas, T. Assessing diet quality in children and adolescents. J. Am. Diet. Assoc. 2004, 104, 1383–1384. [Google Scholar] [CrossRef] [PubMed]
- Darmon, N.; Drewnowski, A. Does social class predict diet quality? Am. J. Clin. Nutr. 2008, 87, 1107–1117. [Google Scholar] [PubMed]
- Van Lee, L.; Geelen, A.; van Huysduynen, E.J.; de Vries, J.H.; van’t Veer, P.; Feskens, E.J. The dutch healthy diet index (DHD-index): An instrument to measure adherence to the dutch guidelines for a healthy diet. Nutr. J. 2012, 11, 49. [Google Scholar] [CrossRef] [PubMed]
- Julia, C.; Touvier, M.; Mejean, C.; Ducrot, P.; Peneau, S.; Hercberg, S.; Kesse-Guyot, E. Development and validation of an individual dietary index based on the british food standard agency nutrient profiling system in a french context. J. Nutr. 2014, 144, 2009–2017. [Google Scholar] [CrossRef] [PubMed]
- McNaughton, S.A.; Ball, K.; Crawford, D.; Mishra, G.D. An index of diet and eating patterns is a valid measure of diet quality in an australian population. J. Nutr. 2008, 138, 86–93. [Google Scholar] [CrossRef] [PubMed]
- Dodd, K.W.; Guenther, P.M.; Freedman, L.S.; Subar, A.F.; Kipnis, V.; Midthune, D.; Tooze, J.A.; Krebs-Smith, S.M. Statistical methods for estimating usual intake of nutrients and foods: A review of the theory. J. Am. Diet. Assoc. 2006, 106, 1640–1650. [Google Scholar] [CrossRef] [PubMed]
- Tooze, J.A.; Midthune, D.; Dodd, K.W.; Freedman, L.S.; Krebs-Smith, S.M.; Subar, A.F.; Guenther, P.M.; Carroll, R.J.; Kipnis, V. A new statistical method for estimating the usual intake of episodically consumed foods with application to their distribution. J. Am. Diet. Assoc. 2006, 106, 1575–1587. [Google Scholar] [CrossRef] [PubMed]
- Yang, Y.-X.; He, M.; Pan, X.-C. China Food Composition, 1st ed.; Peking University Medical Press: Beijing, China, 2004. [Google Scholar]
- Yang, Y.-X.; Wang, G.-Y.; Pan, X.-C. China Food Composition, 2nd ed.; Peking University Medical Press: Beijing, China, 2009. [Google Scholar]


| Evaluation Item | Analysis Question | Analysis Strategy |
|---|---|---|
| Validity | ||
| Content validity | Does the CHEI catch the various key aspects of diet quality specified in the Dietary Guidelines for Chinese (DGC)-2016? | Compared the CHEI components against the key recommendations of the DGC-2016. |
| Construct validity | Does a higher CHEI score link with a lower exposure to confirmed dietary risk factors among the Chinese population? | Estimated the intakes of selected food groups by quintiles of the CHEI scores. |
| Does the index give high scores to recommended menus for different gender and age groups? | Computed scores for exemplary menus developed for adult men, adult women, the healthy elderly, and young children. | |
| Does the index distinguish between groups with known differences in diet quality? | Compared component and total scores of smokers and non-smokers, people with higher and lower education levels and people living in urban and rural areas. | |
| Does the index assess diet quality independent of diet quantity? | Estimated the correlations between component scores and energy intake. | |
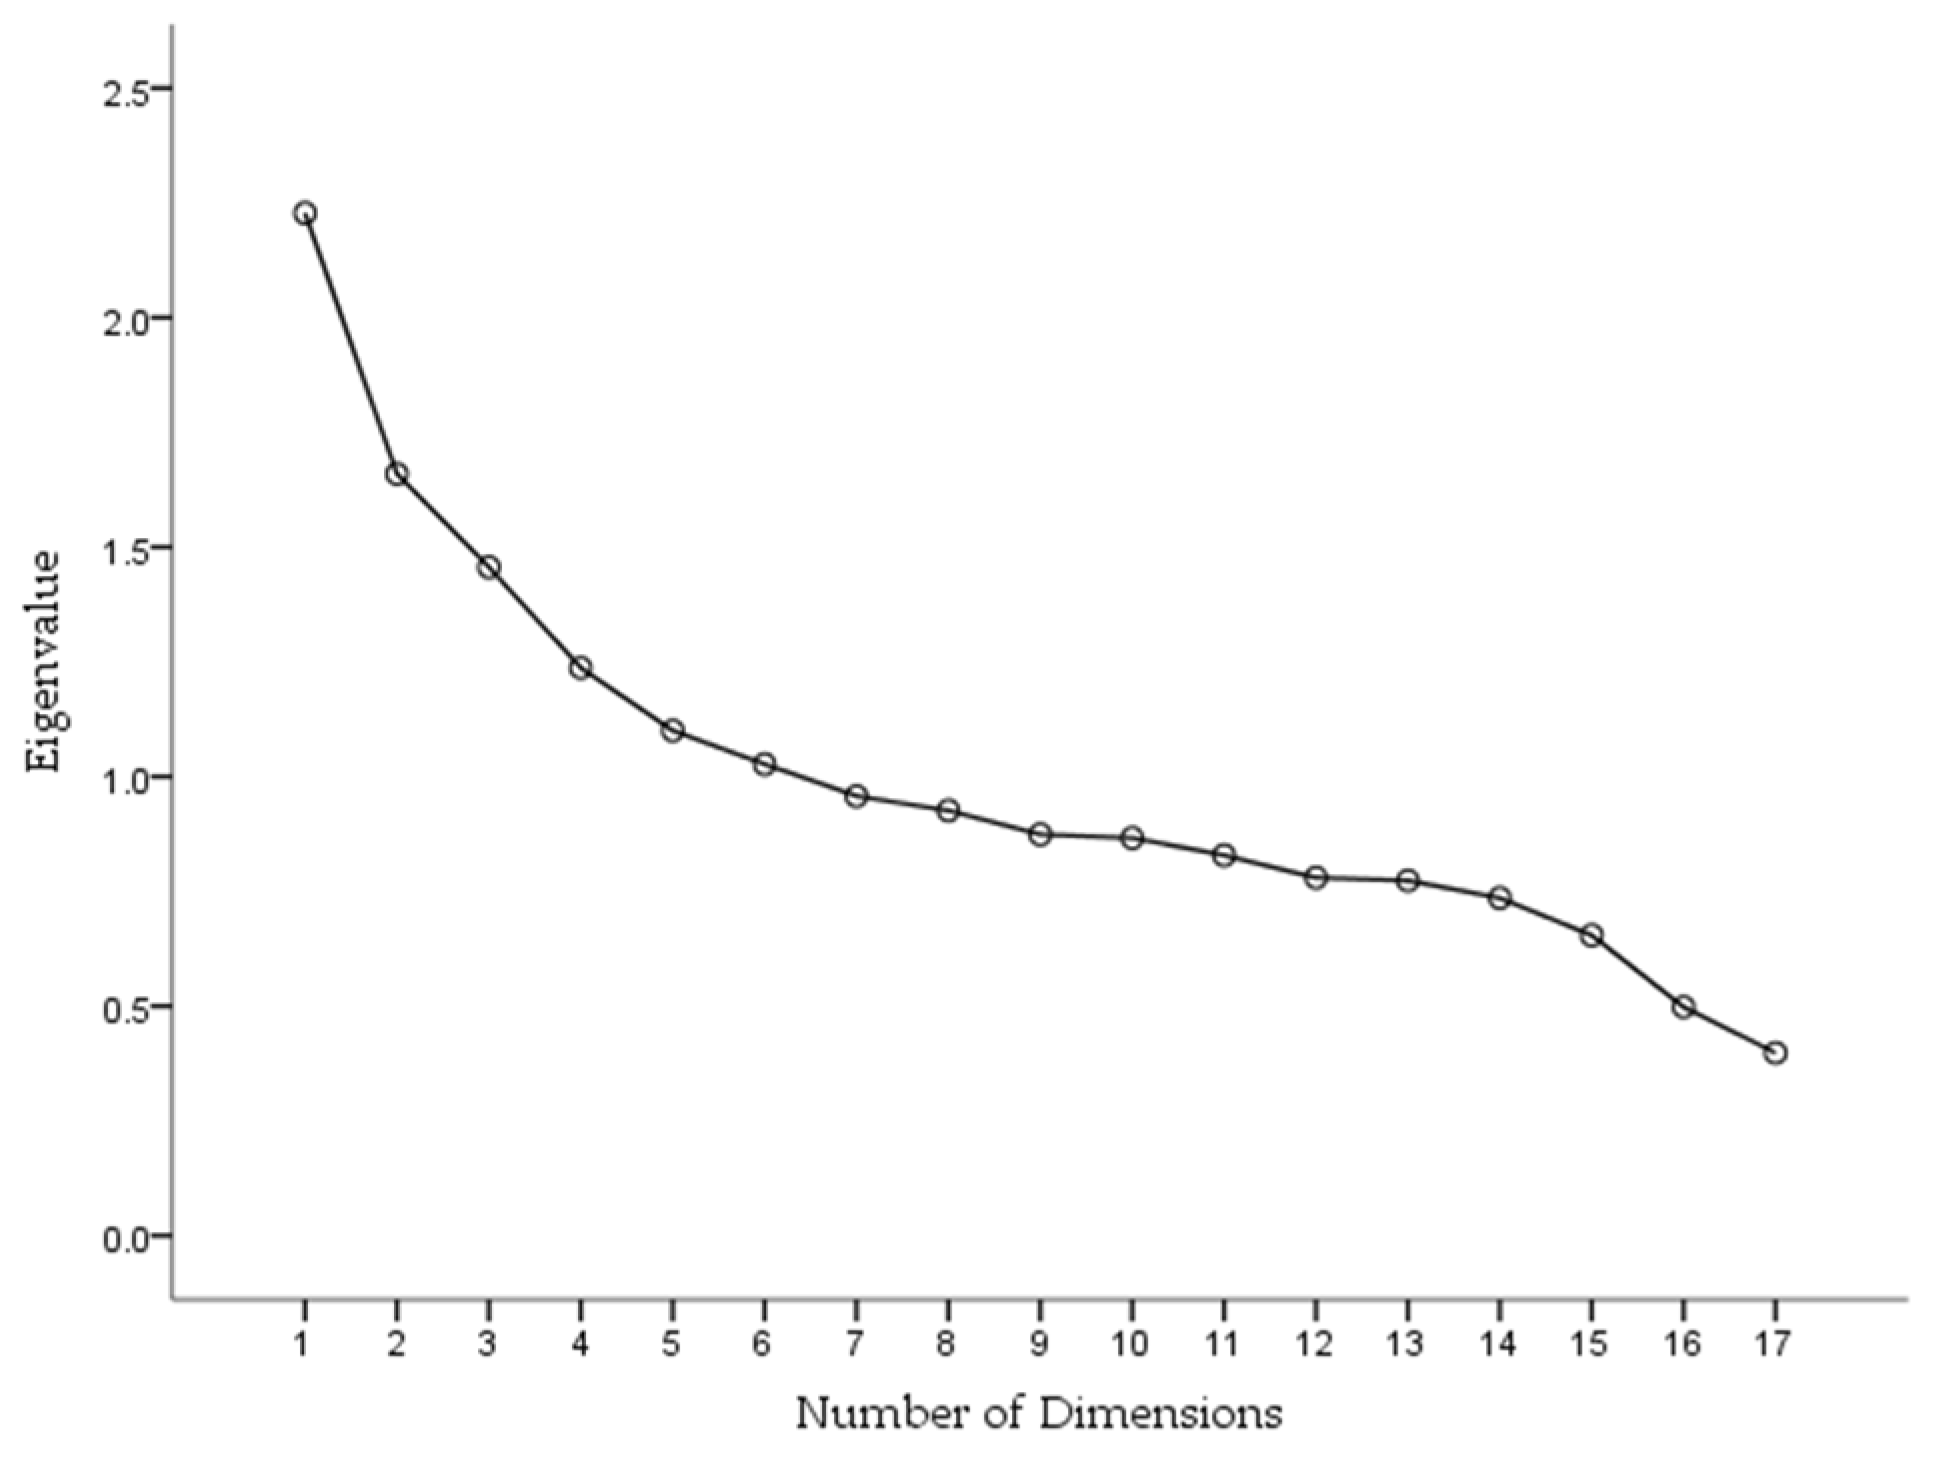
| How many dimensions does the CHEI have? | Used a principal components analysis to estimate the underlying structure of the index. | |
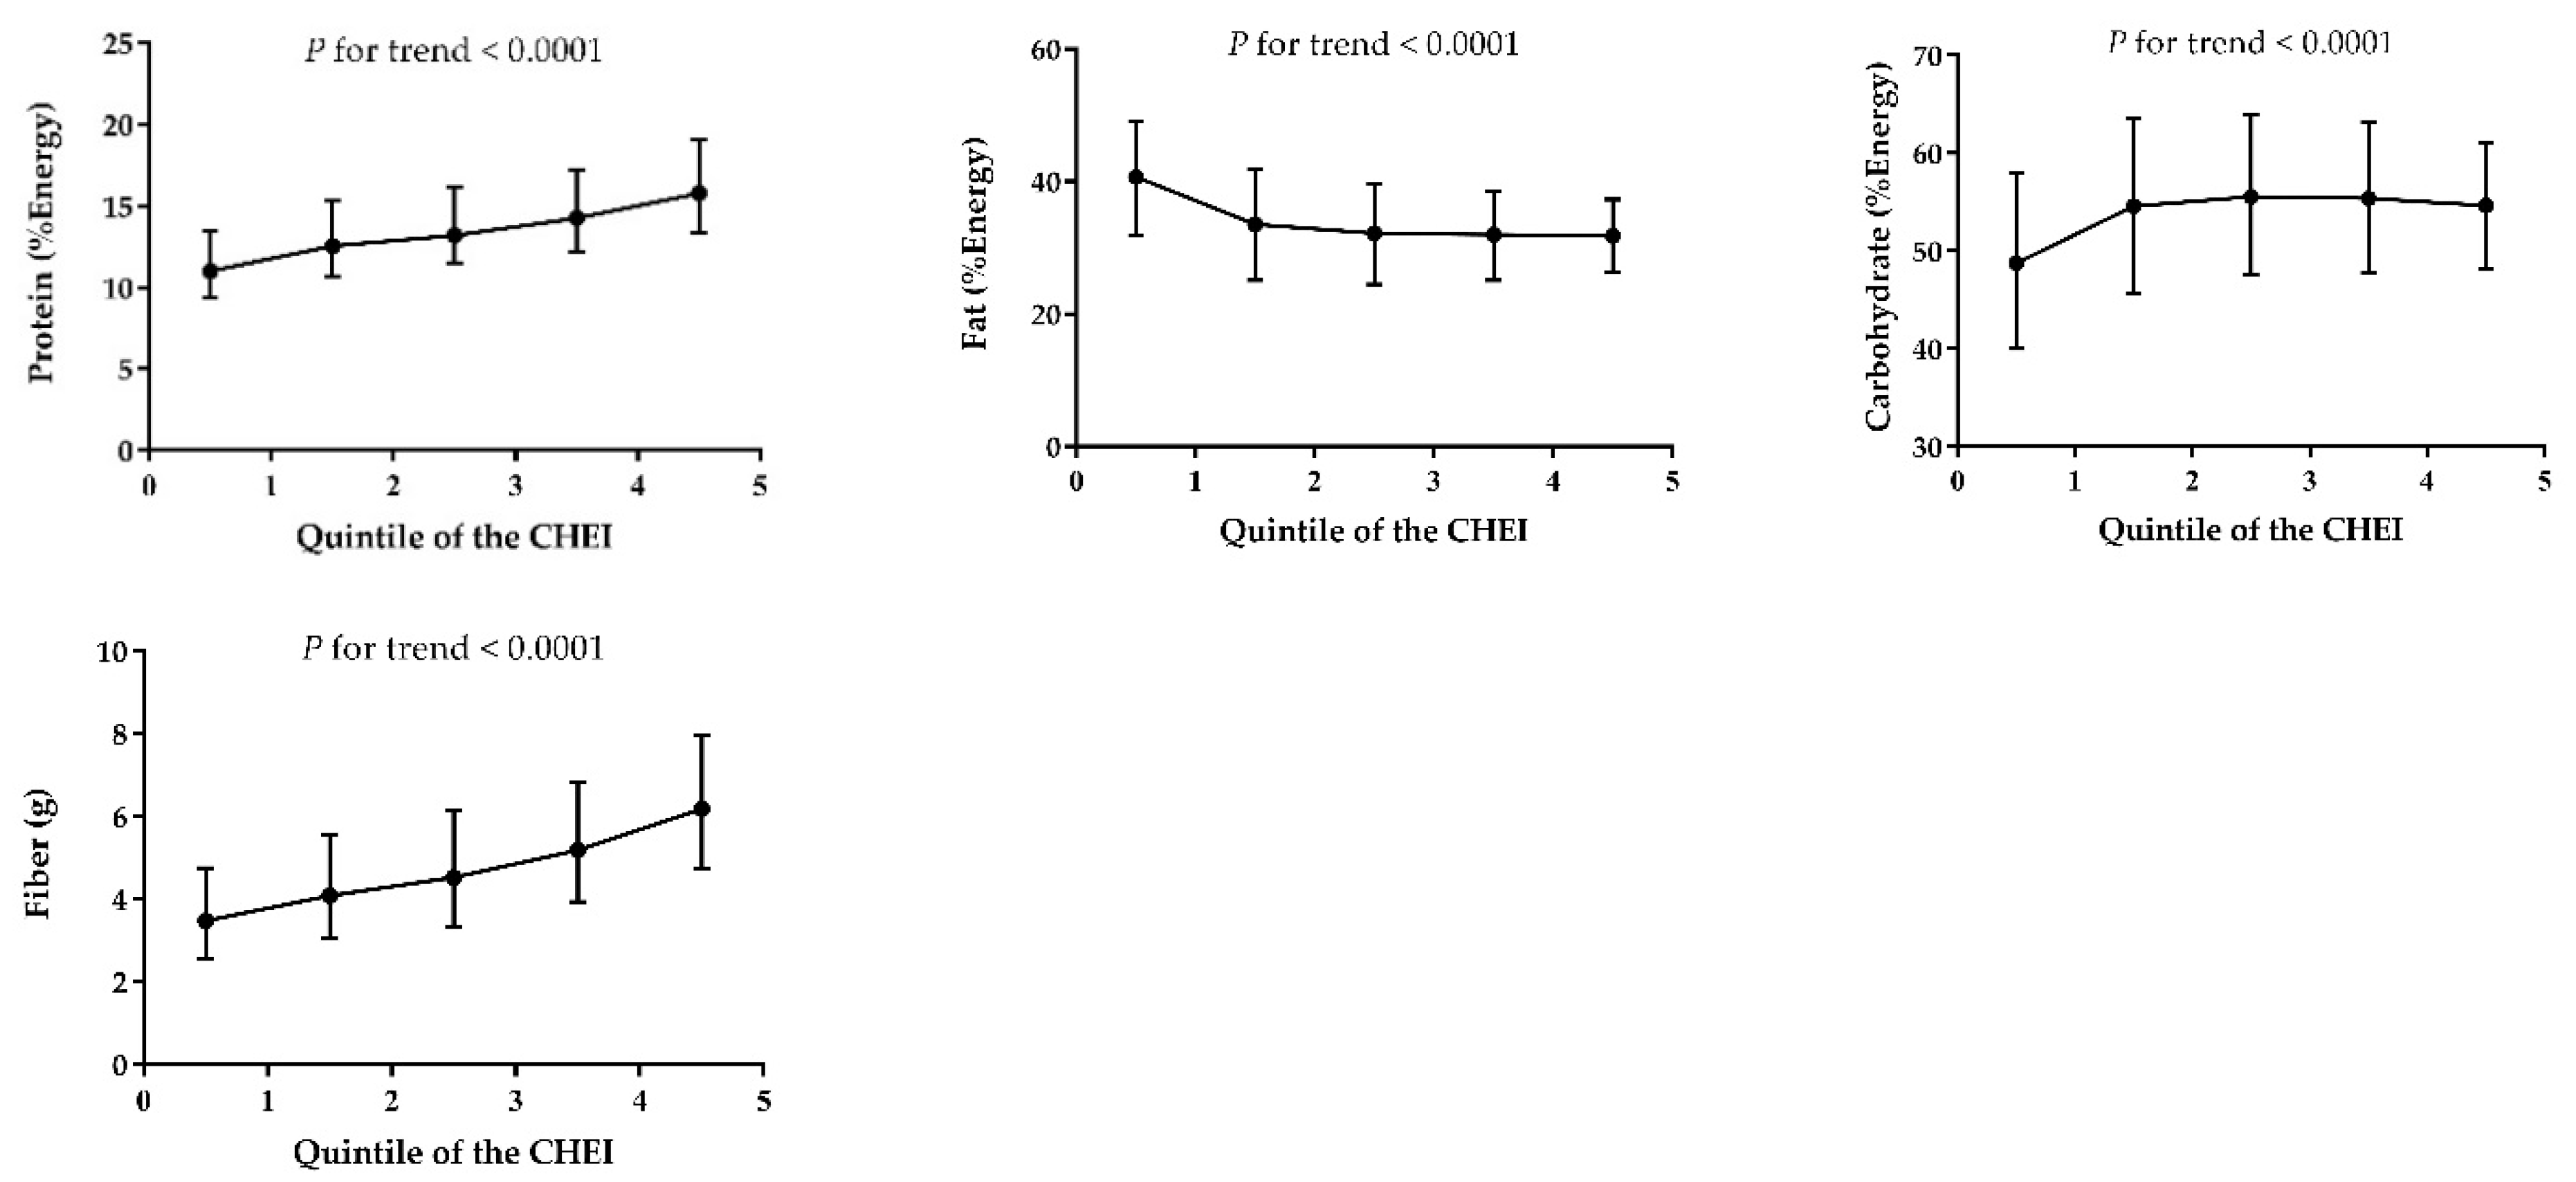
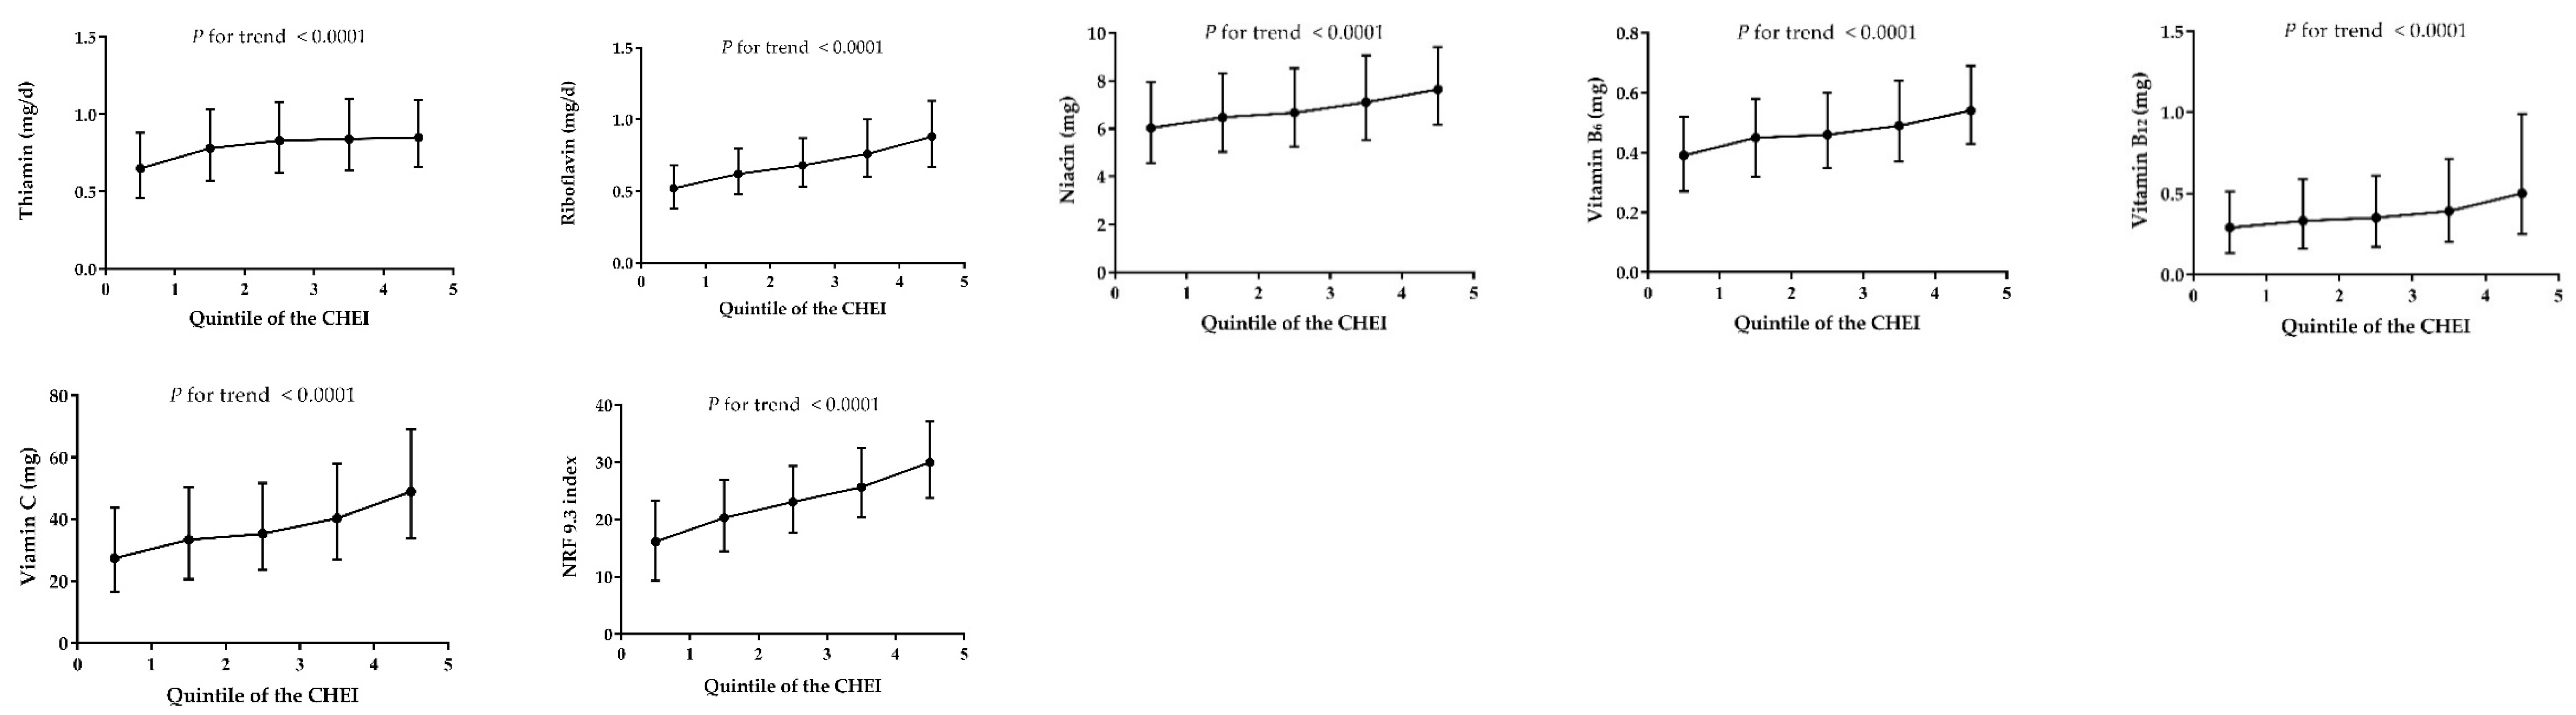
| What are the associations between the index and nutrient intakes? | Compared nutrient intakes across the quintiles of the CHEI score and examined the Pearson correlations between the index and each of the nutrients. | |
| Reliability | ||
| Internal consistency | How is the internal consistency of the index? | Estimated the Cronbach’s coefficient α. |
| What are the correlations among the CHEI components? | Estimated Spearman correlations between each of the component scores. | |
| Which component has the biggest impact on the total score? | Estimated Spearman correlations between each component and the sum of all others. |
| Quintile of the CHEI | ||||||
|---|---|---|---|---|---|---|
| Selected Food Groups | Q1 (n = 2494) | Q2 (n = 2495) | Q3 (n = 2495) | Q4 (n = 2495) | Q5 (n = 2494) | P for Trend 1 |
| CHEI score | 38.02 | 46.89 | 52.45 | 58.21 | 68.01 | |
| Whole grains (g/1000 kcal per day) | 7.54 | 9.69 | 12.58 | 13.21 | 16.53 | <0.0001 |
| Refine grains (g/1000 kcal per day) | 208.23 | 209.50 | 203.13 | 197.06 | 179.48 | <0.0001 |
| Dairy products (g/1000 kcal per day) | 4.05 | 6.89 | 9.58 | 18.08 | 41.11 | <0.0001 |
| Seed and nuts (g/1000 kcal per day) | 0.86 | 1.20 | 2.20 | 3.05 | 5.54 | <0.0001 |
| Fruits (g/1000 kcal per day) | 7.81 | 15.08 | 27.30 | 44.75 | 79.07 | <0.0001 |
| Vegetables (g/1000 kcal per day) | 145.48 | 154.22 | 156.78 | 159.96 | 167.43 | <0.0001 |
| Fish and seafood (g/1000 kcal per day) | 7.70 | 9.85 | 11.58 | 14.64 | 21.98 | <0.0001 |
| Red meat (g/1000 kcal per day) | 39.69 | 41.88 | 39.41 | 40.71 | 38.22 | 0.039 |
| Exemplary Menus * | ||||
|---|---|---|---|---|
| CHEI Component (Maximum Score) | Adult Women 1 | Adult Men 2 | The Healthy Elderly 3 | Young Children 4 |
| Total grains (5) | 5.0 | 5.0 | 5.0 | 2.8 |
| Whole grains and mixed beans (5) | 5.0 | 5.0 | 5.0 | 3.3 |
| Tubers (5) | 5.0 | 5.0 | 5.0 | 5.0 |
| Total vegetables (5) | 5.0 | 5.0 | 5.0 | 5.0 |
| Dark vegetables (5) | 5.0 | 5.0 | 5.0 | 5.0 |
| Fruits (10) | 10.0 | 10.0 | 10.0 | 10.0 |
| Dairy (5) | 5.0 | 5.0 | 5.0 | 5.0 |
| Soybeans (5) | 5.0 | 5.0 | 5.0 | 5.0 |
| Fish and seafood (5) | 5.0 | 5.0 | 5.0 | 3.3 |
| Poultry (5) | 5.0 | 5.0 | 5.0 | 5.0 |
| Eggs (5) | 5.0 | 5.0 | 5.0 | 5.0 |
| Seeds and nuts (5) | 5.0 | 5.0 | 5.0 | 5.0 |
| Red meat (5) | 5.0 | 4.8 | 5.0 | 3.7 |
| Cooking oils (10) | 10.0 | 10.0 | 10.0 | 10.0 |
| Sodium (10) | 9.7 | 10.0 | 9.1 | 8.1 |
| Added sugars (5) | 5.0 | 5.0 | 5.0 | 5.0 |
| Alcohol (5) | 5.0 | 5.0 | 5.0 | 5.0 |
| Total score 5 (100) | 99.7 | 99.8 | 99.1 | 91.2 |
| CHEI Component | Smokers (n = 2604) | Non-Smokers (n = 9869) | Education Year < 9 years (n = 8364) | Education Year ≥ 9 years (n = 4109) | Rural Area (n = 7347) | Urban Area (n = 5126) |
|---|---|---|---|---|---|---|
| Total grains | 4.55 ± 0.02 | 4.57 ± 0.01 | 4.64 ± 0.01 | 4.42 ± 0.01 ** | 4.72 ± 0.01 | 4.35 ± 0.01 ** |
| Whole grains and mixed beans | 0.89 ± 0.03 | 1.00 ± 0.02 * | 0.95 ± 0.02 | 1.03 ± 0.02 ** | 0..95 ± 0.02 | 1.01 ± 0.02 ** |
| Tubers | 2.23 ± 0.04 | 2.23 ± 0.02 | 2.22 ± 0.02 | 2.30 ± 0.03 * | 2.28 ± 0.03 | 2.19 ± 0.03 |
| Total vegetables | 3.77 ± 0.03 | 3.89 ± 0.01 ** | 3.87 ± 0.01 | 3.85 ± 0.02 | 3.77 ± 0.02 | 4.01 ± 0.02 ** |
| Dark vegetables | 2.47 ± 0.04 | 2.59 ± 0.02 * | 2.50 ± 0.02 | 2.68 ± 0.03 ** | 2.28 ± 0.02 | 2.96 ± 0.03 ** |
| Fruits | 2.33 ± 0.06 | 2.99 ± 0.04 ** | 2.36 ± 0.04 | 3.86 ± 0.06 ** | 2.31 ± 0.04 | 3.61 ± 0.05 ** |
| Dairy | 0.60 ± 0.03 | 0.72 ± 0.02 ** | 0.42 ± 0.01 | 1.25 ± 0.03 ** | 0.26 ± 0.01 | 1.30 ± 0.03 ** |
| Soybeans | 2.38 ± 0.04 | 2.49 ± 0.02 | 2.36 ± 0.02 | 2.69 ± 0.03 ** | 2.31 ± 0.03 | 2.68 ± 0.03 ** |
| Fish and seafood | 1.60 ± 0.04 | 1.57 ± 0.02 | 1.35 ± 0.02 | 2.04 ± 0.03 ** | 1.30 ± 0.02 | 1.97 ± 0.03 ** |
| Poultry | 1.53 ± 0.04 | 1.54 ± 0.01 | 1.32 ± 0.02 | 1.98 ± 0.04 ** | 1.26 ± 0.02 | 1.92 ± 0.03 ** |
| Eggs | 2.40 ± 0.04 | 2.41 ± 0.02 | 2.17 ± 0.02 | 2.87 ± 0.03 ** | 2.13 ± 0.02 | 2.77 ± 0.03 ** |
| Seeds and nuts | 0.92 ± 0.04 | 1.02 ± 0.02 | 0.86 ± 0.02 | 1.28 ± 0.03 ** | 0.82 ± 0.02 | 1.24 ± 0.03 ** |
| Red meat | 2.76 ± 0.03 | 2.97 ± 0.02 * | 3.11 ± 0.02 | 2.54 ± 0.03 ** | 3.16 ± 0.02 | 2.58 ± 0.02 ** |
| Cooking oils | 7.67 ± 0.07 | 7.49 ± 0.04 * | 7.29 ± 0.04 | 8.01 ± 0.05 ** | 7.47 ± 0.04 | 7.62 ± 0.05 ** |
| Sodium | 6.63 ± 0.06 | 6.35 ± 0.03 ** | 6.21 ± 0.02 | 6.82 ± 0.05 ** | 6.36 ± 0.04 | 6.47 ± 0.05 * |
| Added sugars | 4.41 ± 0.03 | 4.35 ± 0.02 | 4.51 ± 0.02 | 4.07 ± 0.03 ** | 4.59 ± 0.01 | 4.03 ± 0.03 ** |
| Alcohol | 4.61 ± 0.03 | 4.85 ± 0.01 ** | 4.77 ± 0.01 | 4.82 ± 0.01 | 4.75 ± 0.01 | 4.86 ± 0.01 ** |
| Total score 2 | 51.74 ± 0.21 | 52.97 ± 0.01 ** | 50.88 ± 0.11 | 56.48 ± 0.17 ** | 50.74 ± 0.11 | 55.55 ± 0.16 ** |
| CHEI Component | Total Grains | Whole Grains and Mixed Beans | Tubers | Total Vegetables | Dark Vegetables | Fruits | Dairy | Soybeans | Fish and Seafood | Poultry | Eggs | Seeds and Nuts | Red Meat | Cooking Oils | Sodium | Added Sugars | Alcohol | Total Score 1 | Energy |
|---|---|---|---|---|---|---|---|---|---|---|---|---|---|---|---|---|---|---|---|
| Total grains | 1 | ||||||||||||||||||
| Whole grains and mixed beans | 0.06 * | 1 | |||||||||||||||||
| Tubers | −0.08 * | 0.12 * | 1 | ||||||||||||||||
| Total vegetables | −0.13 * | −0.09 * | −0.05 * | 1 | |||||||||||||||
| Dark vegetables | −0.18 * | −0.10 * | −0.16 * | 0.46 * | 1 | ||||||||||||||
| Fruits | −0.17 * | 0.13 * | 0.08 * | 0.06 * | 0.05 * | 1 | |||||||||||||
| Dairy | −0.30 * | 0.10 * | 0.04 * | −0.01 | 0.06 * | 0.29 * | 1 | ||||||||||||
| Soybeans | −0.12 * | −0.02 | 0.07 * | 0.01 | −0.03 | 0.05 * | 0.07 * | 1 | |||||||||||
| Fish and seafood | −0.22 * | −0.08 * | −0.05 * | 0.08 * | 0.13 * | 0.14 * | 0.18 * | 0.06 * | 1 | ||||||||||
| Poultry | −0.13 * | −0.04 * | −0.08 * | 0.01 | 0.14 * | 0.10 * | 0.12 * | −0.02 | 0.18 * | 1 | |||||||||
| Eggs | −0.17 * | −0.07 * | 0.12 * | 0.04 * | 0.05 * | 0.20 * | 0.26 * | 0.07 * | 0.12 * | 0.00 | 1 | ||||||||
| Seeds and nuts | −0.17 * | 0.12 * | 0.05 * | −0.03 * | 0.02 | 0.20 * | 0.17 * | 0.03 * | 0.08 * | 0.06 * | 0.09 * | 1 | |||||||
| Red meat | 0.33 * | 0.17 * | 0.14 * | −0.08 * | −0.20 * | −0.04 * | −0.10 * | −0.01 | −0.12 * | −0.12 * | 0.00 | 0.01 | 1 | ||||||
| Cooking oils | 0.24 * | 0.05 * | 0.03 * | −0.02 | 0.00 | 0.14 * | 0.10 * | 0.04 * | 0.03 * | 0.12 * | 0.05 * | 0.07 * | −0.14 * | 1 | |||||
| Sodium | 0.05 * | 0.02 | −0.04 * | −0.02 | 0.03 * | 0.08 * | 0.10 * | 0.04 * | 0.04 * | 0.06 * | −0.01 | 0.07 * | −0.13 * | 0.28 * | 1 | ||||
| Added sugars | 0.21 * | −0.03 * | −0.02 | −0.01 | −0.05 * | −0.17 * | −0.33 * | −0.05 * | −0.15 * | −0.12 * | −0.15 * | −0.18 * | −0.02 | −0.04 | 0.03 * | 1 | |||
| Alcohol | 0.09 * | 0.00 | −0.02 | 0.04 * | 0.07 * | 0.04 * | 0.05 * | −0.03 * | −0.02 | −0.03 | 0.02 | −0.05 * | −0.01 | −0.06 * | −0.07 * | −0.04 * | 1 | ||
| Total score 1 | −0.10 * | 0.10 * | 0.04 | 0.08 * | 0.07 * | 0.27 * | 0.25 * | 0.06 * | 0.13 * | 0.10 * | 0.15 * | 0.15 * | −0.13 * | 0.22 * | 0.14 * | −0.20 * | −0.03 * | 1 | |
| Energy | 0.10 * | 0.06 | −0.04 * | −0.13 * | −0.14 | −0.03 * | −0.04 * | 0.03 * | −0.03 * | 0.02 | −0.10 * | 0.12 * | −0.01 | 0.14 * | 0.34 * | 0.05 * | −0.18 * | 0.10 * | 1 |
| Nutrients | Pearson Correlations Model 2 | |||
|---|---|---|---|---|
| Coefficent 1 | P | Coefficent 2 | P | |
| Macronutrients | ||||
| Protein | 0.354 | <0.0001 | 0.420 | <0.0001 |
| Fat | −0.105 | <0.0001 | −0.243 | <0.0001 |
| Carbohydrates | 0.164 | <0.0001 | 0.155 | <0.0001 |
| Dietary fiber | 0.391 | <0.0001 | 0.408 | <0.0001 |
| Micronutrients | ||||
| Calcium | 0.423 | <0.0001 | 0.407 | <0.0001 |
| Iron | 0.271 | <0.0001 | 0.269 | <0.0001 |
| Phosphorus | 0.369 | <0.0001 | 0.489 | <0.0001 |
| Magnesium | 0.322 | <0.0001 | 0.366 | <0.0001 |
| Potassium | 0.431 | <0.001 | 0.492 | <0.001 |
| Sodium | −0.305 | <0.001 | −0.360 | <0.001 |
| Selenium | 0.349 | <0.0001 | 0.368 | <0.0001 |
| Zinc | 0.244 | <0.0001 | 0.263 | <0.0001 |
| Vitamin A | 0.284 | <0.0001 | 0.260 | <0.0001 |
| Vitamin E | −0.054 | <0.0001 | −0.119 | <0.0001 |
| Thiamine | 0.241 | <0.0001 | 0.248 | <0.0001 |
| Riboflavin | 0.437 | <0.0001 | 0.455 | <0.0001 |
| Niacin | 0.246 | <0.0001 | 0.221 | <0.0001 |
| Vitamin B-6 | 0.281 | <0.0001 | 0.285 | <0.0001 |
| Vitamin B-12 | 0.214 | <0.0001 | 0.199 | <0.0001 |
| Vitamin C | 0.339 | <0.0001 | 0.313 | <0.0001 |
| NRF 9.3 3 | 0.397 | <0.0001 | ||
© 2018 by the authors. Licensee MDPI, Basel, Switzerland. This article is an open access article distributed under the terms and conditions of the Creative Commons Attribution (CC BY) license (http://creativecommons.org/licenses/by/4.0/).
Share and Cite
Yuan, Y.-Q.; Li, F.; Wu, H.; Wang, Y.-C.; Chen, J.-S.; He, G.-S.; Li, S.-G.; Chen, B. Evaluation of the Validity and Reliability of the Chinese Healthy Eating Index. Nutrients 2018, 10, 114. https://doi.org/10.3390/nu10020114
Yuan Y-Q, Li F, Wu H, Wang Y-C, Chen J-S, He G-S, Li S-G, Chen B. Evaluation of the Validity and Reliability of the Chinese Healthy Eating Index. Nutrients. 2018; 10(2):114. https://doi.org/10.3390/nu10020114
Chicago/Turabian StyleYuan, Ya-Qun, Fan Li, Han Wu, Ying-Chuan Wang, Jing-Si Chen, Geng-Sheng He, Shu-Guang Li, and Bo Chen. 2018. "Evaluation of the Validity and Reliability of the Chinese Healthy Eating Index" Nutrients 10, no. 2: 114. https://doi.org/10.3390/nu10020114
APA StyleYuan, Y.-Q., Li, F., Wu, H., Wang, Y.-C., Chen, J.-S., He, G.-S., Li, S.-G., & Chen, B. (2018). Evaluation of the Validity and Reliability of the Chinese Healthy Eating Index. Nutrients, 10(2), 114. https://doi.org/10.3390/nu10020114