Evaluation is done in a twofold mode, namely targeted and non-targeted analysis. Targeted in this case means the identification and quantification of individual compounds, whereas the non-targeted analysis approaches apply statistical methods to detect unexpected deviations or to determine the origin of a sample, the fruit content or the addition of other types of fruit.
2.1. Quantification (Targeted Analysis)
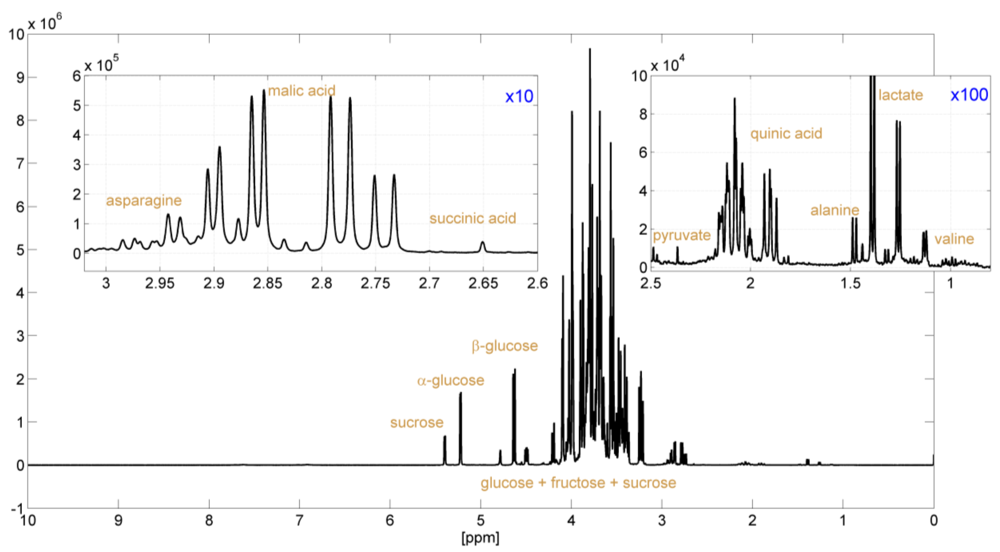
In comparison with reference standards, specific deviations in the concentration of a particular compound or in the profile of a specific combination of compounds may indicate characteristic quality and authenticity problems, such as the addition of sugar. Therefore, the primary interest for the food chemist in the classical fruit juice assessment procedure is the concentrations of various ingredients. The targeted approach provides the identification and quantification of individual compounds. Specific deviations in the concentration of a particular compound or in the profile of a specific combination of compounds may indicate characteristic quality problems. Here, NMR spectroscopy provides a clear advantage over classical analysis techniques as it allows the identification and quantification of many compounds in a mixture simultaneously (
Figure 1). Our quantification routine provides absolute concentrations for more than 28 different compounds depending on the type of juice (
Table 1)
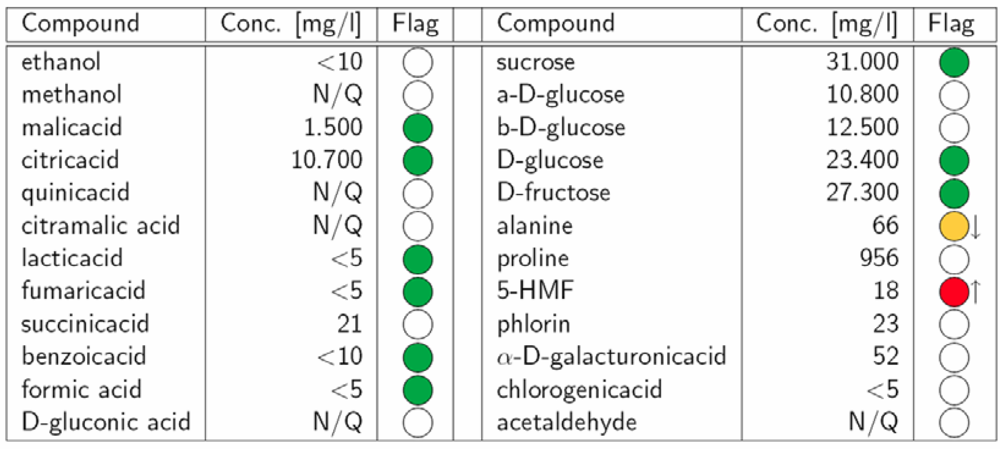
i.e., sucrose, glucose, fructose, proline, alanine, 5-hydroxymethylfurfural (HMF), ethanol, methanol, acetone, phlorin, acetaldehyde, benzaldehyde, acetoine, arbutine and the acids malic, citric, isocitric, chlorogenic, lactic, fumaric, quinic, succinic, citramalic, formic, benzoic, acetic, sorbic, gluconic and galacturonic. Furthermore, various useful relationships between compound concentrations are calculated, e.g. the ratio glucose/fructose or the ratio of sucrose to total sugars.
This large amount of analytical results from one measurement readily enables the detection of frauds like the addition of sugar, exhaustive enzymatic treatment (marker: galacturonic acid), addition of citric acid or lemon juice (e.g., in apple juice), extraction of orange peel (marker: phlorin) or the usage of unripe fruits (e.g., high concentration of quinic acid in apple juice).
Table 1.
SGF Profiling quantification results of an orange juice. The colored flags show agreements with or deviations from reference intervals, which are provided by the European Fruit Juice Association A.I.J.N. (N/Q: Not quantified due to non-detectable signal or insufficient signal assignment).
Table 1.
SGF Profiling quantification results of an orange juice. The colored flags show agreements with or deviations from reference intervals, which are provided by the European Fruit Juice Association A.I.J.N. (N/Q: Not quantified due to non-detectable signal or insufficient signal assignment).
![Nutrients 01 00148 i001]() |
2.2. Statistical Analysis (Non-Targeted)
In addition to compound quantification, an exhaustive statistical analysis is applied to the same data, which is based on a large reference database of more than 6,000 samples of more than 50 different types of fruit juices from more than 50 countries. This reference database is constantly growing. A cascade of statistical tests and classification and discrimination steps is applied to scan for multiple aspects of sample quality.
As a first step, the type of fruit is estimated. The global model can differentiate between 20 types of fruit, namely apple, orange/mandarin, sour cherry, pineapple, black currant, passion fruit, lemon, grapefruit, banana, peach, raspberry, strawberry, pear, apricot, mango, guava, carrot, elderberry, pomegranate and grape. Of course, this information is usually provided with the sample’s metadata and is rarely a reason for complaints, except when orange juice (Citrus sinensis) is mixed with mandarin juice (Citrus reticulata). The latter is often cheaper so that some companies add it to orange juice without declaration (which is not allowed in Europe). With conventional analysis the addition of mandarin juice to orange juice is difficult to detect, but with our NMR methods and models we can detect mandarin juice at a level of 10% or more and therefore allows a screening prior to DNA- or other conventional analyses.
With regard to orange juice as well as apple juice
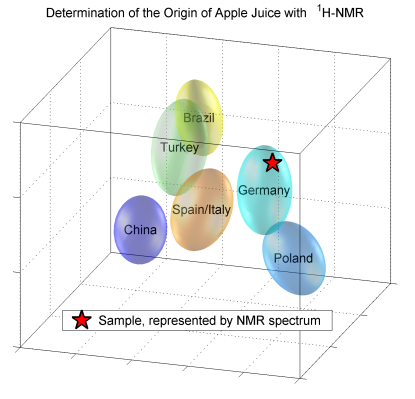
etc. (see below), more specialized models can distinguish between direct juice and juice from concentrate and can detect the origin of the fruit.
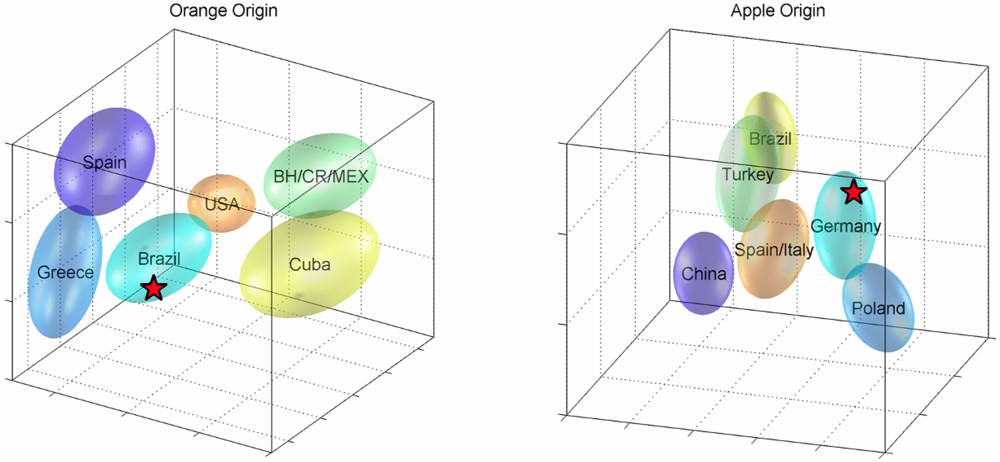
Figure 2 (left panel) shows the results for the estimation of origin for a particular orange juice sample. The possible sources or groups included in the model are Spain, Greece, Brazil, Belize/Mexico/Costa Rica, Cuba and USA - other important origins like Argentina or South Africa will be added when more reference samples are available. A 3D projection of the discrimination model space shows the ellipsoids of probability for each source, and the sample of interest represented by a red star. Similarity factors are calculated in the complete discrimination space and provide the probabilities for the estimation of source (the juice is most likely from Brazil). Up to now, we have developed detailed classification models for orange juice, as shown, apple juice (origin; concentrate vs. direct juice), sour cherry and pineapple. The underlying statistical method is a combination of PCA (principal components analysis) and discrimination analysis [
10]. The accuracy is checked via cross-validation and Monte Carlo analyses [
11].
Figure 2.
Statistical classification models for the determination of the country of origin. The left plot shows the model for orange juices and the right for apple juices (3D-projections of higher-dimensional spaces). Ellipsoids show confidence spheres for reference subgroups. Star represents actual sample.
After the determination of the most likely group assignment, the sample is verified in two steps. First, a univariate analysis compares each spectral region of interest with the reference data set and detects deviations in compound concentrations.
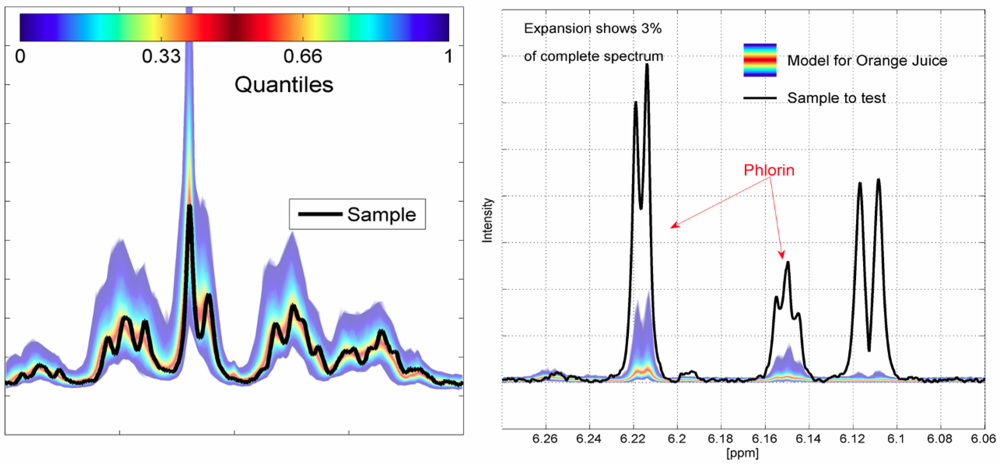
Figure 3 (left panel) shows a spectrum expansion around 2 ppm for a rediluted apple juice from China overlaid on a quantiles plot of the reference spectra; any unusual component concentrations can be easily detected (non-targeted analysis,
Figure 3, right panel). The second approach is a multivariate analysis based on the PCA/SIMCA approach [
10] for detecting deviations which are not apparent in a univariate analysis. If both methods give the same inconspicuous result, the sample is consistent with the models and therefore considered “representative” and has successfully passed the prescreening trial. In this case there is no need to examine the sample further. However, if deviations from normality are detected further analysis also with conventional techniques will be triggered. This non-targeted approach even allows the detection of previously unknown contaminations.
Another important method for verification, in particular for market samples, is the estimation of the fruit content of the juice. Conventionally, this is done by quantifying selected compounds and minerals and comparing these amounts with reference distributions. In NMR screening, hundreds of variables can be measured on the basis of just one spectrum; hence, we can use regression analysis to estimate the fruit content. Our results have shown that such an analysis yields results with a relative accuracy of about 10% for more than 95% of the samples.
Figure 3.
Left panel: Non-targeted verification of the sample (black line) versus the quantile-plot of the respective reference database: apple juice (~1% of spectrum), Right panel: orange juice with high phlorin concentration (indicating over-extraction of the whole orange including its peel).
Figure 3.
Left panel: Non-targeted verification of the sample (black line) versus the quantile-plot of the respective reference database: apple juice (~1% of spectrum), Right panel: orange juice with high phlorin concentration (indicating over-extraction of the whole orange including its peel).


