1. Introduction
Landslides are one of the major geo-hazards that pose great threats to many areas around the world. Landslides are widely distributed in the mountainous areas of western China [
1,
2]. Especially after the Wenchuan Earthquake in 2008 in China (Mw 7.9 or Ms 8.0), a large number of landslides were triggered and received considerable attention [
3]. Numerous villages are scattered throughout this large-scale landslide-prone area, which raises great importance to identify potential active landslides. It is quite common for a large storm to produce new landslides in this area since the earthquake occurred. A positive and effective monitoring tool that can help find the hidden nature of large-scale landslides and minimize the unexpectedness is of great importance for landslide early warning and early recognition.
Measurements of the ground surface deformation over large regions can be carried out by using the Spaceborne Synthetic Aperture Radar (SAR) techniques. In particular, Differential Interferometric Synthetic Aperture Radar (DInSAR) is an effective method to measure deformation in landslides. The successful application of this technique in landslide monitoring has been widely documented [
4,
5]. However, several problems hinder the exploitation of the DInSAR technique in landslide monitoring. These limitations include spatial decorrelation due to long perpendicular baselines between SAR acquisitions, decorrelation caused by vegetation coverage changes, large deformation gradients, errors resulting from atmospheric phase screen (APS) and phase unwrapping errors. Advanced DInSAR methods have also been developed to address some of the aforementioned issues, including Permanent Scatterer-InSAR [
6,
7], SqueeSAR [
8], Small Baseline Subset (SBAS) [
9,
10], the Stanford method for Persistent Scatterers (StaMPS) [
11,
12] and interferometric point target analysis (IPTA) [
13,
14]. These techniques use phase shift analysis of long time-series SAR images to investigate landslides with low displacement velocities (mm/year to a few decimeters/year) [
15].
However, there is difficulty for the DInSAR techniques to retrieve deformation information in relatively fast-moving areas. For example, when rapid landslides occur in densely-vegetated areas, the low spatial density of persistent scatterers (PS) makes phase unwrapping extremely difficult, resulting in the unsuccessful detection of fast movement. To identify rapid movement with velocities exceeding the limits of DInSAR and the associated techniques, the exploitation of amplitude information from the SAR data using the pixel offset tracking technique demonstrated its advantage in landslide monitoring. For example, XiaoFan et al. [
16] applied a sub-pixel offset technique to TerraSAR Spotlight data to monitor the Shuping landslide in the Three Gorges of China. Singleton et al. [
17] used sub-pixel offset techniques to monitor episodic landslide movements in vegetated terrain. Shi et al. [
18] used multi-mode high-resolution TerraSAR-X data to monitor landslide deformation with point-like target offset tracking. Raspini et al. [
19] exploited the amplitude information in SAR images to map the Montescaglioso landslide. Bhattacharya et al. [
20] evaluated the potential of SAR intensity tracking to estimate the displacement rate in a landslide-prone area in India.
In general, a giant complex landslide consists not only of slow-moving areas, such as creeping and deep-seated gravitational slope deformation, but also of fast-moving areas exhibiting non-linear slope movement, such as toppling and rotational landslides. Thus, the movement of the entire landslide may vary considerably and exhibit non-uniform behavior, indicating that no single method would be sufficient for such a complex task. Moreover, a quick monitoring response may be necessary before a long series of a SAR dataset would be accumulated. Additionally, the monitoring method should benefit from an integrated analysis of phase-based and amplitude-based methods.
In this article, a hybrid-SAR technique is proposed and applied to a representative giant complex landslide in southwestern China using a high-resolution TerraSAR-X Stripmap dataset. Both phase-based and amplitude-based techniques are applied to obtain the landslide displacements. Then, the application circumstances and influential factors of phase-based and amplitude-based methods are evaluated according to four aspects: (1) quality of terrain visibility to the radar sensor; (2) landslide deformation magnitude and different sliding mode; (3) impact of dense vegetation cover; and (4) sliding direction sensitivity. Specifically, the surface displacements measured by the in situ sensors of four boreholes were used in the evaluation of the hybrid-SAR technique. The deformation tendencies from both the SAR data and the in situ data showed consistency. The applicability of this new hybrid-SAR technique in complex giant landslide research is demonstrated and evaluated.
2. Methodology Comparison of Phase-Based and Amplitude-Based Techniques
Phase-based InSAR techniques and amplitude-based offset tracking methods have their advantages and limitations.
Table 1 provides a brief comparison of these two methods according to their methodological differences. The following section provides a more comprehensive methodological analysis of the two techniques.
2.1. Phase Based: DInSAR and Advanced DInSAR Techniques
The phase-based InSAR techniques have high accuracy in monitoring displacements, and the accuracy is proportional to the wavelength. Thus, these techniques are suitable for monitoring slow rates of deformation. The traditional DInSAR technique has been applied to monitor slow-moving landslides on the order of cm/year, while the advanced time-series DInSAR technique can detect extremely slow-moving landslides on the order of mm/year.
Because of its methodological limitations, the DInSAR technique is unable to derive fast-moving displacements with high spatial gradients. In a wrapped interferogram, the maximum displacement between neighboring pixels cannot exceed λ/2, where λ is the wavelength [
21]. Furthermore, when considering phase unwrapping, the maximum displacement between neighboring pixels cannot exceed λ/4, that is the highest deformation gradient should be less than 0.5 interferometric fringes per pixel [
22]. DInSAR also has a serious limitation related to dense vegetation, which results in rapid decorrelation between SAR acquisitions. For high-resolution TerraSAR-X satellites, the wavelength is smaller and more sensitive to vegetation cover. Moreover, its sensitivity to atmospheric variability also hinders its exploitation in landside monitoring.
To mitigate the limitations of DInSAR, advanced DInSAR techniques have been developed and include permanent scatterer interferometry (PSInSAR) and small baseline subset (SBAS) [
23]. PSInSAR makes use of stable permanent scatterer pixels that show high coherence during long time intervals in a stacking of multi-temporal co-registered images. SBAS chooses image combinations with short temporal and spatial baselines to reduce decorrelation effects. However, in thickly-vegetated areas, a low density of PS and the loss of coherence can produce unreliable phase unwrapping errors, which may result in the failure of these techniques.
2.2. Amplitude Based: Pixel Offset Technique
Because of its methodological limitations, the amplitude-based pixel offset technique has lower accuracy compared with phase-based InSAR methods. The key processing step of the pixel offset tracking method is to obtain the peak locations for a two-dimensional cross-correlation function of two SAR image patches. Signal-to-noise ratio (SNR) estimates are then calculated by comparing the height of the correlation peak relative to the average level of the correlation function. Serving as indicators of the confidence level of each offset, the SNR values should be set with a threshold, and only the SNR values above the threshold should be used to calculate the offsets. Furthermore, the orbital ramp errors, the topographical errors and the ionospheric effects should be eliminated. At the end, the final range and azimuth offsets can be estimated by measuring the row and column offsets between two acquisitions. During the processing, various parameters, such as the cross-correlation window size and oversampling factor, should be carefully evaluated to adjust to the size of deformation features and SAR image pixel size [
24].
The achievable accuracy could be theoretically expressed as the following expression [
25]:
where
γ is the coherence and
N is the number of pixels within the estimation window.
The offset tracking technique is suitable for monitoring high rates of deformation, e.g., rapid landslides on the order of m/year, and the accuracy is proportional to the pixel size of the SAR image. This method does not require phase unwrapping, is less sensitive to temporal decorrelation and is not affected by atmospheric artifacts. Furthermore, pixel offset measurements can provide both range and azimuth vectors as the InSAR technique is only sensitive to the line-of-sight (LOS) direction.
3. Study Area and SAR Dataset
3.1. Geological Setting of the Xishancun Landslide
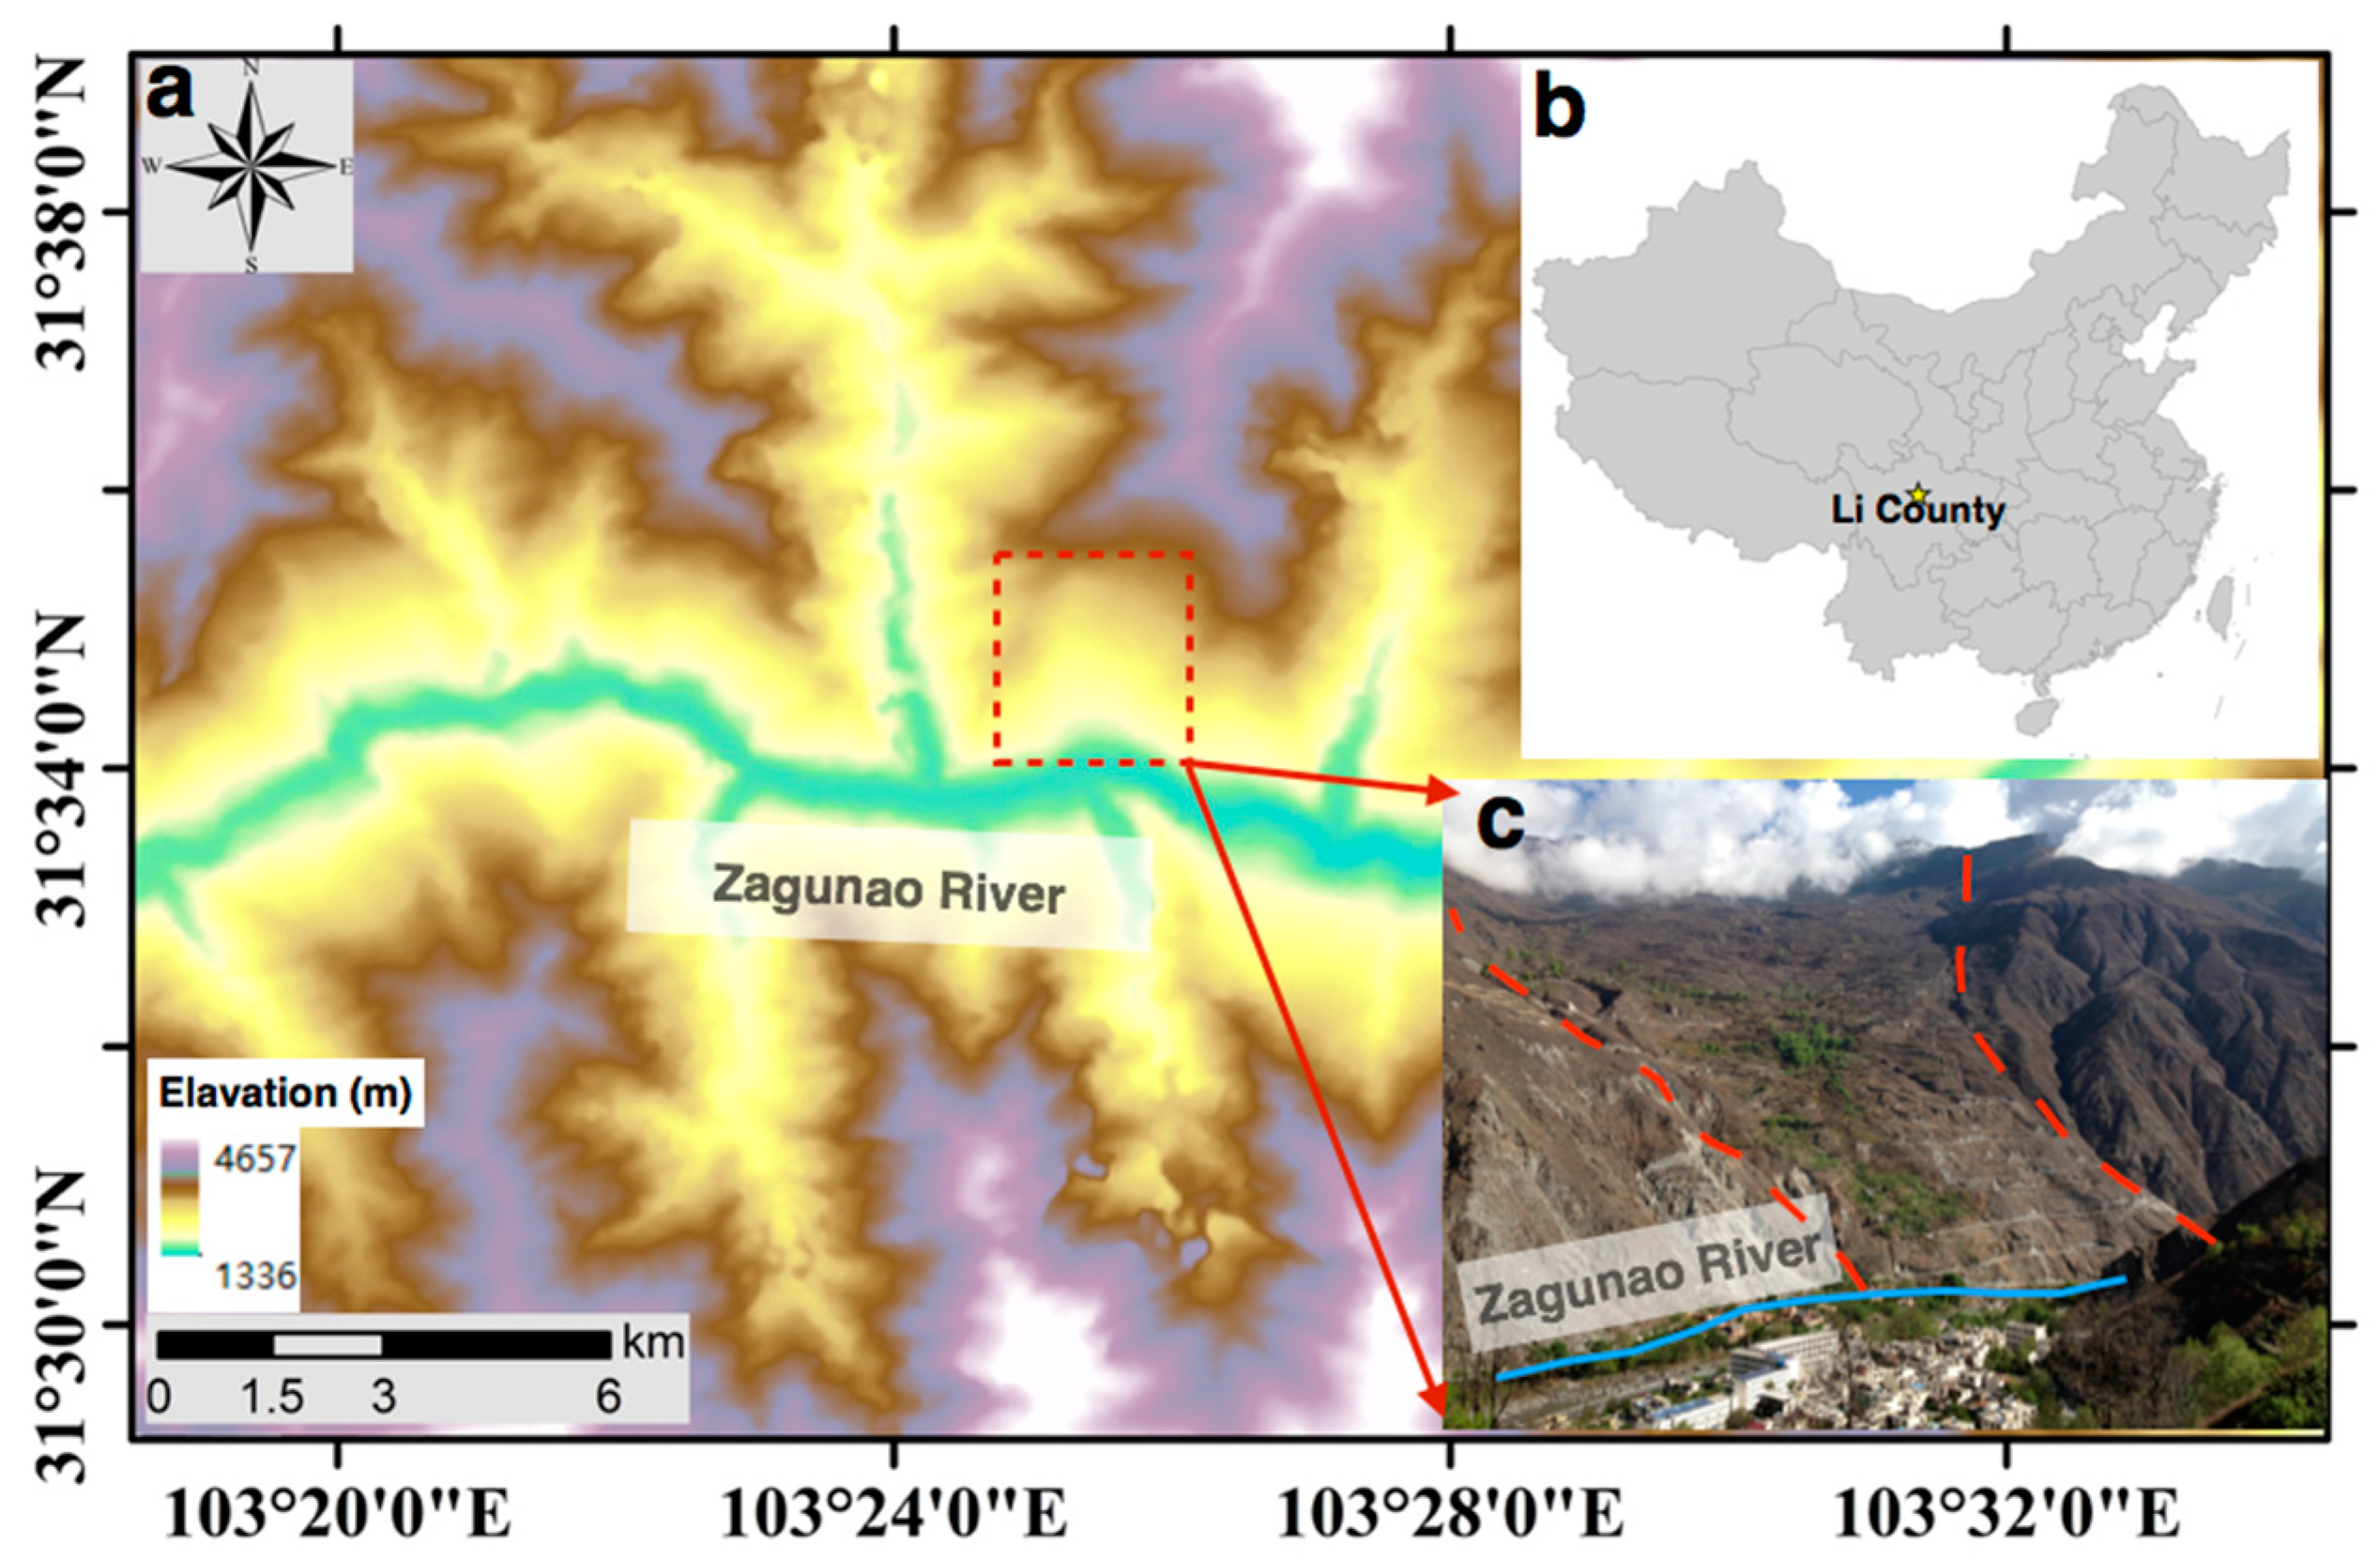
The Xishancun Landslide (
Figure 1) is a giant landslide located on the northern bank of the Zagunao River in Li County (Sichuan Province), which lies to the east of the Tibetan Plateau. The region is featured by active tectonics similar to the other areas surrounded by a river network on the Tibetan Plateau [
26]. The landslide is approximately 22 km from Wenchuan City, and several studies have pointed out that Li County is among the most severe geohazard regions triggered by the Wenchuan earthquake in 2008 [
27,
28]. The Xishancun Landslide is considered to be influenced and accelerated by the Wenchuan Earthquake. Dai et al. [
29] found that several main types of landslides, including shallow disrupted landslides, rock falls, deep-seated landslides and rock avalanches, were triggered by the Wenchuan Earthquake. The Xishancun Landslide can be considered a complex mixture of the above landslide types, involving both slow-moving and fast-moving movements. This landslide poses severe threats to the 317 National Road and those villages both on the slope and at the foot of the mountain.
The Xishancun Landslide is a south-facing slope with erosional textures developed. The geomorphology of this landslide is relatively complex and forms a “V-shaped” valley. The giant thick accumulation body is bounded along the trailing edge by nearly vertical cliffs and along the leading edge by the Zagunao River. Both the eastern and western sides feature gullies that bound these two parts of the landslide. The elevation of the leading edge is approximately 1510 m, and the elevation of the trailing edge is approximately 3300 m. The elevation difference is 1790 m. The landslide length is approximately 3800 m; the minimum width is 680 m; and the maximum width is 980 m. The average thickness of the sliding body is 55 m. Thus, the volume of the landslide is approximately 1.7 × 10⁸ m³. Hence, it is considered as an oversized landslide.
There are many natural terraces in the landslide, and the terraces on the trailing edge and middle parts are much larger. The slope of the landslide body ranges from 25° to 55°, and steep slopes are mainly developed along the front part. Vegetation on the majority of the landslide body is scarce. However, due to the catchment function of the “V-shaped” geomorphology in the lower part and abundant water resources, groundwater is relatively accessible, and vegetation is present, with fruit trees and crops flourishing here, as well. The dense vegetation cover in the western part significantly limits the application of DInSAR in this area. Because of the construction of village roads on the mountain, the slopes cut into the toe along the leading edge are significant and form severe scarps that lead to collapses in some areas. The complexity of the topographic conditions and landslide slopes are considered to be the major factors resulting in the occurrence of geological hazards and were aggravated by the Wenchuan Earthquake.
This landslide is also less sensitive to displacement measurements along LOS due to the south-facing orientation. The complex landslide behaviors provide a good opportunity for the joint application of both the phase-based InSAR method and the amplitude-based pixel offset method.
3.2. Geotechnical Monitoring
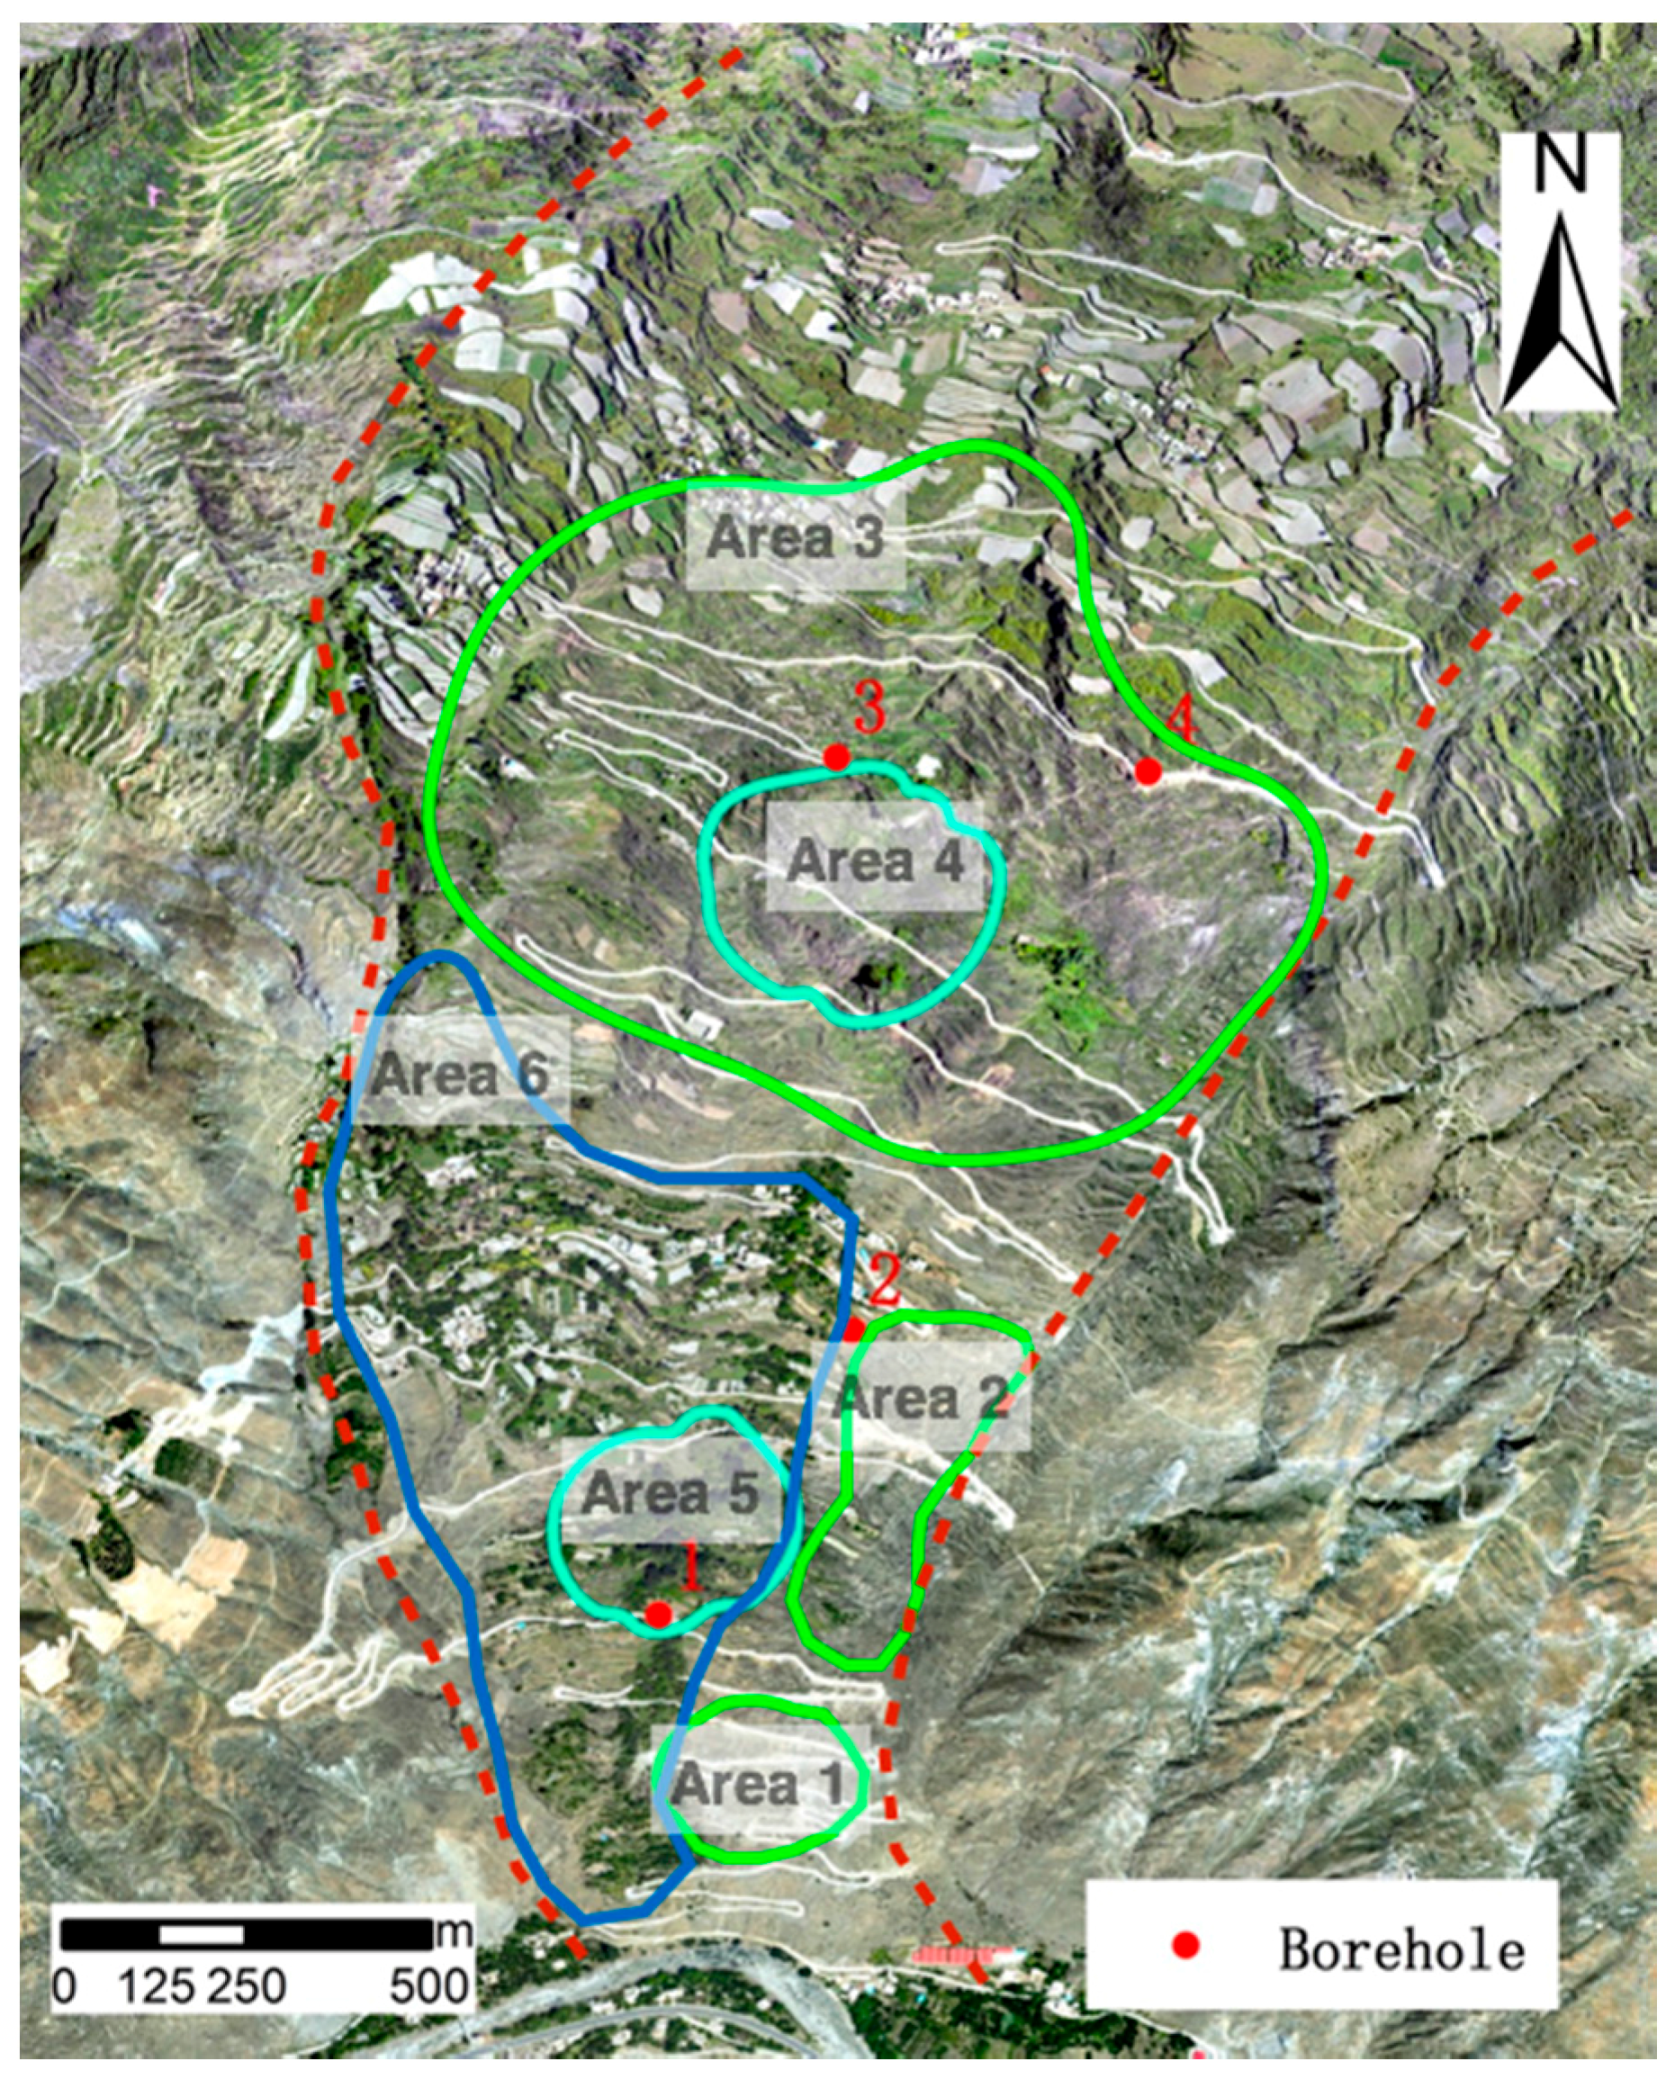
To monitor the landslide with geotechnical equipment, a Spatial Sensor Network similar to the MUNOLD (Multi-Sensor Network for Observing Landslide Disaster) raised by Lu et al. [
30] is currently being deployed in Xishancun Landslide. There are four boreholes (Bh1, Bh2, Bh3 and Bh4) located on the lower and middle parts of the landslide and distributed evenly along the slope (
Figure 2). Four artificial corner reflectors are installed just beside the corresponding boreholes, which enable further comparisons (
Section 5.5) between hybrid-SAR-derived borehole surface displacements and in situ sensor measurements. Four inclinometers with tilt sensors monitoring displacement along the main sliding direction have been installed inside the boreholes. The field data technically showed good performance, with a high rate of data return and reliable data access. The noise in the data collected was small and stable, thereby allowing reliable data support for further analysis.
3.3. TerraSAR-X Test Dataset
The acquisition of Stripmap TerraSAR-X data started in 2014. In total, six images of the study area were collected. The parameters of five image pairs used in later hybrid-SAR processing are listed in
Table 2. Basic information on this TerraSAR-X dataset is provided in
Table 3.
4. Analyses and Experimental Results of Hybrid-SAR
4.1. DInSAR Results from Representative Interferometric Pairs
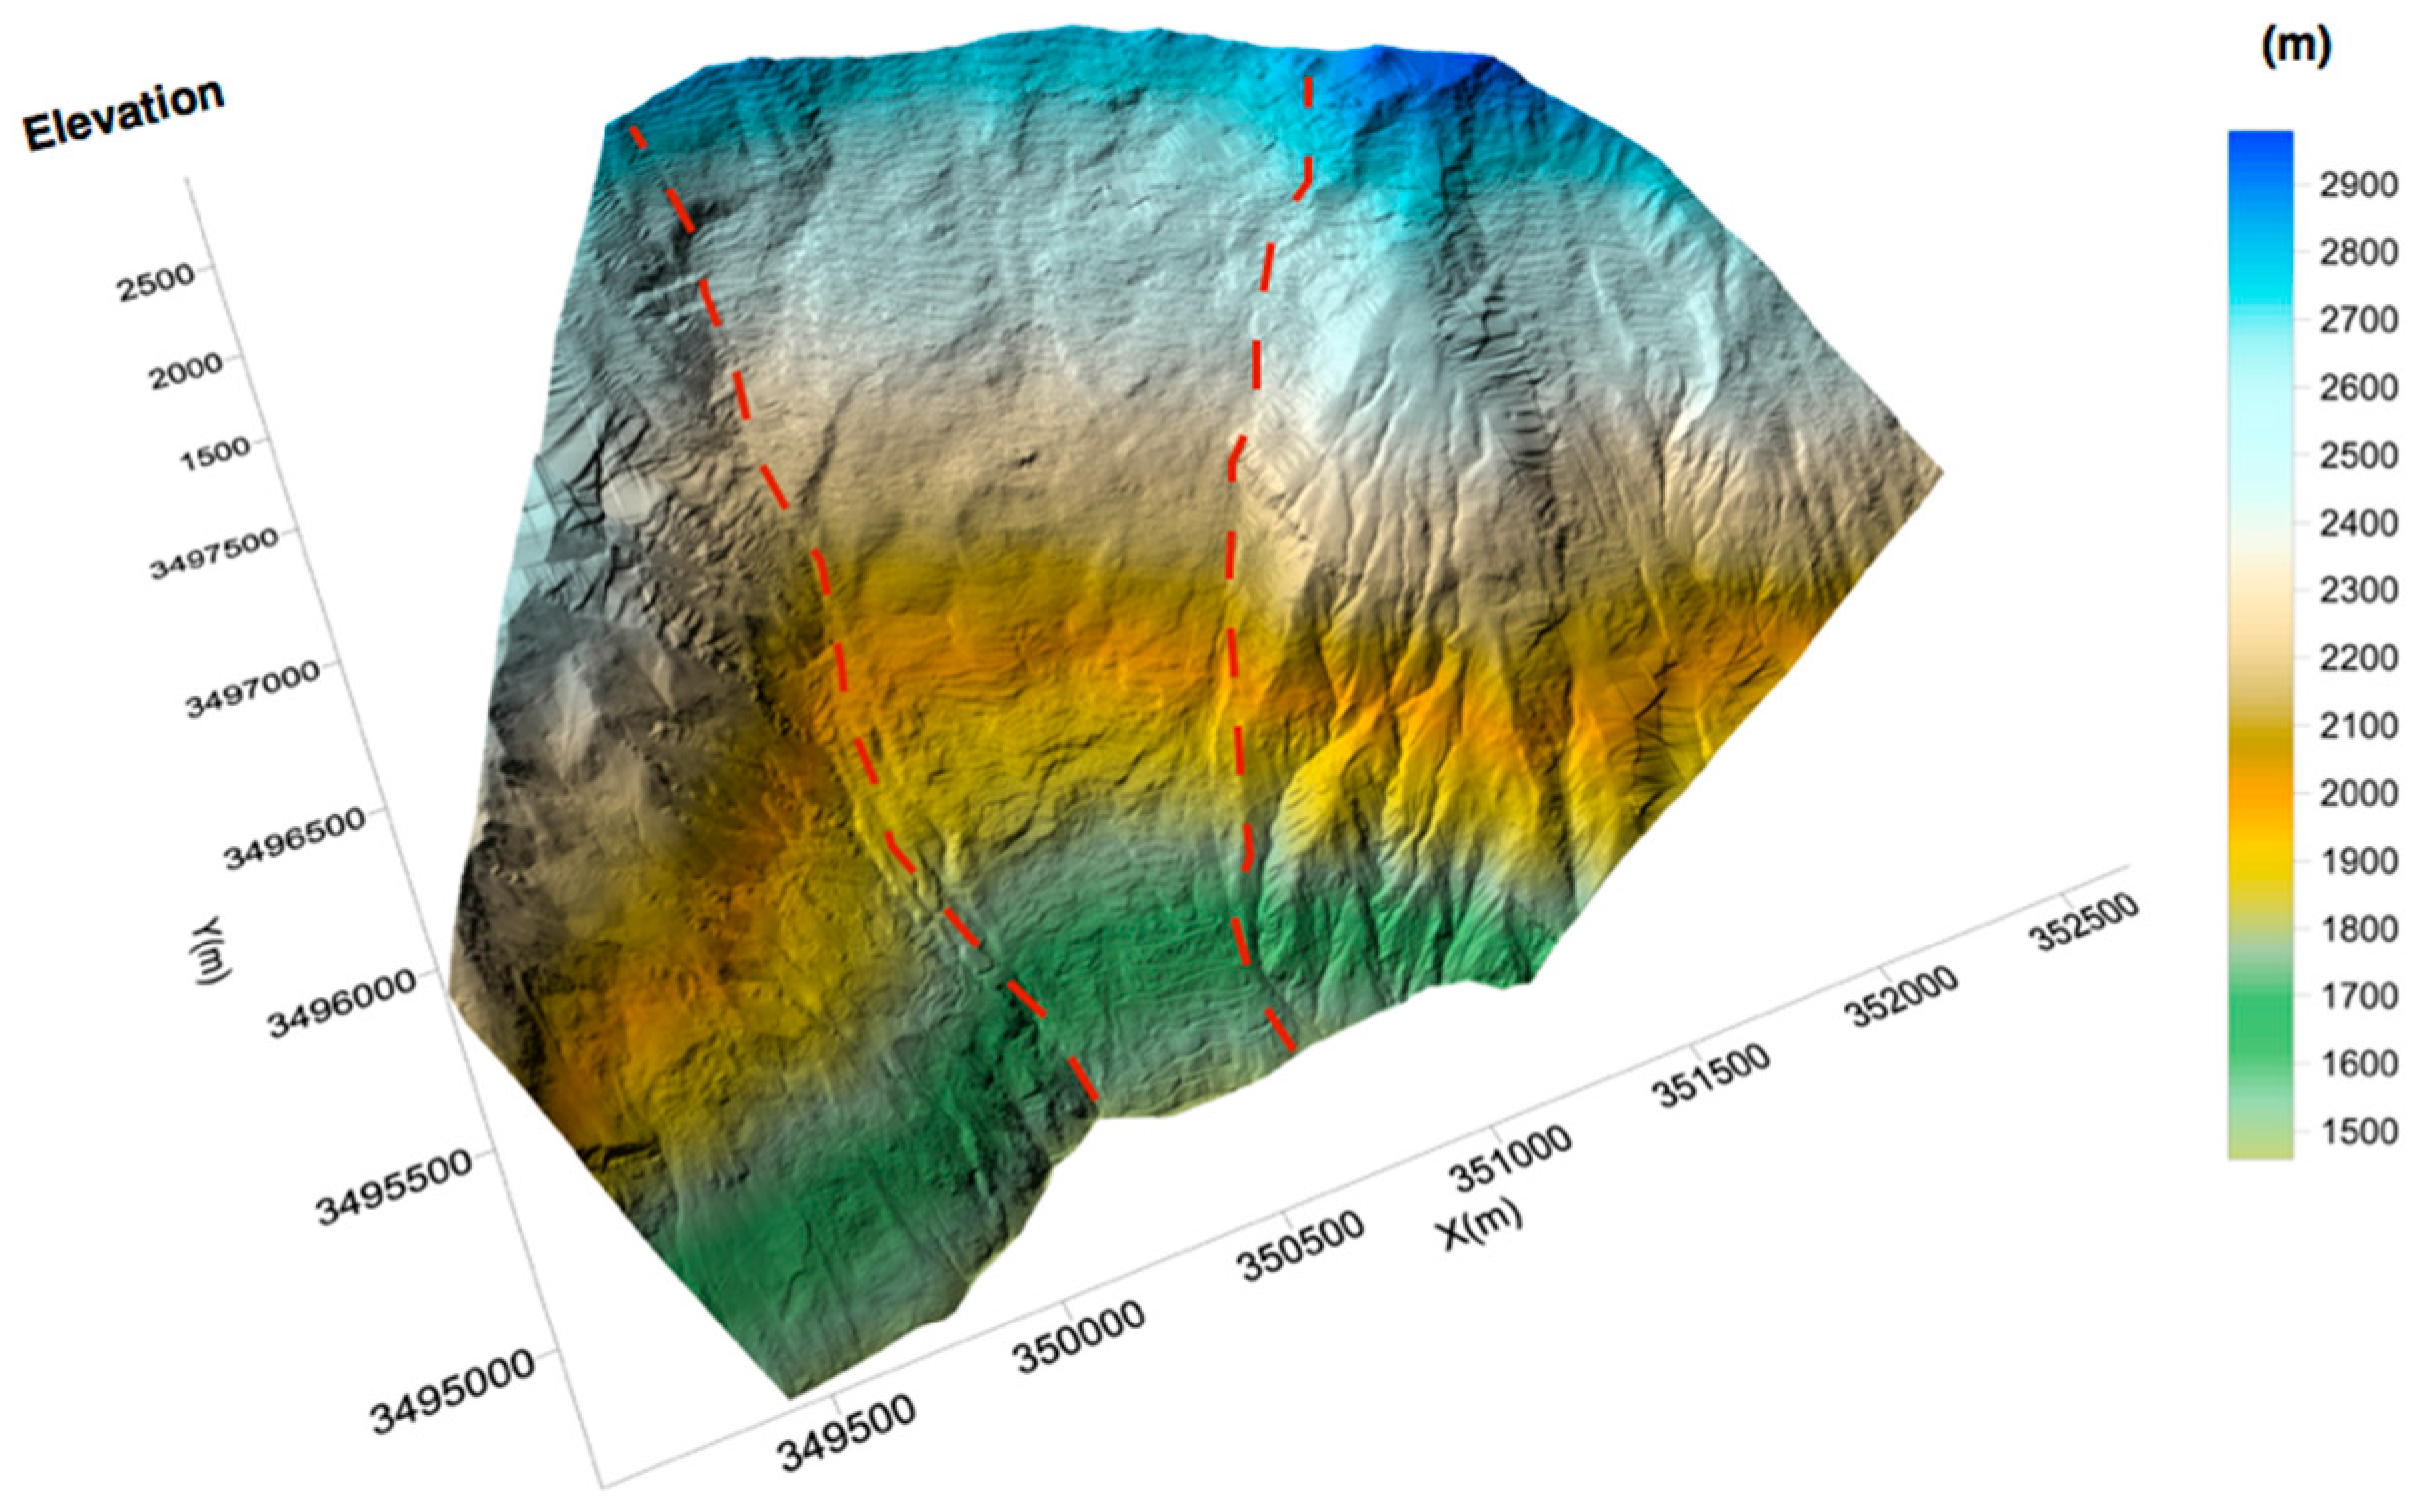
Although limited datasets are not enough to carry out robust time series analyses, rapid identification of actively-deforming areas and early warnings of active regions are urgently needed. In this study, four interferograms with baselines shorter than 190 m and acquisition time intervals shorter than 33 days have been computed. To carry out two-pass differential interferometry, an external digital elevation model (DEM) covering the whole body of this landslide with a posting of 0.5 m produced by terrestrial laser scanning (TLS) was used (
Figure 3). A multi-look factor of two was applied both in the range and in the azimuth directions.
During the winter periods, the interferograms are less noisy, and the fringes caused by displacement can be determined in the interferograms. For example, in
Figure 4a–d, the interferometric signals in the middle part of the landslide (Area 3) are evident. In addition, the eastern border of landslide (Area 2) and a region close to the toe of landslide (Area 1) also preserve good quality fringes in the interferograms. However, in the western part of the lower landslide body (Area 6), the coherence is not as well preserved due to the coverage of high-density vegetation. Additionally, the mountain to the west of the landslide is seriously affected by the layover effect of SAR images. These four interferograms with neighboring time spans show uniform fringe locations and indicate that long-lasting and slow deformation exists in these active regions.
The associated displacement maps are then derived along the LOS direction after performing the phase unwrapping of all interferograms. Because of the dense vegetation cover in the western lower part of this landslide, the coherence became quite low, and this area was masked during the unwrapping procedure in order to obtain a robust result for other parts of the landslide.
Figure 4e–h shows that the maximum displacement in a 33-day time interval can reach up to 2.2 cm in the middle part of the landslide (Area 3) where three neighboring deformation areas can be identified. Moreover, the eastern borderline of the landslide body (Area 2) is quite evident in the displacement map, which provides good support for the interpretation of the landslide division. In the small deformation area close to the landslide toe (Area 1), the displacements showed an extremely slowly increasing tendency. A further detailed interpretation and analysis of deformation modes in Areas 1–3 will be carried out in
Section 5.2.
Although unable to carry out an advanced time series DInSAR application at this stage, the quick response of conventional DInSAR technique over a short time span and its ability to outline the boundary of landslide-prone areas demonstrate the successful application of the phased-based InSAR technique in our landslide research.
4.2. Offset Tracking Results between SAR Acquisitions
In the offset tracking procedure, if the selected perpendicular baselines are quite low and the displacement rate is rather high, the range offsets due to local topography can be neglected with respect to ground displacement. The conventional co-registration procedure is sufficient for most cases where offsets due to topography are less than 0.2 pixels. However, for higher-resolution systems combined with large baselines, these topographical errors can exceed one pixel. In particular, in this study, the displacement gradients should not be this high, and the TerraSAR-X dataset exhibited high resolution and relatively large baselines. During the processing, offsets due to topography are incorporated into a co-registration look-up table that links the geometries of two images based on a DEM of the area. Thus, topography-related offsets were considered and removed.
Using the above approach, we derived two obvious deformation areas on the landslide body from two images in the TerraSAR-X dataset (spanning from 21 November 2014 to 11 March 2015). The results of azimuth and slant range deformation measurements are rendered in
Figure 5. In the slant range displacement map, the geocoded DInSAR displacement result derived from 21 November 2014 to 13 December 2014 is also overlaid in order to make a clear comparison with the pixel offset result. It should be noted that only points with SNR values greater than 10.0 in pixel offset processing are highlighted. These values represent relatively high coherence and high reliability of the measurements.
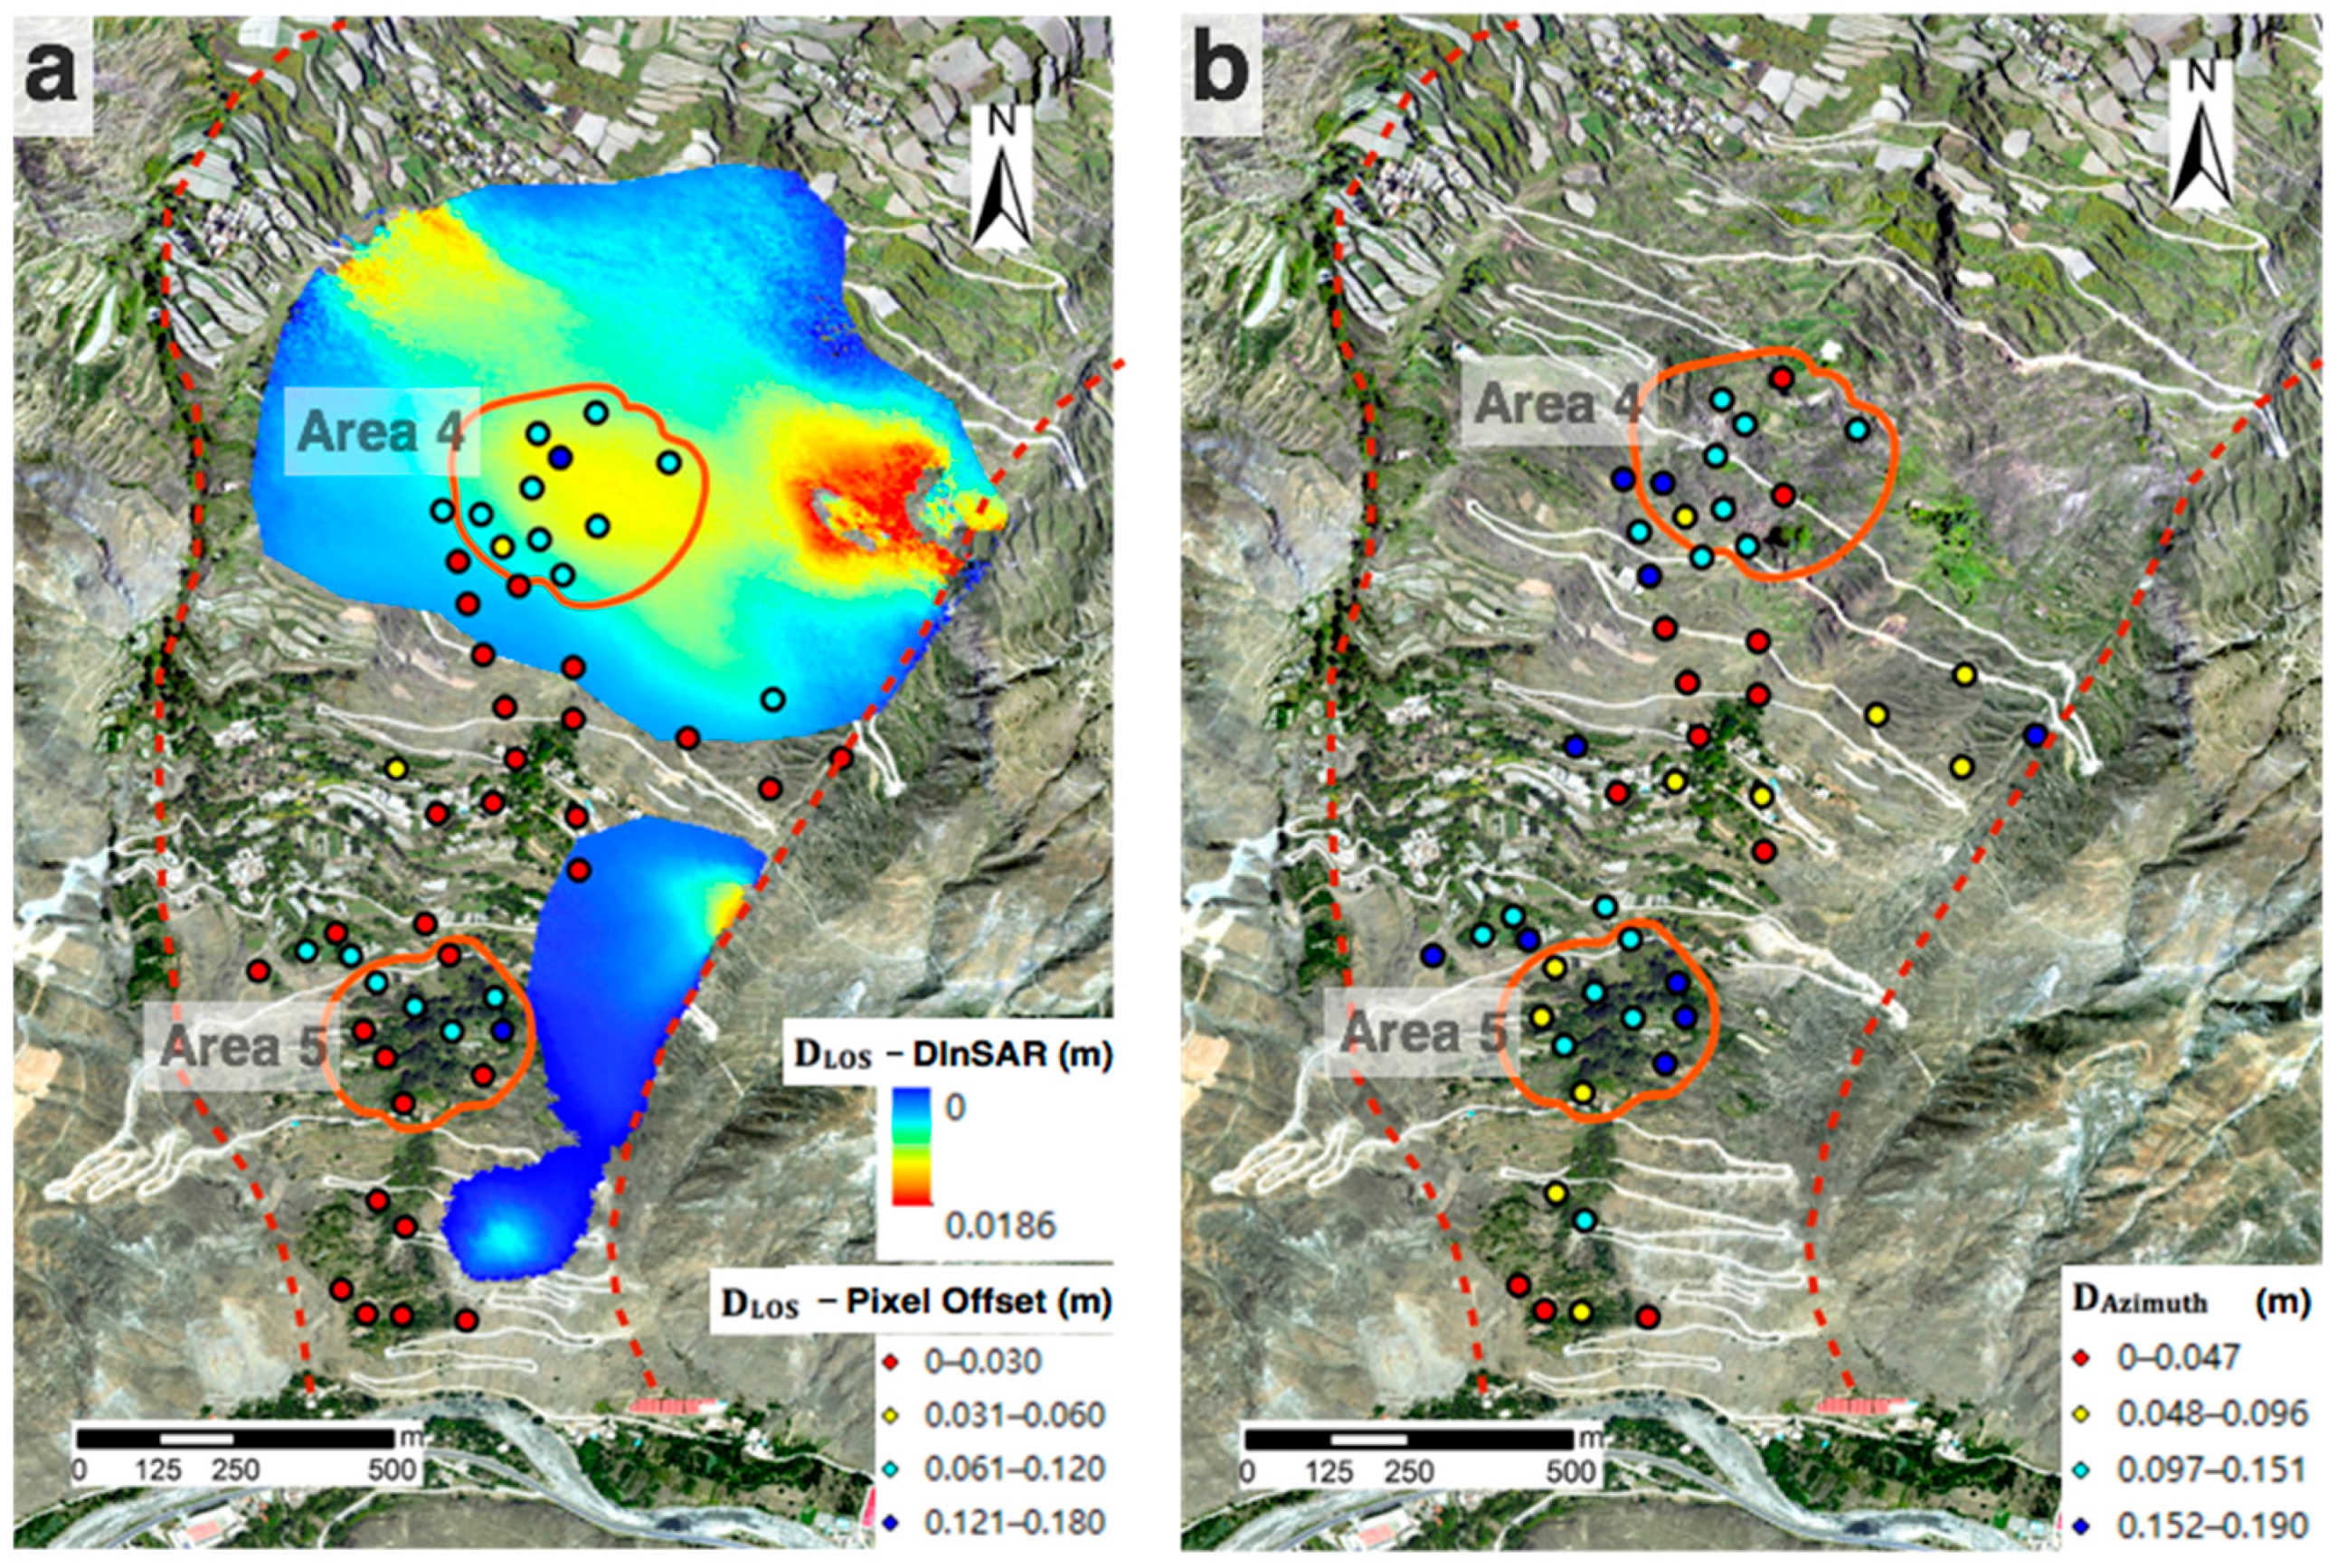
From
Figure 5, it can be seen that the whole landslide body demonstrates a significant movement magnitude from north to south downwards on the slope. In the vegetated area of the landslide (Area 5), phased-based InSAR failed to derive good quality fringe due to the decorrelation; however, some deformation signals are extracted successfully because of the existence of contrasting features (for example, buildings and corner reflectors) during the pixel offset processing. In the azimuth displacement map, this zone is active and moved a distance of 8–16 cm in a time span of four months. In the range displacement map, the displacements, i.e., approximately 2–4 cm per month, cannot be ignored either. The significant movement in Area 5 was also reflected from in situ measurements in this region, which will be analyzed in
Section 5.5. Another active area (Area 4) that should receive more attention is the middle part of the Xishancun Landslide, which features obvious azimuth and slant range displacement. For this area, both phase and amplitude information are extracted successfully from SAR datasets and show good consistency. The slant range displacement is consistent with the results achieved from the DInSAR technique, being 2 cm per month. The azimuth displacement of this area amounts to 2–3 cm per month. A rotational failure mechanism is deduced in a later analysis in
Section 5.2.
For our TerraSAR-X Stripmap dataset, the azimuth pixel size is 1.83 m (
Table 2), which is also the minimum pixel dimension. The maximum detectable displacement between neighboring pixels in SAR images (a quarter of the TerraSAR wavelength) divided by the minimum pixel dimension is the maximum displacement gradient derived from the phase-based InSAR technique, being approximately 0.004 m/m. Therefore, even if we derive the original resolution interferogram, the maximum detectable difference between two points over a distance of 10 m will be only 0.04 m. In this case, a multi-look factor of two is applied for the range and azimuth direction; thus, the maximum InSAR detectable difference is only 0.02 m. However, in the Xishancun Landslide, regions with fast-moving phenomena exist, and their displacement gradients exceed the measurable limit (for example, Area 5). The results of the pixel offset technique demonstrate a good performance of this technique in detecting larger deformation magnitudes.
Theoretically, the range displacement map from the pixel offset technique is expected to contain the same information as the differential interferogram [
24]. In order to quantitatively evaluate the combination of the two techniques, the differences between LOS displacements of ten points in Area 4 derived from DInSAR processing in a time span of 22 days and offset tracking processing in a time span of 110 days are calculated in
Table 4. To make a uniform comparison of the consistency between two techniques, offset tracking displacements in 110 days are linearly converted to 22 days’ displacements. The mean difference and RMS error of the LOS displacement differences of ten points in
Table 4 derived from two techniques are 0.003 m and 0.0031 m, respectively, indicating an order of magnitude lower than the accumulated landslide displacements. Although there are regions that have quite low SNR values and were excluded from robust displacement calculation, the successful extraction of both phase and amplitude information in Area 4 confirms the pixel offset processing to be a good comparison with DInSAR results given enough time span and deformation magnitudes.
5. Discussion
The methodological differences between phase-based and amplitude-based techniques presented in
Section 2 led to their different application circumstances and influential factors in giant landslide research. As giant complex landslides always have diverse topographic features, complicated deformation patterns, as well as different orientations with respect to radar satellites, the applications of phase-based and amplitude-based methods in practical research may show unique advantages and disadvantages. In this section, the application circumstances and influential factors of phase-based and amplitude-based methods are evaluated according to four aspects: (1) quality of terrain visibility to the radar sensor; (2) landslide deformation magnitude and different sliding mode; (3) impact of dense vegetation cover; and (4) sliding direction sensitivity. The consistency and difference between phase-based and amplitude-based techniques demonstrated during their applications in the Xishancun Landslide research are fully exploited to evaluate the applicability of the hybrid-SAR technique in our case study.
5.1. Quality of Terrain Visibility to the Radar Sensor
The topography strongly influences the performance of both interferometric and non-interferometric techniques. The terrain visibility to the radar sensor depends on the satellite acquisition geometry and landslide terrain slope geometry.
The R-index (RI) represents a ratio between the pixel size in the slant range (radar geometry distance) and the ground range (Earth surface distance). To calculate the RI, the following parameters are needed: a DEM with slope (β) and aspect angles (α) and the LOS parameters, including the incidence angle (θ) and satellite ground track angle (γ). Notti et al. [
31] proposed a simplified version of the formula to calculate the R-Index:
Here, A is the aspect correction factor. For descending data, A is computed as A = α − γ for descending and as A = α + γ + 180° for ascending data. The R-index ranges from −1 to 1. The meanings of the R-index values are listed below:
R ≤ 0: The areas are affected by layover, foreshortening and shadow effects.
0 < R < 0.4: The pixel in this area exhibits strong compression.
0.4 < R < 1: The slope has good orientation, and the main factor that influences the following processing will be the land use.
R = 1: The slope is parallel to the LOS.
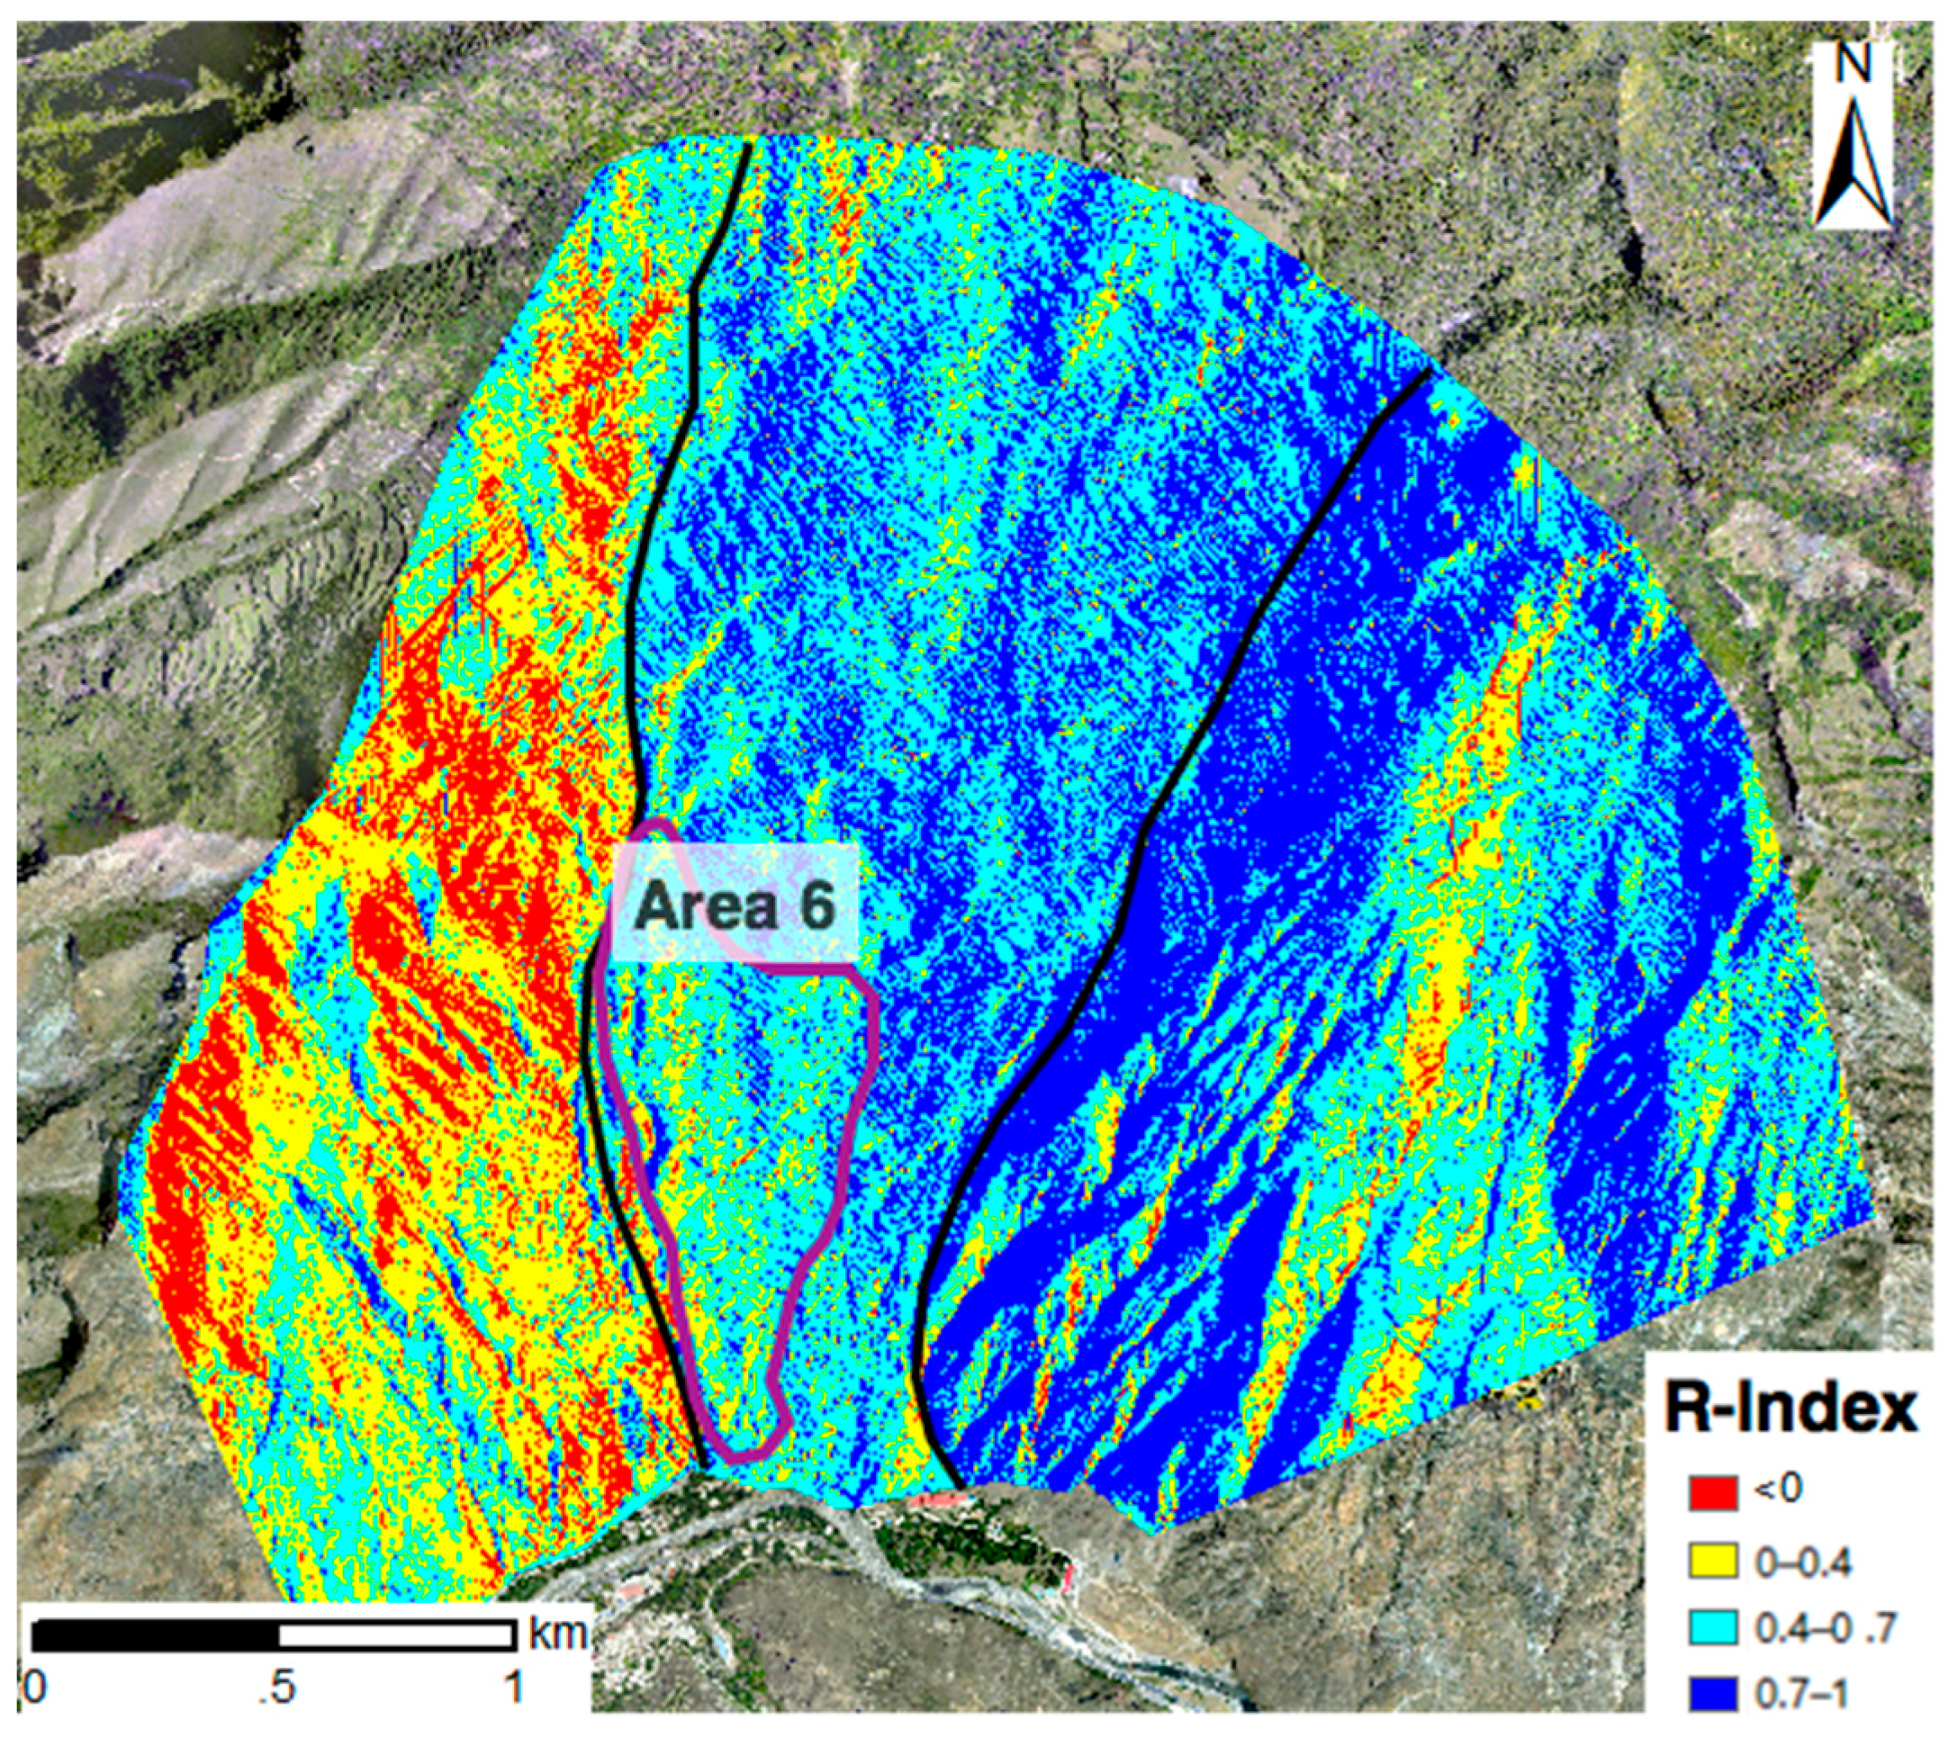
Figure 6 shows the R-index spatial distribution for descending geometry for the Xishancun Landslide. The calculated DEM was derived from TLS with a posting of 0.5 m, the same as that used in the previous processing. The figure shows that the Xishancun Landslide is mostly south oriented and has relatively high R-index values, indicating a good orientation. However, on the western slope of the landslide (Area 6), the R-index values are below 0.4, indicating the presence of compressed pixels. The overall R-index values of the whole landslide are higher than zero, indicating that the Xishancun Landslide has relatively good terrain visibility to the radar sensor.
The R-index can be used to identify areas of good terrain visibility and geometrical distortions, as well. This presence of image distortions may seriously hinder the exploitation of InSAR processing. From the interferograms in
Figure 4, low R-index values in Area 6 could be one of the reasons that lead to its unclear interferometric fringes. Moreover, the presence of layover and shadowing not only prevents the application of the interferometric technique, but also limits the non-interferometric technique.
The good orientation of the landslide body and good terrain visibility to the radar sensor should be a prerequisite for the application of the hybrid-SAR technique. In practical cases, the calculation of the R-index spatial distribution of the landslide body with respect to the specific orbital geometry should be performed in advance to evaluate the application possibility of the hybrid-SAR technique.
5.2. Landslide Deformation Magnitude and Different Sliding Modes
During the in situ investigation, the Xishancun Landslide is shown to be a quite complex landslide exhibiting different types of movement. The application of the hybrid-SAR technique to the Xishancun Landslide successfully helps infer the existence of a rotational slide, an extremely slow earthflow and a creeping area.
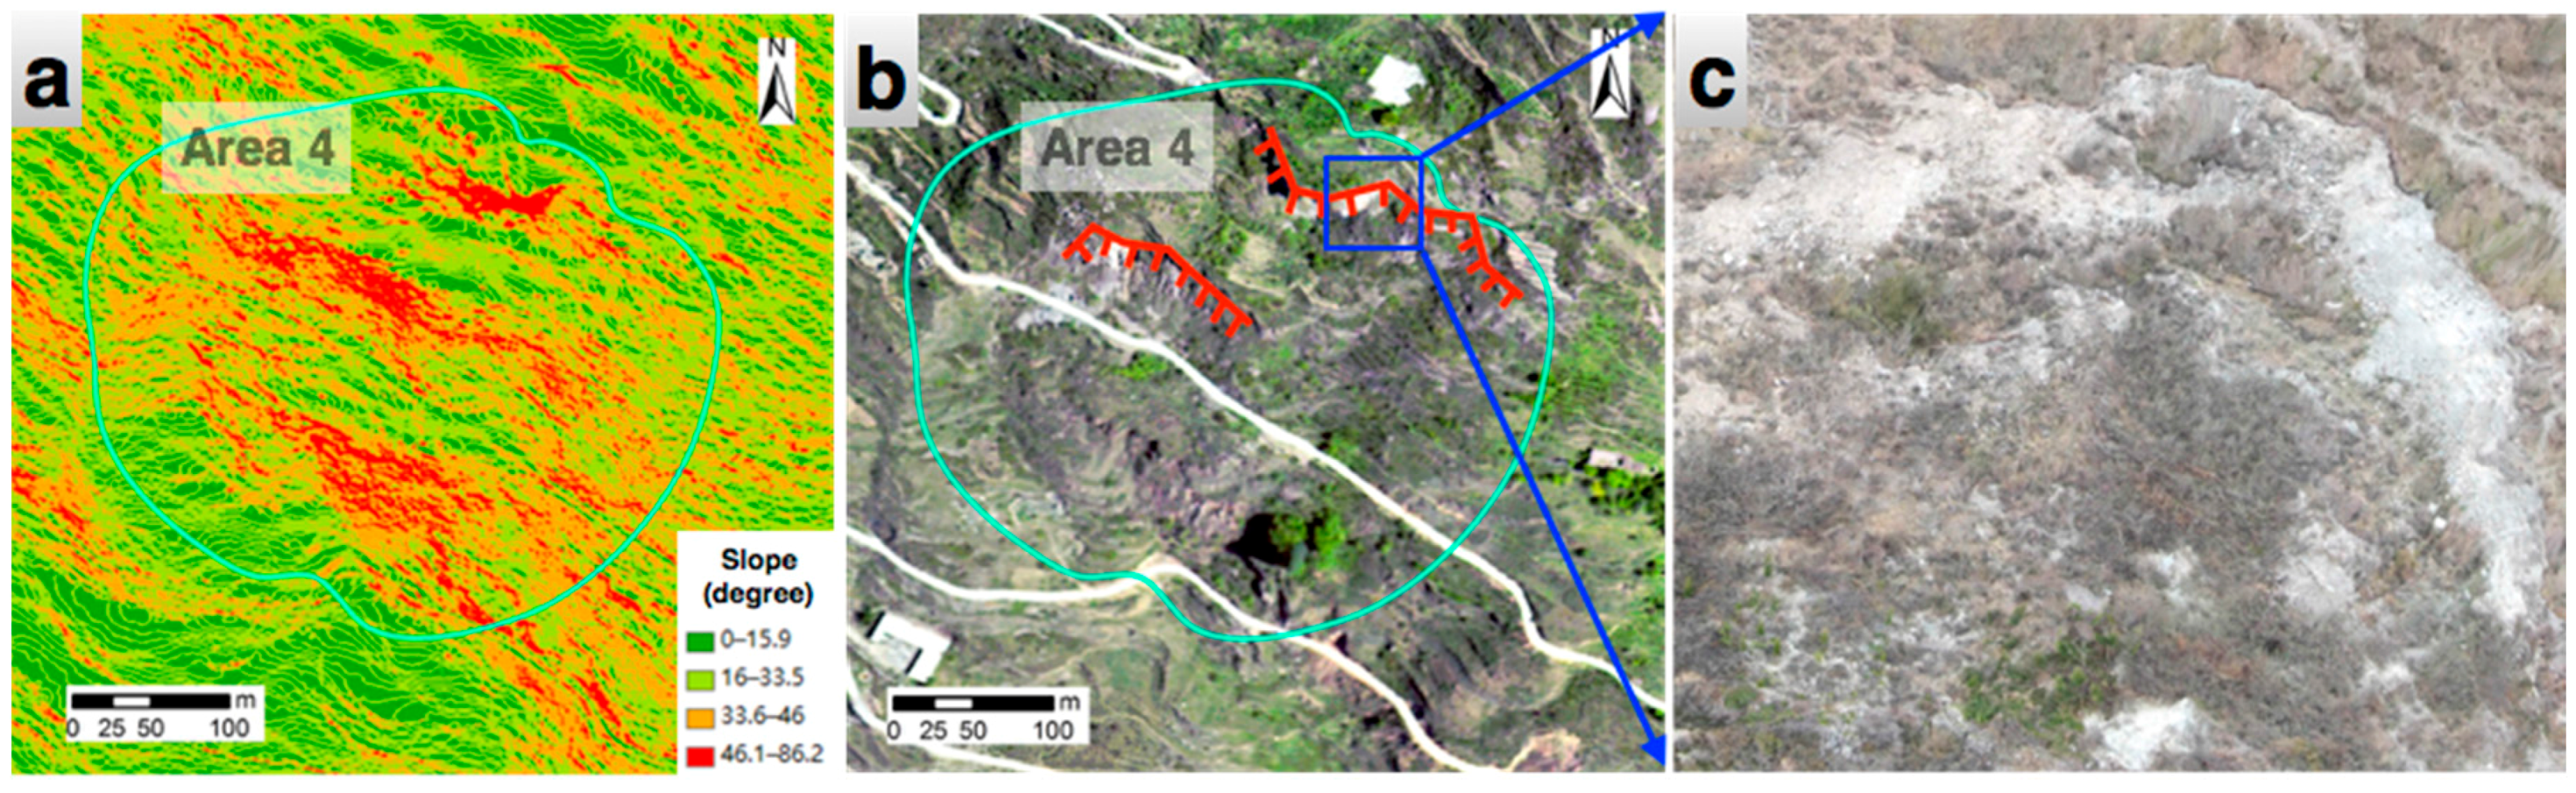
Area 4 in
Figure 7 is considered to be a rotational slide corresponding to the region in the middle part of the landslide. From the DInSAR results, obvious fringe also appeared in this area, with significant vertical gravitational movements at the head of the slide. From the offset tracking results, the deformation magnitudes in the azimuth and slant range direction are both relatively large, indicating significant downwards and northwards movements. From the high-resolution ortho-images, large main scarps have formed an obvious trailing edge of this rotational slide, and the slide boundaries show distinct terrain discontinuities with the surrounding areas. A close examination of the slope map of this area reveals that very high slope angles exist here. The sharp mountain trend and large height difference may be drivers of the rotation at the head of this slide. Both the texture of this area and hybrid-SAR results indicate that a rotational slide is a reasonable first-order interpretation.
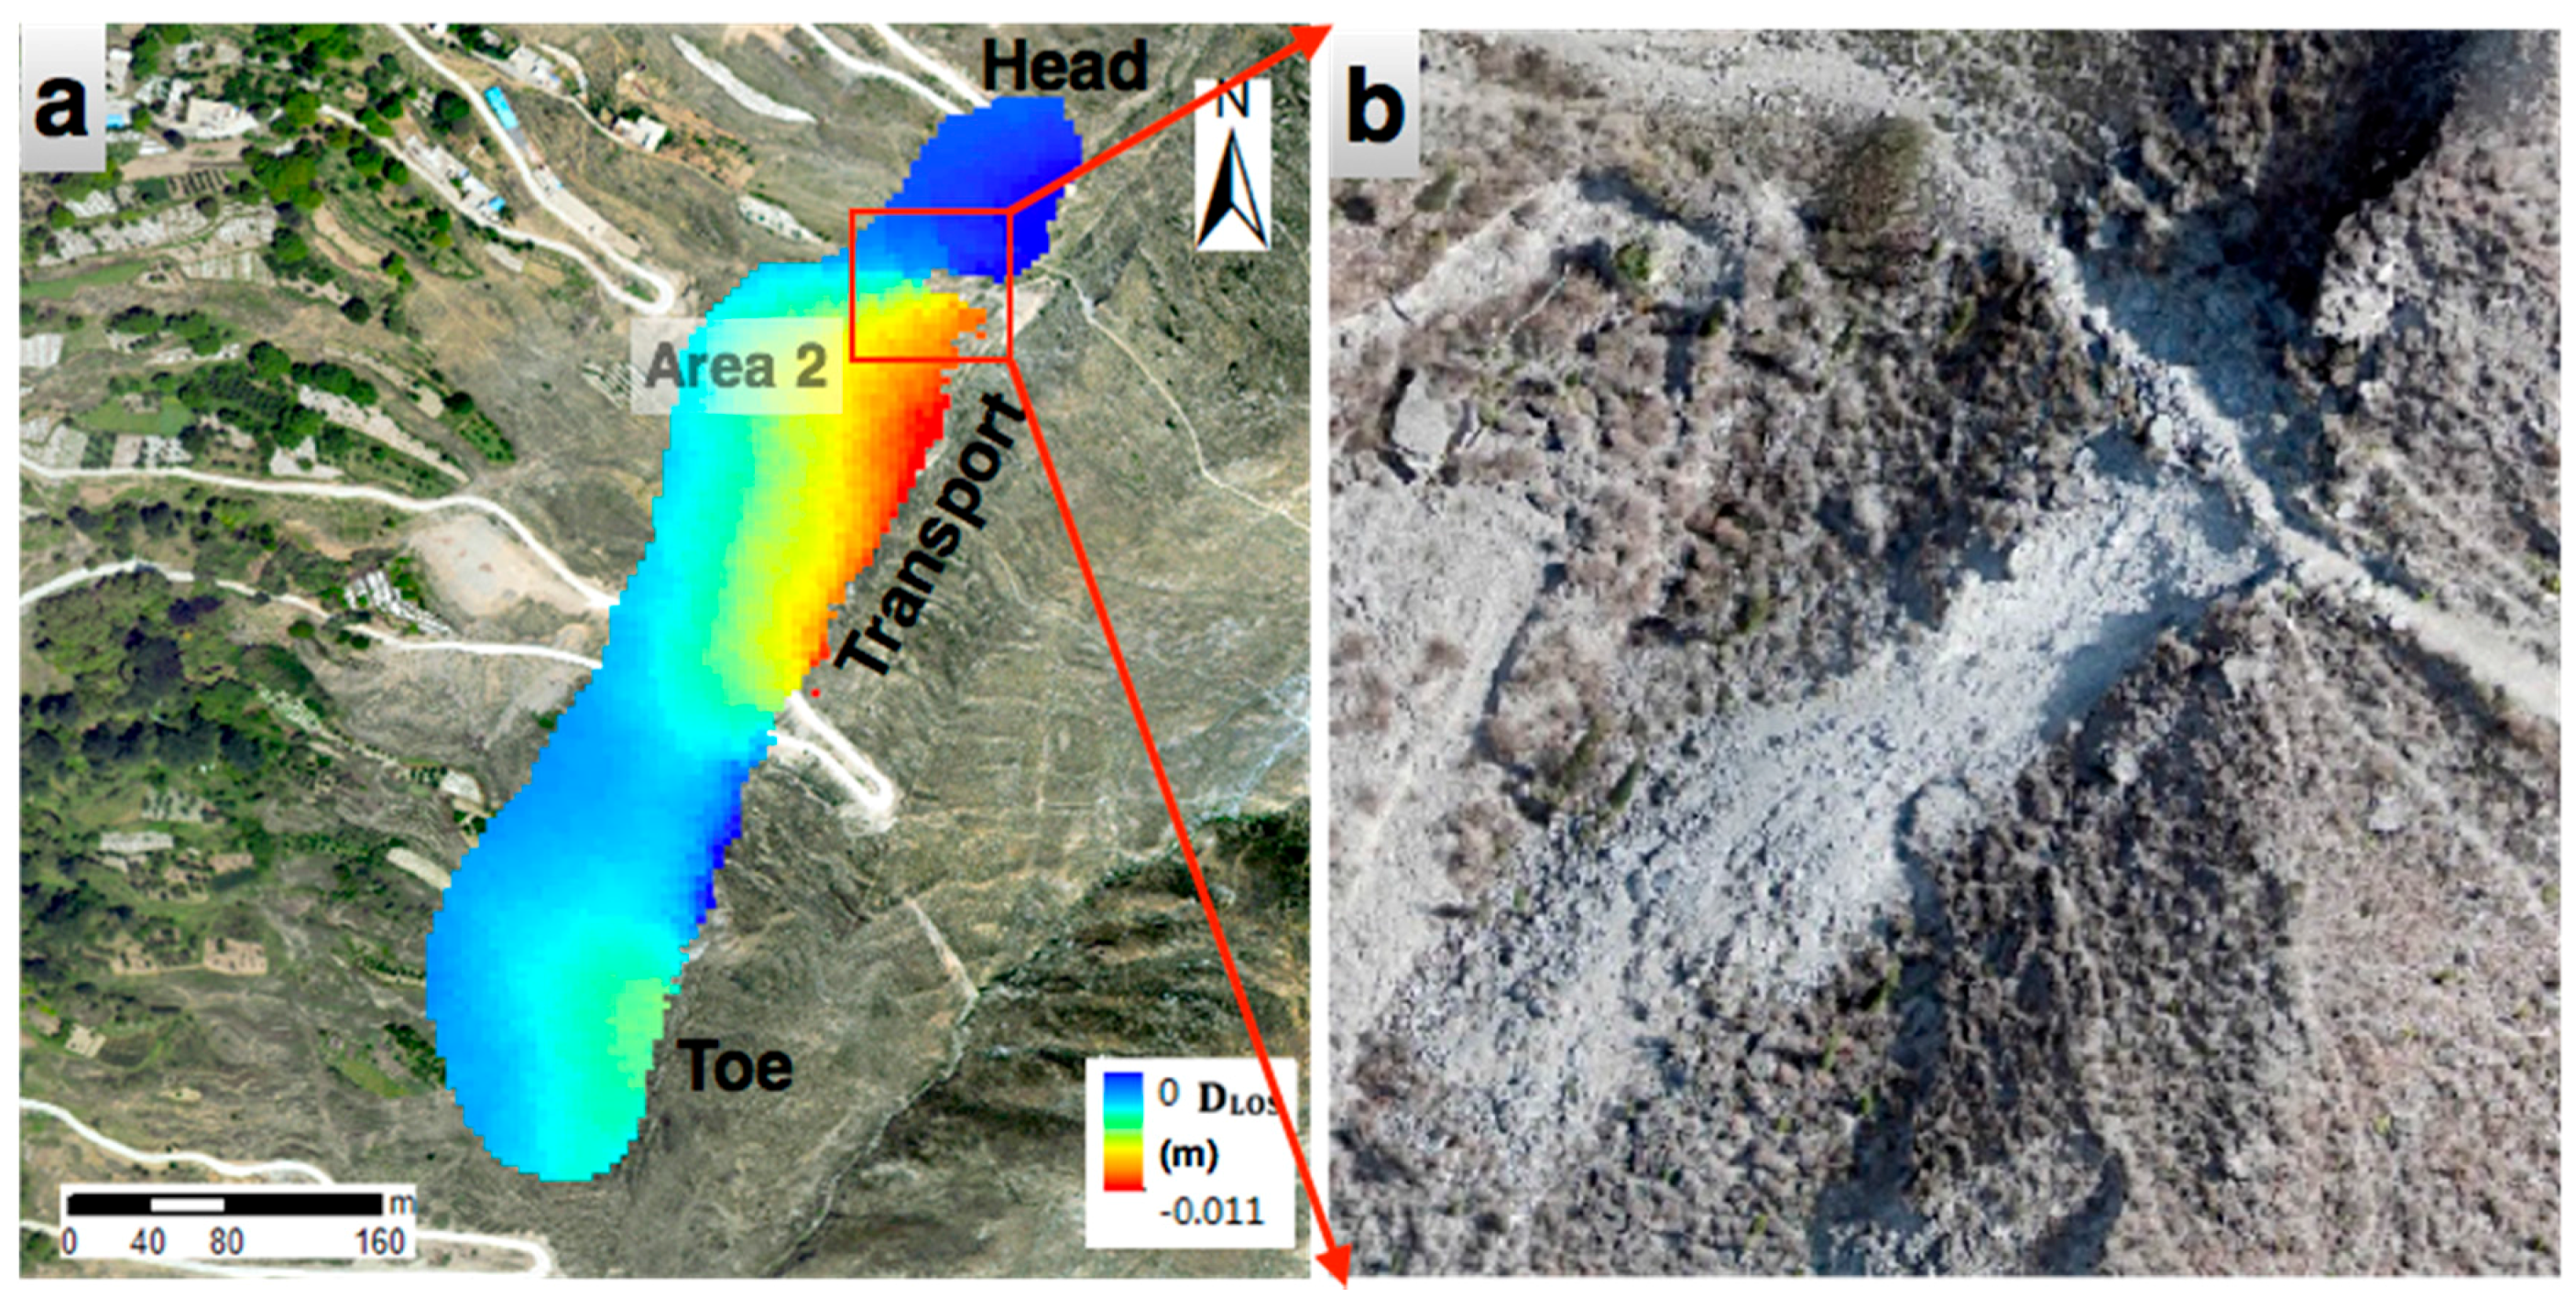
To be detected successfully by DInSAR, an earthflow motion has to be fast enough to be monitored over a short time span and slow enough to avoid radar decorrelation [
32]. The earthflow corresponding to Area 2 is an ideal example and has a displacement rate of approximately 1 cm per month (
Figure 8). This extremely slow earthflow corresponds to the fringe in DInSAR interferograms (
Figure 4) along the eastern boundary of the landslide. The main earthflow body acts as a conveyor for material from the head of the slide and moves debris downslope through the transport zone to the depositional lobe and toe zone. During the in-situ investigation, many fractures have developed along the border scarp, and shallow surface flows of soil blocks were observed. As the slide material is not covered by foliage or tree canopy in this region, the identification from UAV-based low-altitude aerial photography could be easily accomplished. Especially from
Figure 8b, the detailed enlarged view clearly verified the special textures and slide morphology of this earthflow.
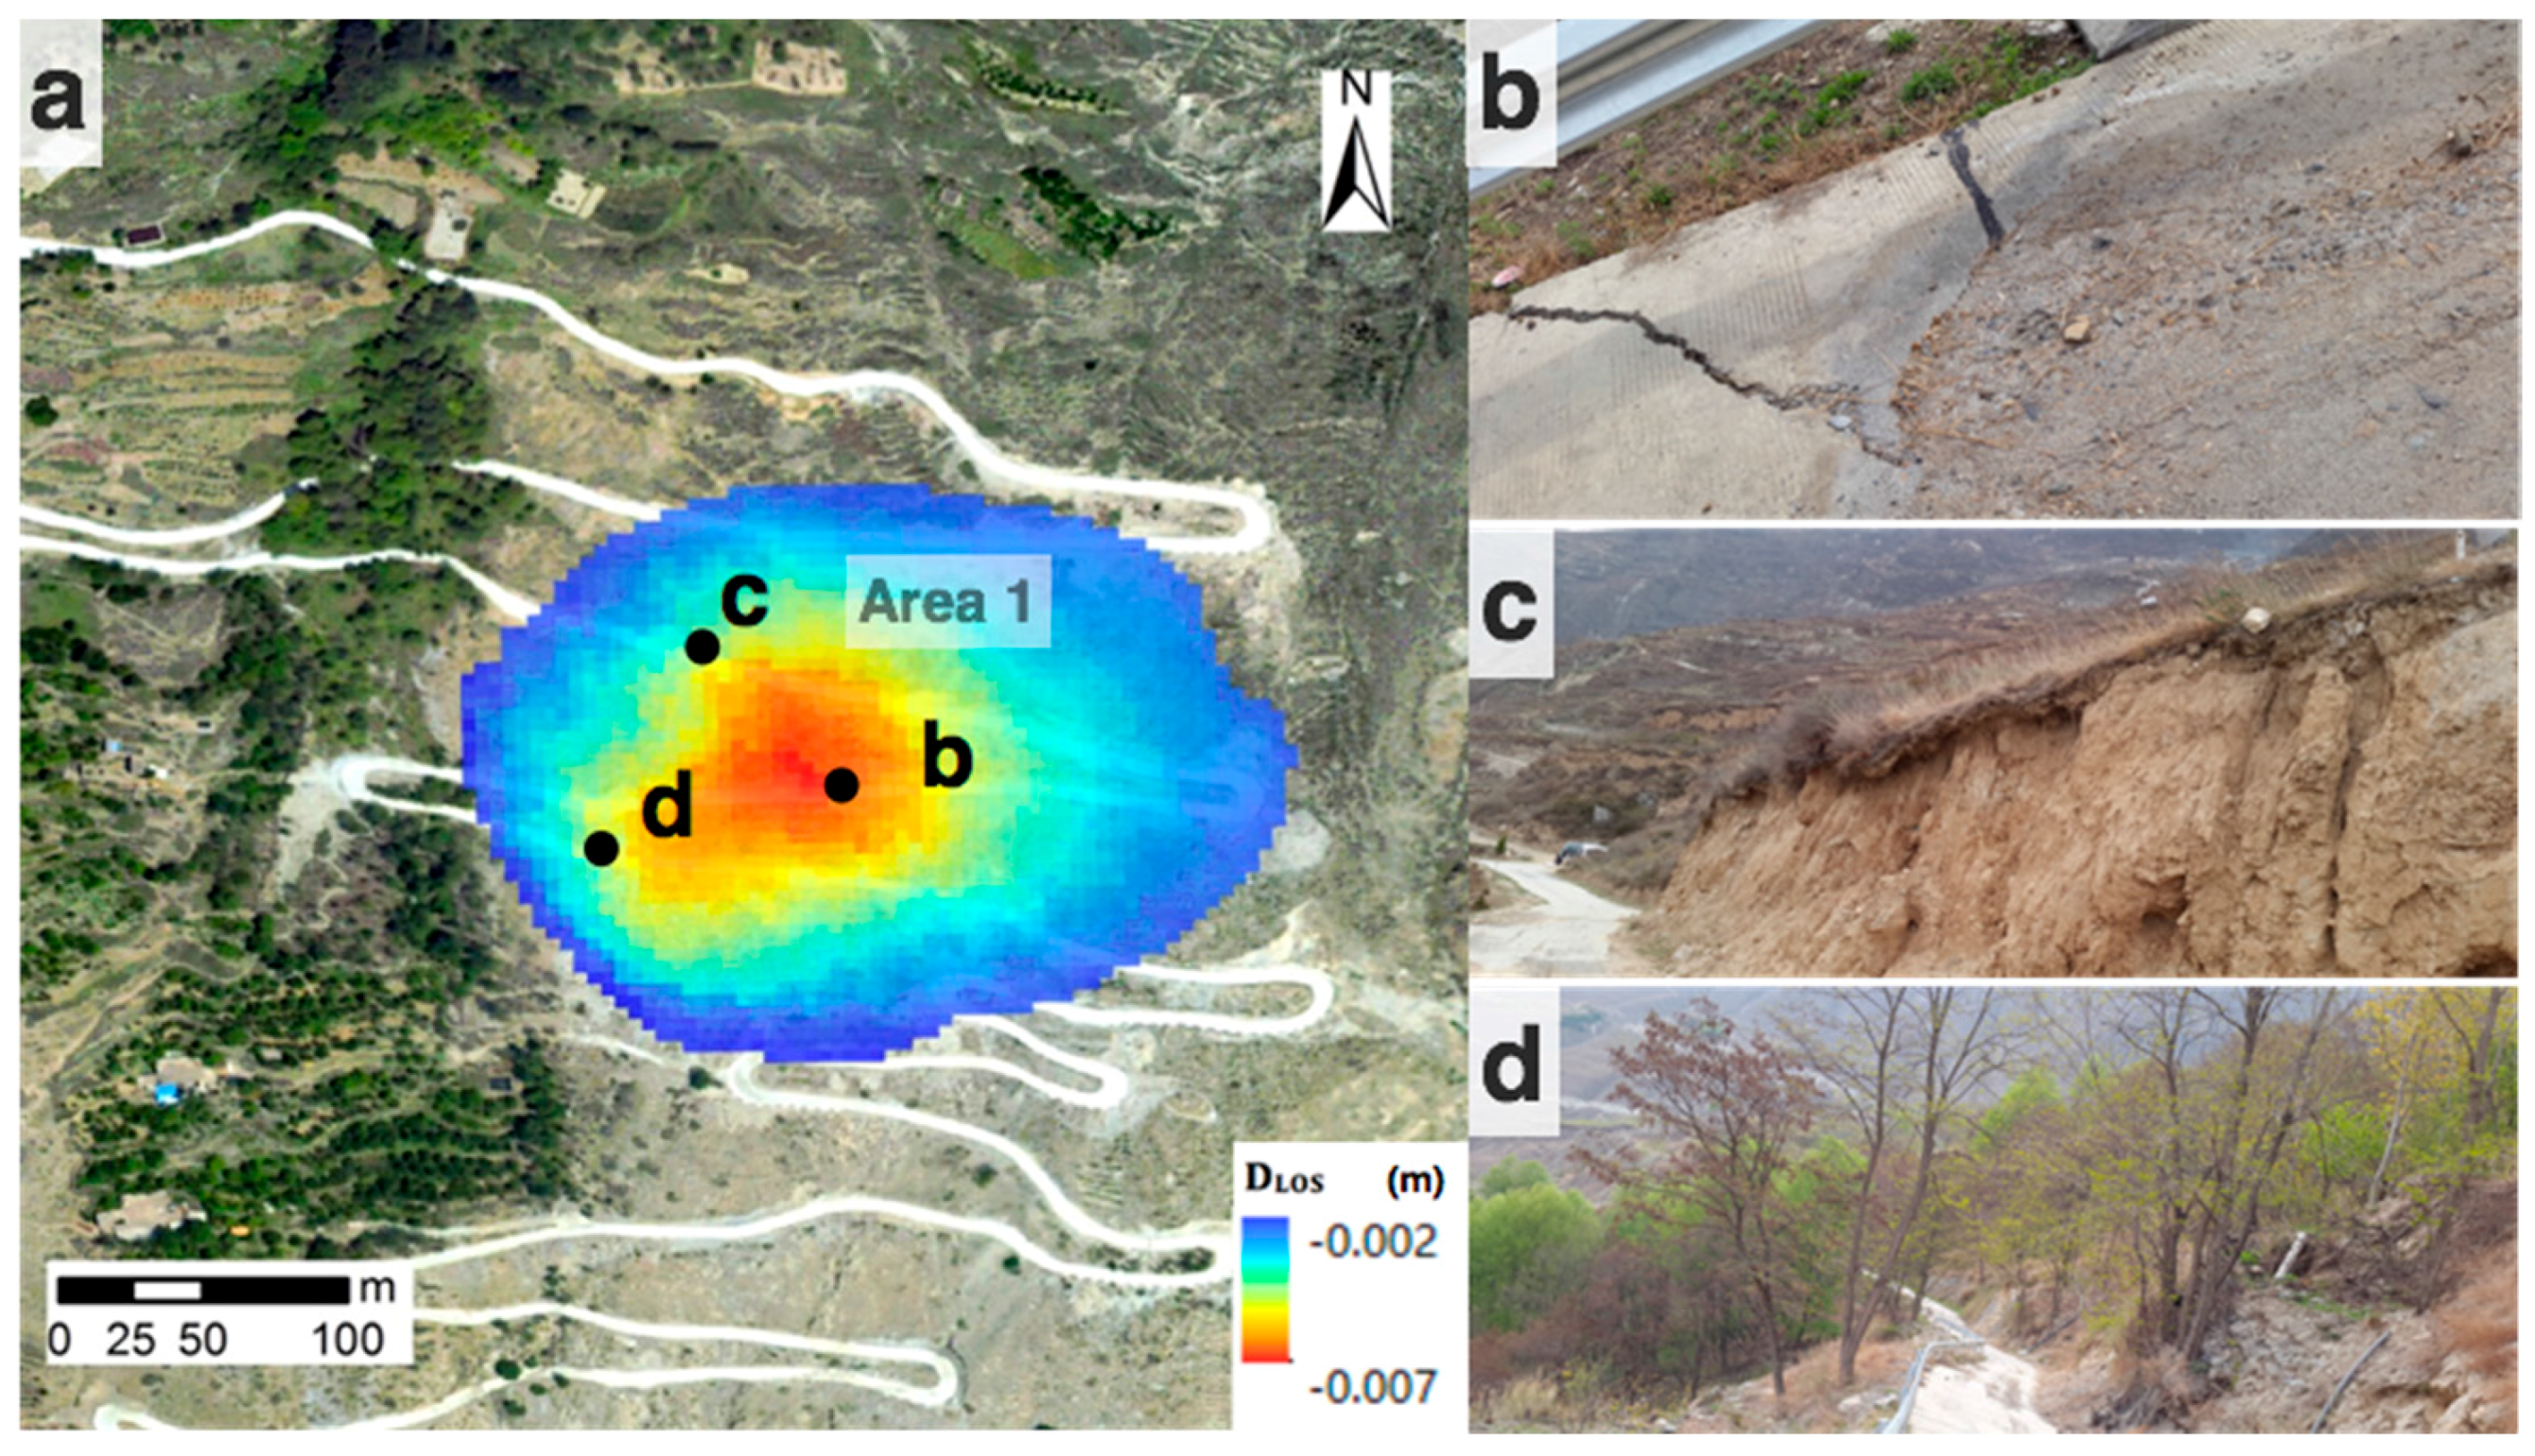
For Area 1, the DInSAR results in
Figure 4 (a uniform displacement velocity of no more than 1 cm/month) could help infer a very slow-moving landslide mode in this region. This may be creeping behavior related to the shallow sliding surface underground, which means the ground movements are mainly translational with the same slope angle as the topographic surface. The terrain slopes gently in this region; however, human activities are quite active, such as mountain road construction and farmland reclaiming. From
Figure 9, the field survey found evidence of creeping mechanisms, such as ruptures in mountain roads, downward sliding of the turf on the rock beside the road and curved tree trunks on both sides of the road. The creeping in this area resulted in the fringe close to the landslide toe in DInSAR interferograms (
Figure 4). The phase-based DInSAR could successfully detect the slow creeping behavior of the landslide, providing that the movement does not exceed the detectable gradient.
With the use of the high-resolution phased-based DInSAR technique, slow-moving landslides can be reliably detected and monitored. Slowly creeping sections and extremely slow earthflows show obvious fringes in interferograms, and rotational slides are evidenced by mainly vertical gravitational movement at the head of the slide. The offset tracking technique provides a robust method for measuring high gradient displacements, such as typical rotational slides and episodic movements, and a more reliable interpretation of landslide types providing both range and azimuth offsets. Pooling the strengths of the two methods, hybrid-SAR can provide more comprehensive information on the movement of giant complex landslides to help understand different landslide mechanisms.
5.3. Impact of Dense Vegetation Cover
The InSAR technique is tightly associated with the land cover at the regional scale [
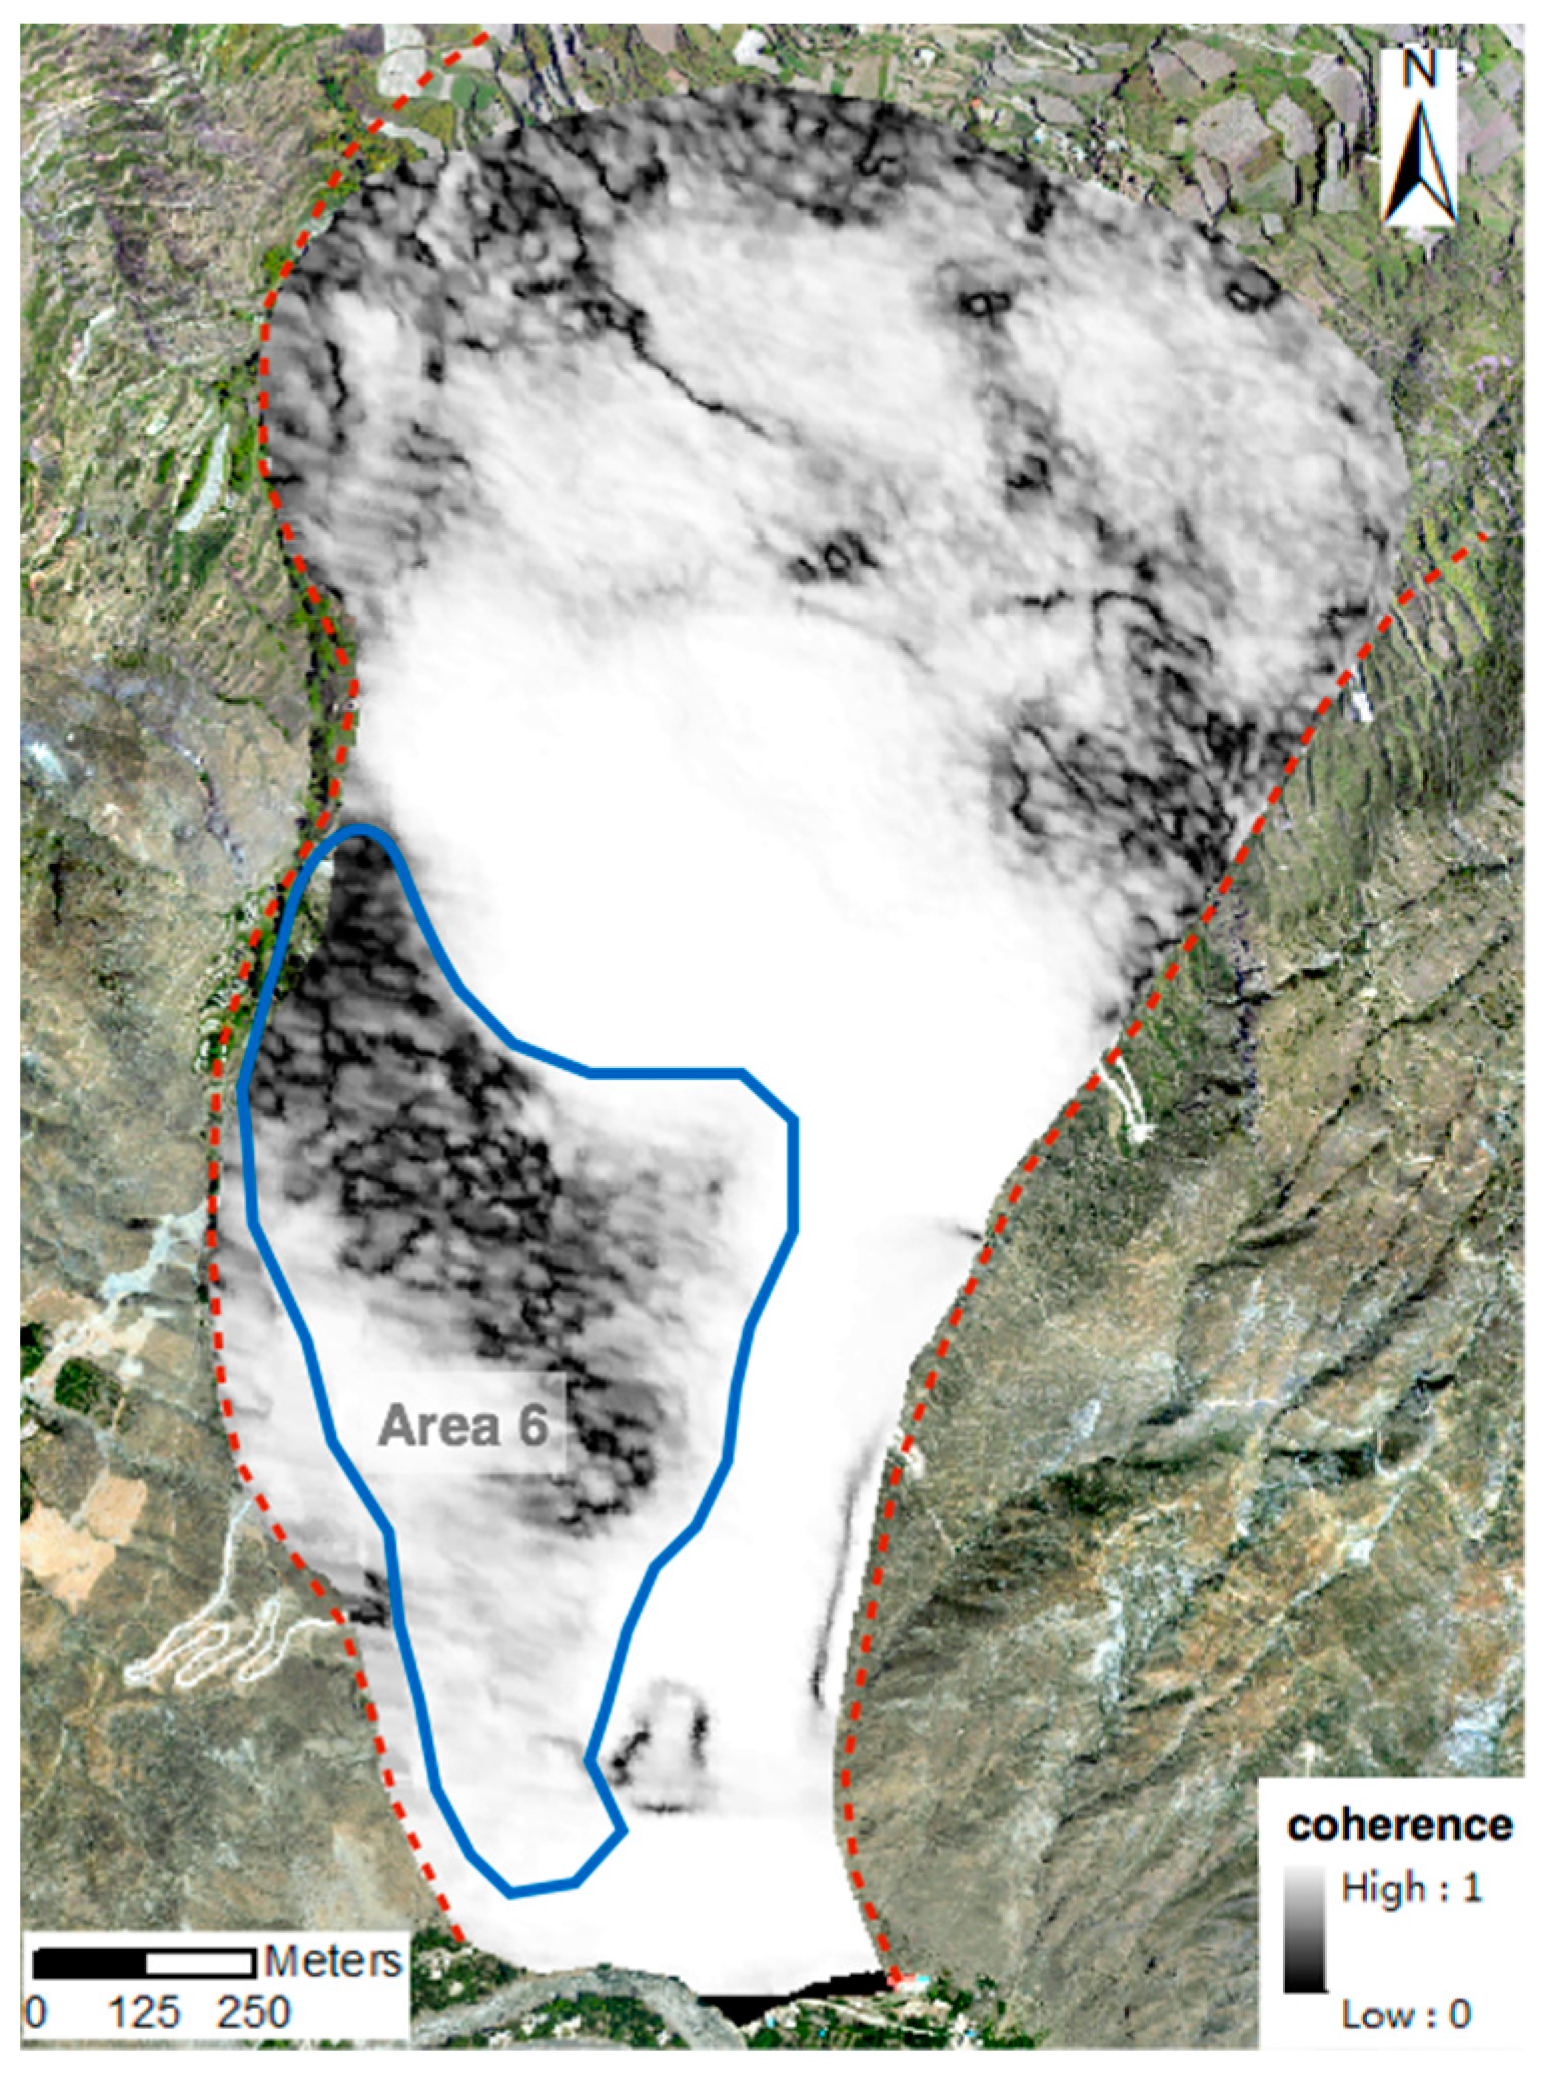
33]. In this study, the western part of the Xishancun Landslide body (Area 6) is covered by dense vegetation, which can be easily seen in
Figure 2. This densely-vegetated region has low coherence, which seriously hinders the use of the InSAR technique. Decorrelation between the TerraSAR acquisitions caused by vegetation could be recognized on the interferometric coherence map in
Figure 10. Although this interferometric pair has just 22 days of temporal baseline and 64 m of perpendicular baseline, the decorrelation due to dense vegetation cover still exerted quite an obvious effect. As the wavelength of TerraSAR-X is relatively small, its sensitivity to vegetated surfaces is more significant.
Compared with the phase-based InSAR methods, the pixel offset technique makes use of SAR amplitude information and can overcome the InSAR limitations in regions with low coherence. More contrasting features on the vegetated terrain surface (buildings or corner reflectors) can provide a better estimate in the application of the offset tracking technique. From the results of the pixel offset technique, Area 6, which provided sparse interferometric information during DInSAR processing, preserved more radar backscatter changes via the use of amplitude information. Thus, the pixel offset approach should be considered a more robust method to resolve landslide movements with decorrelation problems.
To conclude, landslides with more contrasting ground features (natural or man-made) could highly benefit from hybrid-SAR via the use of both phase and amplitude information; thus, more deformation signals could be detected in densely-vegetated areas.
5.4. Sliding Direction Sensitivity
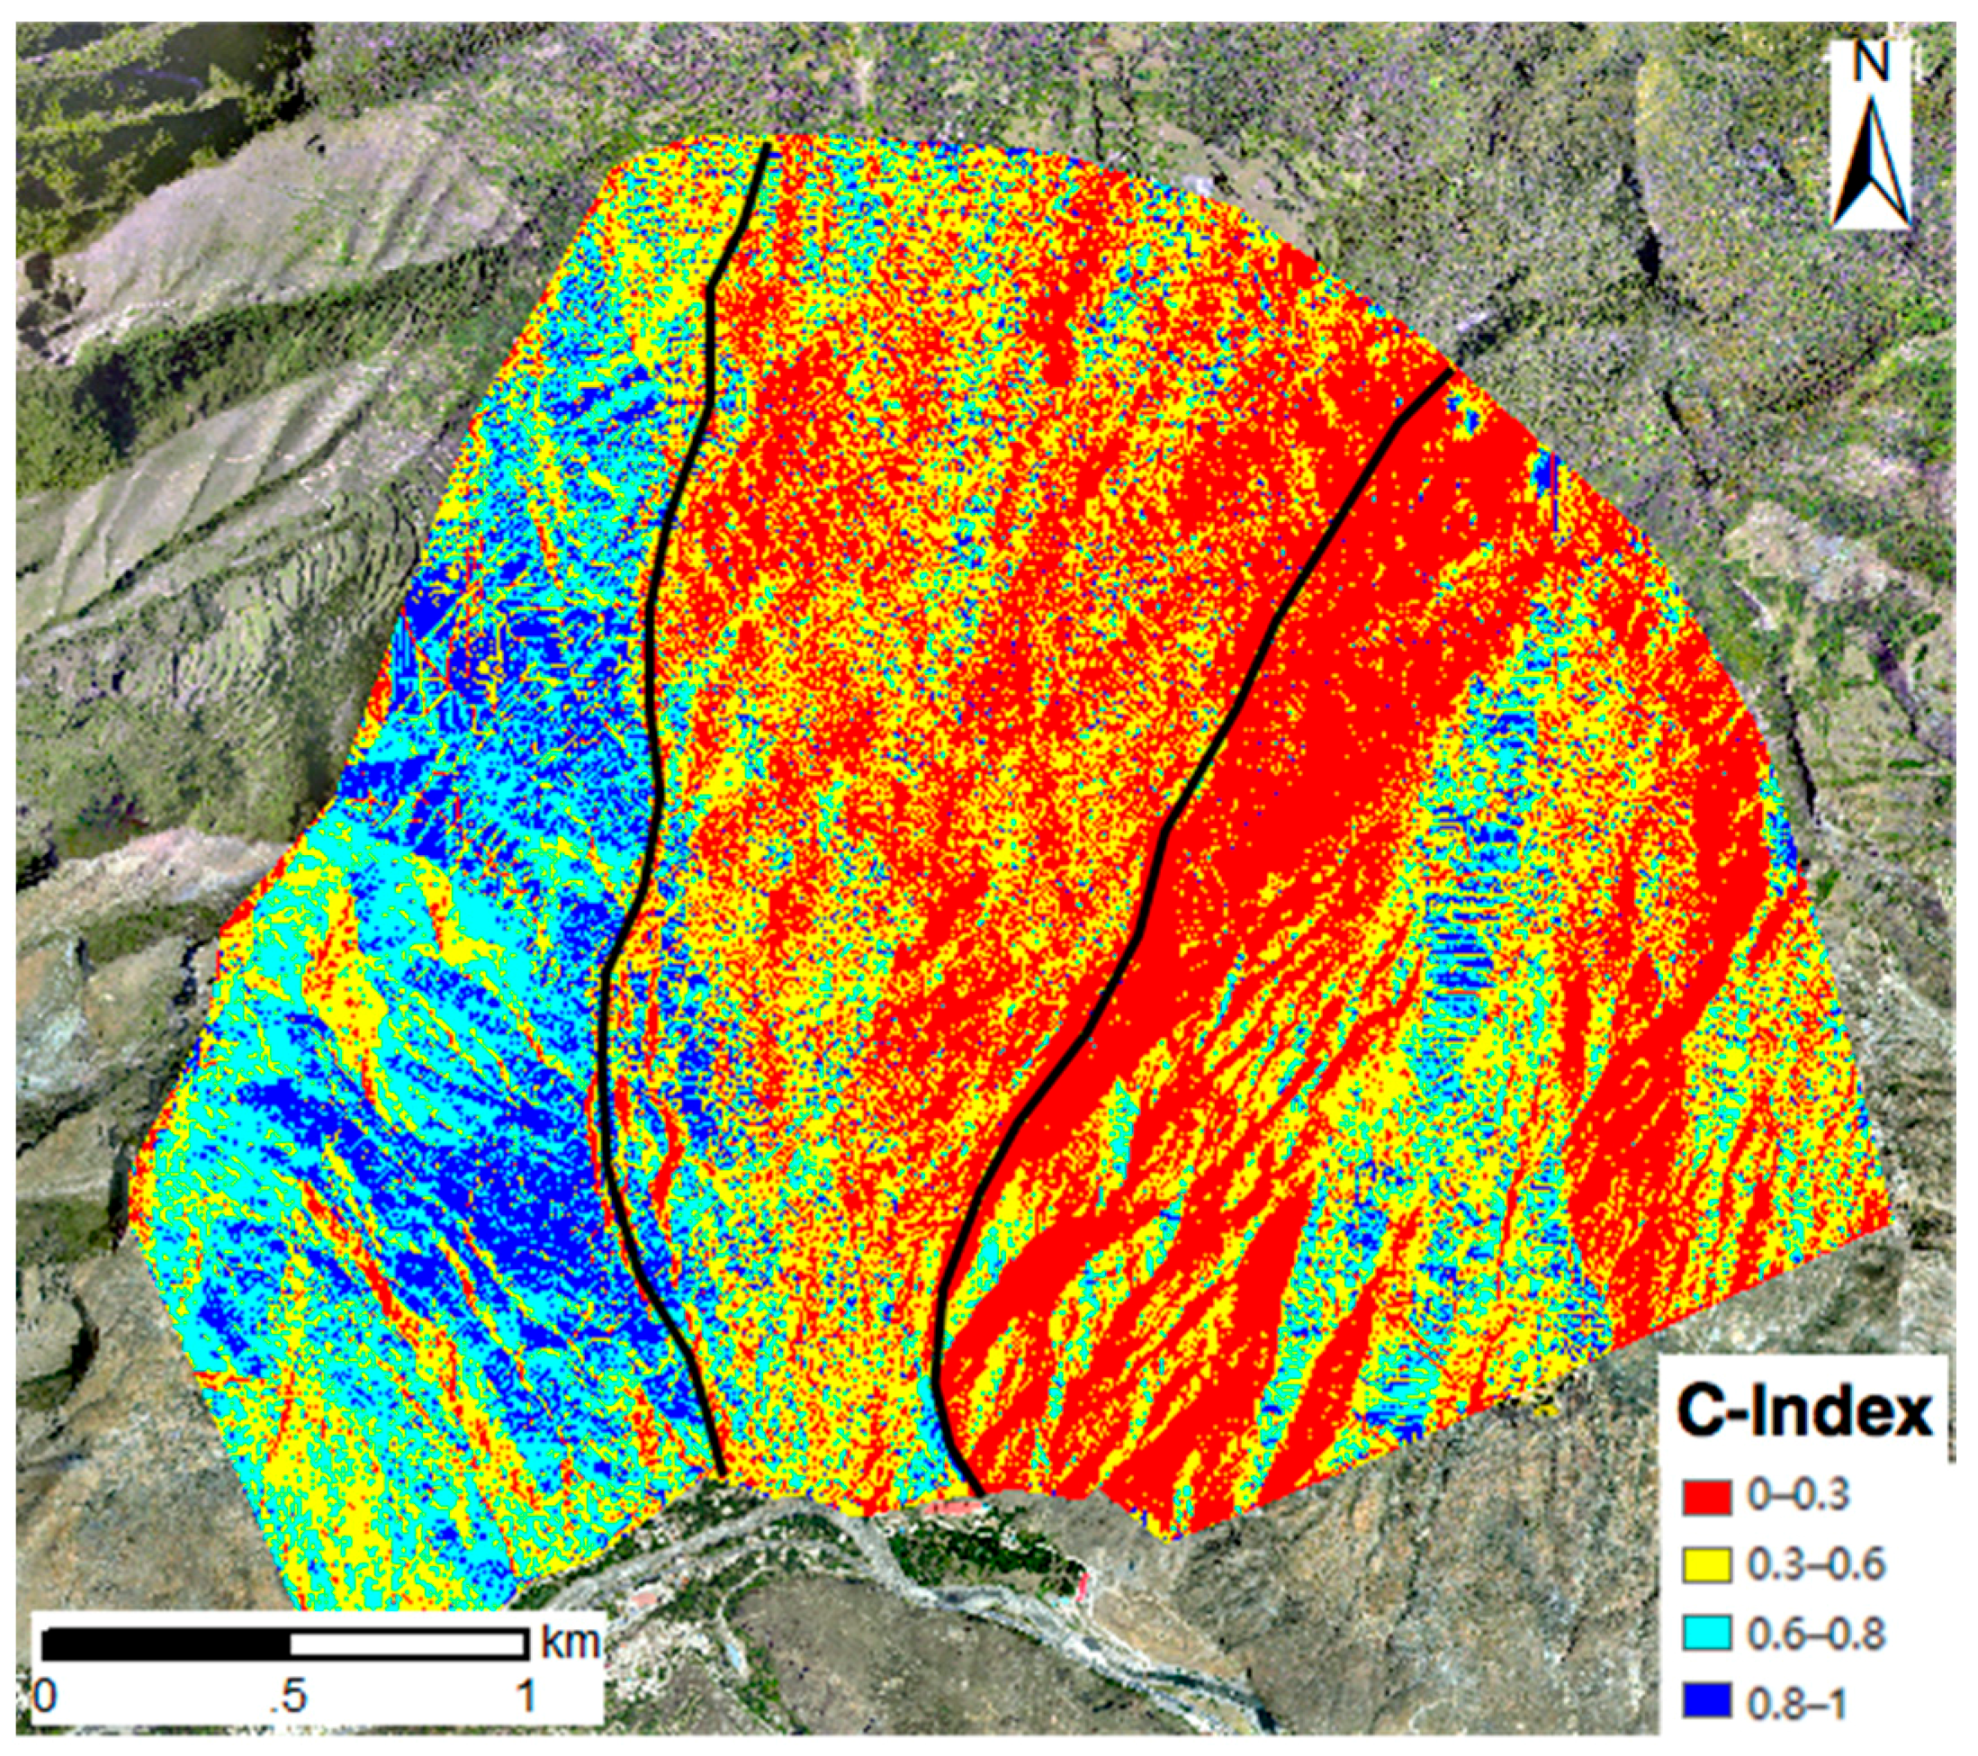
In InSAR processing, a movement parallel to the LOS could be fully registered, while the movement orthogonal to LOS cannot be registered. Especially for landslides that have a strong horizontal component, InSAR-derived movements would significantly underestimate the real deformation vector. In most cases, the majority of the velocity is along the line of the maximum slope. Based on a coefficient (C-index) proposed by Notti [
34], which indicates the ratio between the velocity projected along the slope (VSLOPE) and the velocity in the LOS (VLOS), we can estimate the percentage of movement detected along the slope using interferometric techniques. The values of C depend only on the radar LOS geometry and landslide topographical geometry. Using the expressions below, we can obtain the C-index map in
Figure 11.
where
α is the LOS incident angle,
n is the angle of the LOS with respect to north,
e is the angle of the LOS with respect to east,
s is the slope and
a is the aspect.
Negative values of the C-index represent that the direction of movement is reversed in the LOS geometries. The values close to one mean that the movement of the landslide is mostly registered along the LOS direction. The Xishancun Landslide is a south-oriented slope, and the C coefficient map shows that the western slope is registered for approximately 50% and that the eastern slope is registered for only 20% in the LOS descending geometry.
Giant complex landslides usually have both slowly-moving planar slides and rotational landslides with vertical movement at the crown and horizontal movement at the toe. Hence, a single interferometric technique cannot derive comprehensive movement information for the whole landslide body. Unlike the InSAR technique, the pixel offset technique can provide two-dimensional displacement information. Both azimuth and range displacements derived are projections of the 3D displacement vector onto corresponding dimensions. The mathematical expressions are as follows:
where
,
and
represent displacements in the northing, easting and vertical directions, respectively. The parameters
and
represent the heading angle and nominal incidence angle at the interest point, respectively, and
and
are displacements measured in the range and azimuth directions, respectively. For the Xishancun Landslide, the equation can be derived as follows:
Thus, the range displacements are sensitive to the easting and vertical directions, while azimuth displacements are sensitive to the northing direction. As the Xishancun Landslide is a south-facing slope, it is relatively safe to estimate that its deformation is mainly in the northing and vertical directions. As a result, to derive the two-dimensional movement of the landslide, the pixel offset technique should be involved to estimate the vertical and northward movements.
By incorporating both phase-based and amplitude-based techniques into the hybrid-SAR processing, various landslides with different sliding directions should be evaluated and distinguished.
5.5. Borehole Surface Displacements of Hybrid-SAR versus In Situ Measurements
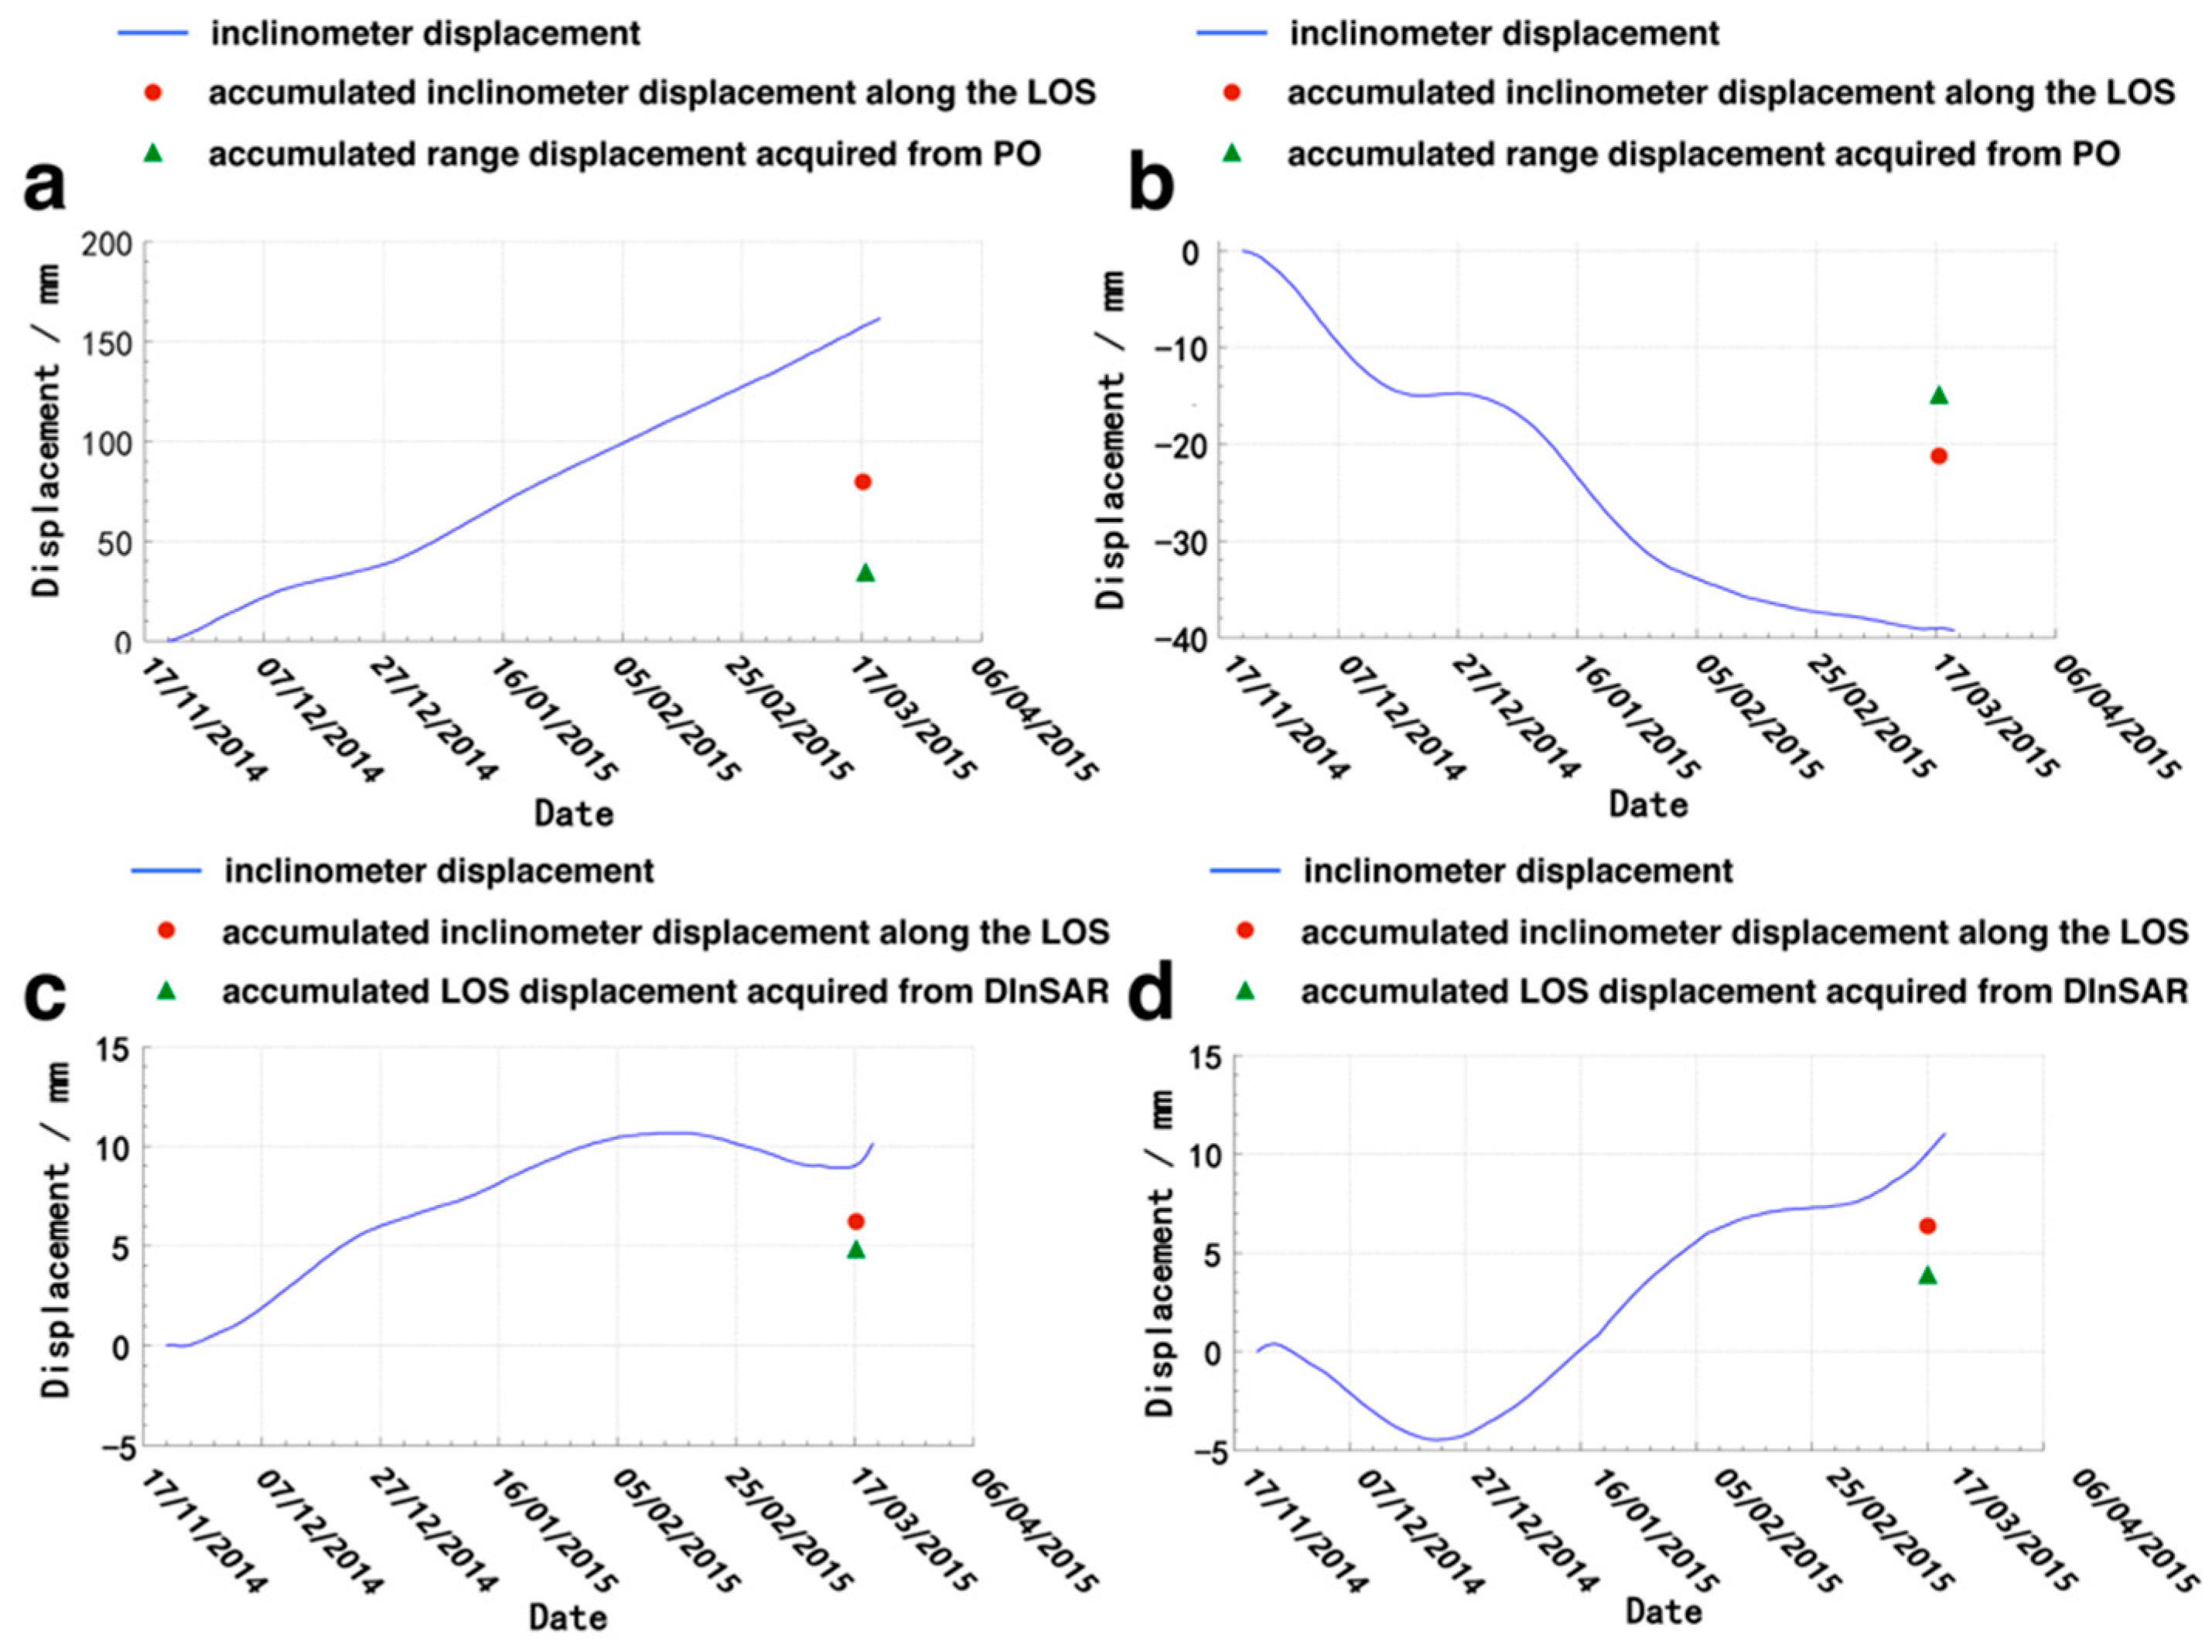
To obtain a more robust analysis for the hybrid-SAR application, the displacement results produced by the phase-based and amplitude-based methods have been compared with the inclinometers of corresponding boreholes covering the period of the TerraSAR acquisitions. The actual locations of the four boreholes are shown in
Figure 2. The measurements of inclinometers Bh1 and Bh2 (
Figure 12) are only compared with the results of the offset tracking method, as the conventional DInSAR technique failed to obtain the displacement in this area because of the impact of dense vegetation cover in this area. The measurements of inclinometers Bh3 and Bh4 (
Figure 12) are only compared with the results of the DInSAR processing, as the offset tracking technique failed to obtain a robust value because of low SNR values on the two borehole points. In the following figures, the x-axis represents the dates of acquisition, while on the y-axis are the displacement values of relative inclinometers. The positive value represents movement downwards along the slope, while the negative value represents movement upwards along the slope. In the following comparison, the accumulated displacements of inclinometers are converted to monthly displacement velocities, as almost all of the inclinometers show uniform deformation patterns during the monitoring period. Similarly, the displacements achieved from phase-based and amplitude-based processing are also converted to monthly displacement velocities.
From
Figure 12, the borehole Bh1 shows a velocity along the maximum slope angle of 36.5 mm/month, while the velocity of the Bh2 instrument is −9.7 mm/month. The velocity values of borehole Bh3 and Bh4 are both 2.75 mm/month. Theoretically, the monthly inclinometer displacements of all four boreholes should be larger than the hybrid-SAR displacements [
35], as the radar benchmark displacement is measured along the LOS direction of the satellite, which is only a component of the real movement vector. In contrast, the inclinometer measures the real displacement along the maximum slope angle direction.
To compare the two datasets more robustly, we projected the displacement vector of the inclinometers along the radar LOS direction through a simple equation:
where
is the inclinometer displacement along the LOS direction,
is the measured inclinometer displacement and θ is 33°, the look angle of the TerraSAR satellite.
With the equations correcting the inclinometer measurements to the LOS direction, the results show that the velocity components along the LOS of Bh1 and Bh2 are 19.8 mm/month and −5.3 mm/month, respectively, while the range velocities achieved from the amplitude-based pixel offset technique are 7.8 mm/month and −3.8 mm/month, respectively. The velocity values along the LOS of Bh3 and Bh4 are both 1.5 mm/month, while the LOS velocities acquired from the phase-based DInSAR technique are 1.2 mm/month and 0.9 mm/month, respectively. In
Figure 12, the finally accumulated inclinometer displacements along the LOS and hybrid-SAR LOS displacements of four boreholes until the date of 17 March 2015 are marked as red points and green triangles, respectively.
The above analysis reveals that the LOS displacements measured by hybrid-SAR may underestimate the real displacement determined via in situ monitoring, i.e., the borehole inclinometers. However, the displacement tendency of every single borehole confirms that the satellite monitoring is consistent with the in situ monitoring in displacement scale and magnitude.
5.6. Summary of Hybrid-SAR Applications and Discussion of Future Works
A summary of the application circumstances for the two independent techniques and the combined hybrid-SAR technique is listed below in
Table 5. This list thoroughly reveals the advantages and disadvantages of these techniques.
Future improvements could be obtained when long-term datasets are available to generate time series displacement fields for this landslide. Time series hybrid-SAR, which is able to obtain a 3D deformation map with a time span of a year or more, can further improve the analysis of the landslide mechanism and improve the early warning capabilities. Then, the different temporal-spatial and scale-related characteristics of phase-based InSAR and amplitude-based offset tracking techniques could be analyzed and evaluated. The exploitation of a seamless handover scheme and also the definition of utilization criteria of the hybrid-SAR technique would be carried out step by step in giant complex landslide research. A validation analysis could be carried out in more detail by combining in situ monitoring data with time series deformation results. In this way, the integration of hybrid-SAR time series displacements and ground-based monitoring data can facilitate a better understanding of the landslide kinematics and the relationship to triggering factors.
6. Conclusions
Occurring on the eastern edge of the Tibetan Plateau in China, the Wenchuan Earthquake triggered a number of landslides that slid onto populated towns and villages. Instead of having a unitary characteristic and definite deformation mode, giant landslides normally have many different topographic features, complex deformation patterns and different orientations with respect to radar satellites. Thus, complex giant landslides require the use of different analysis methods to enhance the coverage of different types of measurements.
In giant landslide research, the good terrain visibility to the radar sensor is a prerequisite for the application of the hybrid-SAR technique. When considering the landslide deformation magnitude, high-resolution InSAR techniques can be used to derive reliable movement for slow-moving landslides with no or little decorrelation and with the displacement gradients not exceeding the measurable threshold. On the other hand, for fast-moving landslides with movements greater than the SAR image pixel size and even large enough to show significant change on the radar backscatter, the pixel offset techniques based on the amplitude information can achieve a better result for displacement monitoring. Moreover, dense vegetation cover hinders the exploitation of both techniques. Especially for the rotational component of a complex landslide, the vertical and horizontal measurements are both needed, which can be resolved by the measurement of the range and azimuth offsets using pixel-offset techniques. Hence, the hybrid-SAR technique, which makes joint use of both phase-based and amplitude-based methods, could be considered a robust methodological method to retrieve the deformation of giant complex landslides.
In the Xishancun Landslide, the phase-based DInSAR technique successfully provides a good preliminary interpretation of landslide-prone areas, even when the satellite data acquired are not abundant to conduct a robust time series study. In particular, the slow motions of the earthflow and creeping regions show quite obvious fringes on the interferograms, with a displacement rate of 1 cm/month. Unfortunately, the densely-vegetated terrain on the landslide body invalidated the use of the DInSAR approach in this specific region. However, due to the presence of contrasting features (buildings and corner reflectors), offset tracking processing was successfully carried out and retrieved the significant deformation tendency. Moreover, a typical rotational slide was also identified in the results of both the offset tracking method and InSAR method. This slide is moving 2–3 cm per month downwards and towards the riverbank. The combined analysis of the hybrid-SAR technique provides reliable identification and monitoring of the Xishancun Landslide at the preliminary research stage.
Our work confirms hybrid-SAR to be able to promptly identify diverse landslides with different deformation magnitudes, sliding modes and slope geometries, even when the available satellite data are limited. The application of the hybrid-SAR technique allows for a comprehensive and preliminary identification of areas with significant movement and provides reliable data support for the forecasting and monitoring of landslides. Moreover, the effective evaluations of phase-based and amplitude-based techniques in different application circumstances should be carried out in advance. Joint analysis and cross-validation are both needed to thoroughly enhance the measurements of the entire landslide.
Acknowledgments
This work was supported by the projects funded by the 973 National Basic Research Program (No. 2013CB733204 and No. 2013CB733203) and the Fundamental Research Funds for the Central Universities (Tongji University). The TerraSAR-X Stripmap datasets are copyrighted by DLR/Infoterra GmbH.
Author Contributions
Tengteng Qu carried out SAR data processing, interpreted the results and wrote the original manuscript. Chun Liu and Ping Lu supervised the research and contributed to the manuscript writing. Hangbin Wu, Xiaohang Shao, Hong Wan and Nan Li contributed to in situ measurement processing. Rongxing Li was involved in the data interpretation, analysis and edited the manuscript. All authors have read and approved the final manuscript.
Conflicts of Interest
The authors declare no conflict of interest.
References
- Huang, R.; Li, W.L. Analysis of the geo-hazards triggered by the 12 May 2008 Wenchuan Earthquake, China. Bull. Eng. Geol. Environ. 2009, 68, 363–371. [Google Scholar] [CrossRef]
- Liu, C.; Li, W.; Wu, H.; Lu, P.; Sang, K.; Sun, W.; Chen, W.; Hong, Y.; Li, R. Susceptibility evaluation and mapping of China’s landslides based on multi-source data. Nat. Hazards 2013, 69, 1477–1495. [Google Scholar] [CrossRef]
- Xu, C.; Xu, X.; Yao, X.; Dai, F. Three (nearly) complete inventories of landslides triggered by the 12 May 2008 Wenchuan Mw 7.9 Earthquake of china and their spatial distribution statistical analysis. Landslides 2014, 11, 441–461. [Google Scholar] [CrossRef]
- Ye, X.; Kaufmann, H.; Guo, X. Landslide monitoring in the Three Gorges area using D-InSAR and corner reflectors. Photogram. Eng. Remote Sens. 2004, 70, 1167–1172. [Google Scholar] [CrossRef]
- Zhao, C.; Lu, Z.; Zhang, Q.; de La Fuente, J. Large-area landslide detection and monitoring with ALOS/PALSAR imagery data over Northern California and Southern Oregon, USA. Remote Sens. Environ. 2012, 124, 348–359. [Google Scholar] [CrossRef]
- Ferretti, A.; Prati, C.; Rocca, F. Permanent scatterers in SAR interferometry. IEEE Trans. Geosci. Remote Sens. 2001, 39, 8–20. [Google Scholar] [CrossRef]
- Colesanti, C.; Ferretti, A.; Prati, C.; Rocca, F. Monitoring landslides and tectonic motions with the permanent scatterers technique. Eng. Geol. 2003, 68, 3–14. [Google Scholar] [CrossRef]
- Ferretti, A.; Fumagalli, A.; Novali, F.; Prati, C.; Rocca, F.; Rucci, A. A new algorithm for processing interferometric data-stacks: Squeesar. IEEE Trans. Geosci. Remote Sens. 2011, 49, 3460–3470. [Google Scholar] [CrossRef]
- Berardino, P.; Fornaro, G.; Lanari, R.; Sansosti, E. A new algorithm for surface deformation monitoring based on small baseline differential sar interferograms. IEEE Trans. Geosci. Remote Sens. 2002, 40, 2375–2383. [Google Scholar] [CrossRef]
- Casu, F.; Manzo, M.; Lanari, R. A quantitative assessment of the SBAS algorithm performance for surface deformation retrieval from DInSAR data. Remote Sens. Environ. 2006, 102, 195–210. [Google Scholar] [CrossRef]
- Hooper, A.; Zebker, H.; Segall, P.; Kampes, B. A new method for measuring deformation on volcanoes and other natural terrains using InSAR persistent scatterers. Geophys. Res. Lett. 2004, 31. [Google Scholar] [CrossRef]
- Hooper, A.; Segall, P.; Zebker, H. Persistent scatterer interferometric synthetic aperture radar for crustal deformation analysis, with application to Volcán Alcedo, Galápagos. J. Geophys. Res. Solid Earth 2007, 112, B07407. [Google Scholar] [CrossRef]
- Werner, C.; Wegmüller, U.; Strozzi, T.; Wiesmann, A. Interferometric point target analysis for deformation mapping. In Proceedings of the 2003 IEEE International Geoscience and Remote Sensing Symposium, IGARSS’03, Toulouse, France, 21–25 July 2003; pp. 4362–4364.
- Strozzi, T.; Wegmüller, U.; Keusen, H.R.; Graf, K.; Wiesmann, A. Analysis of the terrain displacement along a funicular by SAR interferometry. IEEE Geosci. Remote Sens. Lett. 2006, 3, 15–18. [Google Scholar] [CrossRef]
- Lu, P.; Catani, F.; Tofani, V.; Casagli, N. Quantitative hazard and risk assessment for slow-moving landslides from persistent scatterer interferometry. Landslides 2014, 11, 685–696. [Google Scholar] [CrossRef]
- Li, X.F.; Peter, M.J.; Chen, F.; Zhao, Y.H. Measuring displacement field from TerraSAR-X amplitude images by subpixel correlation: An application to the landslide in shuping, Three Gorges Area. Acta Petrol. Sin. 2011, 27, 3843–3850. [Google Scholar]
- Singleton, A.; Li, Z.; Hoey, T.; Muller, J.-P. Evaluating sub-pixel offset techniques as an alternative to D-InSAR for monitoring episodic landslide movements in vegetated terrain. Remote Sens. Environ. 2014, 147, 133–144. [Google Scholar] [CrossRef]
- Shi, X.; Zhang, L.; Balz, T.; Liao, M. Landslide deformation monitoring using point-like target offset tracking with multi-mode high-resolution TerraSAR-X data. ISPRS J. Photogram. Remote Sens. 2015, 105, 128–140. [Google Scholar] [CrossRef]
- Raspini, F.; Ciampalini, A.; Del Conte, S.; Lombardi, L.; Nocentini, M.; Gigli, G.; Ferretti, A.; Casagli, N. Exploitation of amplitude and phase of satellite SAR images for landslide mapping: The case of Montescaglioso (South Italy). Remote Sens. 2015, 7, 14576–14596. [Google Scholar] [CrossRef]
- Bhattacharya, A.; Mukherjee, K.; Kuri, M.; Vöge, M.; Sharma, M.; Arora, M.; Bhasin, R.K. Potential of SAR intensity tracking technique to estimate displacement rate in a landslide-prone area in Haridwar region, India. Nat. Hazards 2015, 79, 2101–2121. [Google Scholar] [CrossRef]
- Massonnet, D.; Feigl, K.L. Radar interferometry and its application to changes in the Earth’s surface. Rev. Geophys. 1998, 36, 441–500. [Google Scholar] [CrossRef]
- Jiang, M.; Li, Z.; Ding, X.; Zhu, J.-J.; Feng, G. Modeling minimum and maximum detectable deformation gradients of interferometric SAR measurements. Int. J. Appl. Earth Obs. Geoinform. 2011, 13, 766–777. [Google Scholar] [CrossRef]
- Chen, M.; Tomás, R.; Li, Z.; Motagh, M.; Li, T.; Hu, L.; Gong, H.; Li, X.; Yu, J.; Gong, X. Imaging land subsidence induced by groundwater extraction in Beijing (China) using satellite radar interferometry. Remote Sens. 2016, 8, 468. [Google Scholar] [CrossRef]
- Yun, S.H.; Zebker, H.; Segall, P.; Hooper, A.; Poland, M. Interferogram formation in the presence of complex and large deformation. Geophys. Res. Lett. 2007, 34, 237–254. [Google Scholar] [CrossRef]
- De Zan, F. Accuracy of incoherent speckle tracking for circular gaussian signals. IEEE Geosci. Remote Sens. Lett. 2014, 11, 264–267. [Google Scholar] [CrossRef]
- Lu, P.; Shang, Y. Active tectonics revealed by river profiles along the Puqu fault. Water 2015, 7, 1628–1648. [Google Scholar] [CrossRef]
- Qi, S.; Xu, Q.; Lan, H.; Zhang, B.; Liu, J. Spatial distribution analysis of landslides triggered by 12 May 2008 Wenchuan Earthquake, China. Eng. Geol. 2010, 116, 95–108. [Google Scholar] [CrossRef]
- Cui, P.; Chen, X.-Q.; Zhu, Y.-Y.; Su, F.-H.; Wei, F.-Q.; Han, Y.-S.; Liu, H.-J.; Zhuang, J.-Q. The Wenchuan Earthquake (12 May 2008), Sichuan Province, China, and resulting geohazards. Nat. Hazards 2011, 56, 19–36. [Google Scholar] [CrossRef]
- Dai, F.; Xu, C.; Yao, X.; Xu, L.; Tu, X.; Gong, Q. Spatial distribution of landslides triggered by the 2008 Ms 8.0 Wenchuan Earthquake, China. J. Asian Earth Sci. 2011, 40, 883–895. [Google Scholar] [CrossRef]
- Lu, P.; Wu, H.; Qiao, G.; Li, W.; Scaioni, M.; Feng, T.; Liu, S.; Chen, W.; Li, N.; Liu, C. Model test study on monitoring dynamic process of slope failure through spatial sensor network. Environ. Earth Sci. 2015, 74, 3315–3332. [Google Scholar] [CrossRef]
- Notti, D.; Meisina, C.; Zucca, F.; Colombo, A. Models to predict persistent scatterers data distribution and their capacity to register movement along the slope. In Proceedings of the Fringe 2011 Workshop, ESRIN, Frascati, Italy, 19–23 September 2011; pp. 17–23.
- Handwerger, A.L.; Roering, J.J.; Schmidt, D.A.; Rempel, A.W. Kinematics of Earthflows in the Northern California coast ranges using satellite interferometry. Geomorphology 2015, 246, 321–333. [Google Scholar] [CrossRef]
- Lu, P.; Bai, S.; Casagli, N. Spatial relationships between landslide occurrences and land cover across the Arno river basin (Italy). Environ. Earth Sci. 2015, 74, 5541–5555. [Google Scholar] [CrossRef]
- Notti, D.; Herrera, G.; Bianchini, S.; Meisina, C.; García-Davalillo, J.C.; Zucca, F. A methodology for improving landslide PSI data analysis. Int. J. Remote Sens. 2014, 35, 2186–2214. [Google Scholar]
- Tofani, V.; Raspini, F.; Catani, F.; Casagli, N. Persistent Scatterer Interferometry (PSI) technique for landslide characterization and monitoring. Remote Sens. 2013, 5, 1045–1065. [Google Scholar] [CrossRef]
© 2016 by the authors; licensee MDPI, Basel, Switzerland. This article is an open access article distributed under the terms and conditions of the Creative Commons Attribution (CC-BY) license (http://creativecommons.org/licenses/by/4.0/).


