
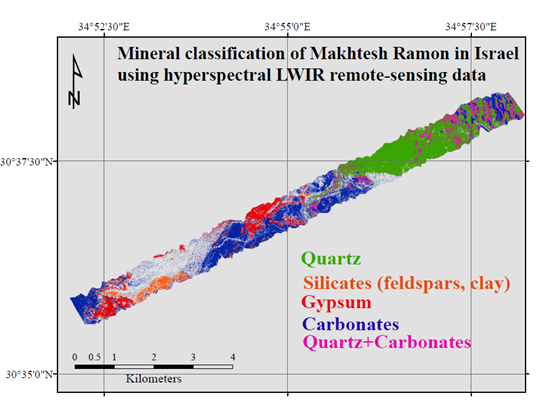
Mineral Classification of Makhtesh Ramon in Israel Using Hyperspectral Longwave Infrared (LWIR) Remote-Sensing Data


Abstract
:
1. Introduction
2. Tools and Methods
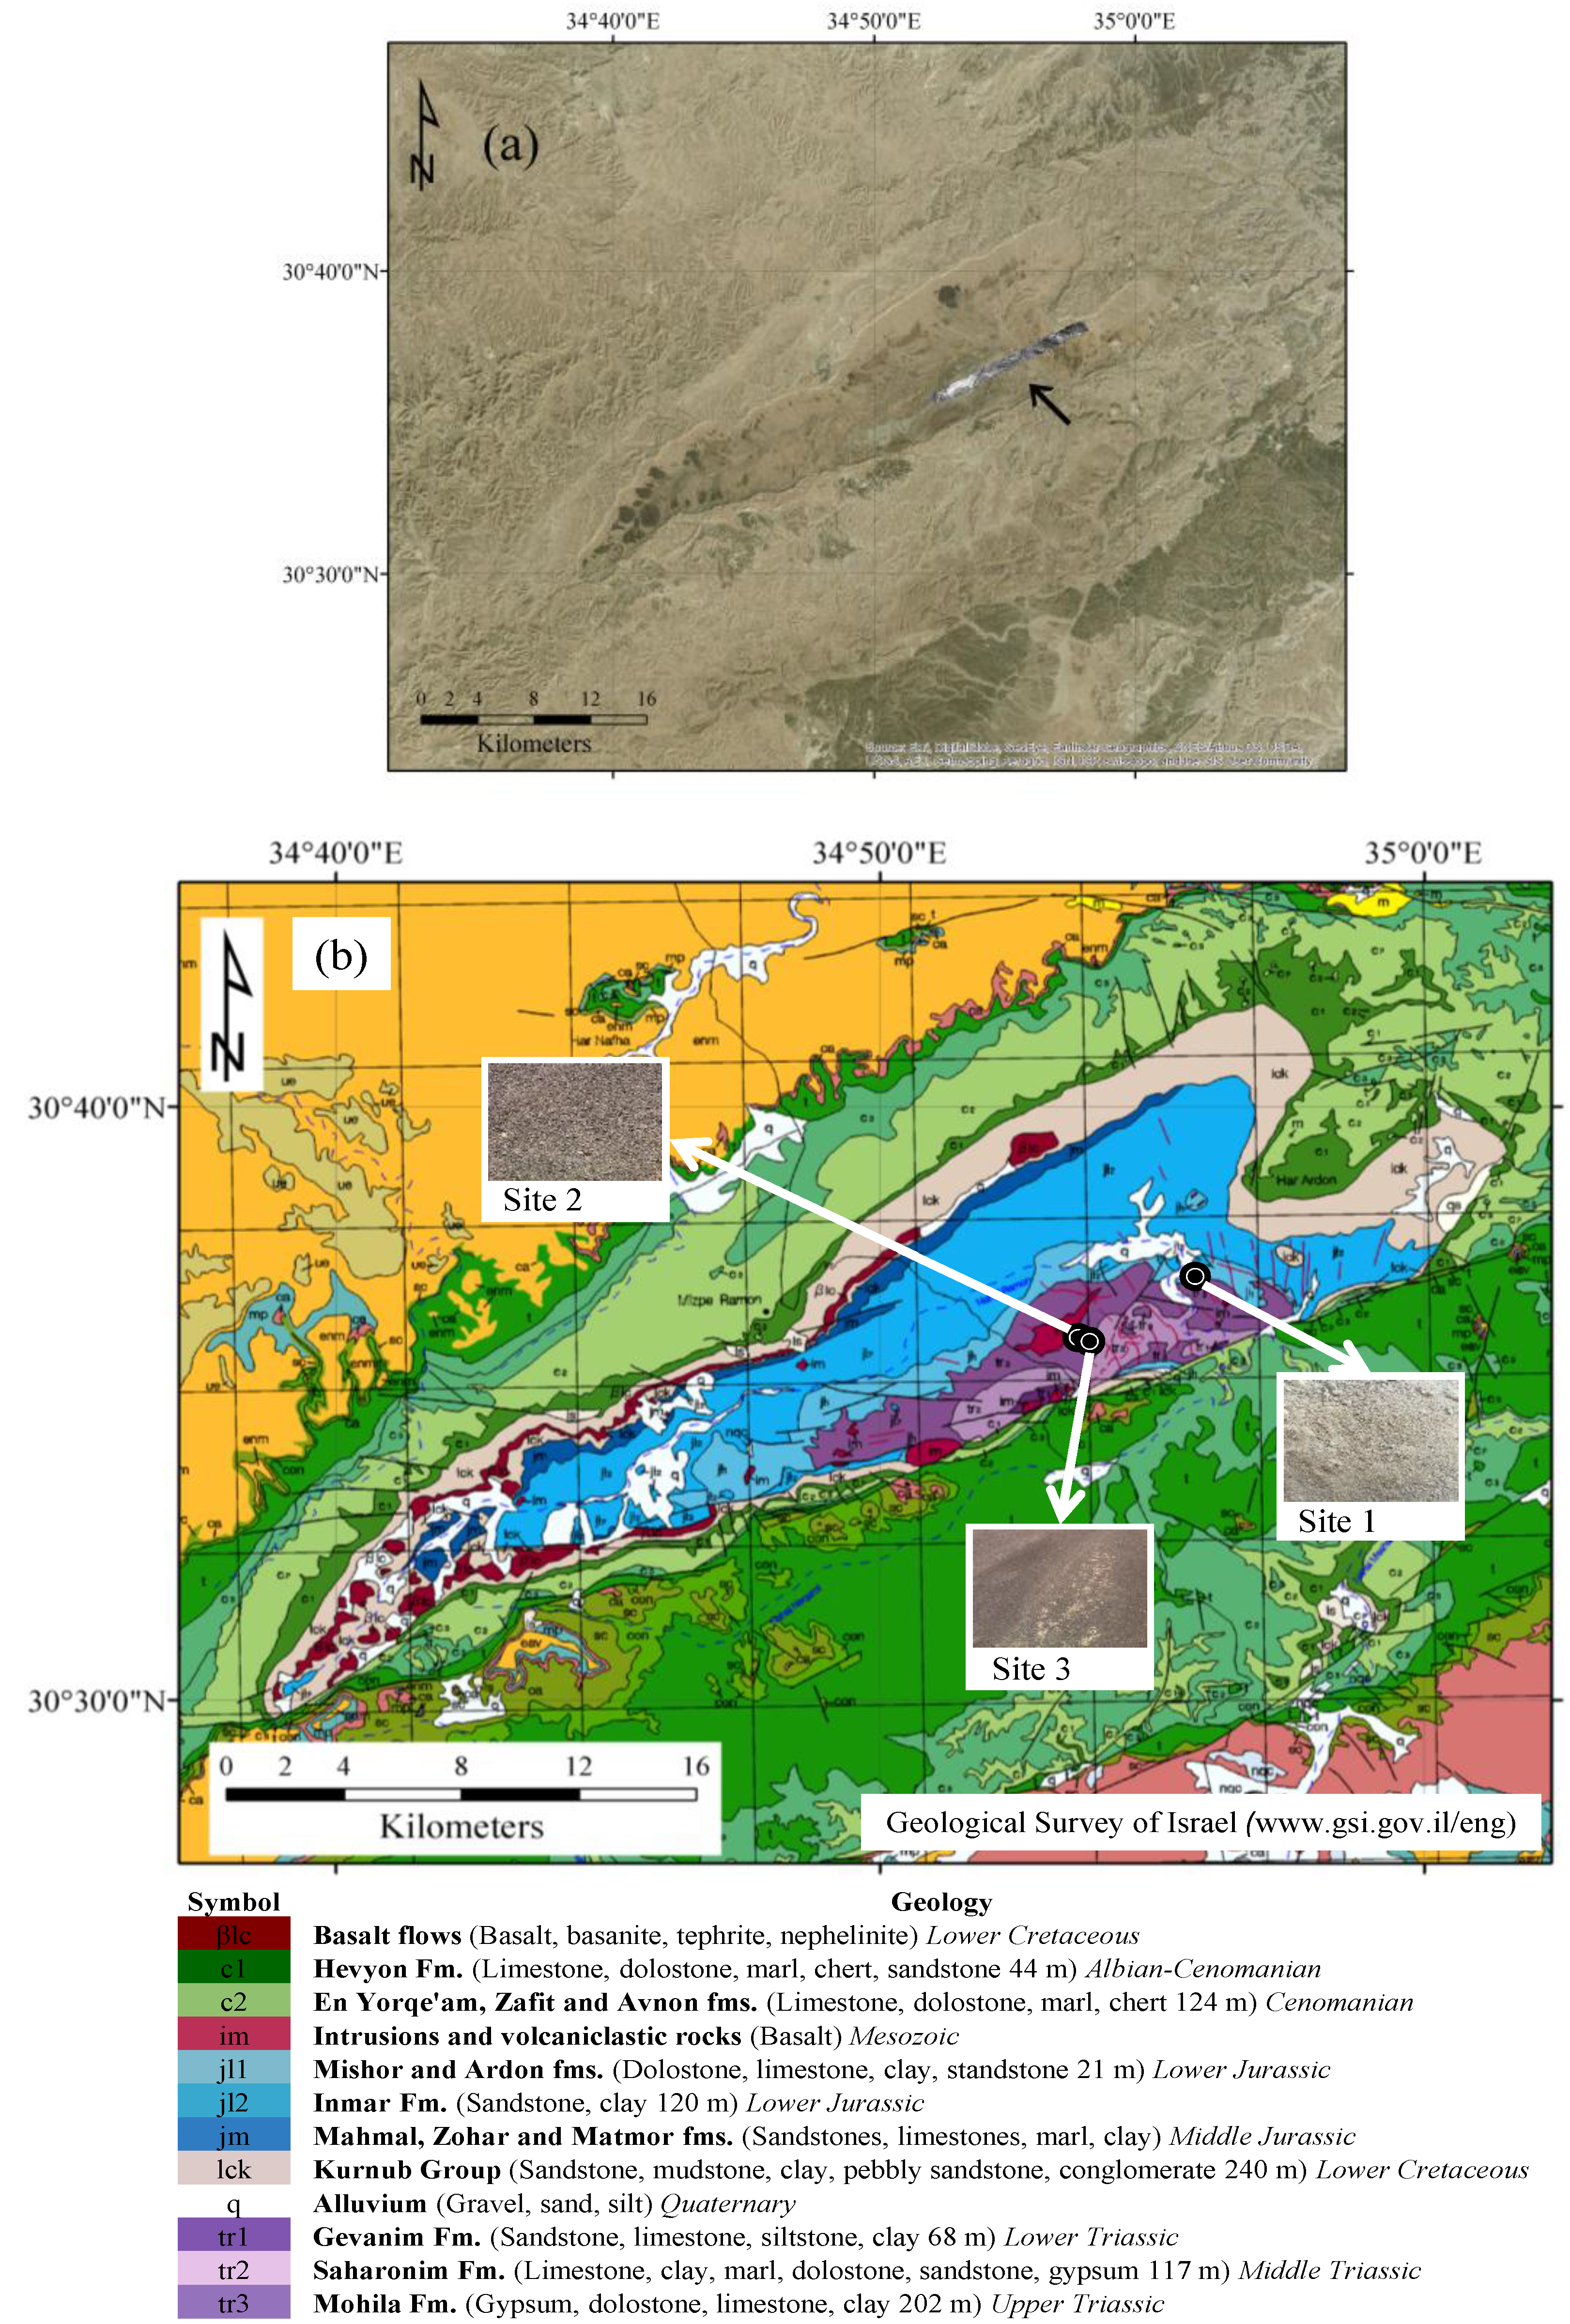
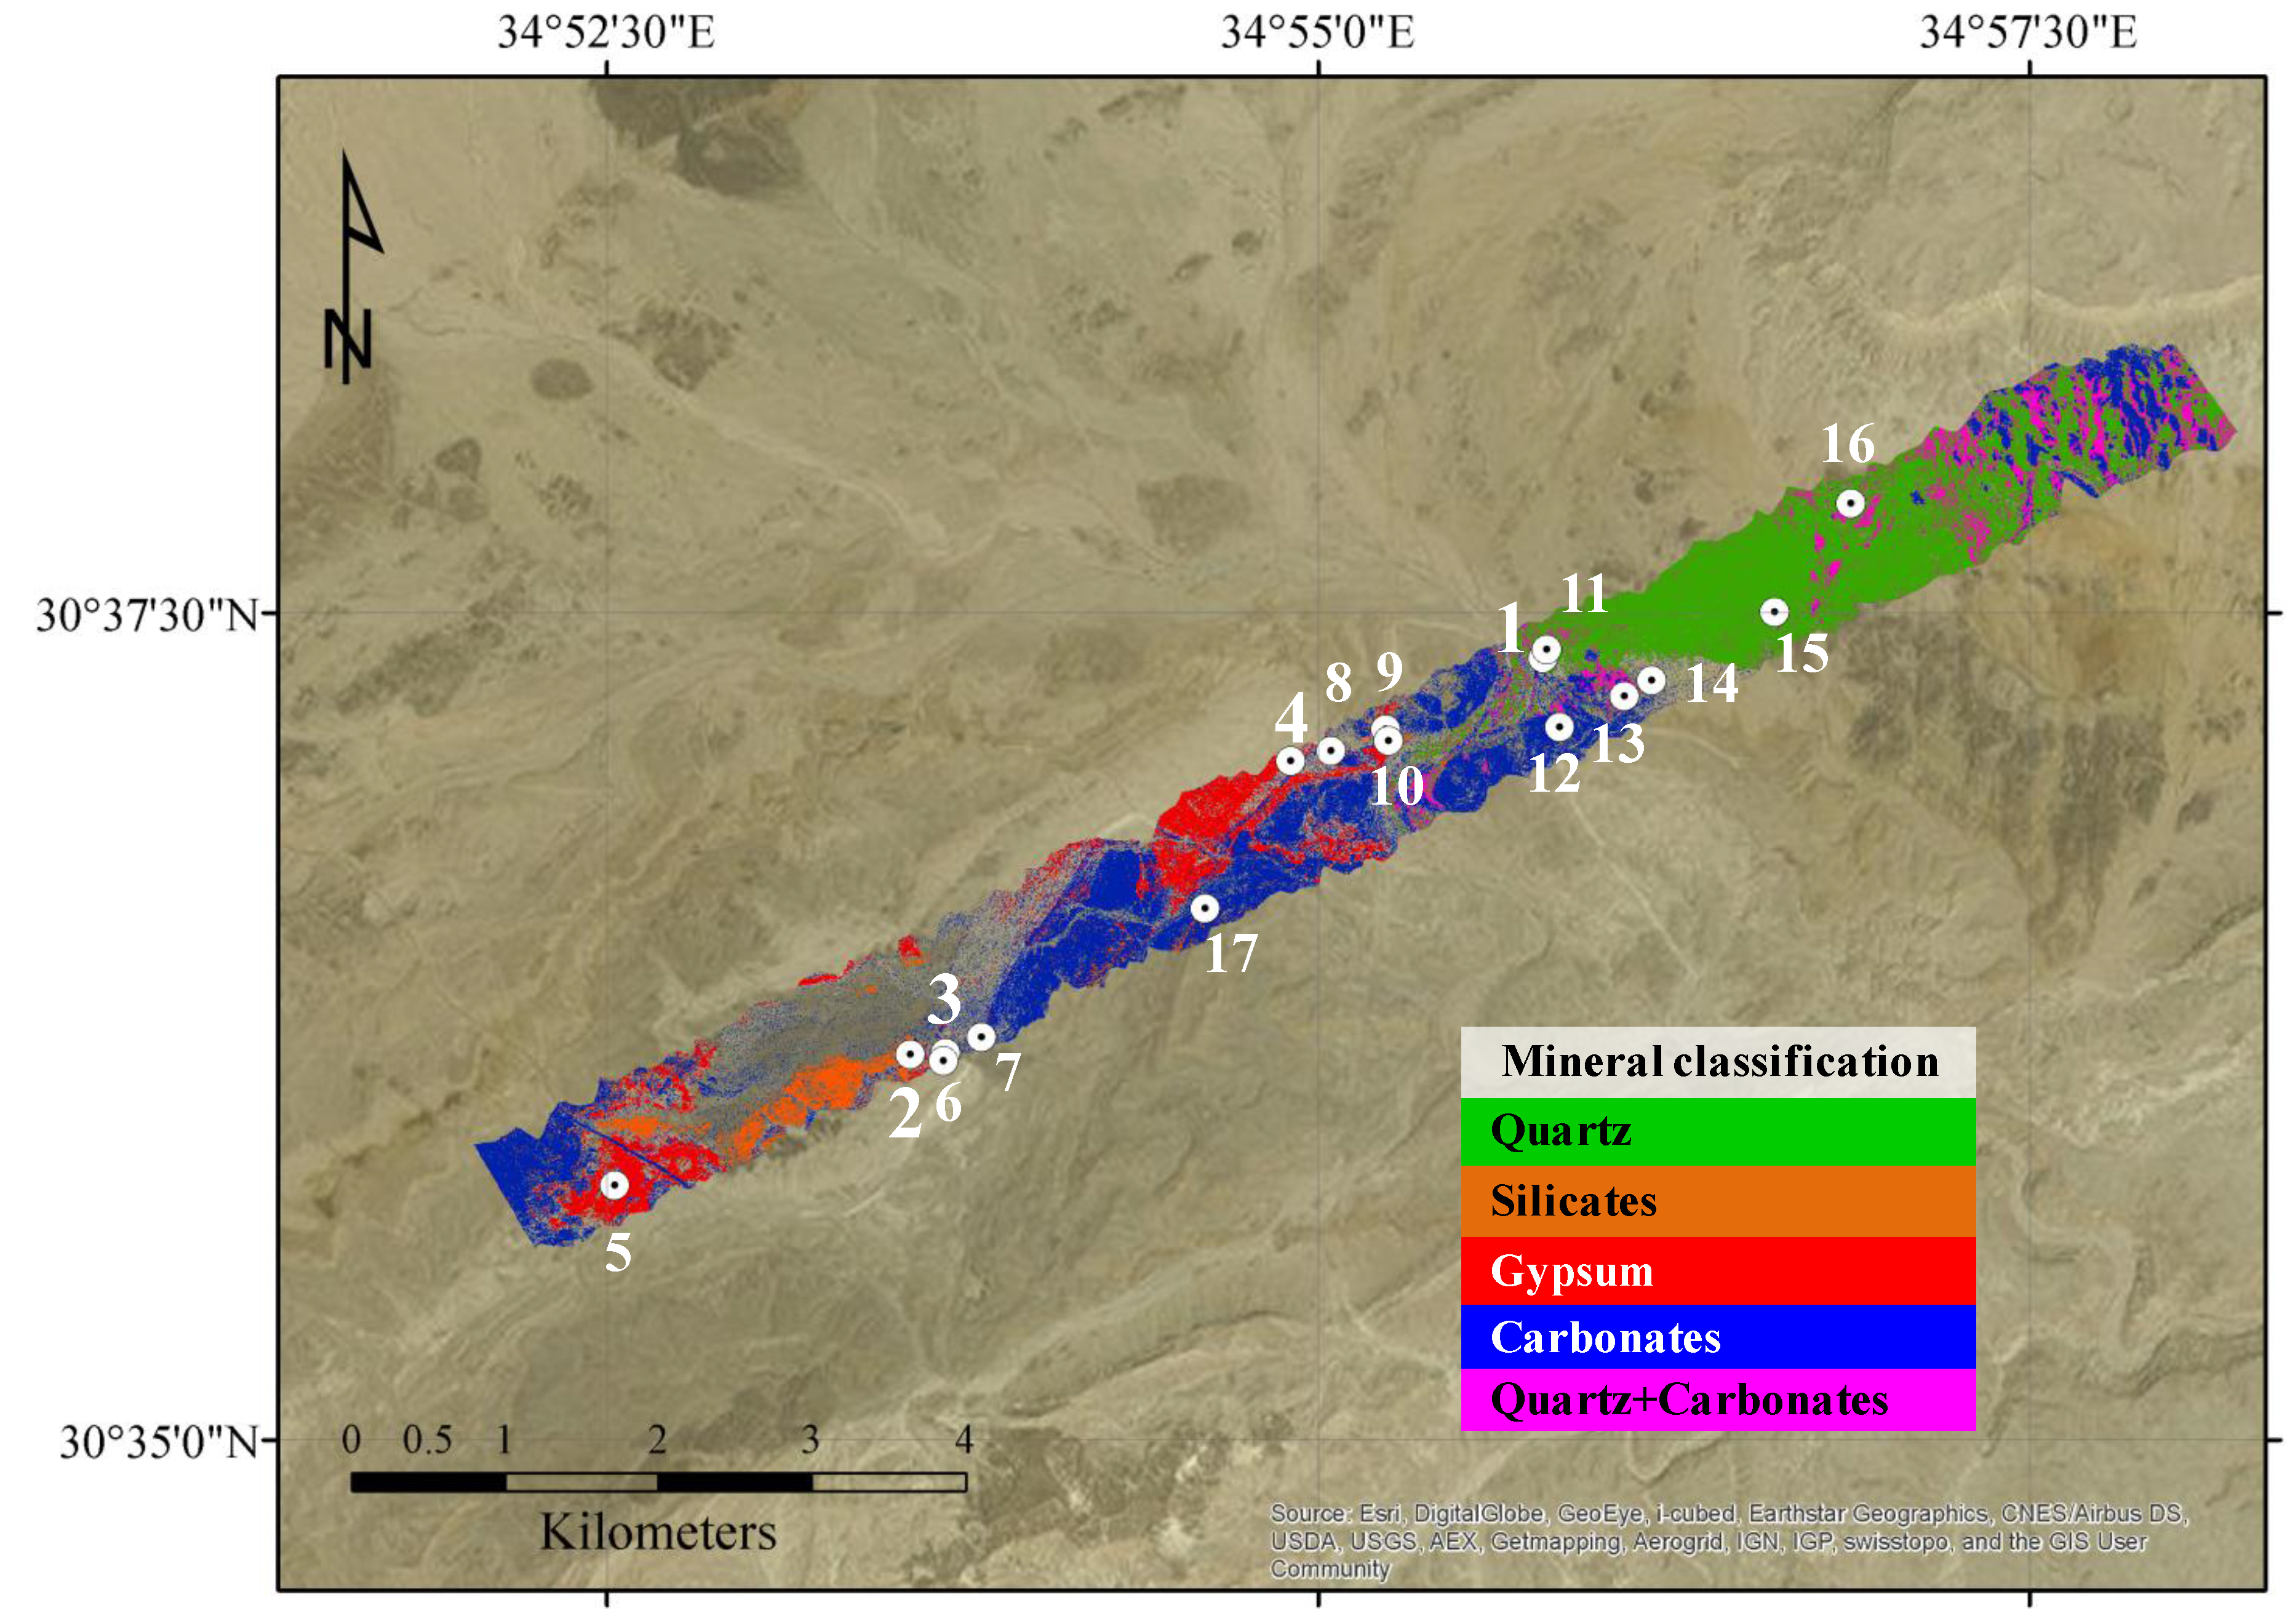
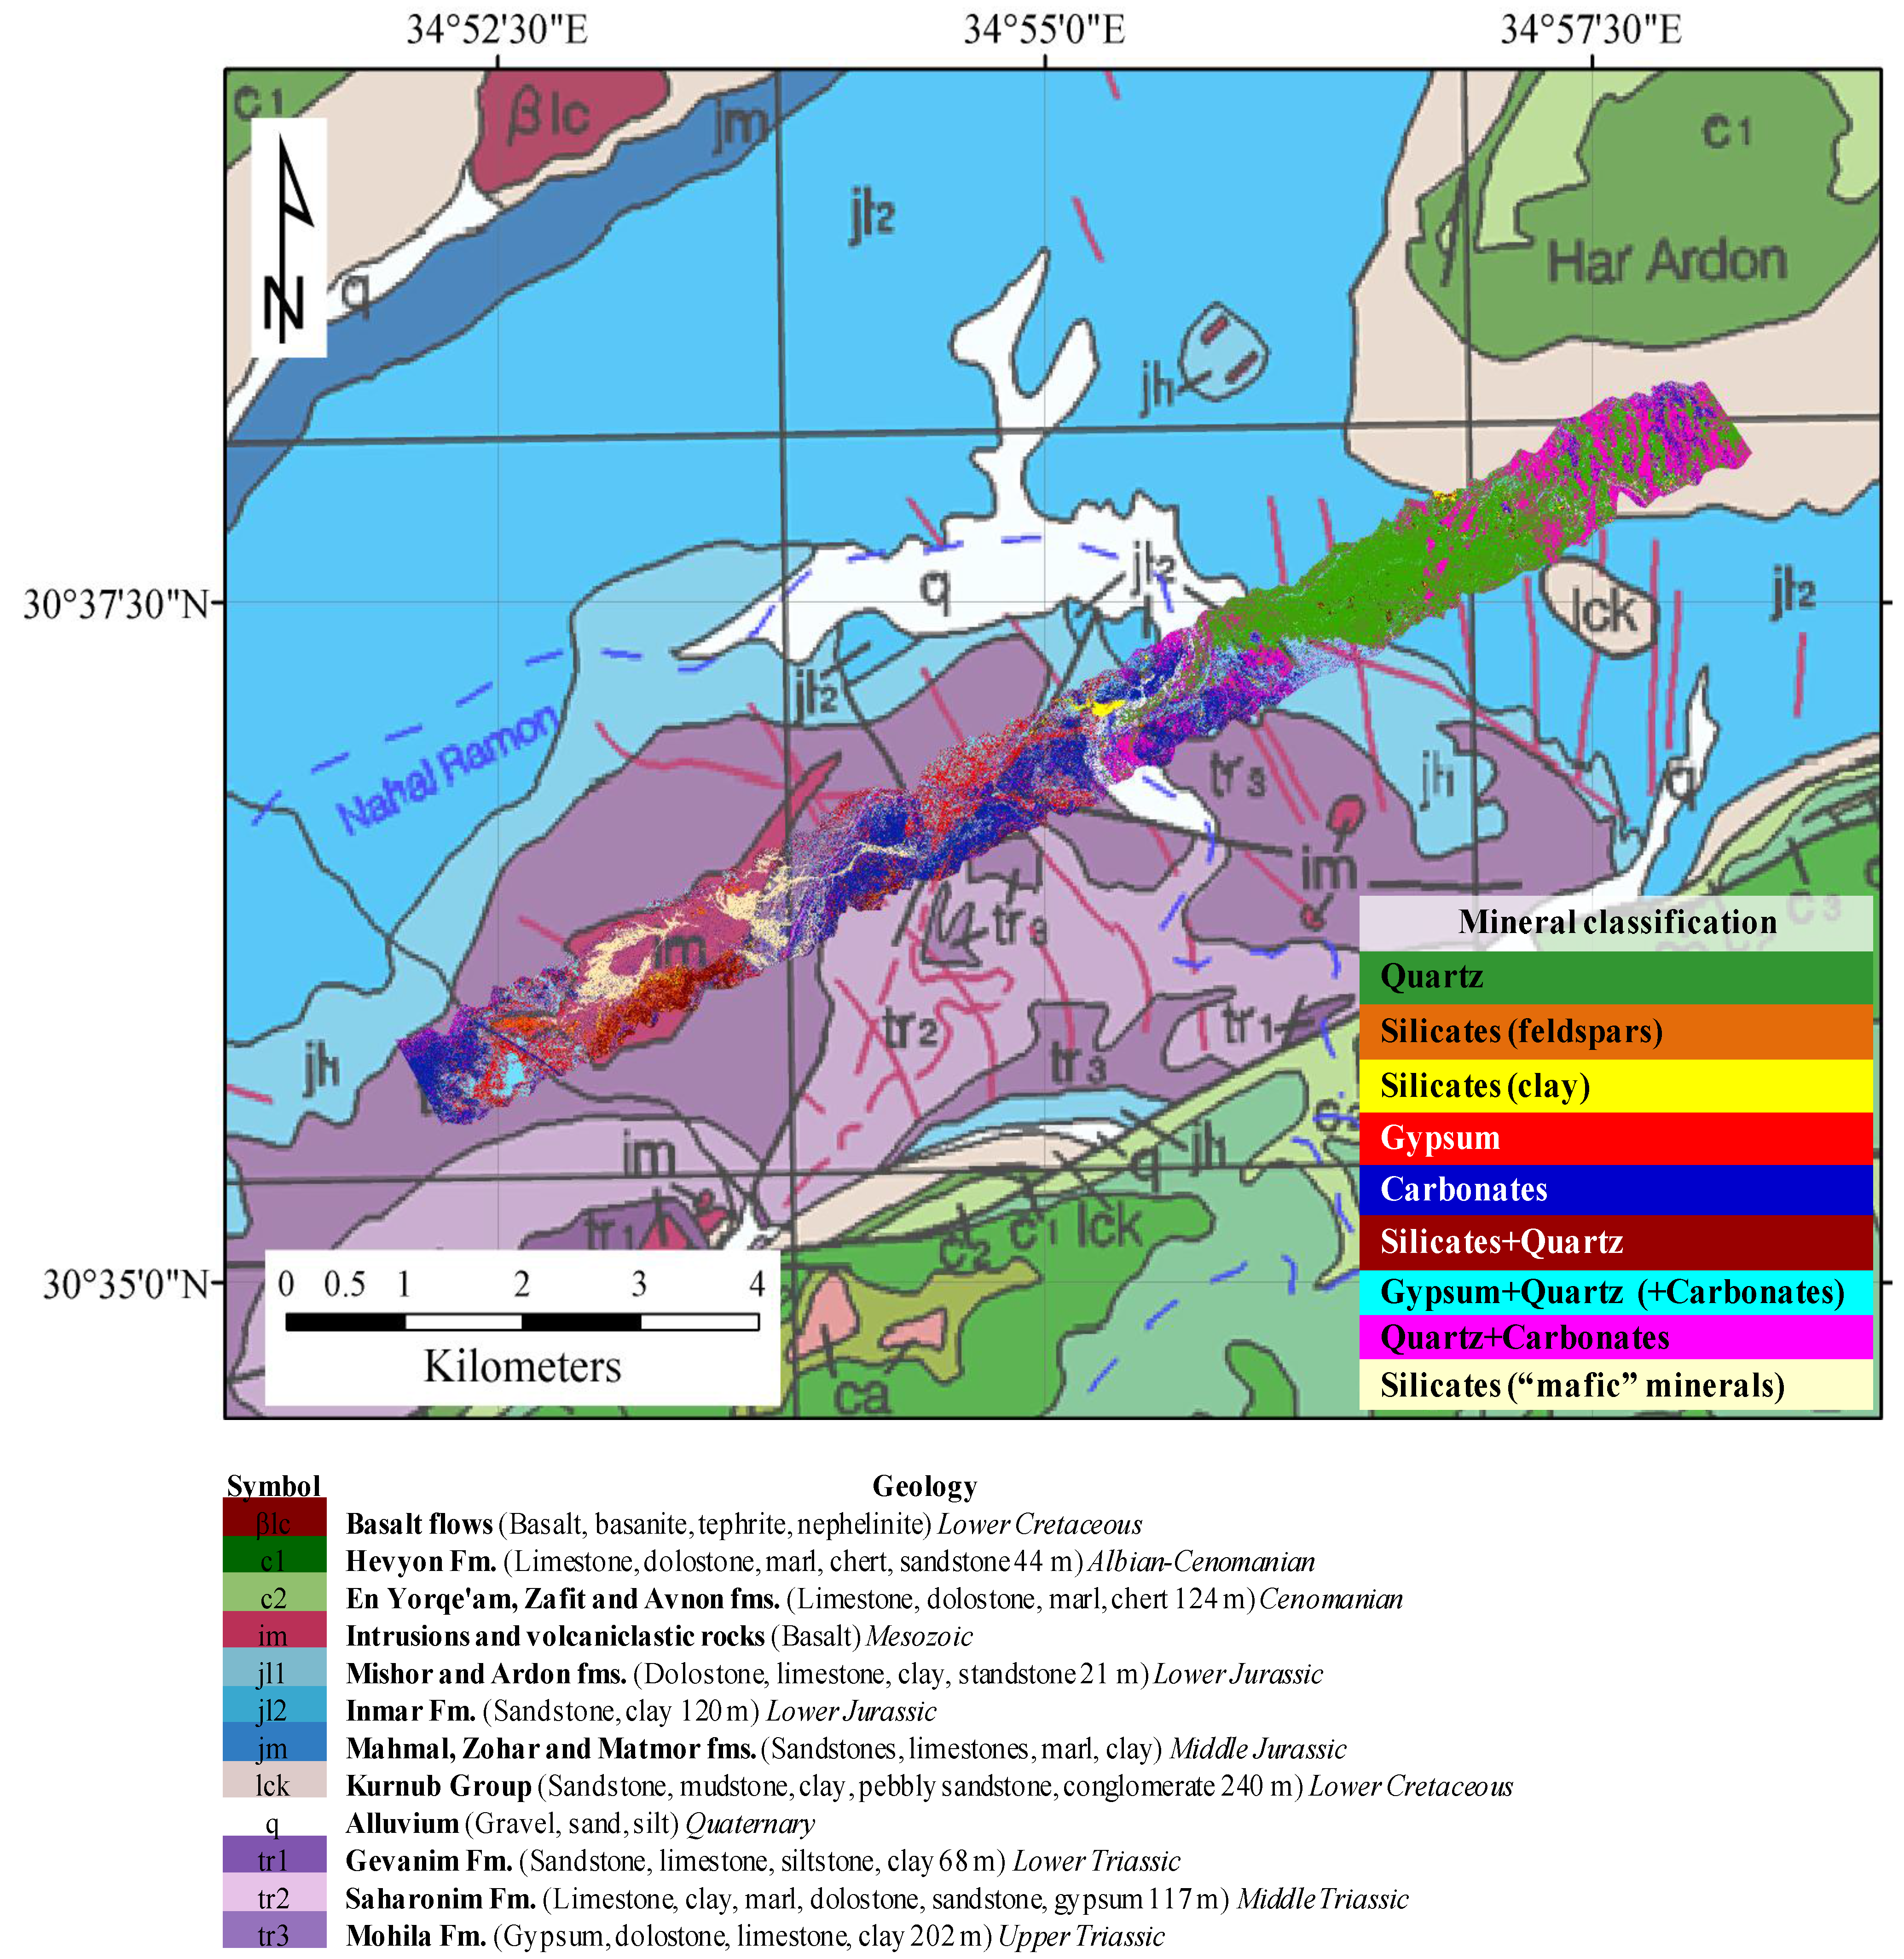
2.1. The Study Area
2.2. The Airborne Data
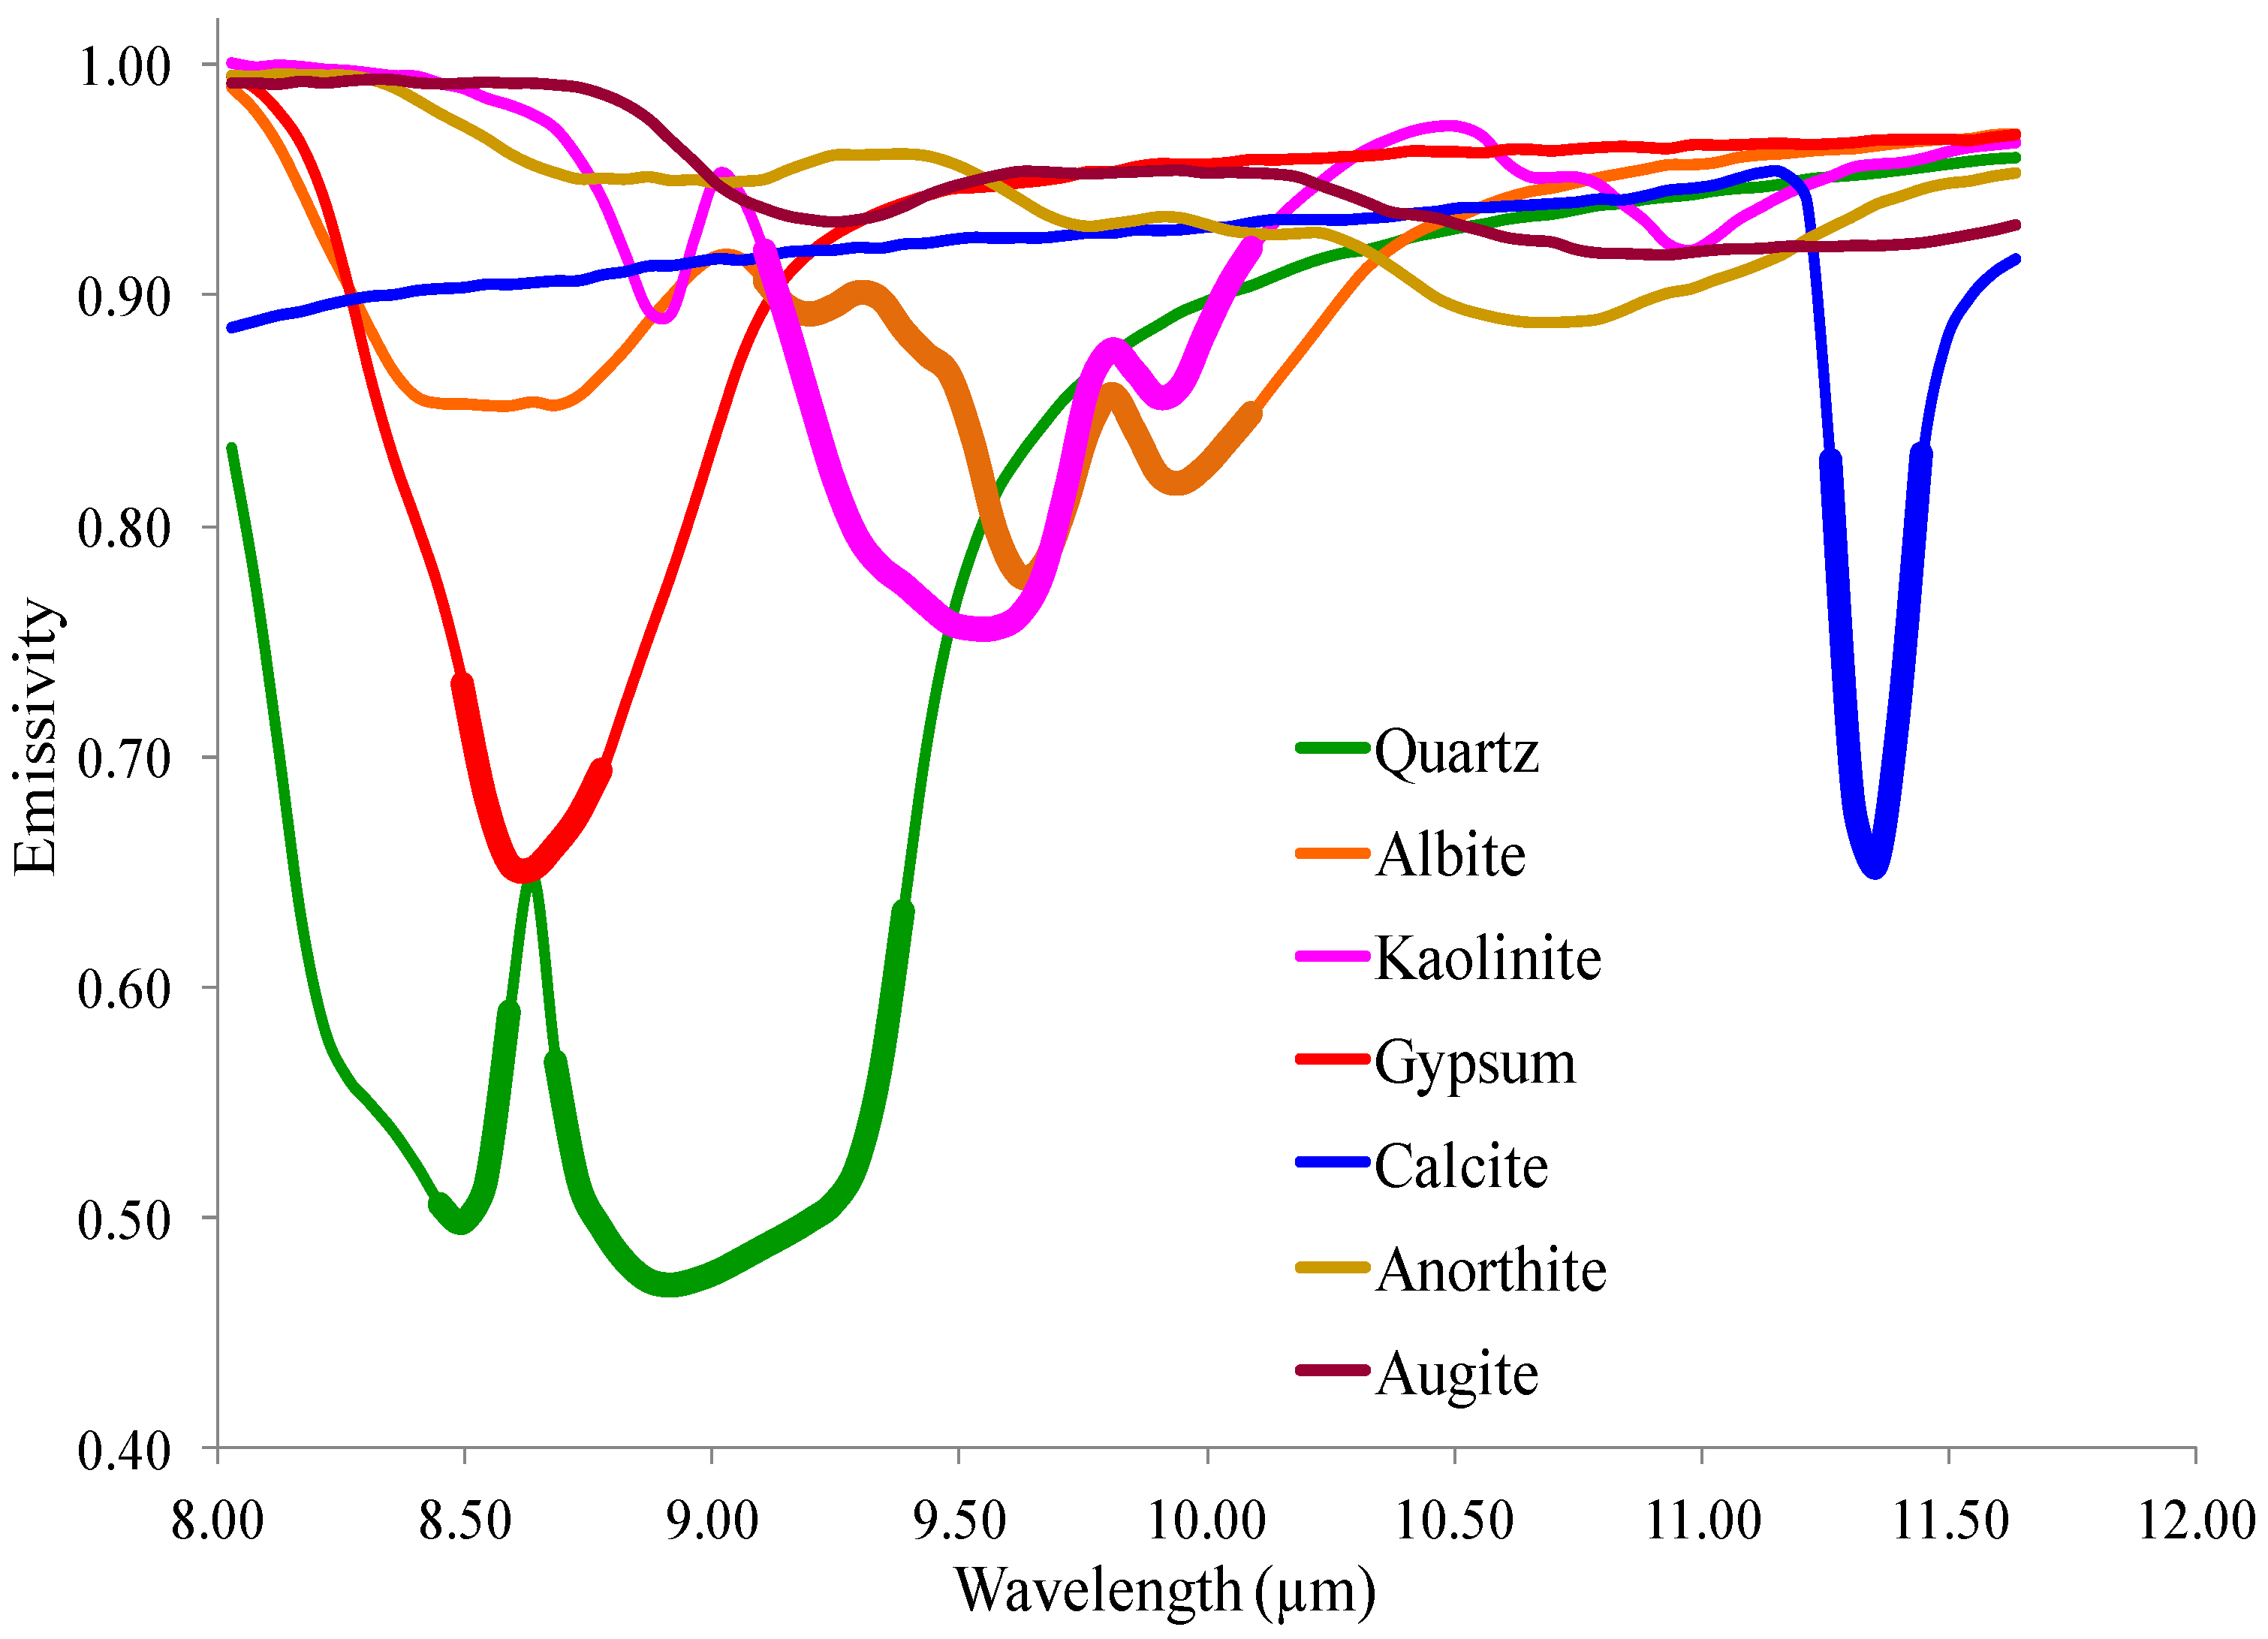
2.3. Field and Laboratory Measurements
2.4. Data Analysis
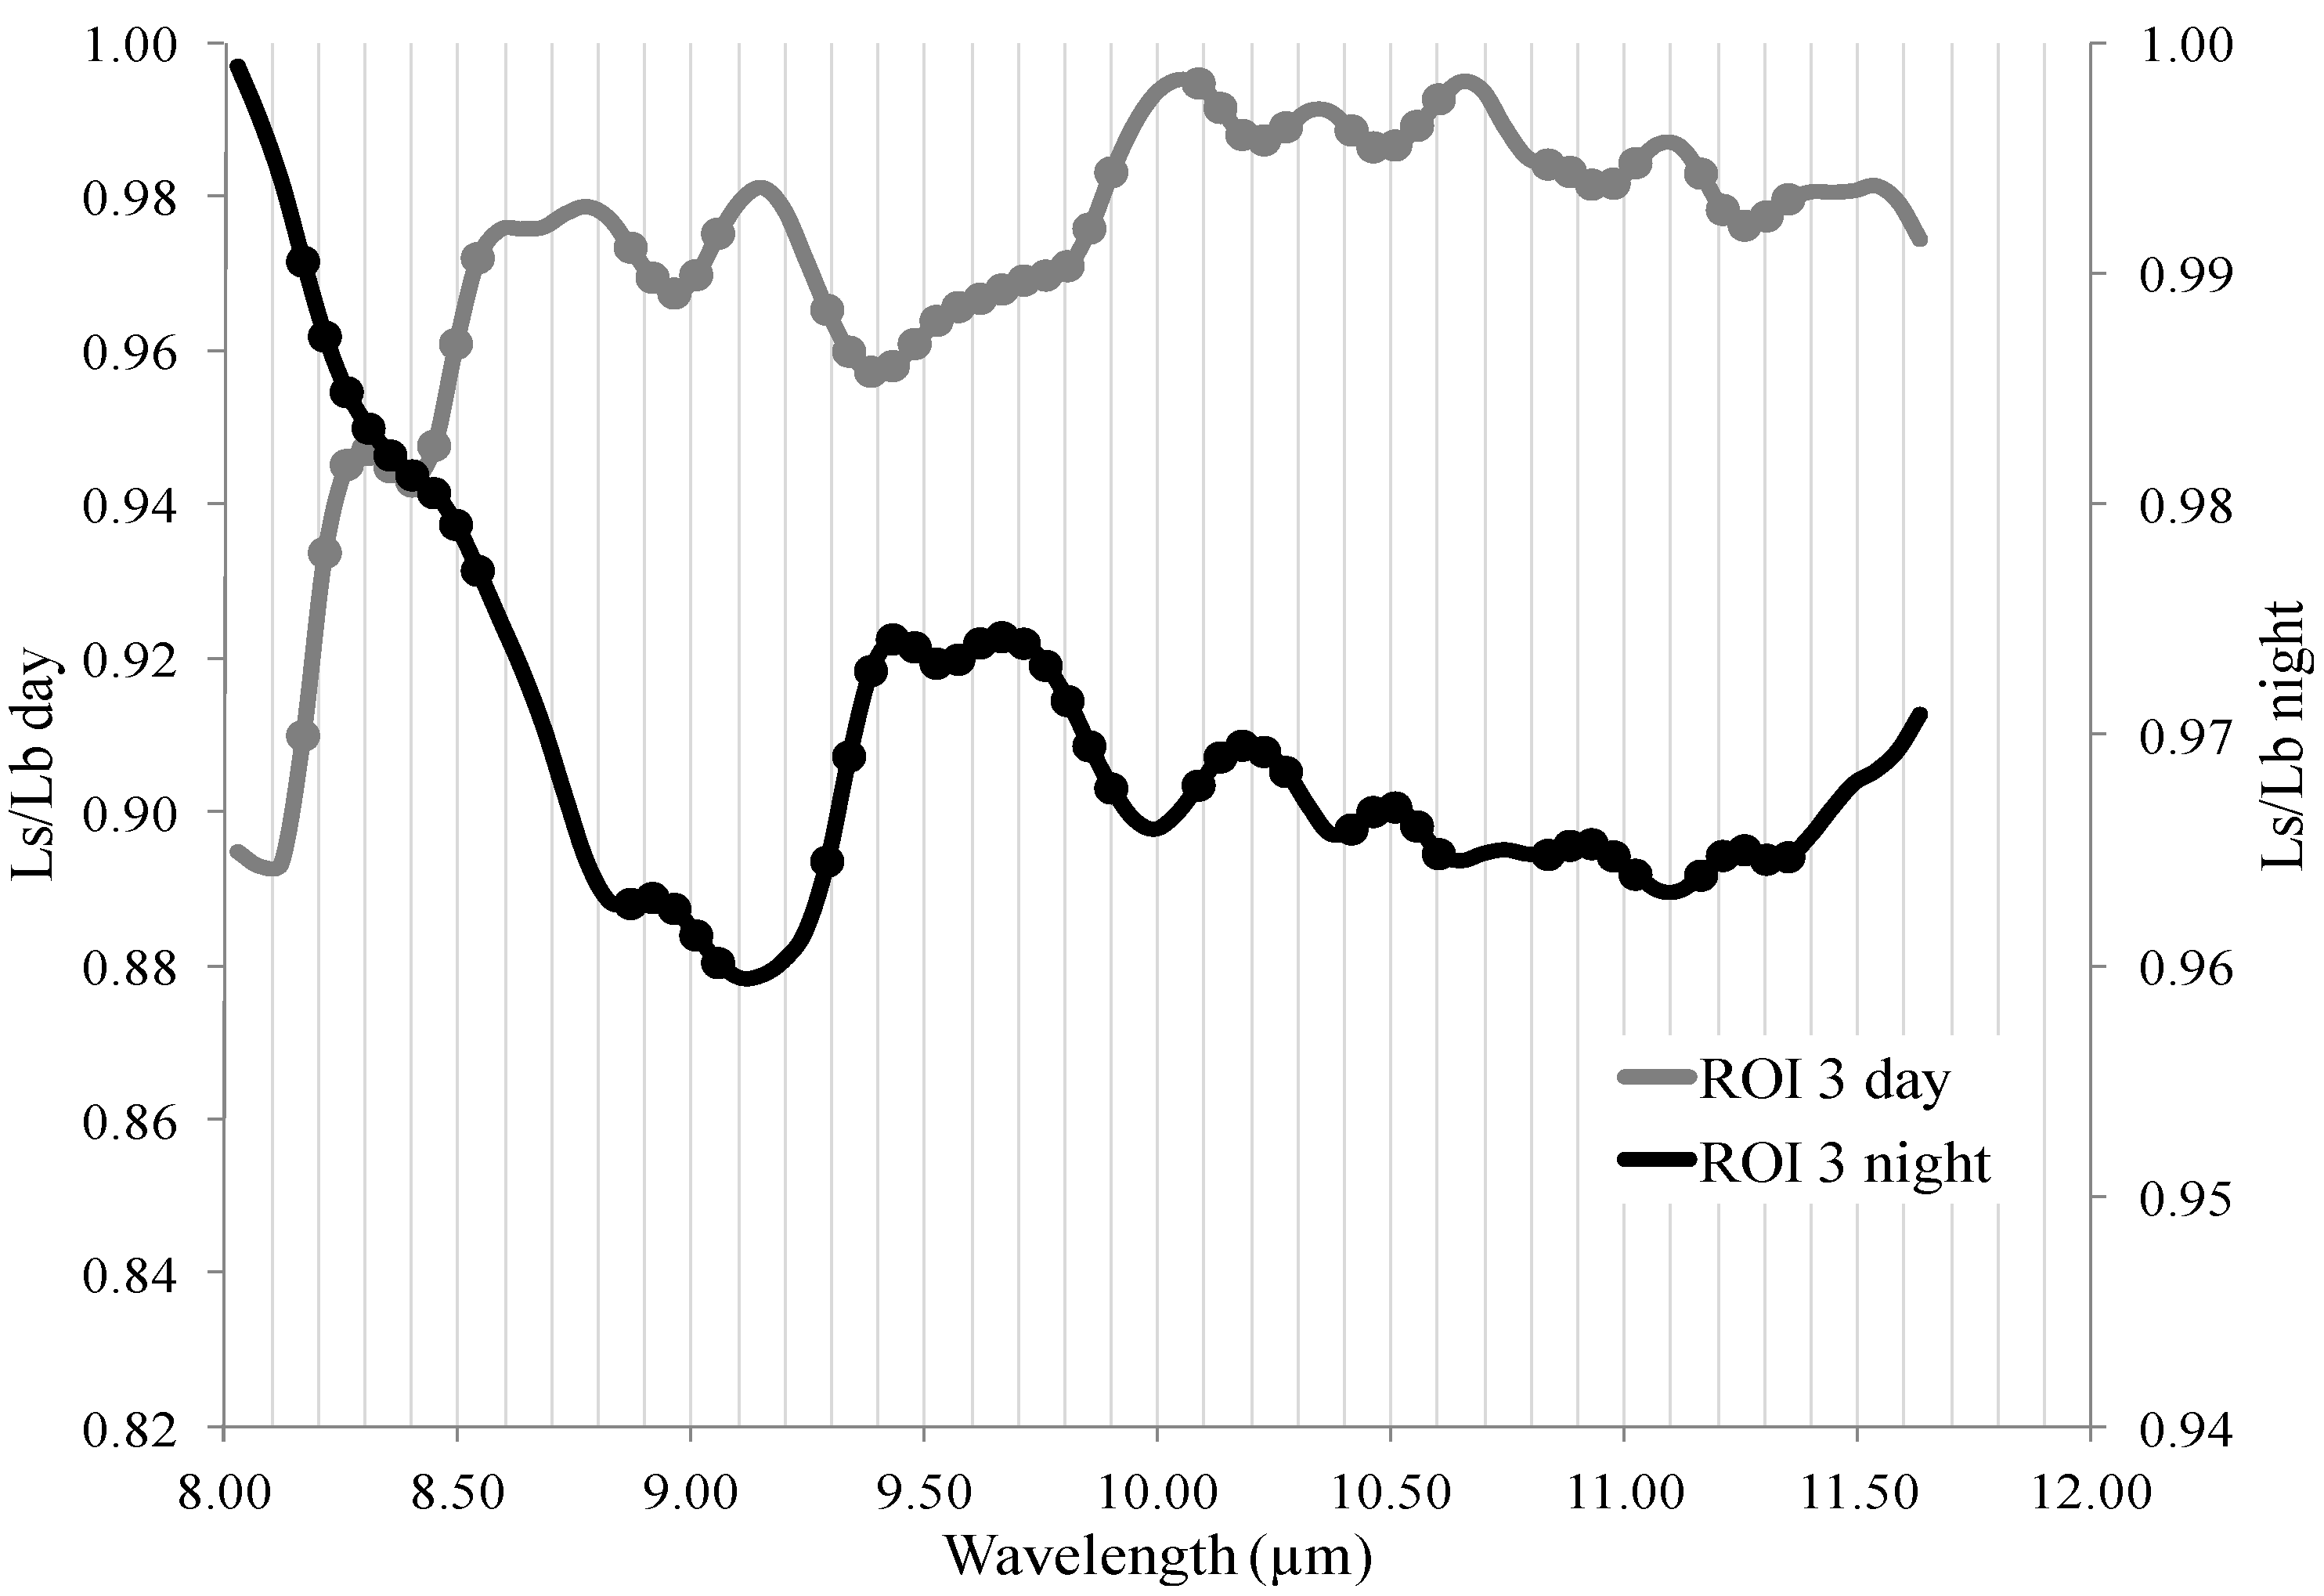
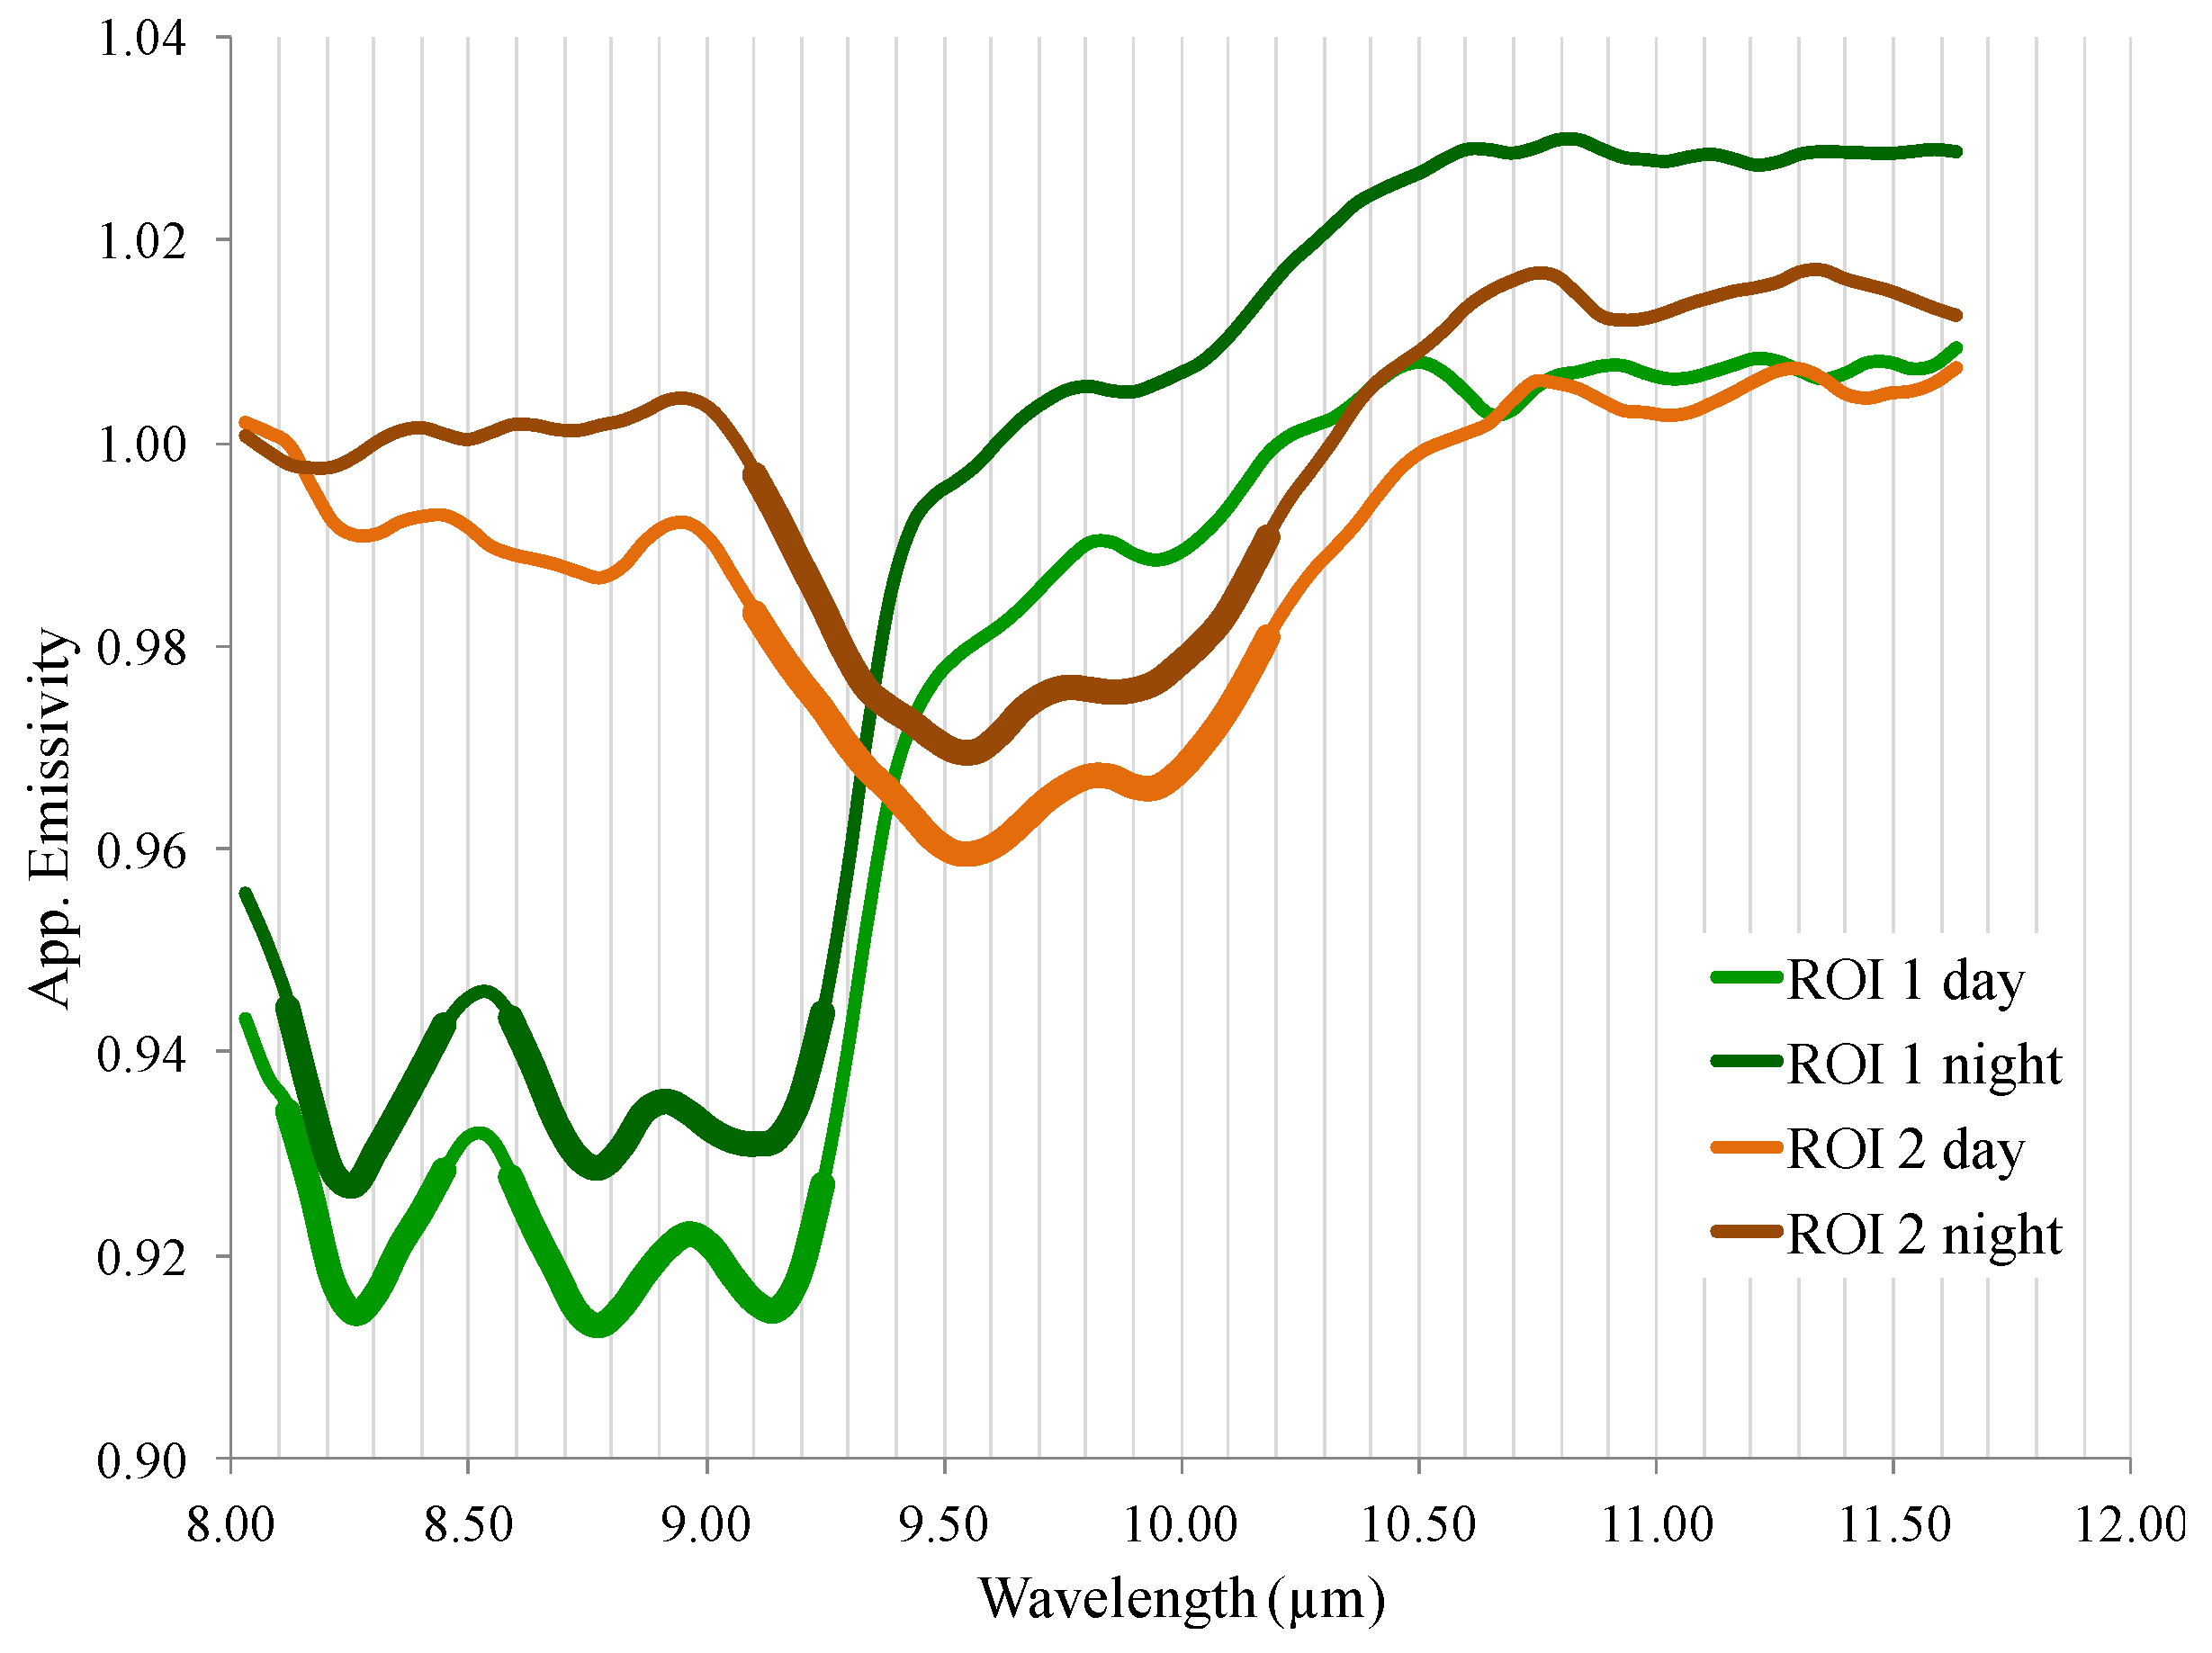
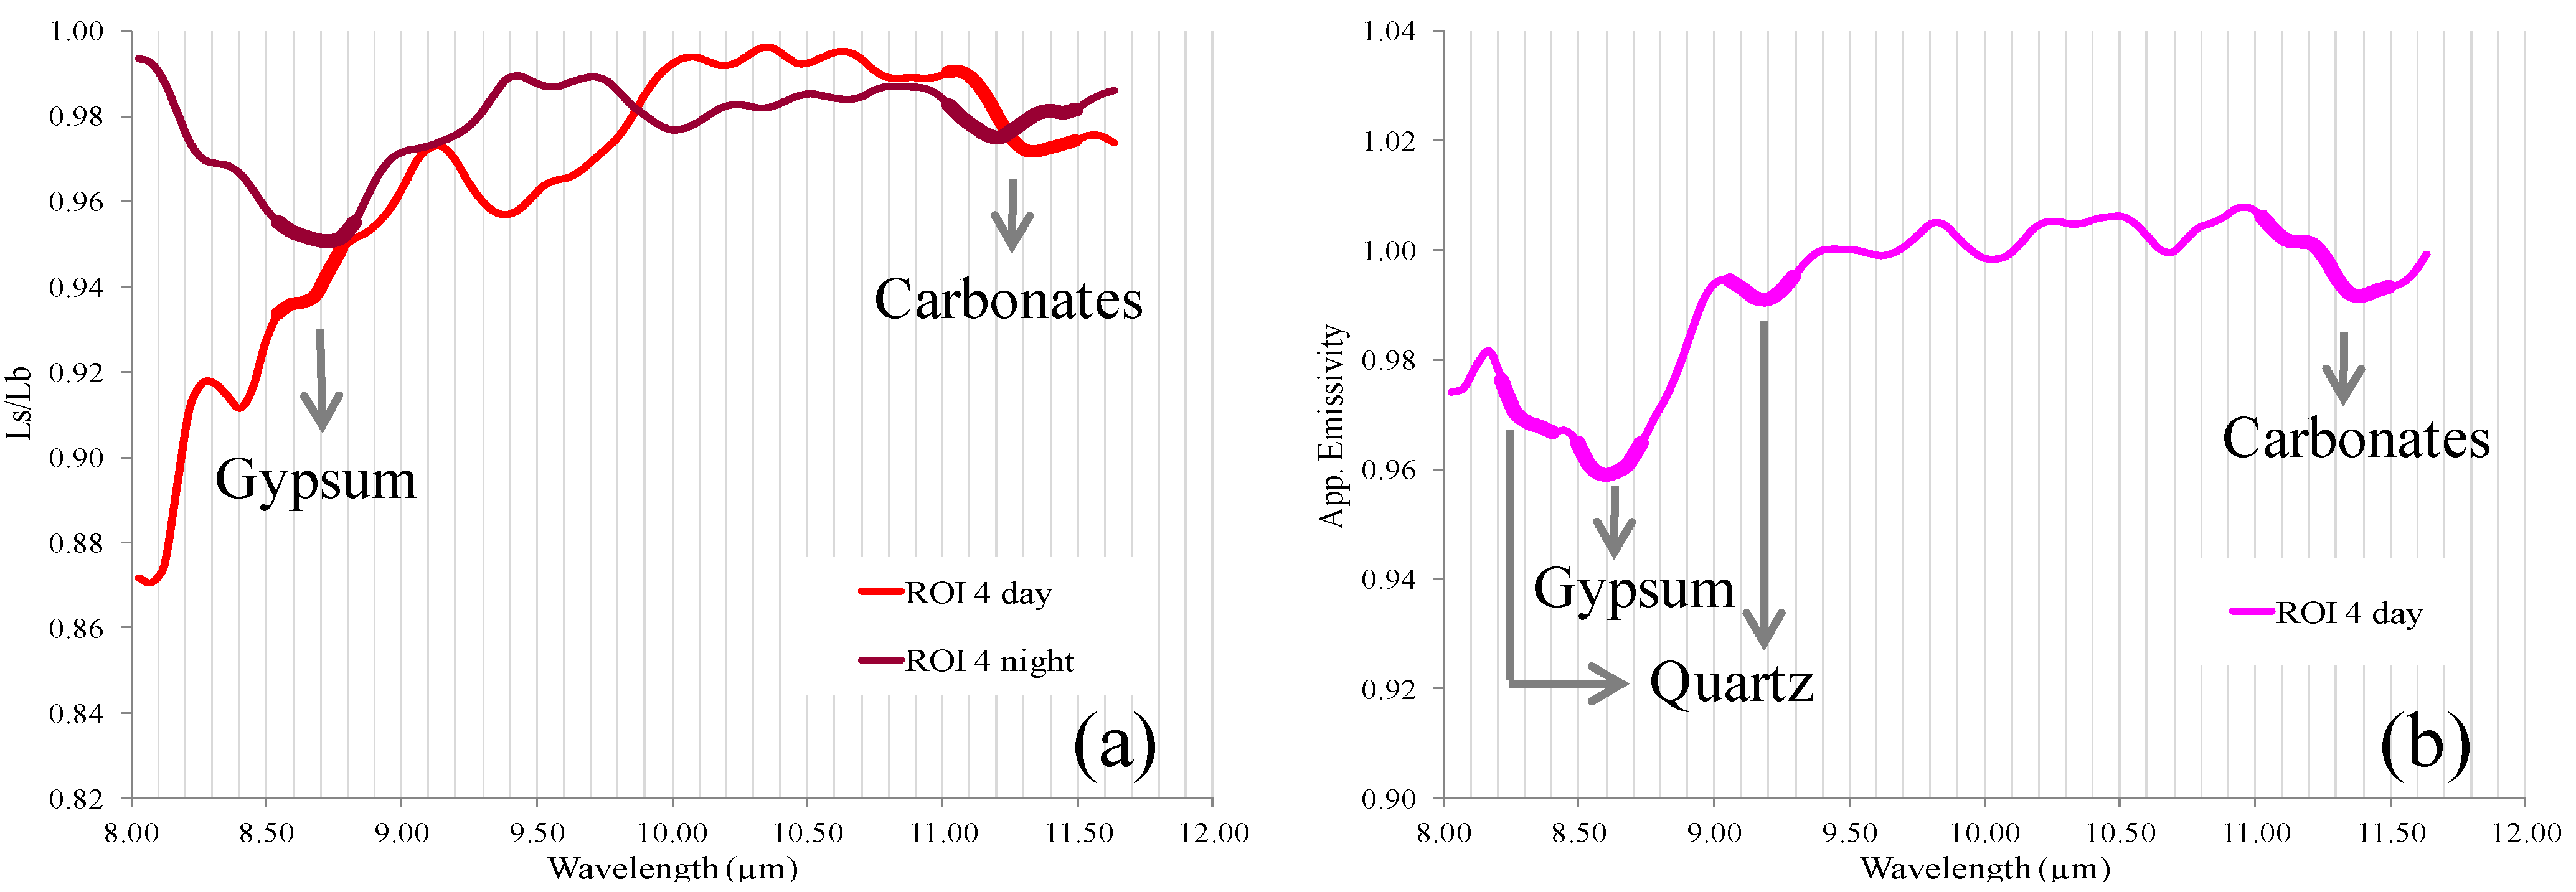
2.4.1. Classification Based on Both Day and Night Images

| Mineral | Indices |
|---|---|
| Quartz | Ls/Lbλ = 8.26 μm a − Ls/Lbλ = 8.54 μm < 0 and Ls/Lbλ = 8.54 μm − Ls/Lbλ = 9.10 μm > 0 |
| Silicates b | Ls/Lbλ = 9.10 μm − Ls/Lbλ = 9.43 μm > 0 and Ls/Lbλ = 9.43 μm − Ls/Lbλ = 10.09 μm < 0 |
| Gypsum | CR_Ls/Lbλ = 8.68 μm (8.17–9.01) c < 0.99 and Ls/Lbλ = 8.68 μm − Ls/Lbλ = 9.10 μm < 0 |
| Carbonates | CR_Ls/Lbλ = 11.21 μm (10.98–11.45) < 0.995 |

2.4.2. Classification Based on Gain Spectrum

| Mineral | Indices |
|---|---|
| Quartz | CRλ = 8.26 μm (8.12–9.29) a < 0.993 and CRλ = 9.15 μm (8.12–9.29) < 0.995 |
| Silicates | CRλ = 9.47 μm (9.10–10.23) < 0.993 |
| Gypsum | CRλ = 8.63 μm (8.40–8.78) < 0.993 |
| Carbonates | CRλ = 11.16 μm (11.02–11.49) < 0.995 |
3. Results and Discussion
3.1. The Straightforward Approach

| ROI | HRS Analysis a | XRD Analysis (from Major to Minor)b | HRS Analysis c |
|---|---|---|---|
| 1 | Quartz | Quartz, Calcite, Dolomite, Kaolinite, Iron oxides | Quartz |
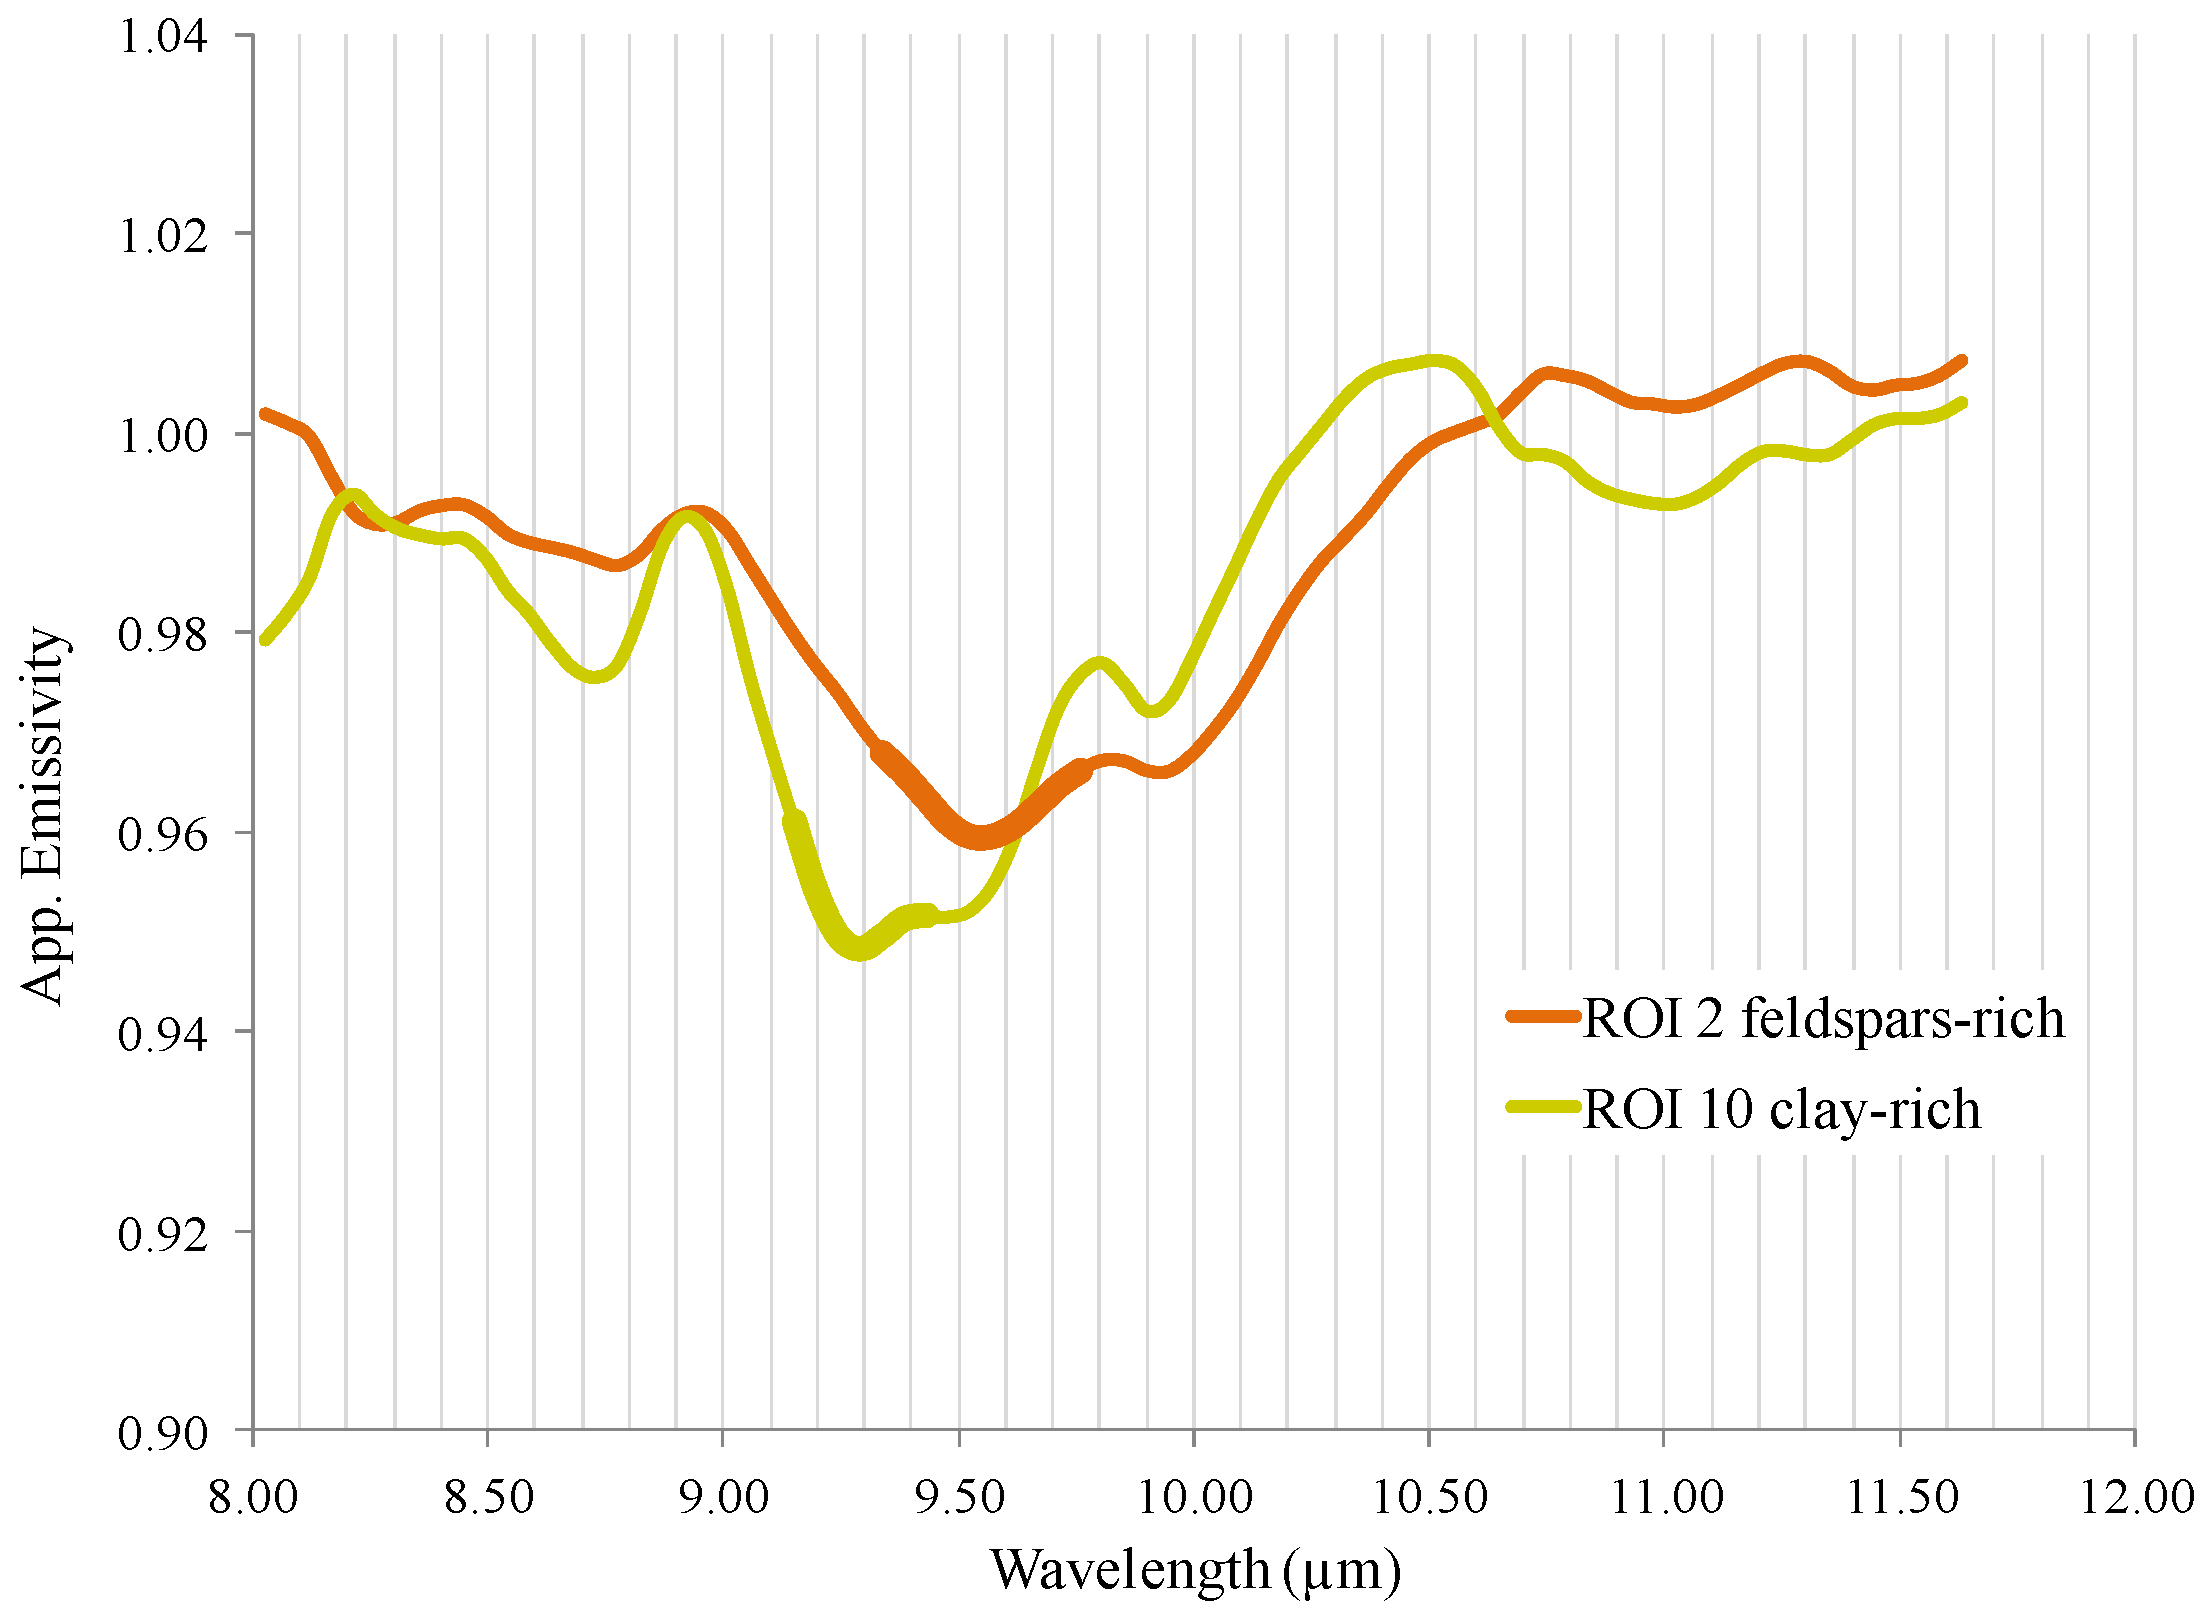
| 2 | Silicates | Albite-low, Quartz, Clinochlore | Silicates, Quartz |
| 3 | Not classified | Anorthite, Albite, Quartz, Ilmenite, Augite | ---- |
| 4 | Gypsum, Carbonates | Gypsum, Quartz, Dolomite, Calcite, Iron oxides, Titanium dioxide | Gypsum, Carbonates, Quartz |
| 5 | Gypsum | Gypsum, Quartz, Brushite | Gypsum, Quartz |
| 6 | Gypsum, Carbonates | Quartz, Gypsum, Calcite, Dolomite, Brushite | Gypsum, Carbonates |
| 7 | Carbonates | Calcite, Quartz | Carbonates, Quartz |
| 8 | Carbonates, Gypsum | Dolomite, Gypsum, Calcite, Quartz, Kaolinite, Titanium dioxide | Carbonates, Gypsum, Quartz |
| 9 | Carbonates | Calcite, Quartz, Dolomite, Kaolinite, Iron oxides | Carbonates, Quartz |
| 10 | Silicates | Calcite, Kaolinite, Quartz, Dolomite, Iron oxides | Silicates |
| 11 | Quartz | Quartz, Calcite, Kaolinite, Iron oxides | Quartz |
| 12 | Carbonates | Calcite, Quartz, Dolomite, Kaolinite | Carbonates, Quartz |
| 13 | Quartz, Carbonates | Quartz, Calcite, Kaolinite, Dolomite, Iron oxides | Quartz, Carbonates |
| 14 | Carbonates | Calcite, Quartz, Dolomite, Kaolinite, Iron oxides | Quartz, Carbonates |
| 15 | Quartz | Quartz, Calcite, Iron oxides | Quartz |
| 16 | Quartz, Carbonates | Calcite, Quartz, Kaolinite, Iron oxides, Dolomite | Quartz, Carbonates |
| 17 | Carbonates, Silicates | Calcite, Quartz, Dolomite, Albite | Carbonates, Silicates, Quartz |
3.2. The Gain Spectrum Approach


4. Summary and Conclusions
Acknowledgments
Author Contributions
Conflicts of Interest
References
- Rowan, L.C.; Mars, J.C. Lithologic mapping in the Mountain Pass, California area using Advanced Spaceborne Thermal Emission and Reflection Radiometer (ASTER) data. Remote Sens. Environ. 2003, 84, 350–366. [Google Scholar] [CrossRef]
- Vaughan, R.G.; Calvin, W.M.; Taranik, J.V. SEBASS hyperspectral thermal infrared data: Surface emissivity measurement and mineral mapping. Remote Sens. Environ. 2003, 85, 48–63. [Google Scholar] [CrossRef]
- Hook, S.J.; Dmochowski, J.E.; Howard, K.A.; Rowan, L.C.; Karlstrom, K.E.; Stock, J.M. Mapping variations in weight percent silica measured from multispectral thermal infrared imagery—Examples from the Hiller Mountains, Nevada, USA and Tres Virgenes-La Reforma, Baja California Sur, Mexico. Remote Sens. Environ. 2005, 95, 273–289. [Google Scholar] [CrossRef]
- Ninomiya, Y.; Fu, B.; Cudahy, T.J. Detecting lithology with Advanced Spaceborne Thermal Emission and Reflection Radiometer (ASTER) multispectral thermal infrared “radiance-at-sensor” data. Remote Sens. Environ. 2005, 99, 127–139. [Google Scholar] [CrossRef]
- Eisele, A.; Lau, I.; Hewson, R.; Carter, D.; Wheaton, B.; Ong, C.; Cudahy, T.J.; Chabrillat, S.; Kaufmann, H. Applicability of the thermal infrared spectral region for the prediction of soil properties across semi-arid agricultural landscapes. Remote Sens. 2012, 4, 3265–3286. [Google Scholar] [CrossRef]
- Gillespie, A.; Rokugawa, S.; Matsunaga, T.; Cothern, J.S.; Hook, S.; Kahle, A.B. A temperature and emissivity separation algorithm for Advanced Spaceborne Thermal Emission and Reflection Radiometer (ASTER) images. IEEE Trans. Geosci. Remote Sens. 1998, 36, 1113–1126. [Google Scholar] [CrossRef]
- Coll, C.; Caselles, V.; Rubio, E.; Sospedra, F.; Enric Valor, E. Temperature and emissivity separation from calibrated data of the digital airborne imaging spectrometer. Remote Sens. Environ. 2001, 76, 250–259. [Google Scholar] [CrossRef]
- Cheng, J.; Liang, S.; Wang, J.; Li, X. A Stepwise refining algorithm of temperature and emissivity separation for hyperspectral thermal infrared data. IEEE Trans. Geosci. Remote Sens. 2010, 48, 1588–1597. [Google Scholar] [CrossRef]
- Young, S.J.; Johnson, B.R.; Hackwell, J.A. An in-scene procedure for atmospheric compensation of thermal hyperspectral data. J. Geophys. Res. 2002, 107, 4774–4793. [Google Scholar] [CrossRef]
- Evenari, M.; Shanan, L.; Tadmor, N. The Negev: The Challenge of a Desert; Harvard University Press: Cambridge, MA, USA, 1982. [Google Scholar]
- The Specim AisaOWL System. Available online: http://www.specim.fi/index.php/products/airborne/aisaowl (accessed on 14 June 2015).
- The Israel Meteorological Service. Available online: http://www.ims.gov.il (accessed on 14 June 2015).
- Notesco, G.; Kopačková, V.; Rojík, P.; Schwartz, G.; Livne, I.; Ben Dor, E. Mineral classification of land surface using multispectral LWIR and hyperspectral SWIR remote-sensing data: A case study over the Sokolov Lignite Open-Pit Mines, the Czech Republic. Remote Sens. 2014, 6, 7005–7025. [Google Scholar] [CrossRef]
- The Arizona State University Spectral Library. Available online: http://speclib.asu.edu (accessed on 14 June 2015).
- Kruse, F.A.; Lefkoff, A.B.; Boardman, J.W.; Heidebrecht, K.B.; Shapiro, A.T.; Barloon, P.J.; Goetz, A.F.H. The spectral image processing system (SIPS)—Interactive visualization and analysis of imaging spectrometer data. Remote Sens. Environ. 1993, 44, 145–163. [Google Scholar] [CrossRef]
- Nativ, R.; Mazor, E. Rain events in an arid environment—Their distribution and ionic and isotopic composition patterns: Makhtesh Ramon Basin, Israel. J. Hydrol. 1987, 89, 205–237. [Google Scholar] [CrossRef]
- Kaufman, H.; Weisbrich, W.; Beyth, M.; Bartov, Y.; Itamar, A.; Ronen, S.; Kafri, U. Mineral identification using GER-II data acquired from Makhtesh Ramon/Negev, Israel. EARSeL Adv. Remote Sens. 1991, 1, 82–92. [Google Scholar]
- Lawes, M.J.; Nanni, R.F. The density, habitat use and social organisation of Dorcas Gazelles (Gazella dorcas) in Makhtesh Ramon, Negev Desert, Israel. J. Arid Environ. 1993, 24, 177–196. [Google Scholar] [CrossRef]
- Ben Dor, E.; Kruse, F.A. Surface mineral mapping of Makhtesh Ramon Negev, Israel using GER 63 channel scanner data. Int. J. Remote Sens. 1995, 16, 3529–3553. [Google Scholar] [CrossRef]
- Anker, Y.; Ben Dor, E.; Zelikman, E.; Karnieli, A.; Mazor, E. Makhtesh Ramon, a super site for calibration and validation of IS sensors. In Proceedings of the 6th EARSeL SIG Workshop on Imaging Spectroscopy, Tel Aviv, Israel, 16–18, March 2009.
- Guanter, L.; Segl, K.; Kaufmann, H. Simulation of optical remote-sensing scenes with application to the EnMAP hyperspectral mission. IEEE Trans. Geosci. Remote Sens. 2009, 47, 2340–2351. [Google Scholar] [CrossRef]
- Salisbury, J.W.; D’Aria, D.M. Emissivity of terrestrial materials in the 8–14 μm atmospheric window. Remote Sens. Environ. 1992, 42, 83–106. [Google Scholar] [CrossRef]
- Christensen, P.R.; Bandfield, J.L.; Hamilton, V.E.; Howard, D.A.; Lane, M.D.; Piatek, J.L.; Ruff, S.W.; Stefanov, W.L. A thermal emission spectral library of rock-forming minerals. J. Geophys. Res. 2000, 105, 9735–9739. [Google Scholar] [CrossRef]
- Baldridge, A.M.; Hook, S.J.; Grove, C.I.; Rivera, G. The ASTER spectral library version 2.0. Remote Sens. Environ. 2009, 113, 711–715. [Google Scholar] [CrossRef]
© 2015 by the authors; licensee MDPI, Basel, Switzerland. This article is an open access article distributed under the terms and conditions of the Creative Commons Attribution license (http://creativecommons.org/licenses/by/4.0/).
Share and Cite
Notesco, G.; Ogen, Y.; Ben-Dor, E. Mineral Classification of Makhtesh Ramon in Israel Using Hyperspectral Longwave Infrared (LWIR) Remote-Sensing Data. Remote Sens. 2015, 7, 12282-12296. https://doi.org/10.3390/rs70912282
Notesco G, Ogen Y, Ben-Dor E. Mineral Classification of Makhtesh Ramon in Israel Using Hyperspectral Longwave Infrared (LWIR) Remote-Sensing Data. Remote Sensing. 2015; 7(9):12282-12296. https://doi.org/10.3390/rs70912282
Chicago/Turabian StyleNotesco, Gila, Yaron Ogen, and Eyal Ben-Dor. 2015. "Mineral Classification of Makhtesh Ramon in Israel Using Hyperspectral Longwave Infrared (LWIR) Remote-Sensing Data" Remote Sensing 7, no. 9: 12282-12296. https://doi.org/10.3390/rs70912282