1. Introduction
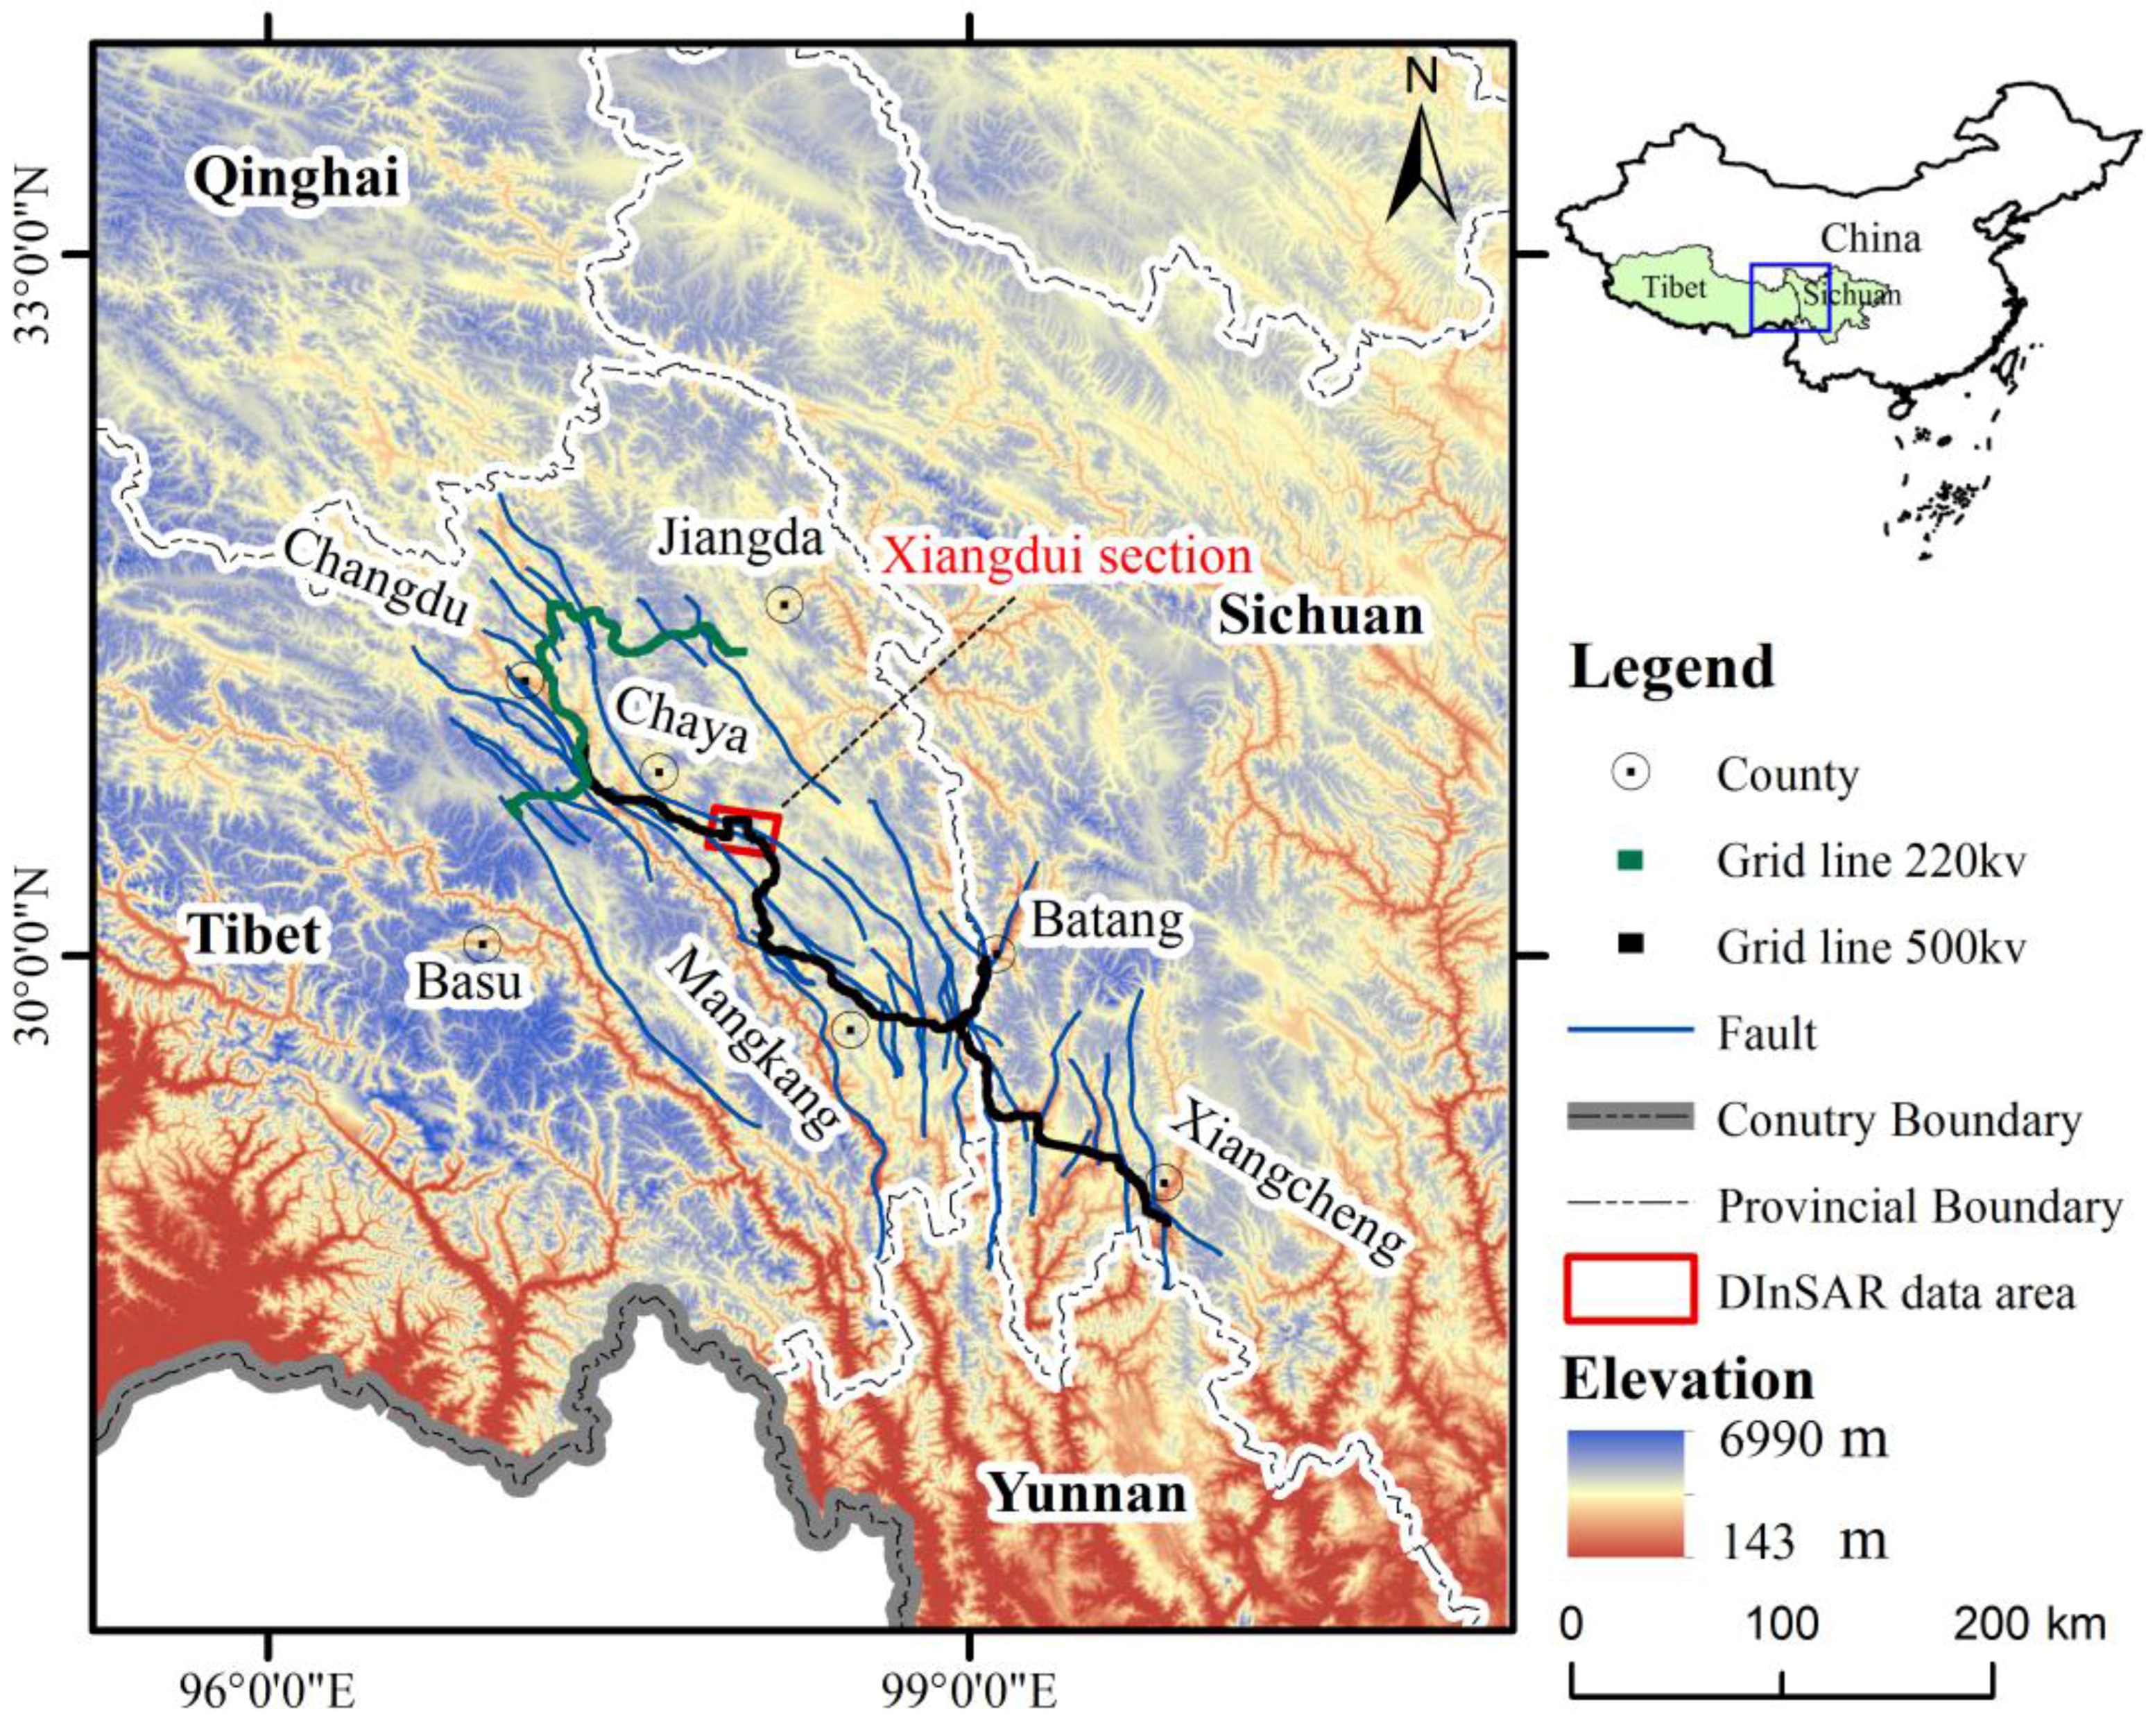
The Tibetan Plateau (TP), recognized as the third pole of Earth, is the world’s highest plateau, with an average altitude of over 4000 m. The terrible weather, high altitude, steep terrain, lack of transport facilities and sparely distributed settlements result in the high cost of the construction of power transmission system and the restrictive coverage of power grid in the Tibetan Plateau. The Sichuan-Tibet grid connection project is the first special high voltage grid project constructed in the Tibetan Plateau, which aims to solve the electricity shortage problem in parts of eastern Tibet and western Sichuan province. The project consists of two grid lines. The 500 kv grid line connecting Xiangcheng County, Sichuan and Changdu City, Tibet is about 500 km long. The 220 kv grid line connecting Basu County, Tibet, and Jiangda County, Tibet is about 250 km long. The two grid lines intersect at Changdu City, Tibet (
Figure 1).
The grid connection project area is located in the eastern margin of Tibetan Plateau. The infrastructure projects in this area are not only threatened by active earthquakes and other tectonic movements, but also threatened by the hostile natural environment in Tibet [
1]. The freeze-thaw cycle activities, heavy and intensive precipitation during rainy season, as well as a large temperature difference between day and night have grievous effects on the stability of the land surface. The high altitude and harsh weather conditions make the Tibetan Plateau the largest permafrost area in the low-middle latitudinal zone of the world. Different from the permafrost area with high latitude, e.g., Canada and Russia, the stability of permafrost in the Tibetan Plateau is relatively poor mainly because of the strong sunlight in the plateau [
2]. Moreover, the temperature of the Tibetan Plateau tends to increase under the influence of global warming, which is a disadvantage to the permafrost stability [
3]. Hence, continuing high temperature in the Tibetan Plateau that leads to the melting of snow and freeze-thaw effect is one of the most important factors that induce geological hazards. For example, Yigong landslide which is a large hazard happened in Nyingchi area Tibet in April 2000 for the thawing effect of frozen soil [
4]. Therefore, the freeze-thaw problem has become a major concern for hazard prevention and construction in permafrost areas.
Figure 1.
Overview of the grid project area with elevation displayed as background. Grid lines with different colors represent different voltage levels. Major tectonic faults adjacent to the grid lines are also shown. The red frame indicates the SAR study area.
Figure 1.
Overview of the grid project area with elevation displayed as background. Grid lines with different colors represent different voltage levels. Major tectonic faults adjacent to the grid lines are also shown. The red frame indicates the SAR study area.
Another important factor that caused surface deformation in southeast Tibet is heavy and intensive precipitation. Affected by terrain, precipitation in the Tibetan Plateau is mainly concentrated in south and southeast Tibet. According to the meteorological data, heavy and intensive precipitation mainly occurs in the summer and accounts for about 80 percent of the annual precipitation. The intensive precipitation could induce different levels of floods, and it is also the major triggering factor of geological hazards. The surface deformation caused by freeze-thaw cycle effect and its impact on the construction and maintenance of infrastructure in the Tibetan Plateau have already been revealed by many researches [
5,
6]. However, there is still a lack of studies on the twofold effect of freeze-thaw cycle effect and precipitation on to the surface deformation in high-elevated regions such as the Tibetan plateau. Therefore, based on the special weather condition in southeastern Tibet, it is essential to study the surface deformation results from the combined influences of freeze-thaw cycle effect and precipitation over a one year period.
The project area passes through the rigorous and remote Tibetan Plateau, it is thus difficult and costly to apply point-based surface deformation monitoring techniques such as GPS and leveling. The space-borne differential synthetic aperture radar interferometry (DInSAR) is capable of mapping surface deformation over extensive area with high resolution and high precision [
7,
8]. However, the results obtained from DInSAR analysis have sometimes suffered from temporal and geometrical de-correlations, and have been strongly affected by atmospheric inhomogeneities, especially in vegetated or low reflectivity homogeneous regions. In order to overcome these problems, many technologies have been presented, and Persistent Scatterers Interferometry (PSI) technique is one of the most prominent [
9]. With the availability of large stacks of SAR images acquired over the same areas, long time series of deformation can be analyzed using PSI techniques [
10,
11]. PSI techniques have been widely and successfully used for the assessment of geological hazards, such as landslides [
10,
12,
13], land subsidence [
14], and earthquakes [
15].
This paper is organized as follows. The background of the grid connection project and the study area are introduced firstly, followed by a description of the datasets and the methodology based on PSI technique. Then, the results are presented, and the possible reasons that caused the observed deformations are discussed. The purpose of this research is to provide a baseline for detecting potential large scale geological hazards and further mitigating their hazard effects in the project area.
2. Study Area
A section around the Xiangdui town, Chaya County, Tibet was selected as the experimental site (
Figure 1 and
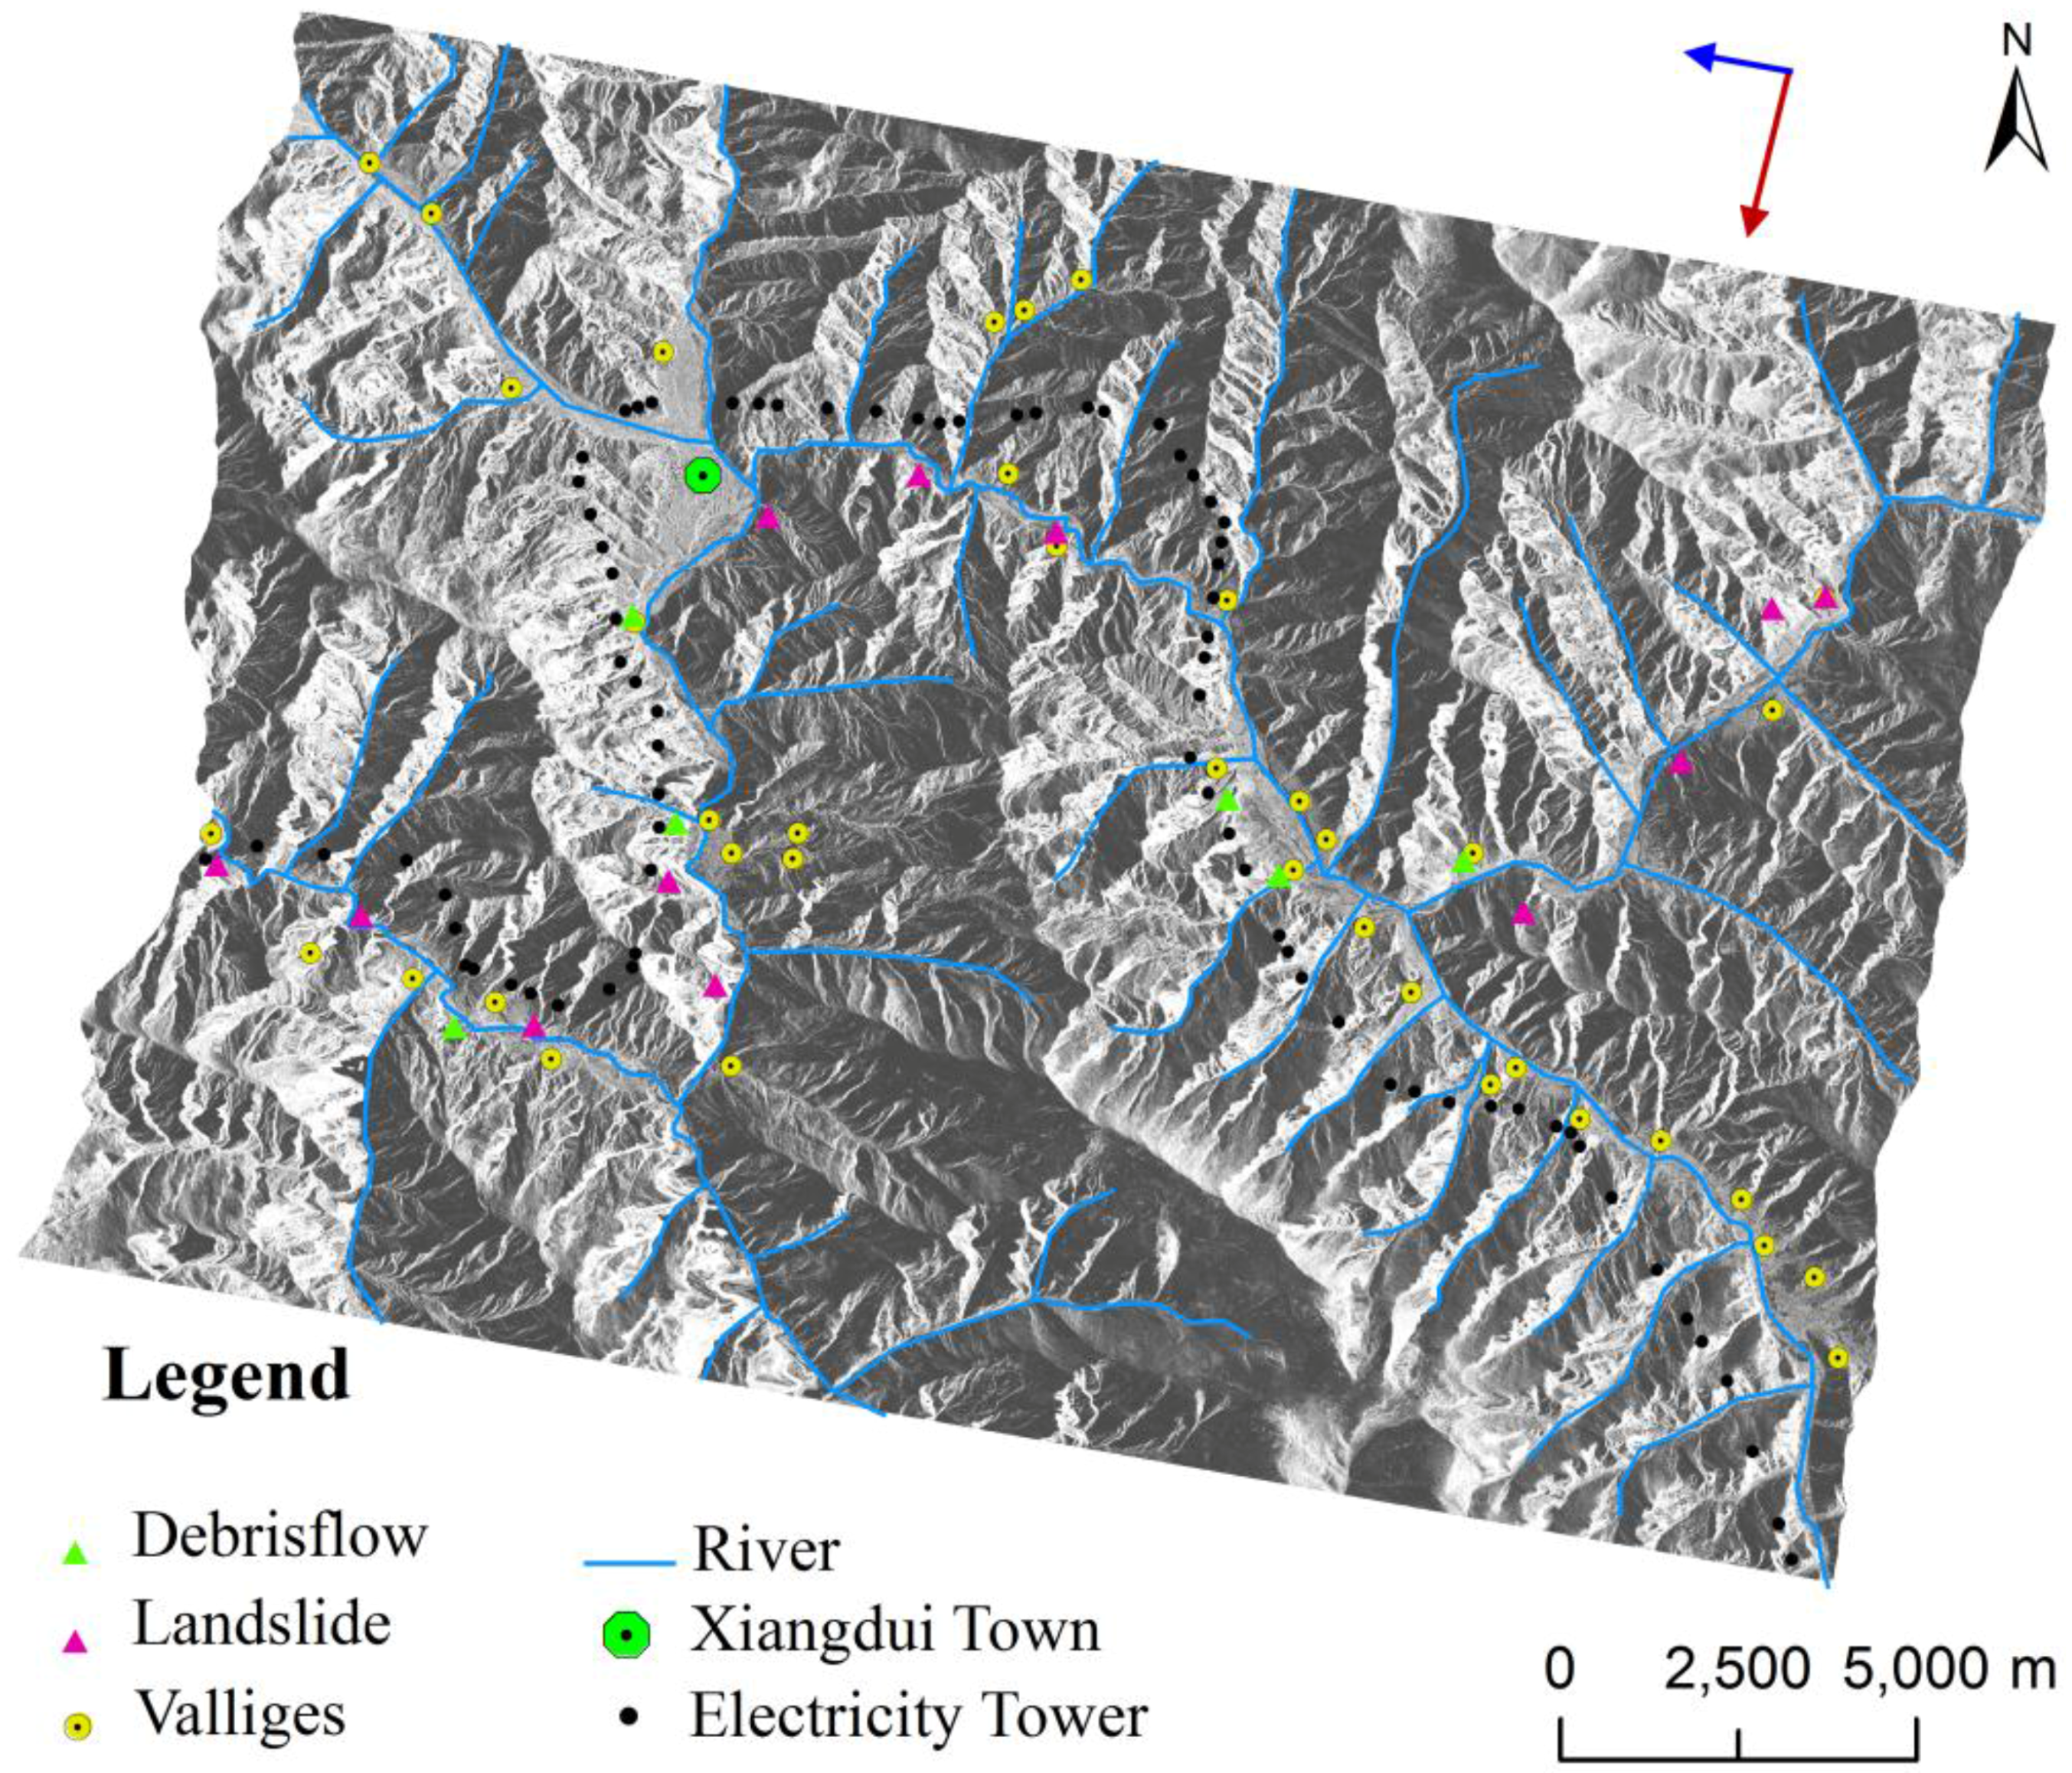
Figure 2), primarily for its accessibility as well as the availability of field observation data. Maiqu River and Changqu River are two major rivers in this study area. Most of the tributaries of the major rivers running along the valleys are seasonal rivers. There are several villages sparsely distributed in flat areas along the river or in some lower valleys. The largest settlement, Xiangdui town, is located in the northwest of the study area where the two major rivers meet. The main roads in the study area run along the major rivers. The grid line in this study area is about 50 km in length and has 77 transmission towers. In order to avoid the influence of potential geological hazards, transmission towers are generally not constructed in lower valleys.
The topography is mainly an alpine canyon with a prominent relief. The average altitude of the study area is about 4100 m, and the relative height difference varies between 200 and 500 m. The action of geomorphic agents such as temperature variations, stream and freeze-thaw activity are relatively strong. The bedrock geology of the study area is dominated by Cretaceous and Jurassic strata. The study area comprises rock masses mainly composed of sandstones, mudstones, conglomerate, and limestone. Due to the influences of the tectonic activities and weathering in the surface, the joint network of rocks there is complex and the loose materials are widely distributed. Those loose materials rested on high and steep slopes are favorable for the formation of geological hazards.
A detailed geological hazard investigation about Tibet was conducted by the Institute of Geological Environment and Hazard Prevention of Tibet in 2005. The geological hazards that greatly threaten the main roads, factories, villages and towns were recorded. The type and scale of the geological hazards as well as the factors that induced the hazards were recorded. According to this investigation, there were 18 geological hazards distributed in the study area, including six debris flows and twelve landslides. Prior to the construction of the electricity transmission project, geomechanical, geomorphological, and geological hazards surveys were also conducted by manual inventory in the project area.
Figure 2.
The locations of transmission towers, geological hazards, residential sites, and major rivers in the study area are shown on the SAR intensity map.
Figure 2.
The locations of transmission towers, geological hazards, residential sites, and major rivers in the study area are shown on the SAR intensity map.
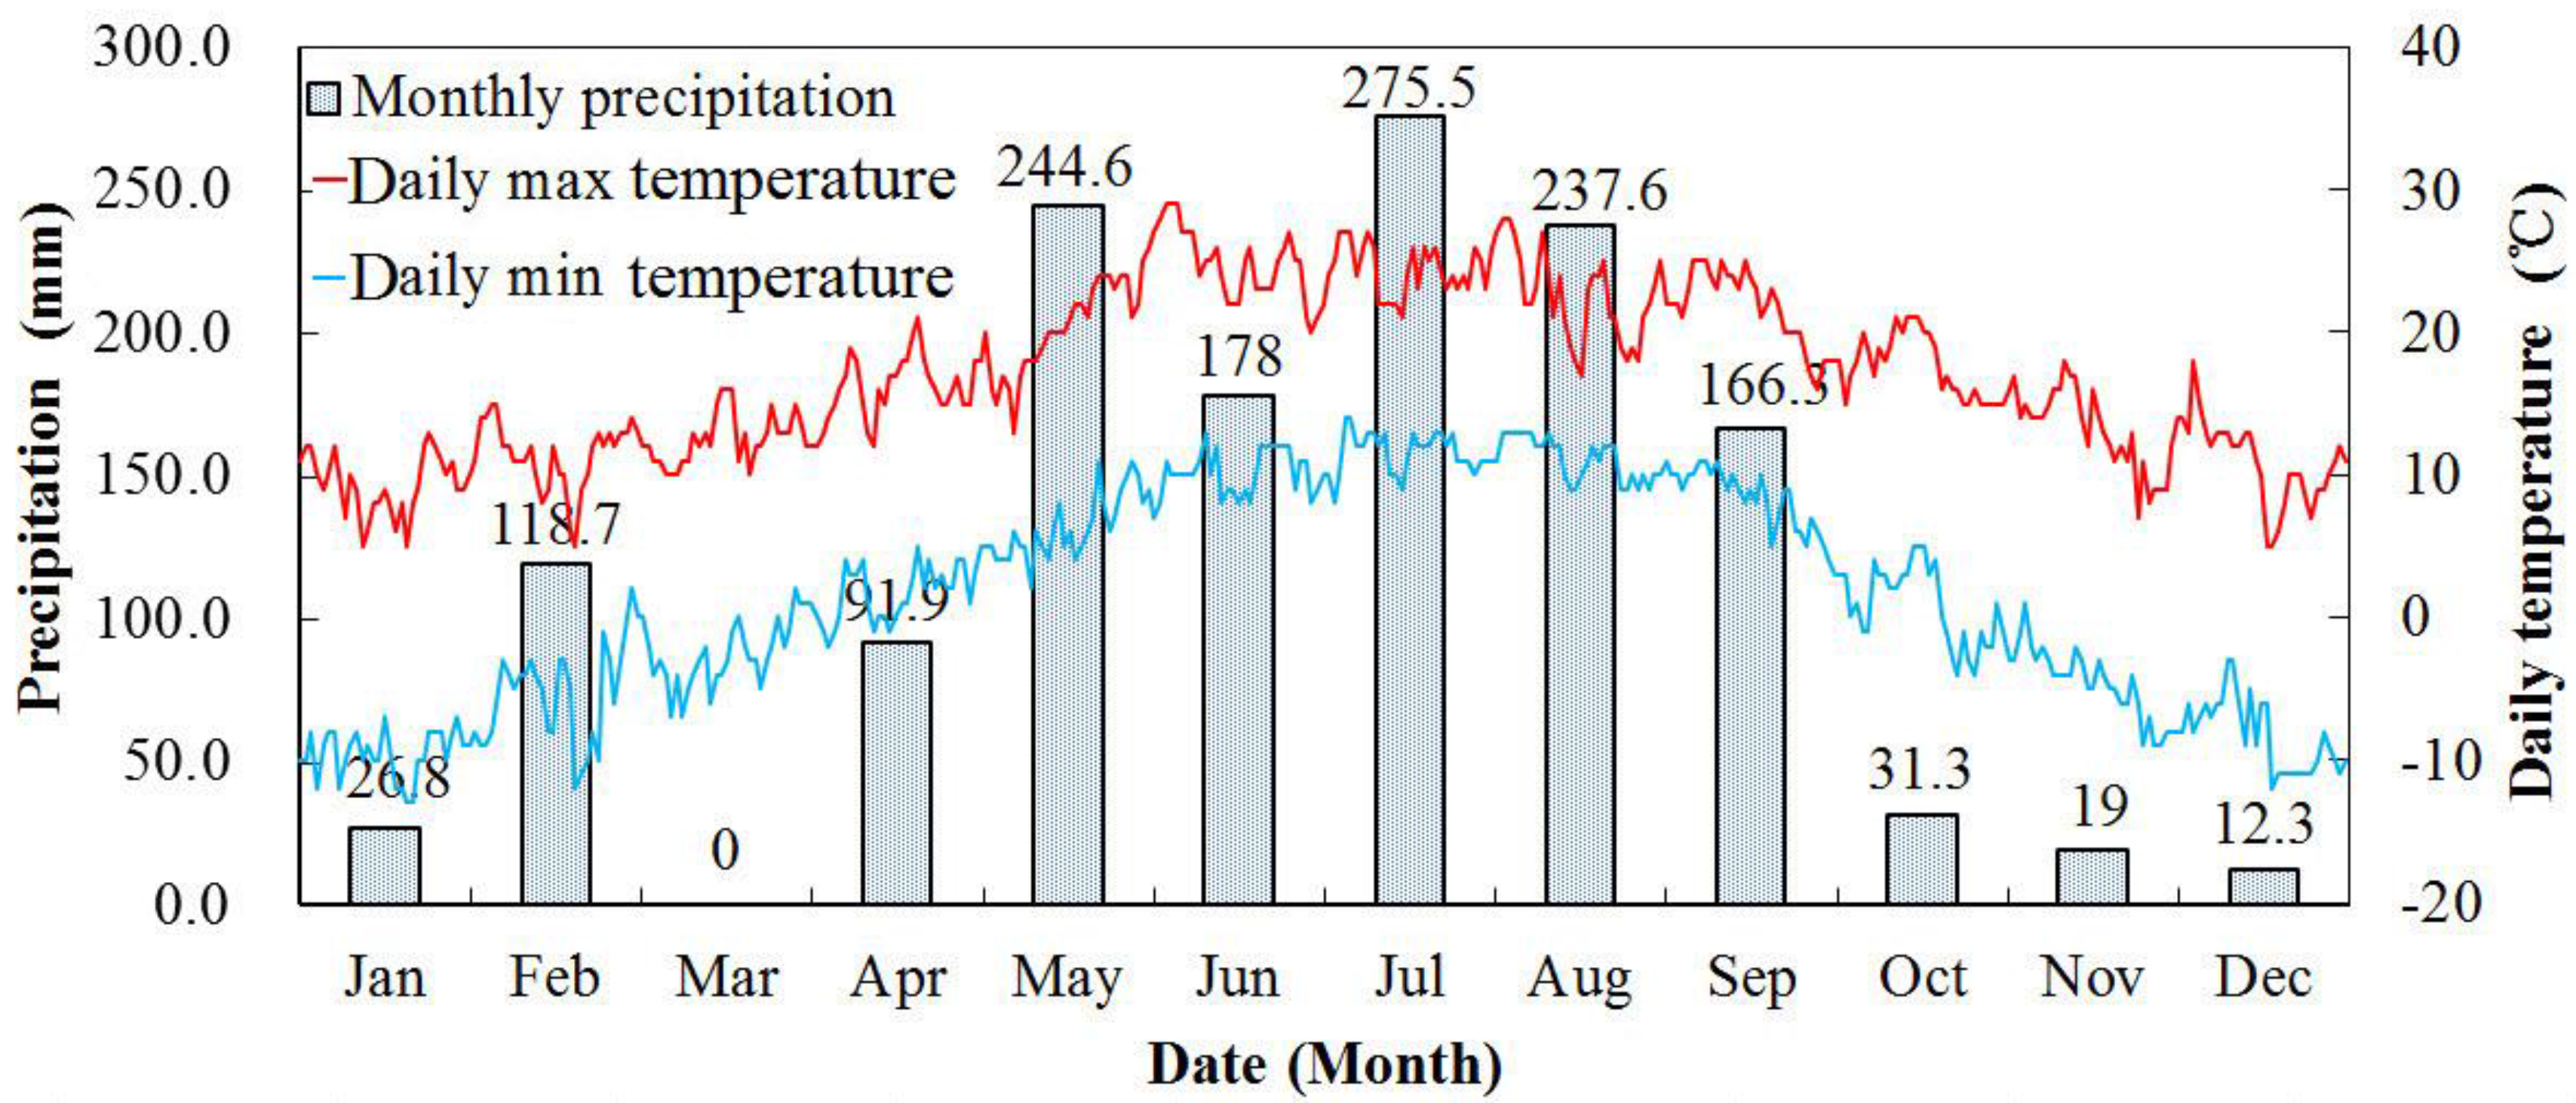
The climate type of the study area is defined as montane warm temperate zone with arid valleys climatic. The annual average temperature in the study area is about 9 °C. According to the temperature data from Chaya county meteorological station, the temperature rises above freezing point in the early April, and falls below freezing point in October (
Figure 3). The average annual precipitation is about 1400 millimeters. The rainy season lasts from May to September and accounts for about 70% of the annual total precipitation (
Figure 3). The daily precipitation data is a type of raster data with 0.5 degree space resolution released by China Meteorological Administration. Monthly records show that precipitation in the study area has a double peak: one in May and another in July.
Figure 3.
Meteorological data of the study area in 2014.
Figure 3.
Meteorological data of the study area in 2014.
5. Discussions
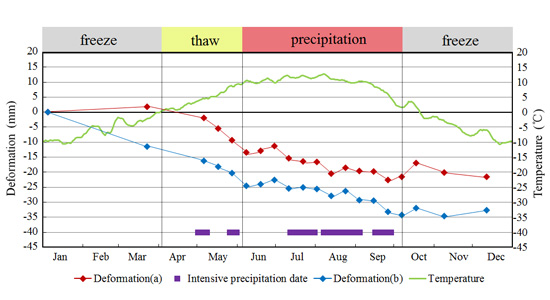
5.1. Freeze-Thaw Cycle Effect and Water Content
Seasonally and perennially frozen soils occupy the whole project area. Depending on factors such as slope aspect, altitude, geological structure, rock characteristics and underground water content, the thickness of frozen soil generally varies between 1.2 and 2.5 m. The freeze-thaw cycle activities continually happen as temperature periodically changes over a year. Seasonal freeze-thaw of soil water is accompanied by a series of physical processes, such as water transfer and heat exchange [
23]. When seasonal frozen soil melts in summer, the soil water gradually changes from solid to liquid, and the subsidence of ground surface accelerates. On the contrary, the soil water changes from liquid to solid during the freezing process. As the temperature decreases, the alleviation of land subsidence is obvious, and a slight uplift even happens in some areas. The cyclic freeze-thaw processes of frozen soil would destroy geological environment, and further result in geological hazards, such as landslides and rock falls [
24]. Therefore, the freeze-thaw cycle effect of frozen soil in the study area can do great harm to human projects.
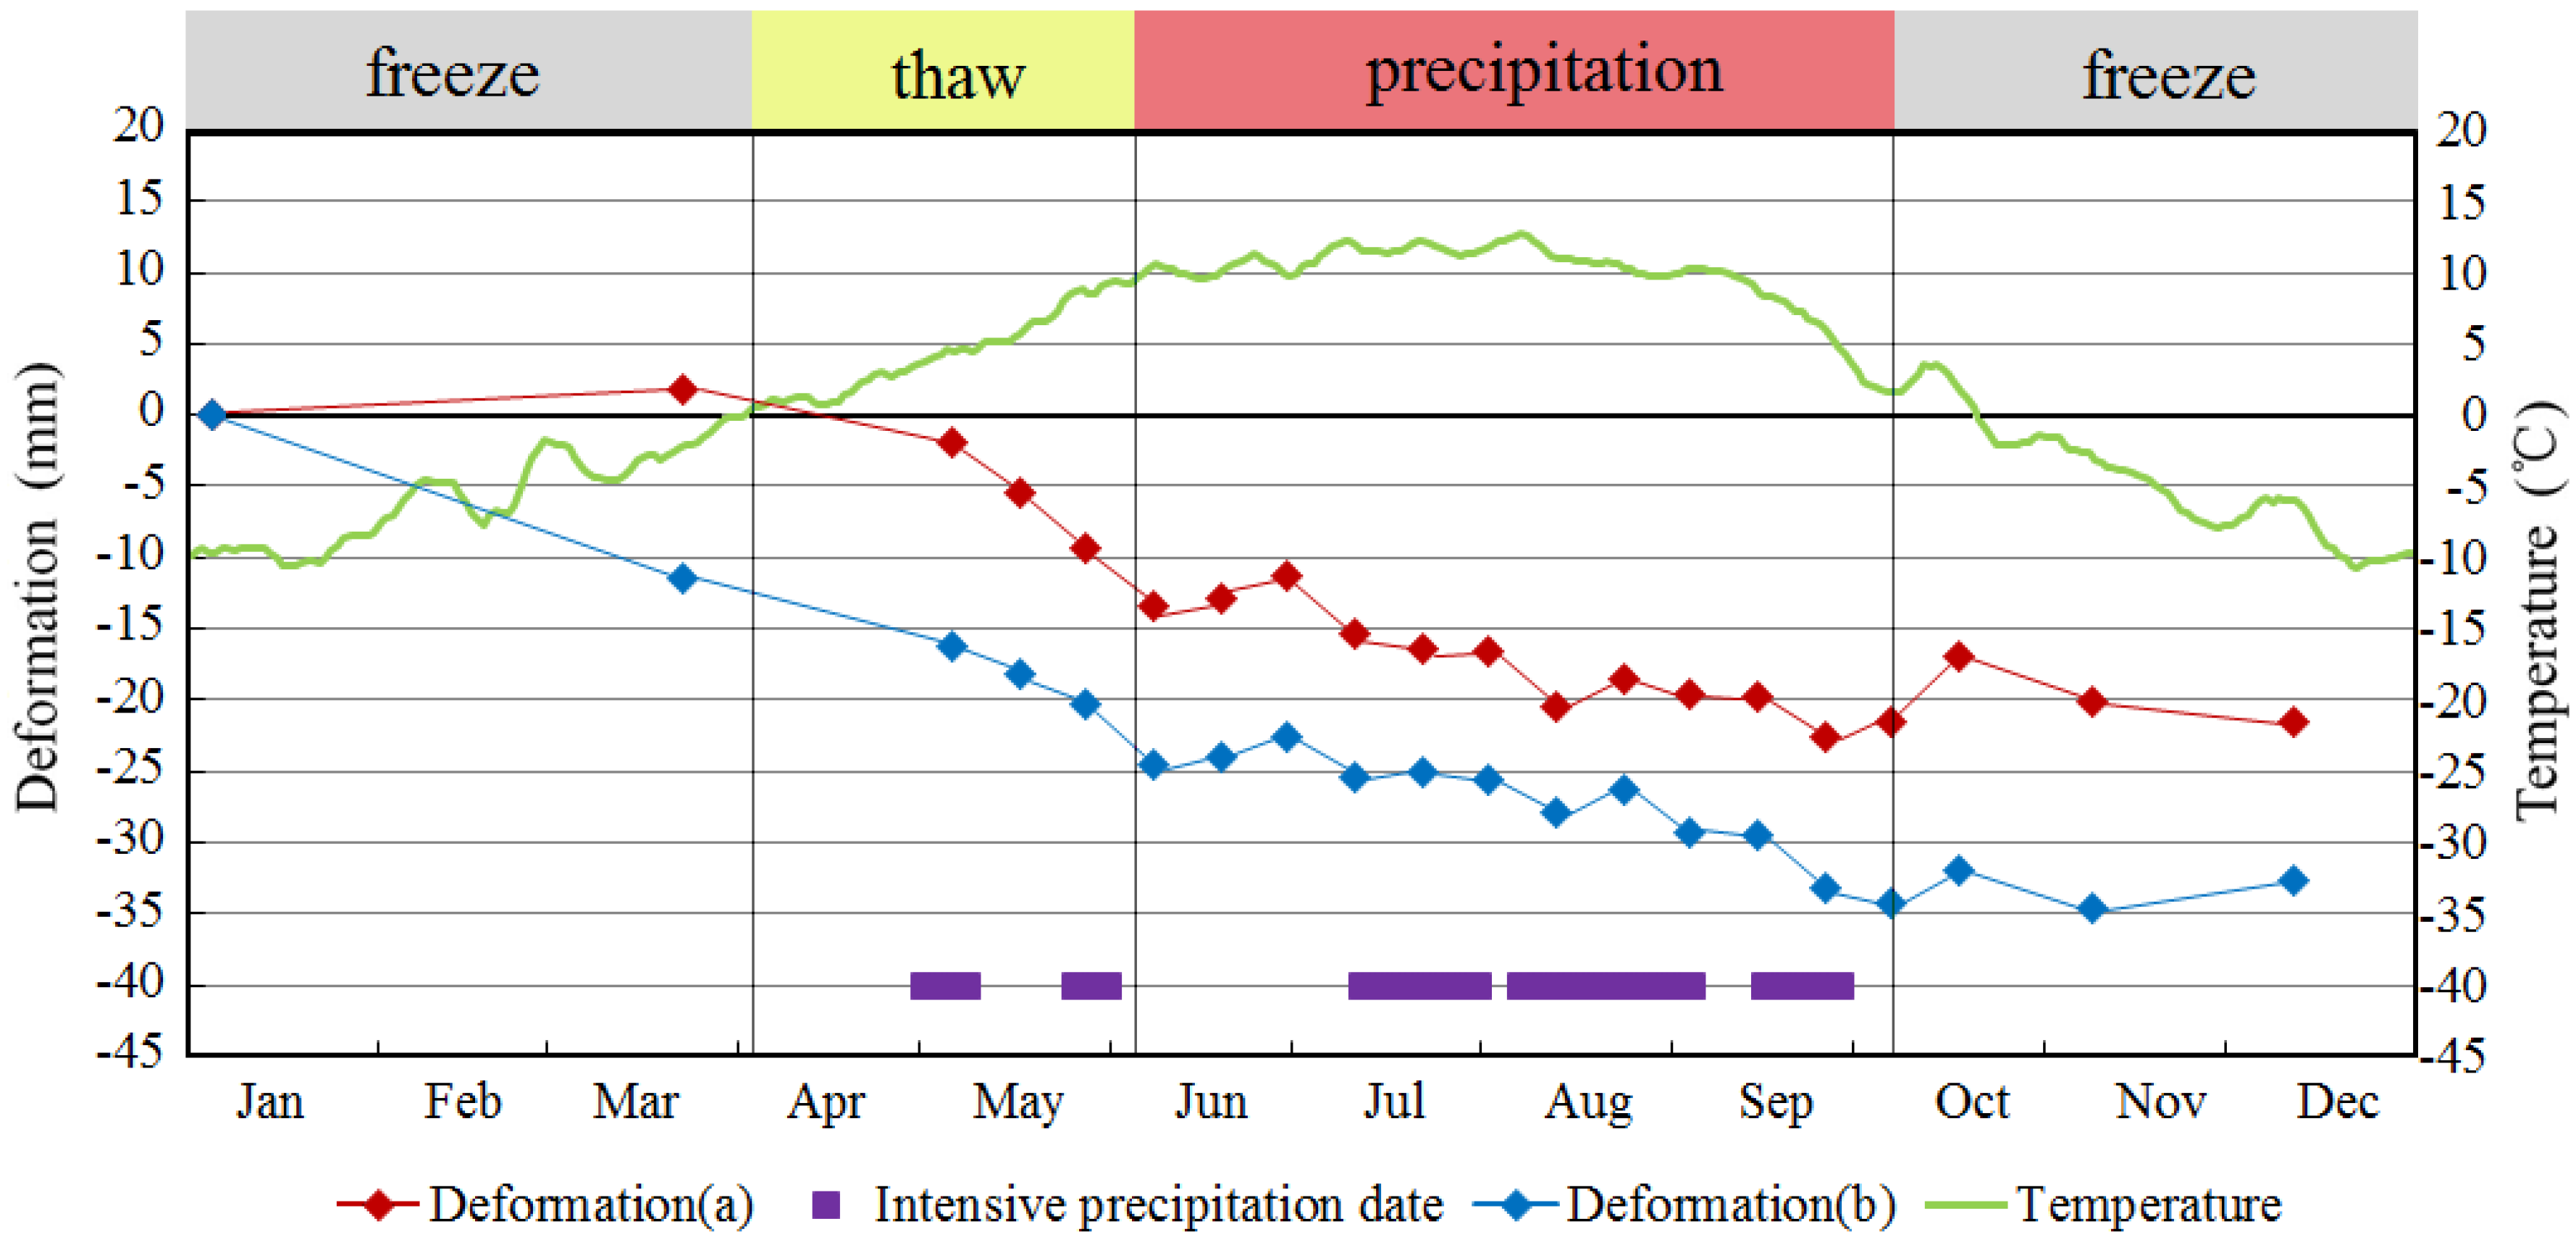
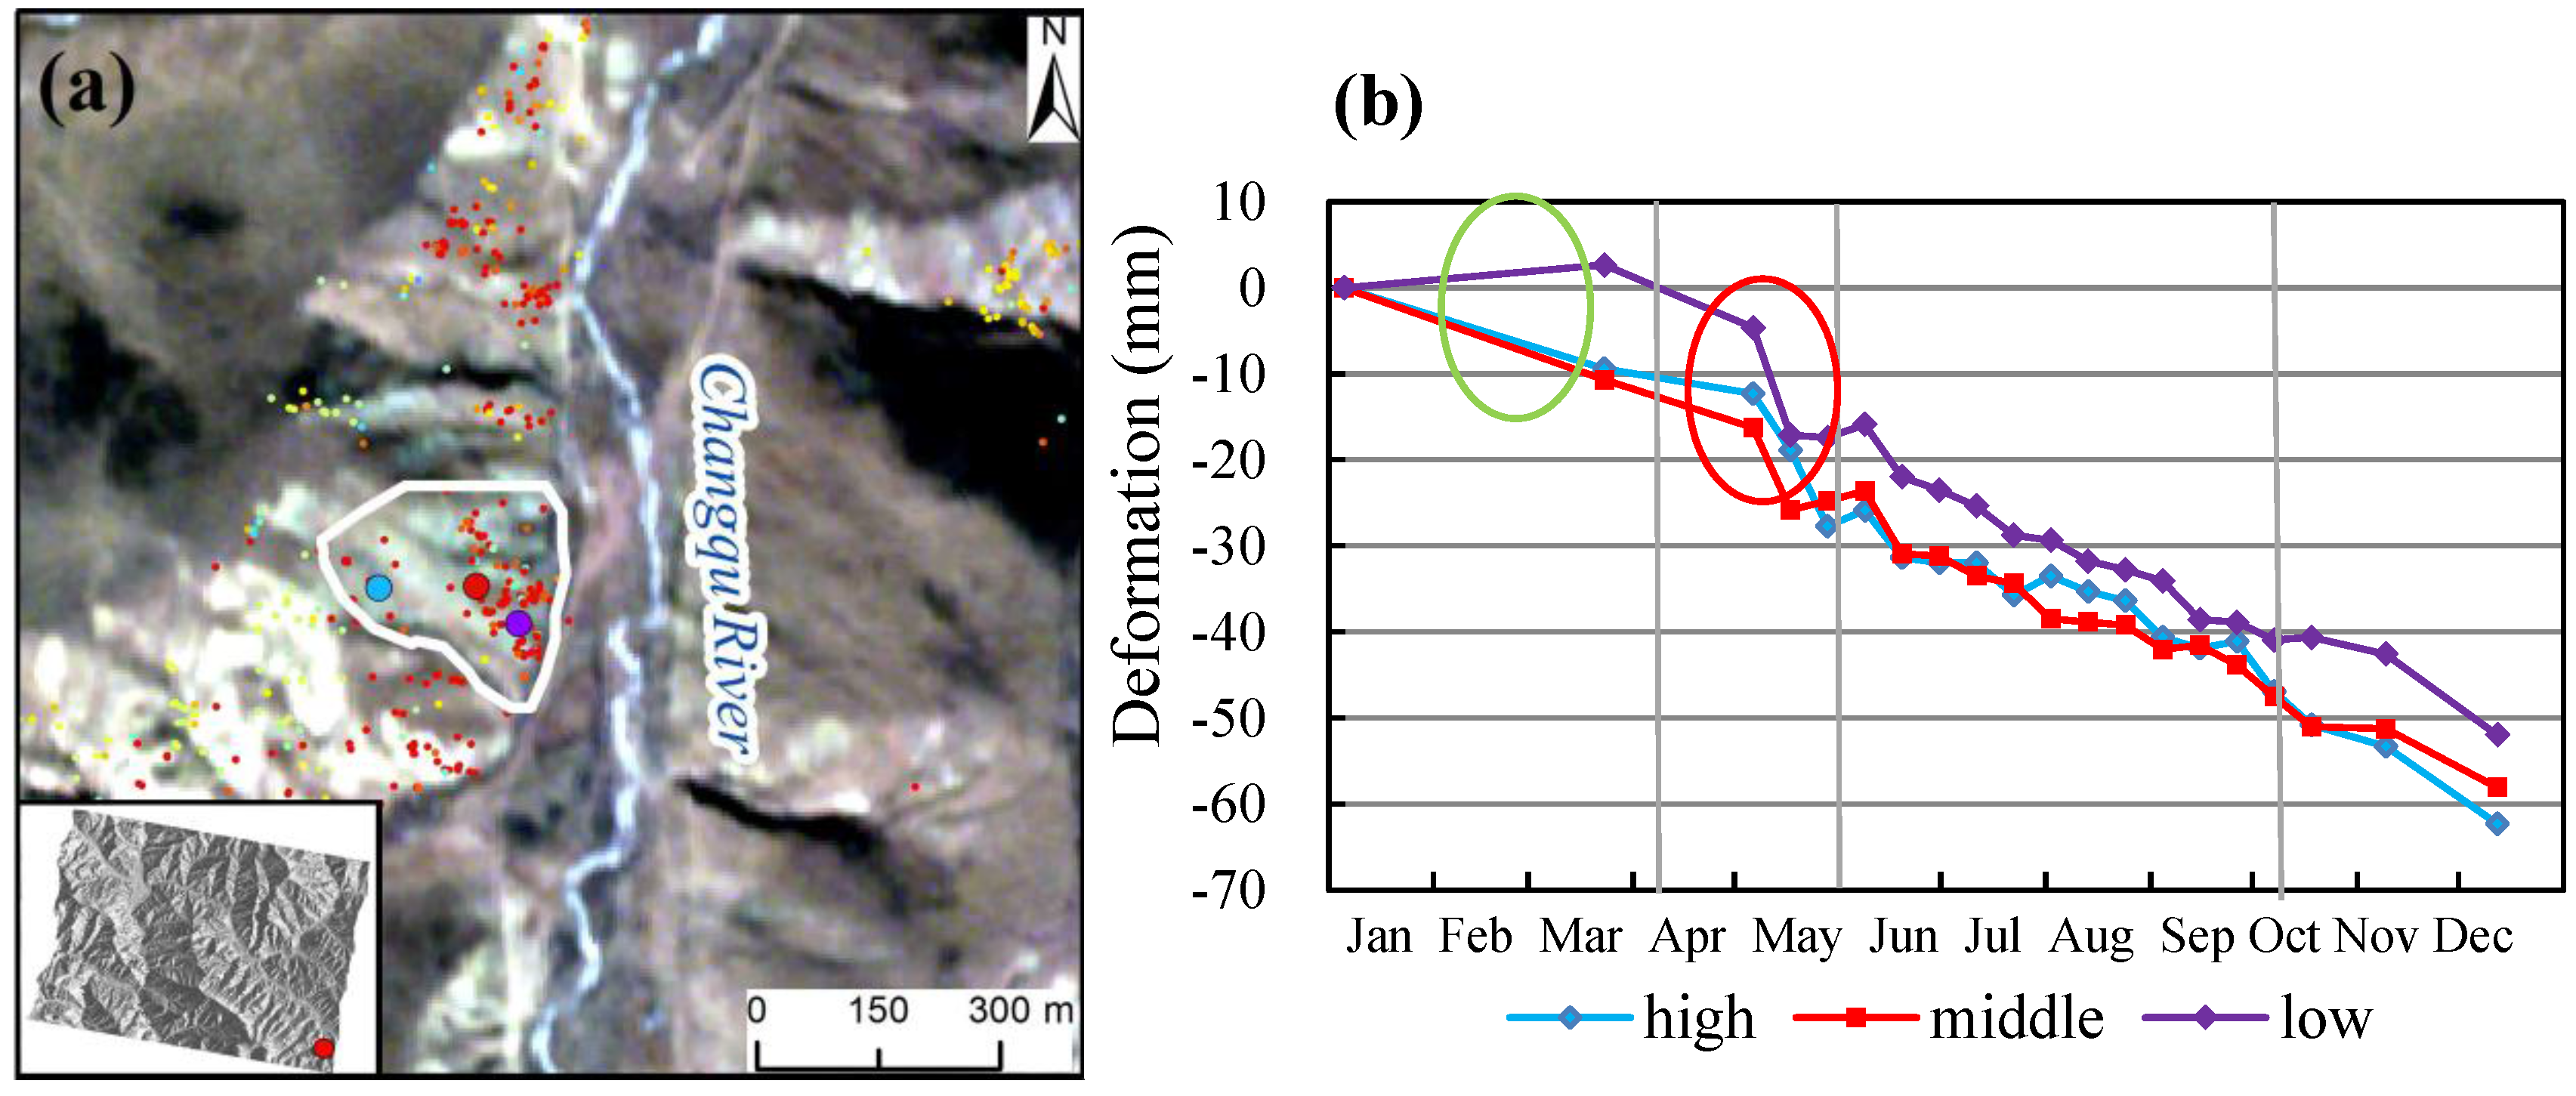
Seasonal frozen soil is a special soil water system where ice and water coexist, and the higher the amount of ice, the poorer the soil stability is. Hence, the deformation history of a specific site with different water content was analyzed to show the effects of freeze-thaw processes on surface deformation (
Figure 6). From
Figure 6, it is suggested that the deformation histories of persistent scatterers in this site have distinct seasonal characteristic and coincides well with the cycle of freeze-thaw. The main sessions of freeze heave process in the monitoring period include from January to April and from October to December. The deformation rates of unstable slopes are relatively reduced more because the volume of soil water expands as it becomes solid in October. Moreover, due to lower positions are close to rivers with sufficient water supply, the surface deformation rate gradually increases as elevation decreases from the top to foot of slopes (
Figure 6 marked as green frame).
As the average min temperature rises above zero in early April, the frozen soil begins to melt. Then, the sufficient soil water and its decreased volume cause the sedimentation rate of unstable surfaces to dramatically increase. For example, the deformation rate of all points in
Figure 6b show an increasing subsidence trend during the period from early April to May. Soils near rivers contain more water, and thus can become completely frozen in cold seasons. Hence, subsidence rate exhibits a tendency of increasing with the drop of position from top to toe of unstable slope (
Figure 6 marked as red frame).
Figure 6.
TerraSAR-X PSI monitoring results for an unstable surface on the banks of Changqu River. (a) The location of this unstable surface is shown in the insert figure. (b) The time series deformation histories of three points with different elevations are also shown.
Figure 6.
TerraSAR-X PSI monitoring results for an unstable surface on the banks of Changqu River. (a) The location of this unstable surface is shown in the insert figure. (b) The time series deformation histories of three points with different elevations are also shown.
In general, the water table directly affects soil frost heave. Most of the places along the project area belong to weak freeze-thaw zone. However, some places with sufficient surface water and groundwater, for example places adjacent to rivers, are regarded as strong freeze-thaw zone and thus are severely affected by freeze-thaw activity [
25]. In order to protect the transmission towers from the freeze-thaw effects, the transmission towers are constructed in elevated lands with low groundwater level. Furthermore, waterproof procedures and drainage systems were adopted to ensure the safety and quality of constructions.
Intensive precipitation and freeze-thaw activities were very important factors controlling the surface deformation in the study area (
Figure 5 and
Figure 6b). Precipitation can not only increase self-weight and gliding thrust of slopes, but also can lubricate the sliding surface of the slope when surface water penetrates into underground and further lead to the increase of seepage force and pore pressure. In addition, intensive precipitation and large day-night temperature differences can easily cause rock cracking, through which surface water would infiltrate into rocks. Increased flow in the near surface groundwater system and the saturation of soil may increase pore pressure and decrease the effective strength of the failure surface, and eventually trigger movement. This indicates that precipitation may play a role in the initiation and acceleration of sliding (from May to September). It is worth noting that, the freeze activity induced by the declining temperature might be another factor to the alleviating deformation trend since October.
5.2. The Safety of Sichuan-Tibet Electricity Transmission Project
The safety of transmission towers distributed in the study area is analyzed in this section. Only 55 of the 77 transmission towers could be monitored with the method of PSI techniques. This is because only SAR images acquired in descending orbit were used. The uneven terrain leads some transmission towers hidden in the radar shadows.
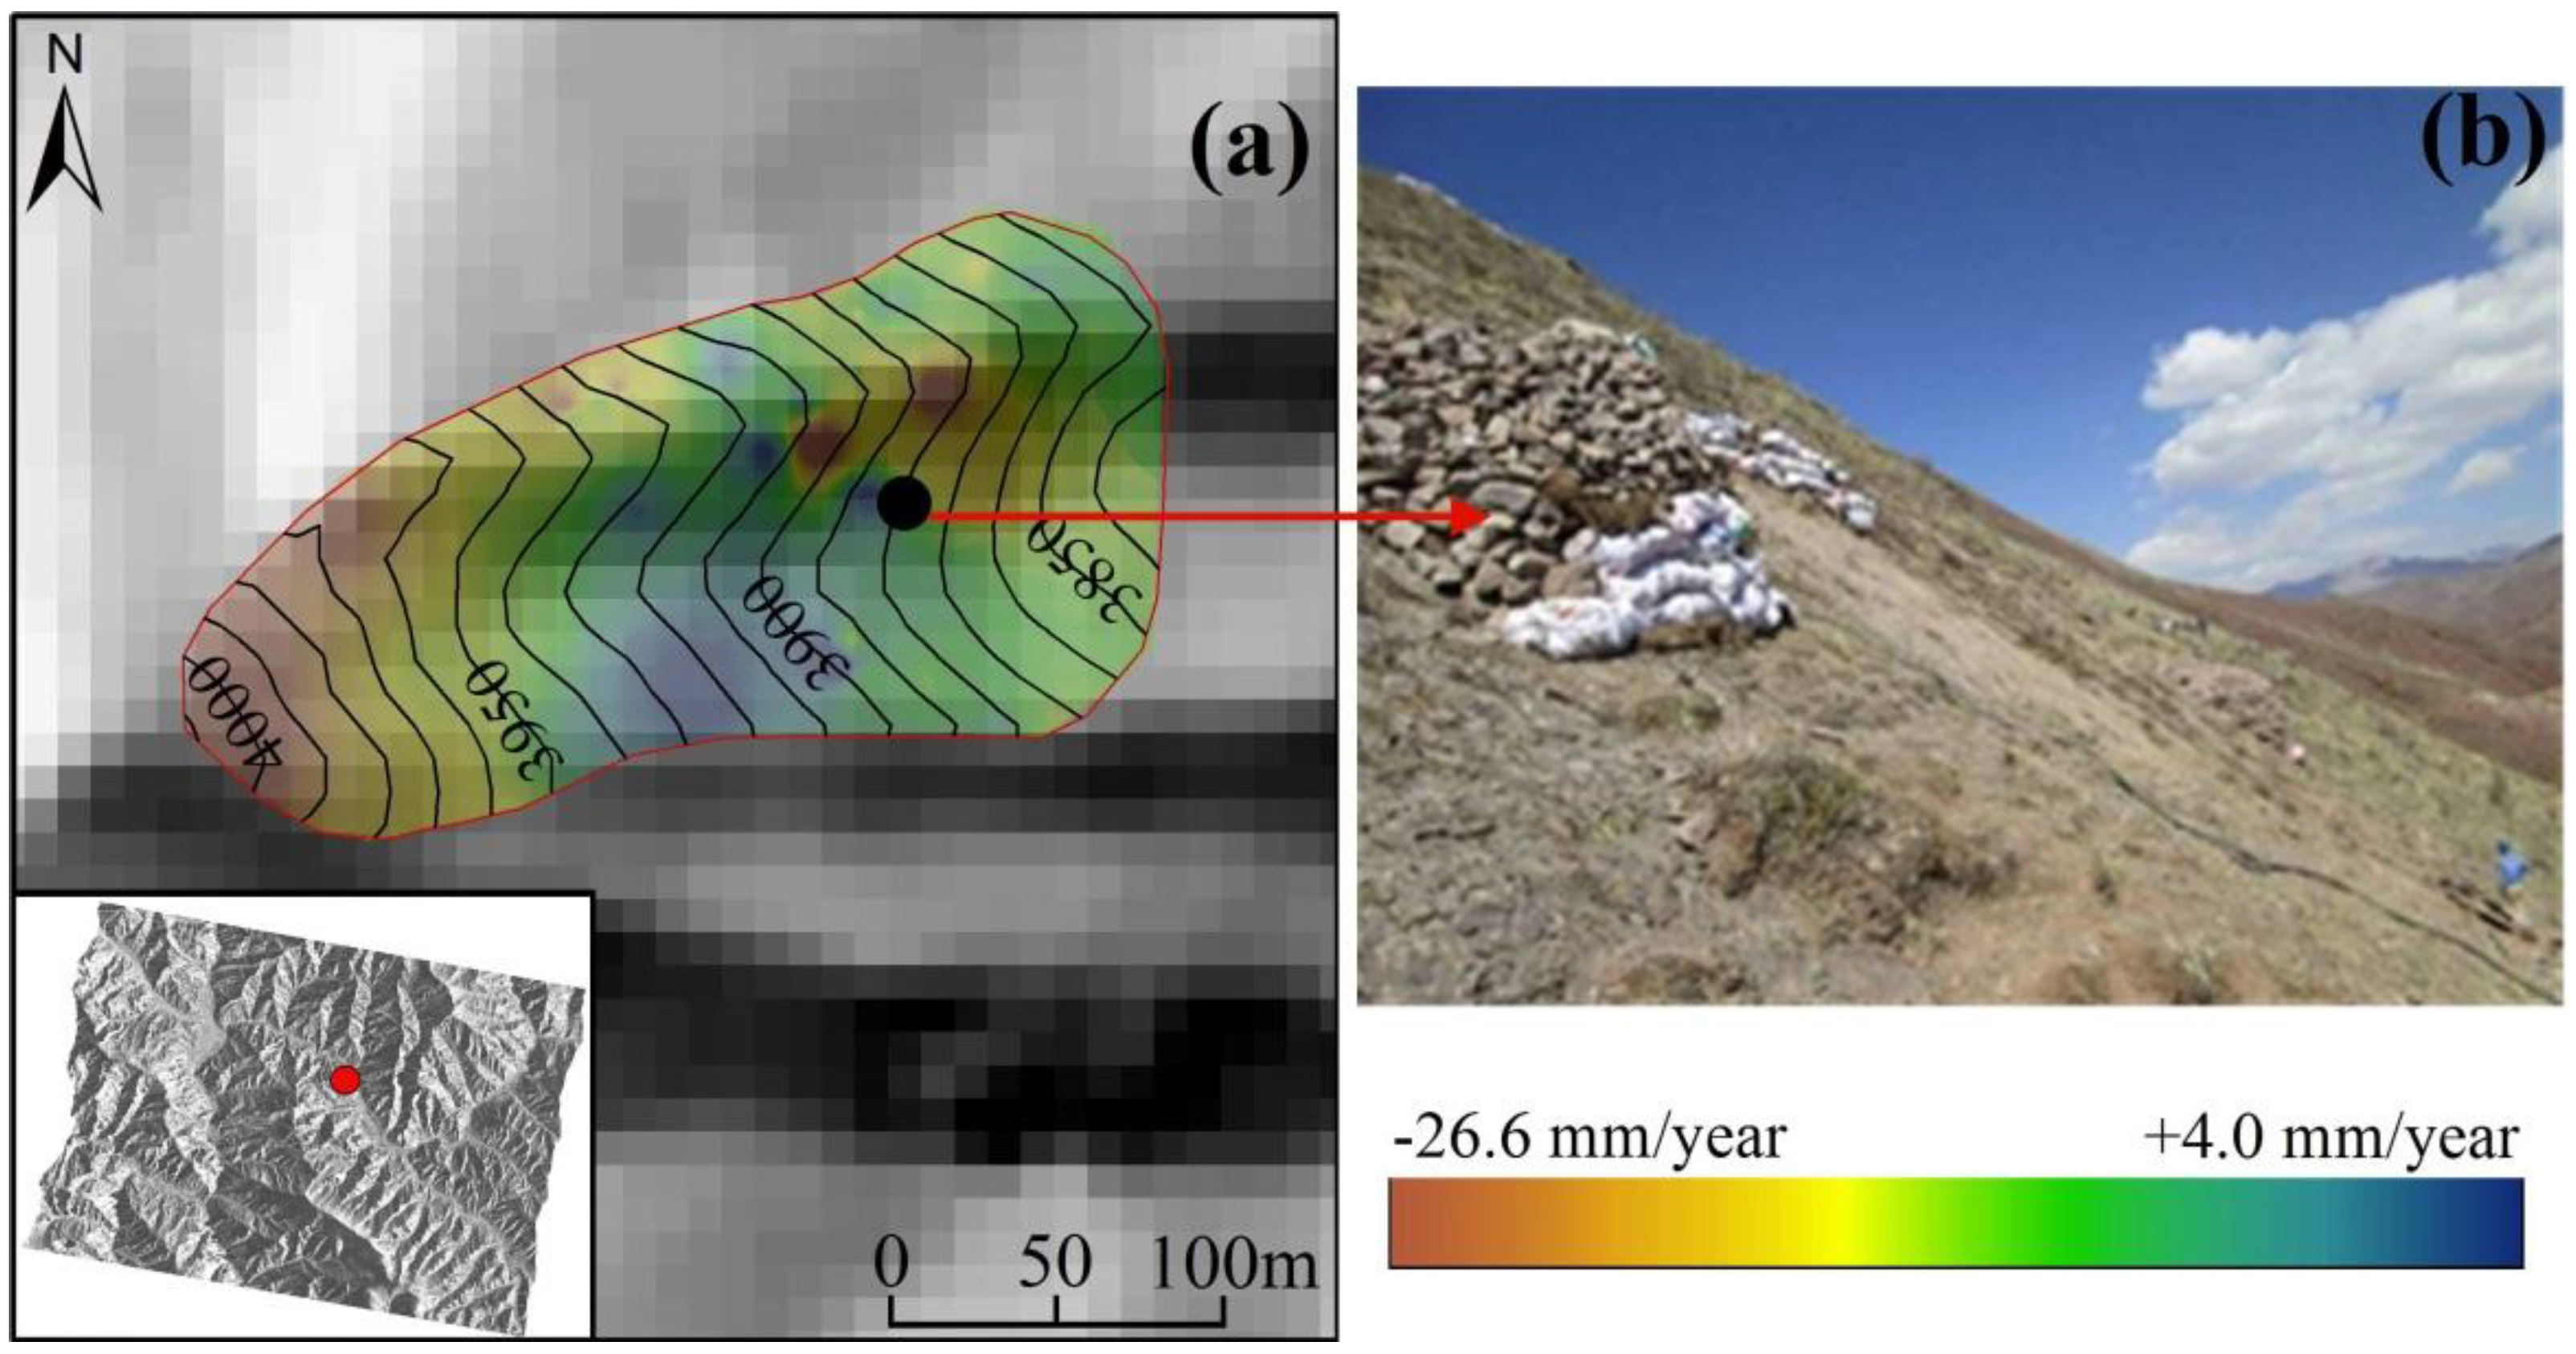
Nevertheless, the results show that the majority of towers are safe since they are located within higher elevated safety areas which are beyond the boundary of slope movement. Only a few towers such as tower 74A are found to be threatened by significant surface deformation. This tower lies on a steep slope. The slope gradient varies between 50 and 55 degrees. The bedrock around the tower had been heavily weathered. The adverse geological conditions and steep topography result in the issue of slope stability. The monitoring results coincide with the field survey results. A quick deformation, with a maximum velocity of more than −20 mm/year, happens on the top of the mountain (
Figure 7a). In addition, there are two small active areas with subsidence phenomenon near the tower (
Figure 7a), which had raised concerns with agencies in charge.
Figure 7.
The PSI results around transmission tower 74A are shown using Inverse Distance Weighting interpolation. (a) The tower shown with a black point lies on one side of a ridge. (b) The photo shows the deposits located near one leg of the tower. The location of this tower is shown in the insert figure.
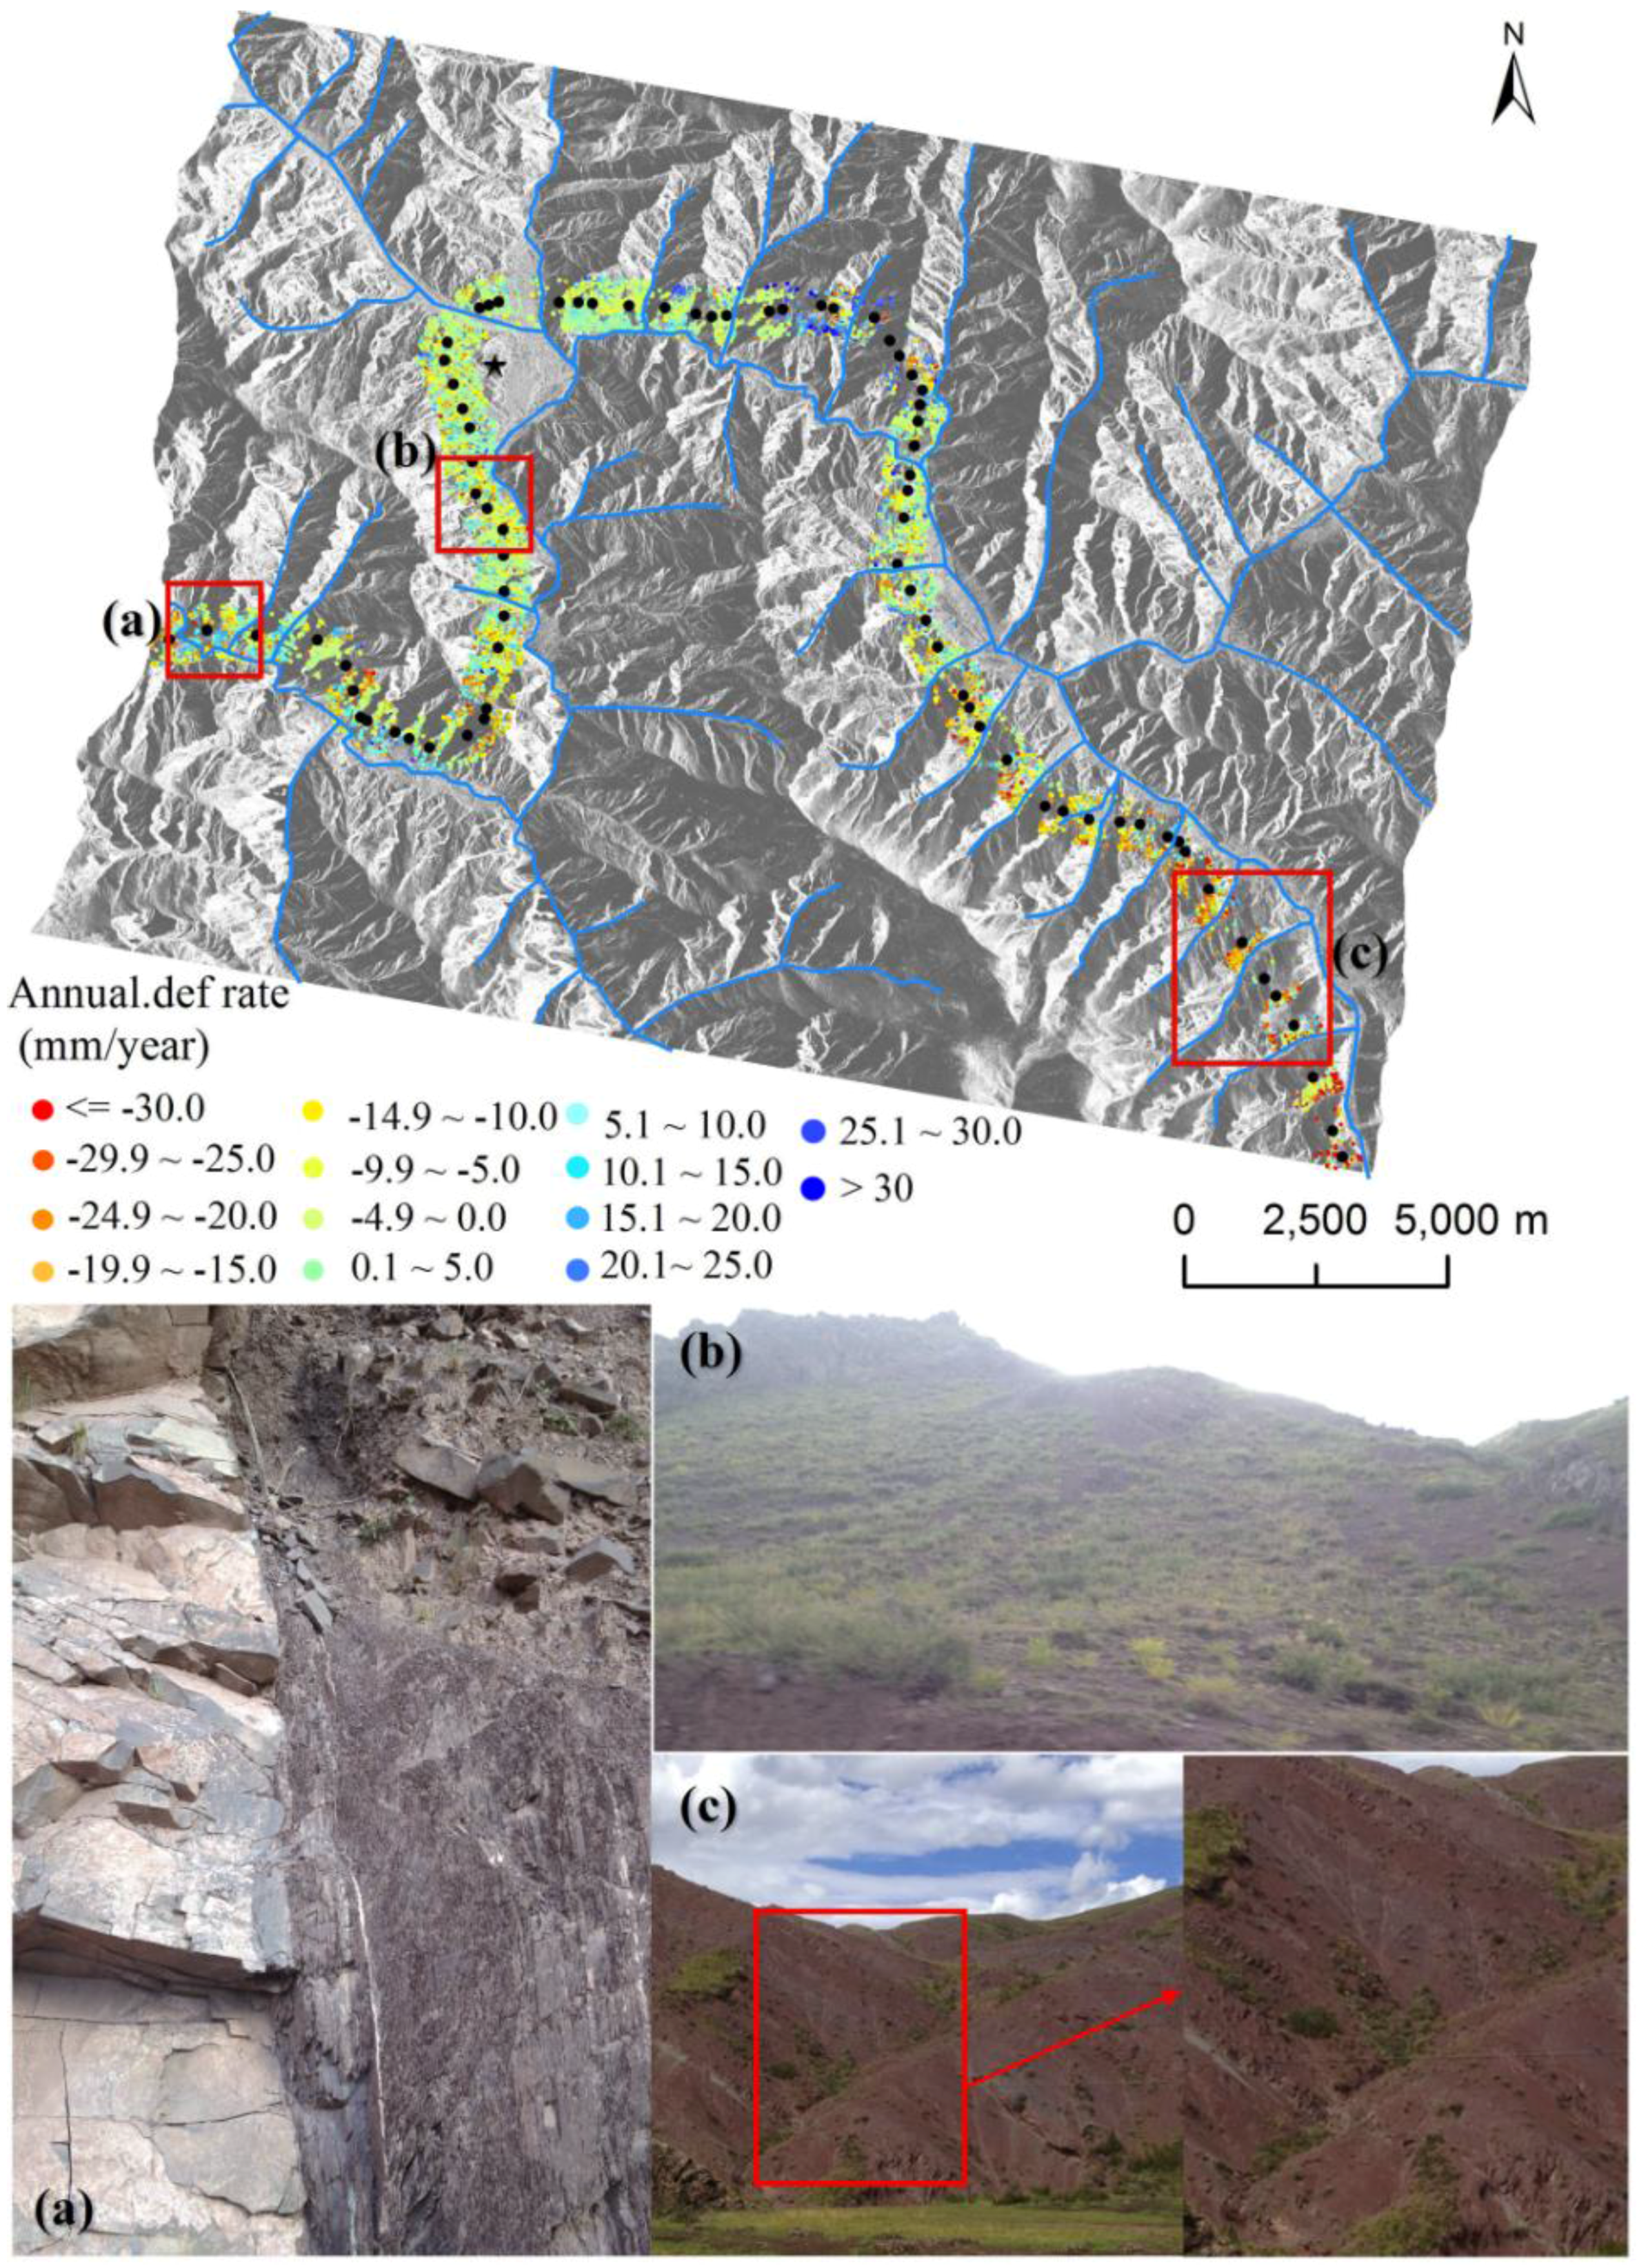
Results also suggest that the towers located in the southeast part of study area might suffer from the slope instability. Field investigation found high density of gullies distributed in the southeast region of the study area. In rainy season, the gullies will become ditches, through which water runs into the Changqu River with loose materials. The slopes of this area are composed of argillaceous rocks formed in stratified structure. The surface of rock has been heavily weathered, and the depth of weathering could reach to 2.5 m. A thin layer of residual soil covers the land surface. This loose earth becomes the main source of materials of debris flows, which could threaten the safety of the project in the future.
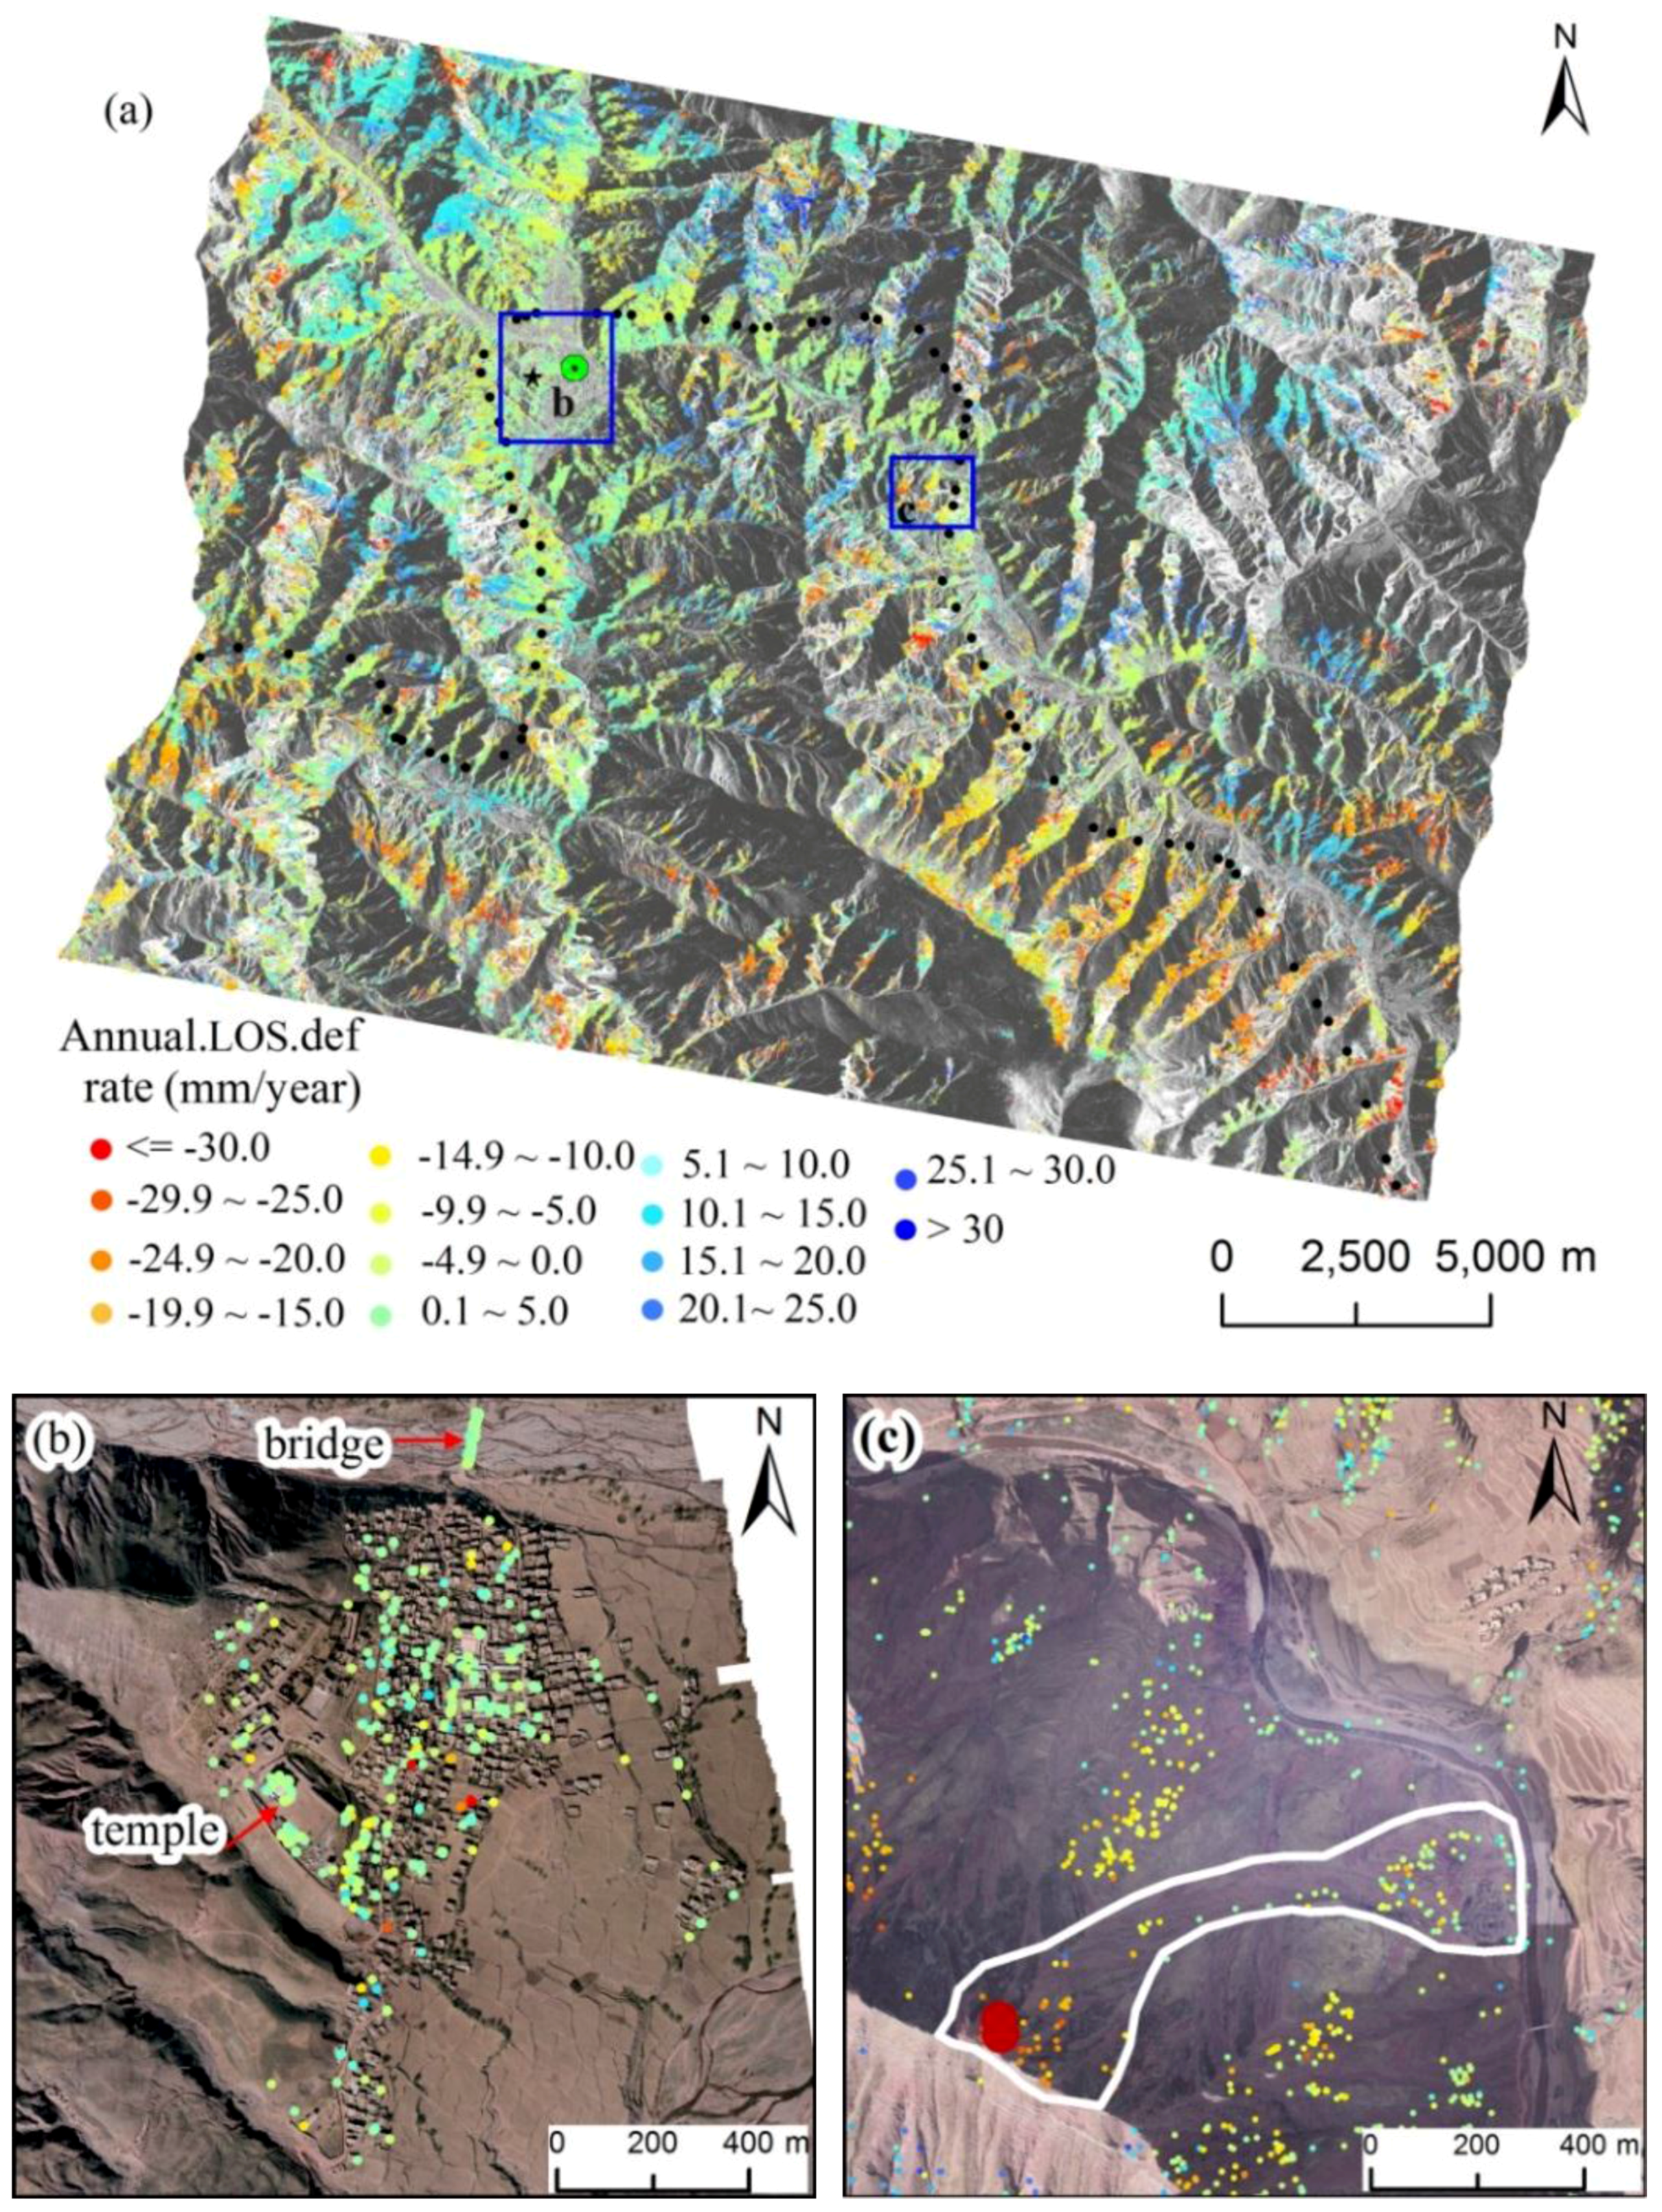
The monitoring results show that, compared with other regions of the study area (e.g.,
Figure 8a,b), distinct subsidence distributed in the southeast region (
Figure 8c). Most of permafrost in Tibet belongs to a warm permafrost category which is sensitive to the change of temperature and moisture [
26,
27]. The water content in the southeast region is relatively high owing to high density of tributaries of rivers. Therefore, the southeast region is more vulnerable to the freeze-thaw cycle effect, especially under the artificial construction conditions.
Figure 8.
The surface deformation field along the grid line is shown. Photos (a), (b) and (c) show the landscapes of different areas.
Figure 8.
The surface deformation field along the grid line is shown. Photos (a), (b) and (c) show the landscapes of different areas.
5.3. Uncertainty of the Results
The issue of uncertainty comes from the data quality, data process, and result interpretation. The data quality is the first concern for this study. The TerraSAR data used in this research have a higher ground resolution of 3 m. Such data are able to reveal more ground details, but also results in more point-like targets, not object-like targets. Compared with ENVisat ASAR (C-band, 5.6 cm) and ALOS PALSAR (L-band, 23.6 cm), TerreSAR (X-band, 3.2 cm) dataset working with a shorter wavelength has a poor ability to penetrate the vegetation, and thus results in low coherence interferograms in vegetated permafrost areas. The small density of persistent scatterers will probably induce unwrapping errors in some areas resulting incorrect deformation information. Moreover, the dataset available for this study is only descending. It is therefore difficult to differentiate between real vertical and horizontal motion of the ground. Both ascending and descending orbit data should be acquired in the future study in order to extract both horizontal and vertical components of the slope movement. In addition, the temperature data used are not totally within the region covered by SAR images which might results in the uncertainty of the correlation analysis between the deformation and the triggering factors.
There is still an issue for the data processing using PSI technique. The high quality of refinement of the data processing might be difficult due to the high topographical effect in the Tibetan plateau and the drawback of SAR dataset. More robust coherent targets and more robust topographical and atmospheric effect removal will highly improve enhance the precision of the deformation result.
In addition, the data interpretation may also result in uncertainties, especially the error analysis. According to statistics, the mean value and standard deviation of uncertainties of deformation rate are 2.34 mm/year and 0.78, respectively. Hence, whether the displacements can be regarded as errors should be taken into consideration in the areas where the deformation values are less than 3 mm.
Nevertheless, combining with the field observations, the study results reveals the characteristics of the overall deformation trends which establish a good foundation for the further detailed analysis.
6. Conclusions
The Sichuan-Tibet Grid connection project passes through southeastern of the Tibetan Plateau with adverse natural environment and wide spread geological hazards. Ground stability is the key issue for the safety of the project. An integrated analysis is conducted using high spatial and temporal resolution X-band SAR with precipitation and temperature data. Intensive precipitation and freeze-thaw activities were found to be the two most important factors controlling the surface deformation in the study area. The understanding of the characteristics of ground movement is important for the construction and maintenance of Grid infrastructures in the Tibetan Plateau. In this study, taking Xiangdui section, Changdu area of Tibet, as the experimental site, we examined the characteristics of surface deformation results from the combined influence of freeze-thaw cycle effect and intensive precipitation.
The main conclusions of this study can be summarized as follows:
- (1)
The results reveal surface deformation characteristics in the study area. The study area is prone to slow to moderate ground motion with the range of −30 to +30 mm/year. The slow point targets with deformation towards the satellite are found to be distributed on the toe of landslides. This is consistent with the observation that the foot of landslide will slightly uplift when loose deposits accumulated at the feet of steep slopes. On the other hand, with varied temperature and wide distributed frozen soil, frozen heave often causes obvious deformation of surface ground in the area with sufficient water content. As expected, the point targets with slow movements away from satellite are mostly distributed on active slopes. Temporal variations of surface deformation reveal non-linear deformation histories.
- (2)
Intensive precipitation and freeze-thaw cycle activities were found to be the two most important factors controlling the surface deformation characteristics and the seasonal movement trend in the study area. During the one year monitoring period, surface deformation that was caused by freeze heave was mostly from October to early April of next year. Then, as the rise of temperature since early April, thaw of the frozen soil was the dominant factor that lead to surface subsidence before rainy season came. During the rainy season, mainly from May to September, intensive precipitation was the most important cause of surface deformation. Moreover, the heave and subsidence movement of the frozen soil with sufficient water content was more remarkable compared with other areas. Such regions are primarily located from the middle to toe of the slope where large movements often occur.
- (3)
The results suggest that the majority of the monitored transmission towers are located in stable areas. However a few towers which are located in the steep highly weathered slopes and southeast part of study area are still suffering from the issue of the slope instability. These vulnerable towers to be threatened by surface deformation were successfully detected by the significant surface subsidence in PSI results.
Results uncertainties still exist mainly due to data quality, processing, and the interpretation. For example, the inherent feature of TerraSAR imagery generates more point-like scattering targets, less robust coherent object-like targets in such high-elevated study area. In addition, it is difficult to obtain real ground motion using single orbit SAR dataset. Nevertheless, this study provides an insight into understanding the characteristics of ground movement trend in the complicated eastern Tibet area. It provides the foundation for the future detailed long-term SAR Interferometry monitoring on the ground movement in the Tibet region.


