Article

Impact of Environmental Factors on the Spectral Characteristics of Lava Surfaces: Field Spectrometry of Basaltic Lava Flows on Tenerife, Canary Islands, Spain

1
Department of Geography, Earth System Science, Vrije Universiteit Brussel, Pleinlaan 2, Brussels 1050, Belgium
2
School of Environmental Science and Spatial Informatics, China University of Mining and Technology, Daxue Road 1, Xuzhou 221116, China
3
School of Earth and Environmental Sciences, University of Portsmouth, Burnaby Building, Burnaby Road, Portsmouth PO1 3QL, UK
4
Cartography and GIS Research Group, Department of Geography, Vrije Universiteit Brussel, Pleinlaan 2, Brussels 1050, Belgium
5
Department of Electronics and Informatics, Vrije Universiteit Brussel, Pleinlaan 2, Brussels 1050, Belgium
*
Author to whom correspondence should be addressed.
Remote Sens. 2015, 7(12), 16986-17012; https://doi.org/10.3390/rs71215864
Submission received: 31 August 2015 / Revised: 1 December 2015 / Accepted: 9 December 2015 / Published: 16 December 2015
(This article belongs to the Special Issue Volcano Remote Sensing)

Abstract

:
We report on spectral reflectance measurements of basaltic lava flows on Tenerife Island, Spain. Lava flow surfaces of different ages, surface roughness and elevations were systematically measured using a field spectroradiometer operating in the range of 350–2500 nm. Surface roughness, oxidation and lichen coverage were documented at each measured site. Spectral properties vary with age and morphology of lava. Pre-historical lavas with no biological coverage show a prominent increase in spectral reflectance in the 400–760 nm range and a decrease in the 2140–2210 nm range. Pāhoehoe surfaces have higher reflectance values than ʻaʻā ones and attain a maximum reflectance at wavelengths < 760 nm. Lichen-covered lavas are characterized by multiple lichen-related absorption and reflection features. We demonstrate that oxidation and lichen growth are two major factors controlling spectra of Tenerife lava surfaces and, therefore, propose an oxidation index and a lichen index to quantify surface alterations of lava flows: (1) the oxidation index is based on the increase of the slope of the spectral profile from blue to red as the field-observed oxidation level strengthens; and (2) the lichen index is based on the spectral reflectance in the 1660–1725 nm range, which proves to be highly correlated with lichen coverage documented in the field. The two spectral indices are applied to Landsat ETM+ and Hyperion imagery of the study area for mapping oxidation and lichen coverage on lava surfaces, respectively. Hyperion is shown to be capable of discriminating different volcanic surfaces, i.e., tephra vs. lava and oxidized lava vs. lichen-covered lava. Our study highlights the value of field spectroscopic measurements to aid interpretation of lava flow characterization using satellite images and of the effects of environmental factors on lava surface evolution over time, and, therefore, has the potential to contribute to the mapping as well as dating of lava surfaces.

Graphical Abstract

1. Introduction

Volcanic eruptions pose a persistent threat to humans and their activities. Amongst the most frequent volcanic hazards are lava flows, e.g., [1,2]. Lava emplacement is an important constructive geological process that creates and repaves the earth’s crust and contributes to reshaping natural landscapes, but also has immediate and long lasting impacts on human activities. In order to assess the hazards and long term impacts posed by lava flows, it is vital to understand aspects such as the return period of effusive eruptions, to map the areas covered by eruptions in the past and to characterize the evolution of lava flow surfaces after emplacement.
Remote sensing techniques have a significant role to play in studying volcanic surfaces, their emplacement processes and environmental impacts. Current remote sensing studies of lava primarily focus on monitoring and mapping, e.g., [3,4]. Thermal observations are often used to monitor potential and ongoing volcanic activities by detecting and characterizing hot spots, e.g., [5,6,7,8,9,10]. Satellite data acquired in the visible to near infrared, thermal infrared ranges as well as radar signals have been proven useful in mapping lava flows [11,12,13]. Other studies highlighted the possibility to discriminate weathered lavas and even to relatively date them [14,15,16]. All these applications rely on material-specific spectral responses of volcanic surfaces, which may vary both spatially and temporally. Improving the understanding of the spectra of lava surfaces has the potential to help to better interpret the spectra of volcanic areas recorded on satellite images and, therefore, to facilitate the realization of our long-term goals, i.e., mapping and dating lava flows. Whereas several studies have investigated the factors controlling the contrasted characteristics of lava in the thermal infrared and radar wavelength ranges [14,17,18,19], only limited attention has been dedicated to unravelling the factors controlling the large spectral contrasts observed within lava flow fields in the visible to near-infrared range. There is therefore a need to build a spectral library of lava surfaces, to find out how they behave spectrally, to characterize how this spectral behavior varies in space and time and to investigate which flow characteristics or environmental factors influence these variations.
Characterization of surface spectral reflectance by satellite remote sensing is constrained by the spectral range and resolution (i.e., number of spectral bands) as well as by the spatial resolution of the imagery. Whereas multispectral imagery can be acquired at very high spatial resolution (e.g., Pleiades, 0.5–2 m; [20]), spatial resolution of hyperspectral satellite data remains low (e.g., Hyperion, 30 m; [21,22]) and spectral mixing is thus a major issue. The spectral reflectance of lava of different compositions has also been documented using laboratory spectrometry with decimeter-size samples [15]. For accessible volcanic terrains, field spectrometry offers a useful alternative approach for characterizing the spectral reflectance of contrasted lava surfaces and for documenting its spatial variation at different spatial scales [21].
Hyperspectral analysis of lava flows, especially in the visible and shortwave infrared regions, is rare and limited to a few volcanoes. Spectral reflectance of Hawaiian ʻaʻā lavas have been collected in the laboratory and used to discriminate lava flows of different age groups [15]. Volcanic surfaces at Mt. Etna have been documented based on field spectrometry, including the reflectance spectra of dated, fresh, altered and oxidized lava surfaces [21,23,24]. All previous studies, however, were based on a limited number of spectroscopic measurements, not representing the spatial variability of spectral reflectance within and between lava flow surfaces. Earlier work also did not systematically investigate the environmental factors and surface conditions influencing the measured reflectance spectra.
As lava surfaces are long exposed to the environment, the question is whether and how the spectra of lava flows change with time. Studies of Nyamuragira volcano, for example, have shown that in humid, tropical climates, vegetation colonization has a significant impact on the spectra of aging lava flows by increasing the spectral response in the near infrared band [20,22]. The spectral reflectance of lava flows is also affected by lichen cover [25,26] and chemical weathering [26,27,28,29,30]. Compared to lava spectra, lichens are characterized by higher reflectance with several minima and maxima at specific wavelengths (e.g., [31,32,33]). Lichen cover on lava would therefore alter the pattern of lava spectra [24,33]. Exposure to the environment also promotes chemical weathering of lava. This is a complex process controlled by multiple factors such as climate, relief, lithology, vegetation cover, lava age as well as the surface roughness resulting from lava flow emplacement dynamics (e.g., [28,30]). Although oxidation has been reported to increase the slope of the reflectance curve in the visible part of the spectrum over time [15], how lava spectra are progressively influenced by other surface characteristics and environmental conditions (e.g., surface roughness [8,14,16]), and to what extent, and how this understanding could contribute in improving automatic mapping and relative dating of lava flow fields are important questions that remain to be investigated.
In order to contribute to the general objective of using spatio-temporal spectral variations of lava surfaces for improved mapping and relative dating, this study assesses the control of environmental factors on the spectral characteristics of lava surfaces. Specific objectives are: (1) to collect a large dataset of lava surface spectra using field spectroscopy, representing the spatial variability of spectral reflectance within and between lava flow surfaces; (2) to investigate the in situ environmental factors and surface conditions influencing the measured reflectance spectra, particularly age specific aspects such as degree of oxidation and lichen coverage, and time-independent surface roughness; and (3) to compare and analyze the correlation between field and satellite based reflectance measurements of lava surfaces.

2. Study Area

Tenerife is the largest among the seven volcanic islands of the Canaries located in the Atlantic Ocean off the west coast of Morocco, Africa (inset of Figure 1a). Tenerife has a sub-tropical climate with high insolation throughout the year with average temperatures varying from 19 °C to 25 °C. As a result of trade winds and topography of the island, the northern slopes at 600–1800 m a.s.l. receive most of the rainfall (annual precipitation > 500 mm), and the south and west flanks are much warmer and drier (<300 mm) [34], leading to less vegetation cover. Moreover, the central part of the island hosts the Las Cañadas caldera and Teide stratovolcano––which are located above 2000 m a.s.l.––the lower temperatures at these elevations prevent vegetation growth [35].
As a complex volcanic island, Tenerife is characterized by both effusive and explosive eruptions [36]. Historical volcanic activity has been characterized by basaltic lava flows on the volcano flanks, including the Boca Cangrejo (1492), Fasnia (1705), Garachico (1706) and Chinyero (1909) lava flows, and also the Chahorra (1798) flow in the south of the caldera ([36]; Figure 1). The latter covers several pre-historical, undated, basaltic flow units displaying a higher degree of weathering (Figure 1b). The historical basaltic lavas have either a basanite or phonolotic tephrite composition with limited crystal content [36,37].
Two field campaigns were conducted in November 2013 and September 2014, during which 43 lava flow sites of different ages and three tephra surface sites (mostly lapilli with <10% bombs) were documented with field spectrometry (Figure 1; Table A1). Measurement sites were selected in order to optimally represent the spatial variability of lava surfaces of different ages, with specific attention given to different elevations under different climatic conditions. Understandably, sites are selected only if they are accessible. Other criteria include surface homogeneity and a minimum distance of 30 m away from roads or lava flow edges.
Figure 1. Location of studied lava flows on Tenerife Island and distribution of field spectroscopic measurements sites. A shaded relief image derived from a 25 m resolution DEM is overlaid with contour lines with an interval of 50 m and GIS data of roads and municipal boundaries (GIS data are freely available at [38]). A detailed description of these sites is given in Table A1. (a) Overview of the island; (b) Chahorra flow and surrounding sites on undated flows; (c) Garachico flow; (d) Chinyero (top) and Boca Cangrejo (bottom) flows; (e) Fasnia (top) and Siete Fuentes (bottom) lava flows and tephra deposit (sites F03T and F04T). For more information on these eruptions and how they were dated, the reader is referred to [36] and references therein.
Remotesensing 07 15864 g001

3. Methodology

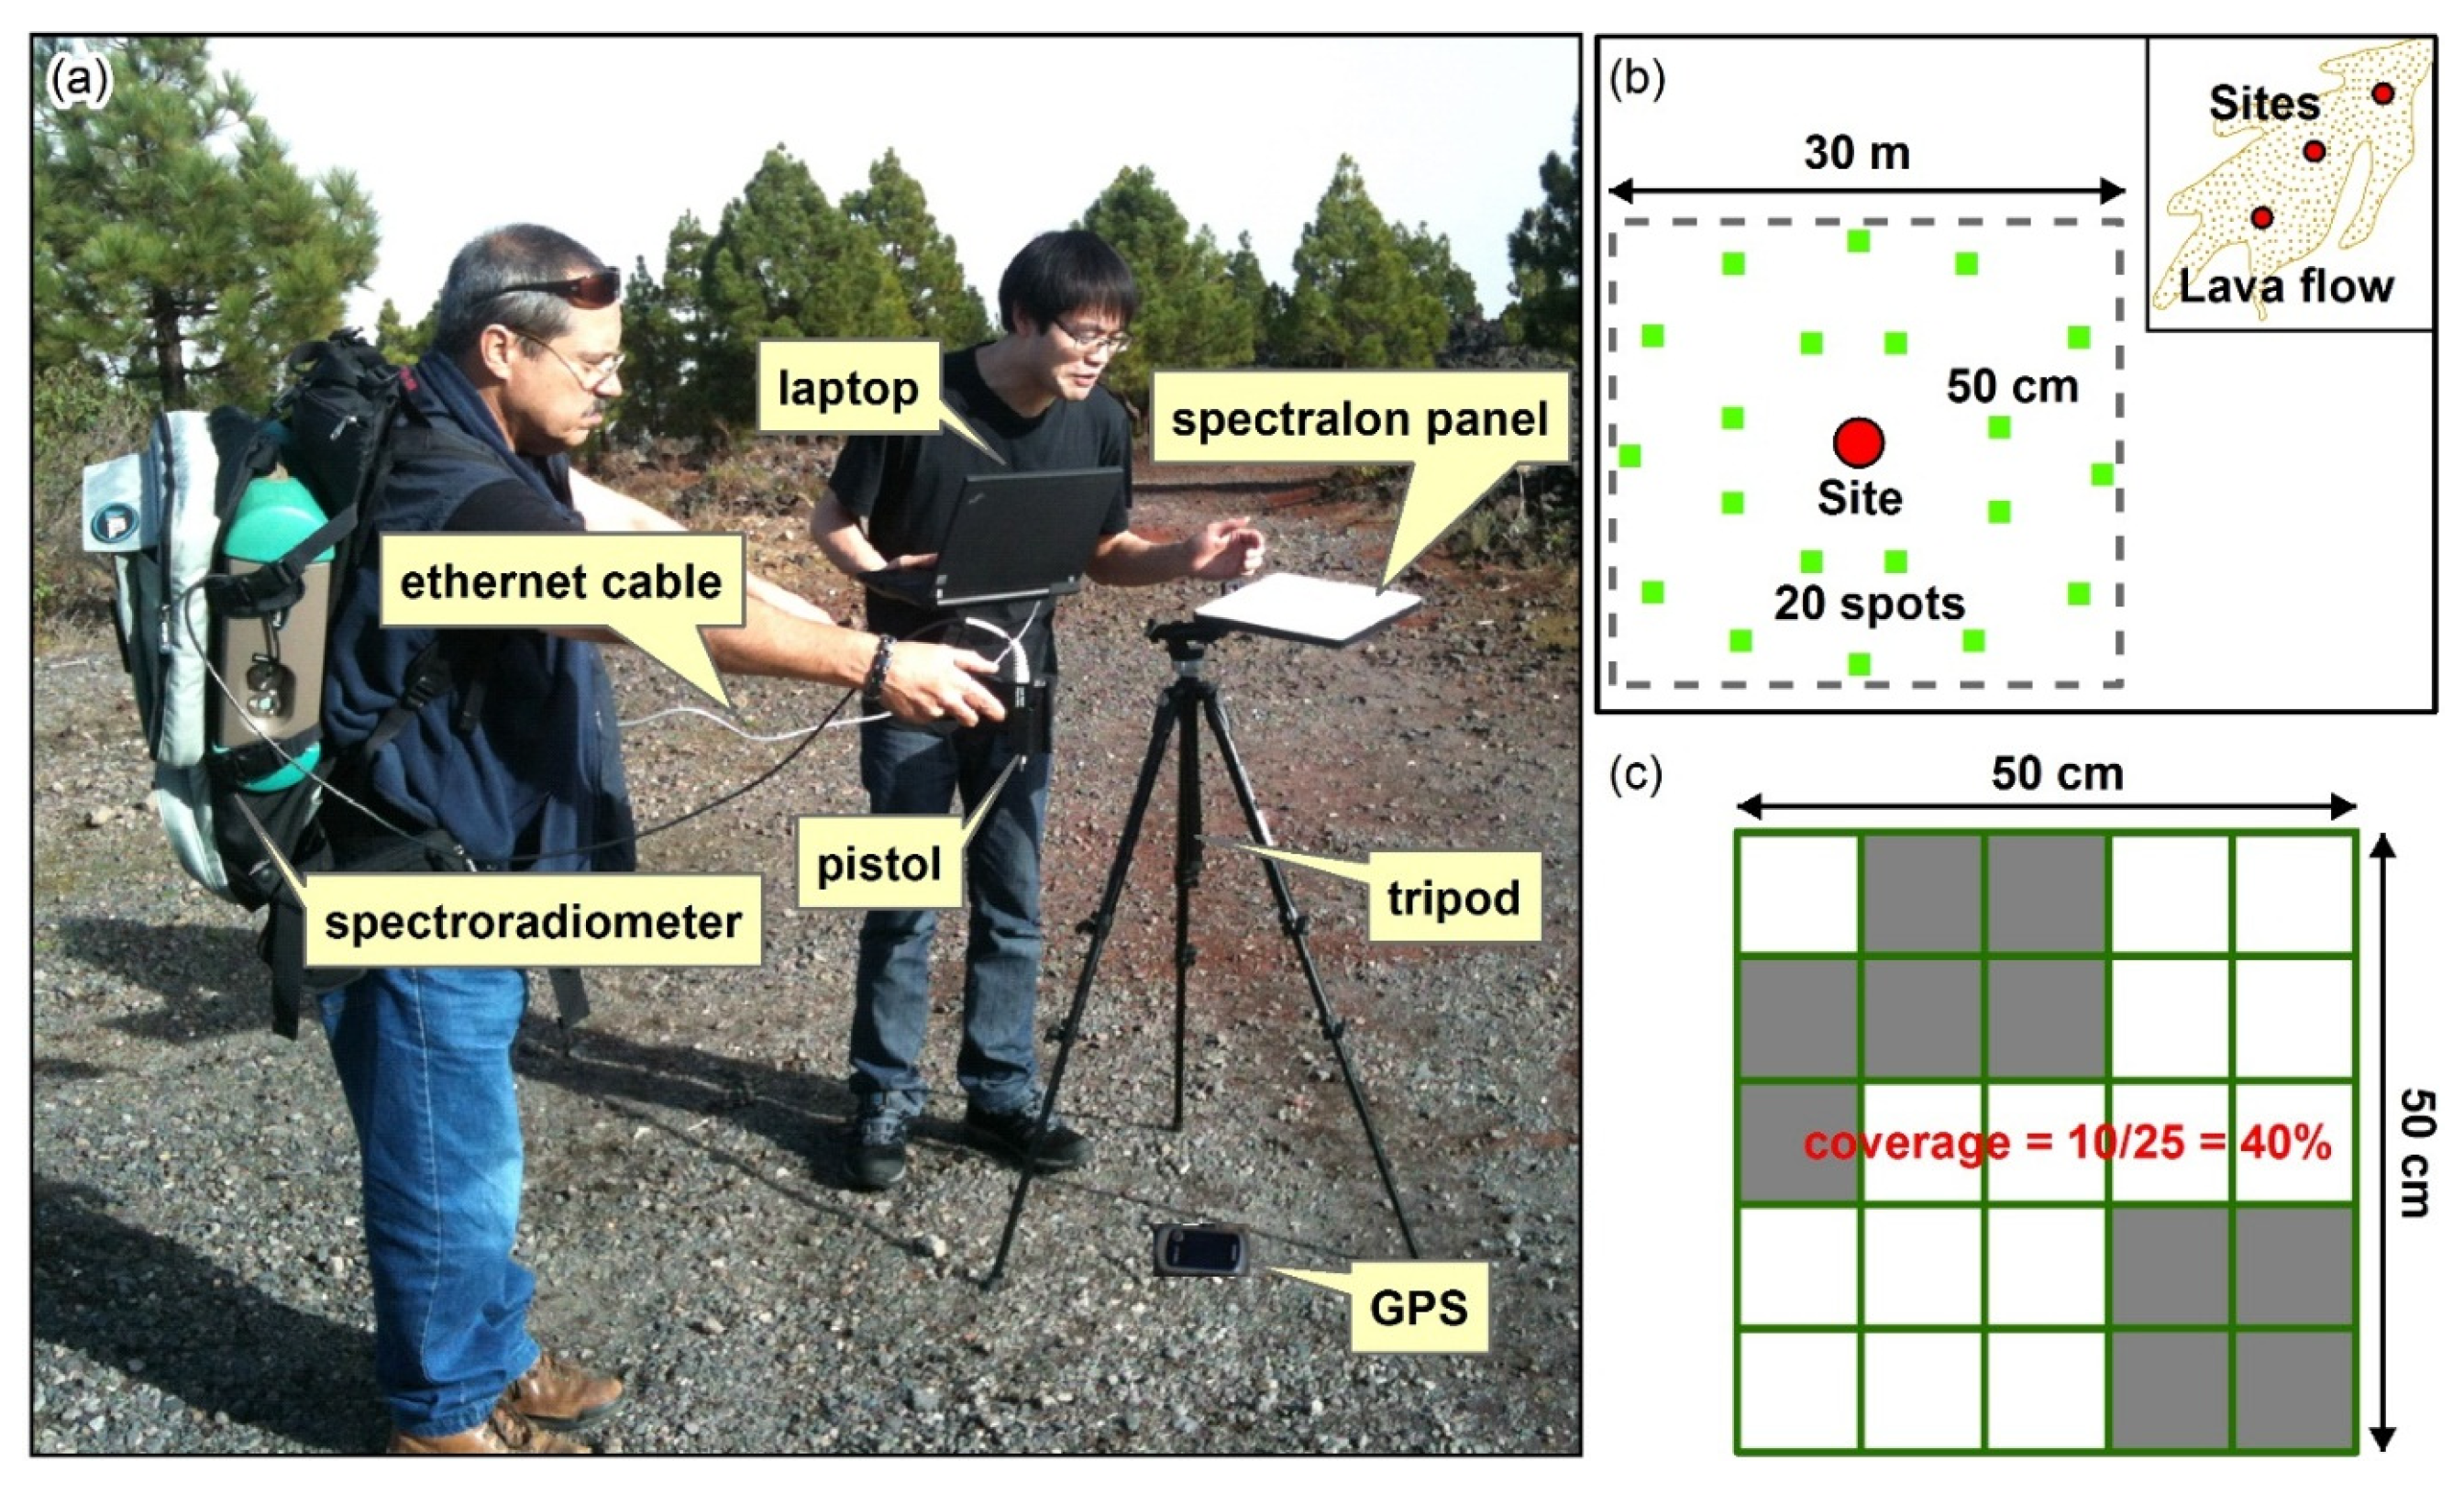
3.1. Field Spectral Measurements

The spectroradiometer used for collecting field hyperspectral data is a portable FieldSpec 3, manufactured by US-based Analytical Spectral Devices (ASD). This instrument measures targets within the 350–2500 nm spectral range using three spectrometers, namely a VNIR (visible and near infrared) detector for 350–1000 nm and two SWIR (shortwave infrared) ones, SWIR1 for ~1000–1850 nm and SWIR2 for 1700–2500 nm [39].
The procedure for obtaining the surface reflectance of lava flows using the ASD spectroradiometer is shown in Figure 2. Twenty spots, evenly distributed within a 30-meter-side square, were measured around each site center (Figure 2b). The size of the site area corresponds to the pixel size of commonly used satellite data such as Landsat and Hyperion. The pistol grip was held at a height of 1.2 m with bare fore optic. With the inherent 25-degree field of view (FOV), this results in the scanning of a surface area of roughly 50 × 50 cm2. The reflectance at each spot was measured four times (each time averaging 40 scans), resulting in a total of 80 spectral curves for each site. At the center of the selected site, a spectralon panel was stabilized on a tripod for calibration at the start and after every five spots’ measurement. All measurements were conducted within 2.5 h before and after solar noon to avoid shadow and low sunlight angle effects. This measurement strategy ensured that we obtained a representative average reflectance spectrum for each site, while also documenting the local variability within the site.
Figure 2. Illustration of the field measurement strategy: (a) spectral measurement using an ASD field spectroradiometer, an IBM laptop, a spectralon panel fixed on a tripod and a handheld GPS placed on the ground; (b) distribution of spots (green squares) around the center of the site on the lava flow surface; (c) quantifying the surface oxidation and lichen coverage with the plastic net method. This example shows that the surface of the spot scanned by the spectroradiometer pistol is 40% covered by lichens.
Remotesensing 07 15864 g002

3.2. Quantification of Weathering

Lavas are highly vesicular and porous volcanic rocks. Surface weathering is influenced by climatic conditions and by the texture of the lava flow, which will vary between pāhoehoe and ʻaʻā (e.g., [28,40]). Lava on Tenerife has experienced different forms of surface alteration, including chemical weathering (mostly oxidation), biological weathering (mostly lichen colonization) and vegetation growth (Figure 3). Recovery of vegetation (ferns, pine trees and bush species, e.g., spartocytisus supranubius and erysimum scoparium) is limited to undated flows within the Teide National Park and the lower part of the Garachico lava flow (due to a local reforestation program), and thus was not taken into account during our field measurements. Fruticose lichens (mostly stereocaulon vesuvianum) grow predominantly on the shady sides of ʻaʻā lavas, especially on Garachico and occasionally on Boca Cangrejo and Chinyero. Lichens are capable of weathering lava rocks biologically and, therefore, have been previously studied from various perspectives [25,41,42].
Figure 3. Illustration of different lava surfaces on Tenerife: (a) fresh ʻaʻā lavas on the Chahorra flow at site C05; (b) a large view of the Chahorra lava flow at site C07; (c) undated oxidized ʻaʻā lavas in caldera at site U10; (d) a large view of the undated surface at site U10; (e) comparison between the Chahorra lava (dark color in the background) and the undated lava (foreground); (f) partly oxidized ʻaʻā lavas with few lichens on Chinyero at site Y07; (g) lichen-covered ʻaʻā lavas on Garachico at site G06; (h) patch of fresh pāhoehoe lavas on Chahorra at site C03P; and (i) undated oxidized pāhoehoe lavas in caldera at site U06P. A 15 cm long pencil in (a), (c), (f) and (h) and humans in (d) and (i) are placed for visual comparison of scale.
Remotesensing 07 15864 g003
The degree of lava surface alteration was characterized in a semi-quantitative way by placing a 50 × 50 cm2 plastic net consisting of 25 equal-sized grids on the lava surface and calculating the percentage of grids filled by oxidized surface and lichens (Figure 2c). The size of the plastic net is equal to the FOV of the fore optic, which allows associating the lava spectrum to the degree of oxidation and the amount of lichens. Whereas the identification of the lichen cover fraction is unambiguous, the proportion of oxidized surface should be rather interpreted as a qualitative indicator, as it is based on visual interpretation of the transition from grey/black for fresh lava surfaces, to light brown or reddish for oxidized ones. The visual assessment of the “redness” of the rock should obviously correlate with the reflectance measured in the red wavelengths, even though the plastic net method assesses the proportion of oxidized surface rather than the intensity. This independent characterization helps to assess the consistency of the field inspection of surface weathering and the spectral measurement. It also helps to understand whether surface oxidation is associated with other spectral features.
The fractions of lichen-covered and oxidized lava surfaces were visually estimated for each measured spot and averaged at the site scale for the 29 sites measured during the September 2014 campaign. For the 18 sites measured in November 2013, the level of lichen coverage and oxidation were estimated at the site scale based on field observations and photos.

3.3. Surface Roughness

Surface roughness defined by the micro-topographic variations is an important characteristic of lava surfaces, controlled by its emplacement dynamics (e.g., [18,19,43]). Roughness controls the lava surface porosity and will therefore influence the type and rate of surface weathering [44,45]. Lava surface roughness has been previously correlated with emission in the thermal infrared range [14] and backscatter of radar signals [8,46]. We here wish to investigate whether lava flow surface roughness also influences the spectral reflectance in the VNIR and SWIR ranges. To characterize the surface roughness at the scale of each site, the chain method was applied [47]. A 30-meter-long chain was placed in E–W and S–N directions along the lava surface, in such a way that the chain follows the surface’s irregularities. The measured horizontal distance (Table A1) covered by the chain decreases as surface roughness increases. The ratio of the chain length to the mean horizontal distance along the two transects was used to characterize the average surface roughness of each site: this ratio is 1 for perfectly smooth surfaces and increases with surface roughness.

3.4. Processing of Field Spectra

Field spectra acquired from a spectroradiometer are often noisy and need to be processed prior to further analysis. Typical processing practice includes jump correction, noise removal and smoothing [48].
A small jump at the VNIR-to-SWIR1 spectrometer transition at 1000 nm is observed for spectral data acquired in the field. This spectral discontinuity is attributed largely to a slight offset of FOVs of the fiber optics for each spectrometer and the fact that the signal-to-noise ratio (SNR) is lowest at connecting wavelengths [38]. To correct the jump, we shifted the reflectances at the 350–1000 nm range and beyond 1000 nm half the difference toward each other [49].
The ~1400 nm and ~1900 nm and >2350 nm ranges are affected by high noise for all acquired field spectra, which is attributed to strong absorption of incident downwelling radiation by atmospheric water vapor [50]. In our case, the affected ranges 1351–1459 nm, 1771–2029 nm and 2351–2500 nm were excluded from spectral analysis. Afterwards, the data was smoothed by averaging seven adjacent points to build a lava spectral library.

3.5. Spectral Indices

In order to link the ground-based reflectance spectra with lava surface oxidation and lichen coverage observed in the field, we tested spectral indices of three different types: subtraction (ref2 − ref1), ratio (ref2/ref1) and normalized difference ((ref2 − ref1)/(ref2 + ref1)). Both ref1 and ref2 in the formulations are the reflectances at a specific wavelength or the average reflectances in wavelength ranges, resampled over an interval of 5 nm. The wavelengths or wavelength ranges of interest are either observed from the field spectral data or taken from the literature (see Results).
By plotting the proposed spectral indices against field-observed lava surface alteration, the wavelengths and the type of spectral indices that best characterize the observed alterations can be determined.

3.6. Satellite Remote Sensing Data

Satellite remote sensing data of Tenerife that were used in this research include a Landsat ETM+ image acquired on 23 January 2001 and a Hyperion image acquired on 20 September 2003, both freely obtained through USGS Earth Explorer site. The Landsat ETM+ image covers almost the entire island except for its southernmost part while the Hyperion image only covers the western flank of Tenerife, including the Garachico, Boca Cangrejo and Chinyero lava flows. ETM+ is a multispectral radiometer mounted on the seventh Landsat mission, capable of providing imaging information of the Earth’s surface in eight bands at a spatial resolution of 30 m (VNIR and SWIR bands b1–b5 and b7) [51]. Hyperion is a hyperspectral imaging sensor mounted on Earth Observing-1 Satellite, scanning the Earth’s surface at a spatial resolution of 30 m in 220 unique spectral bands within the range of 400–2500 nm [52]. The spectral range of this spaceborne instrument is almost the same as that of the field spectroradiometer.
The spatial resolution of the two image datasets is equal to the size of the sites measured in the field, enabling a comparison of the field spectral data and the satellite image data. The interval of over 10 years between the images and field data is not seen as an obstacle to comparison, as the lava surfaces are more than 100 years old and are expected to have evolved slowly.
Both images were atmospherically corrected and georeferenced to a WebGIS-based 1:5000 topographic map of Tenerife (2009) [53] with a planimetric error <10 m. A topographic correction (C method) [54,55] was also tested with the Landsat ETM+ image but the dark surfaces in shadow zones show too little spectral contrast to return useful information and have to be masked out. The field spectra were resampled at the wavelength interval of ETM+ and Hyperion (i.e., 10 nm), and the Hyperion spectra were smoothed to diminish noise.

4. Results

4.1. Spectral Reflectance of Volcanic Surfaces
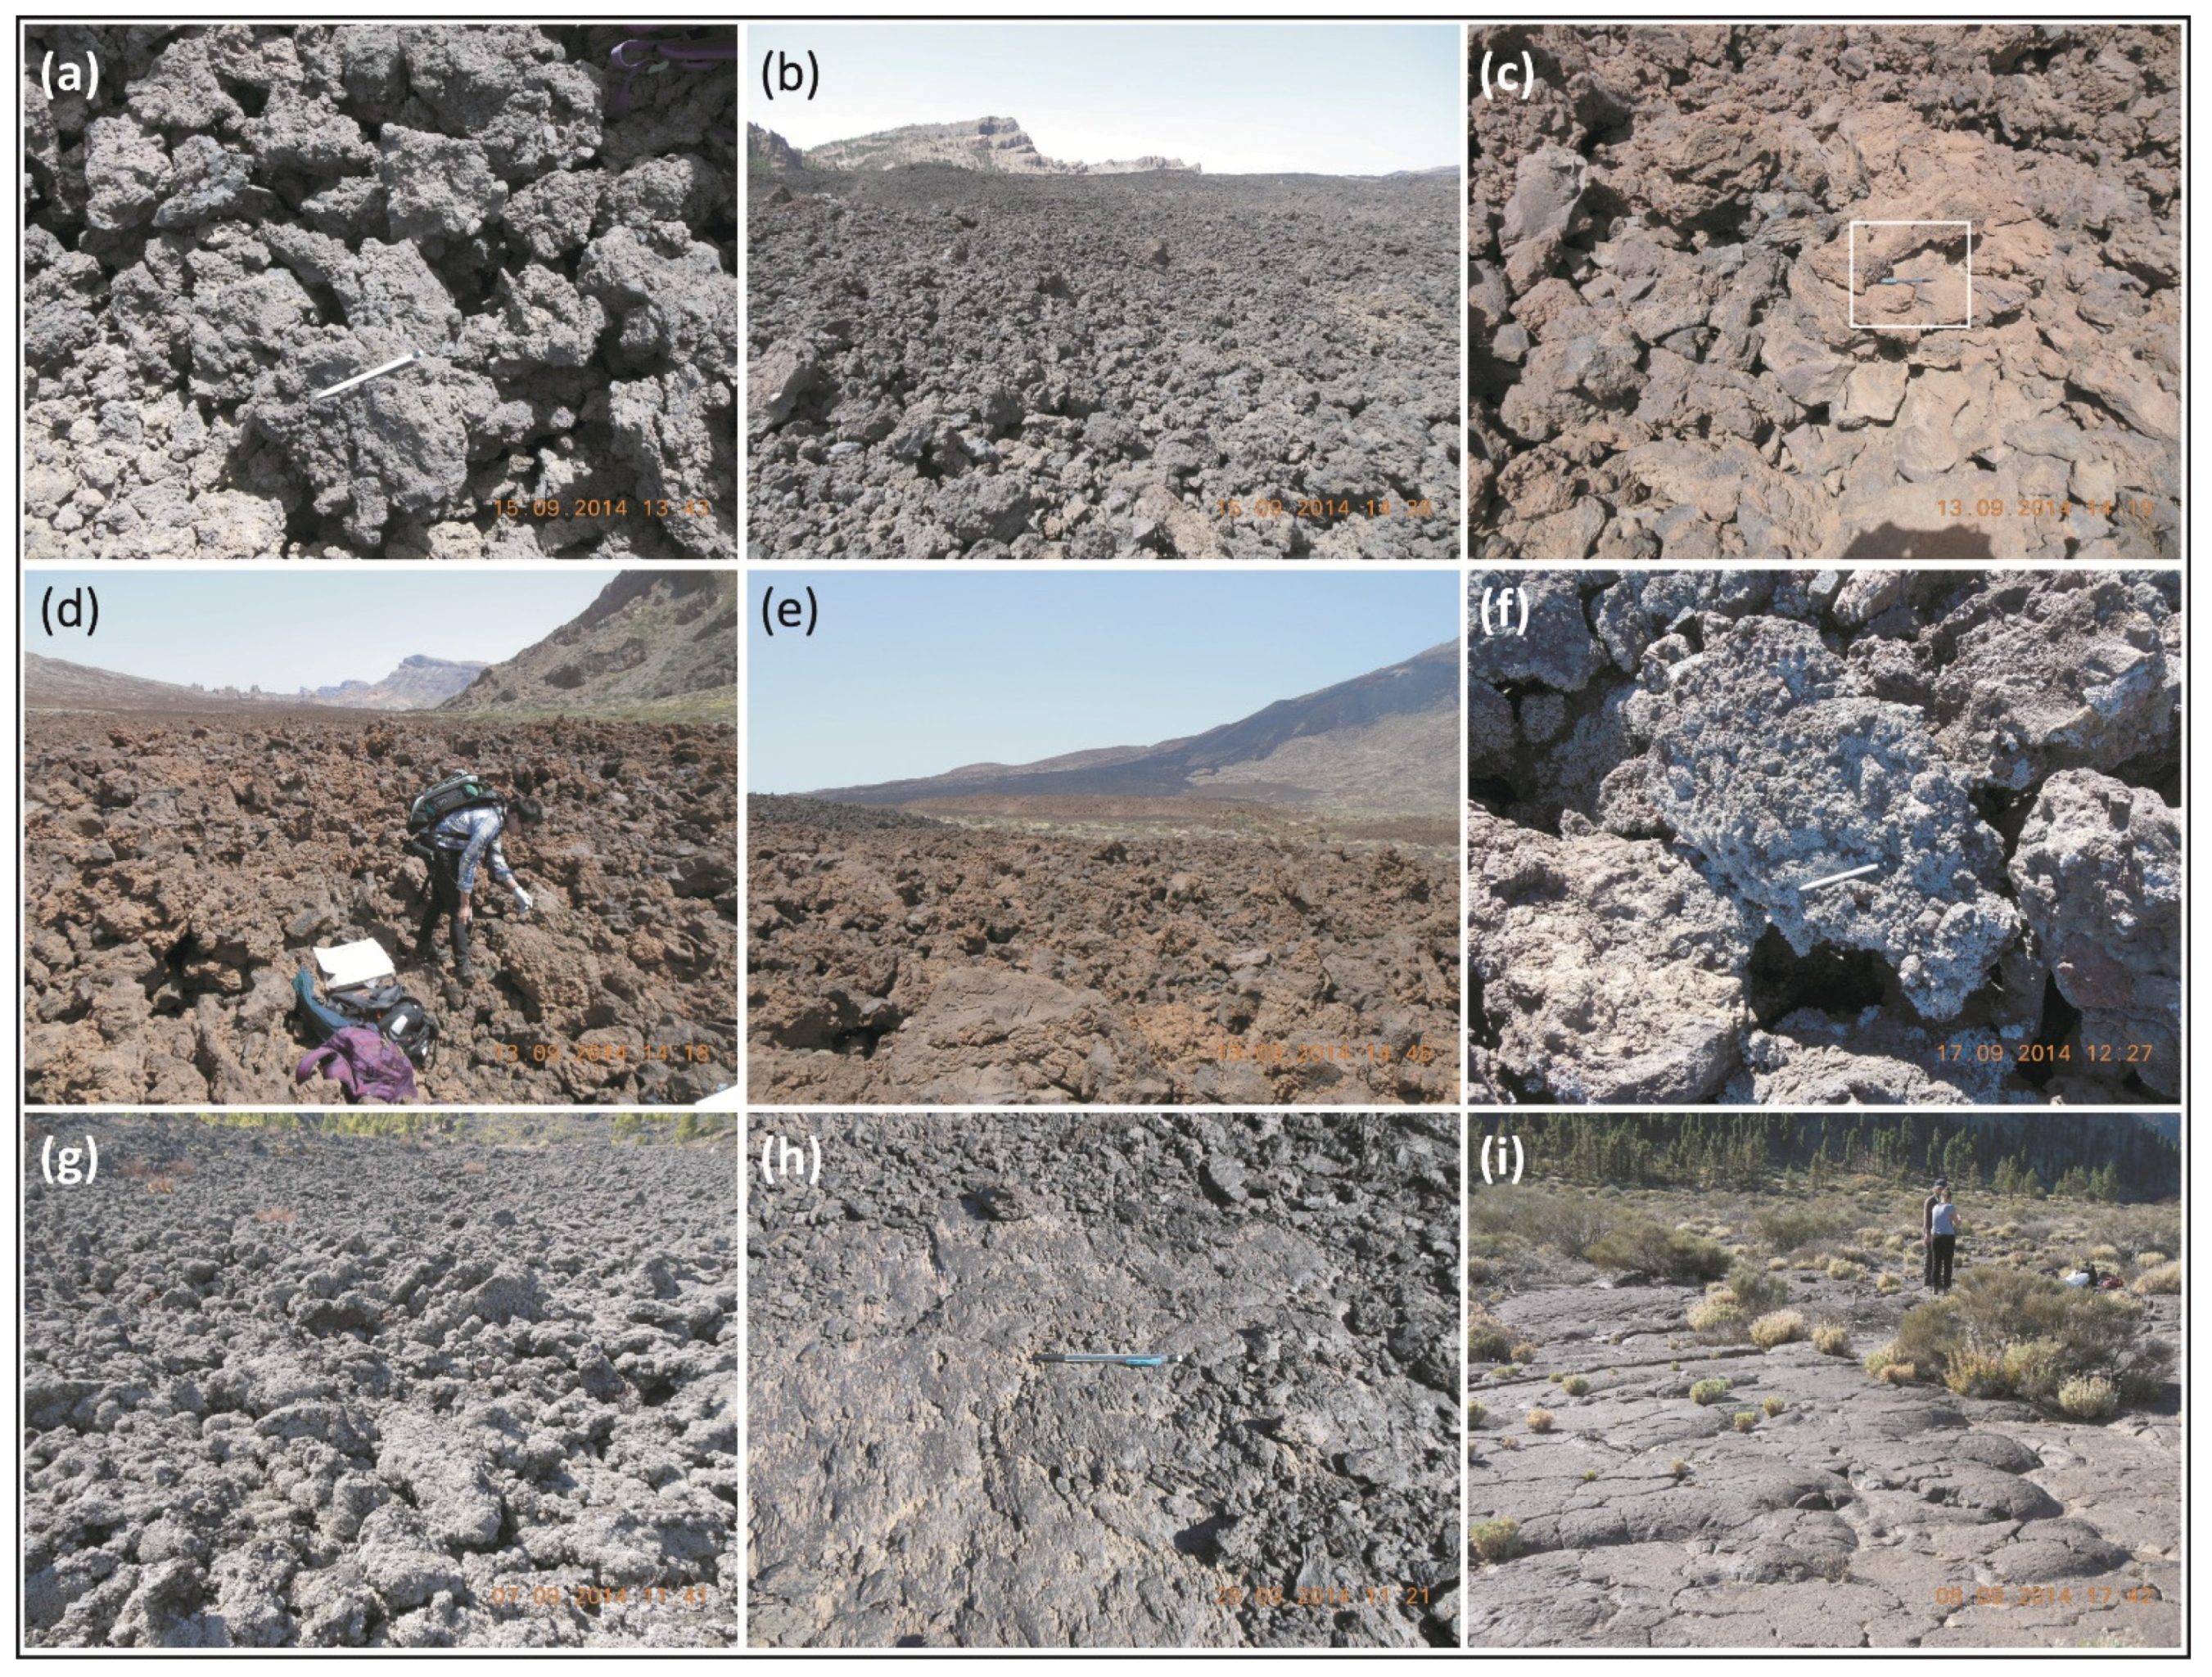
4.1.1. Lava Flows

The common features of their reflectance spectra are illustrated in Figure 4. Based on the shape of their spectral curves, lava sites on the island can be categorized into three groups.
Figure 4. Field reflectance spectra measured at different volcanic sites on Tenerife (vertically offset for clarity). Each curve is the average of ~80 measurements in 20 spots within a 30 × 30 m2 square. (a) Lava sites on the Chahorra (C), Fasnia (F) and Boca Cangrejo (B) lava flows; (b) lava sites on prehistorical lava flows in the caldera (U); (c) lava sites on the Garachico (G) lava flow; (d) lava sites on Boca Cangrejo (B) and Chinyero (Y) lava flows; (e) tephra deposit sites on the Garachico and Fasnia cones; (f) absolute reflectances for selected sites. Grey background behind spectral curves are standard deviations of reflectance at each wavelength for sites C11, F03T and G04, measured from the standard deviation of the 20 spots measurement per site. Wavelengths corresponding to significant spectral features are indicated by dashed lines. The sites whose names end with a “P” or “T” were measured on pāhoehoe lava surfaces and tephra fields, respectively. All other sites were measured on ʻaʻā lava surfaces. Spectral ranges centered around 1400, 1900 nm and beyond 2350 nm are removed due to high noise.
Remotesensing 07 15864 g004aRemotesensing 07 15864 g004b
The first group includes all the sites measured on the Chahorra, Fasnia and the undated lava flows, as well as the B01P of Boca Cangrejo (Figure 4a,b). All these sites are characterized by elevations >1470 m a.s.l. (referred to as the high elevation sites). A noticeable reflectance maximum is observed around 750–770 nm for ʻaʻā surfaces while this maximum shifts to shorter wavelengths for pāhoehoe surfaces (C03P and B01P). The steepest part of the reflectance curves in the visible range of the spectrum is located at 500–550 nm. In the NIR, most lava surfaces’ spectra show a decrease except for a few prehistorical lava sites (U01P, U04 and U10). For wavelengths beyond 1500 nm, the reflectance curves are very flat except for a noticeable decrease in reflectance from 2130–2150 nm to 2200–2220 nm for all lava sites. The latter feature is most clear on prehistorical lava flows.
The second group consists of all the sites measured on the Garachico lava flow (Figure 4c), which are characterized by low elevations (<1200 m a.s.l., referred to as the low elevation sites) and significant lichen coverage. After a sharp increase in reflectance from around 390 nm and to about 680 nm, the reflectance spectra of lichen-covered lavas show a continuous increase in the VNIR range, reaching a maximum at 1300–1340 nm and a slope discontinuity at 1180–1200 nm. A well-defined spectral feature marked by a maximum at 1650–1670 nm associated with a minimum at 1720–1730 nm is observed for all the Garachico sites. A second spectral feature is observed at wavelengths >2000 nm, with a maximum at 2220–2235 nm and two minima at 2085–2105 nm and 2300–2315 nm.
The third group includes the sites measured on the Boca Cangrejo (except B01P) and Chinyero lava flows (Figure 4d), which are characterized by intermediate elevations (1200–1470 m a.s.l., referred to as the intermediate elevation sites) and limited lichen coverage and chemical weathering. The increase in reflectance up to around 800 nm is similar for all sites on ʻaʻā surfaces of the two lava flows. The profiles vary in slope toward longer wavelengths. Sites B02, Y01 and Y02 exhibit a prominent peak around 1125–1150 nm and pronounced spikes in the SWIR2 range, particularly beyond 2000 nm, which are very likely due to noise as a result of unfavorable weather conditions.

4.1.2. Tephra

As discussed in the methodology, tephra refers mainly to lapilli sized pyroclasts (2–64 mm in diameter). Reflectance spectra of tephra are different from those of lavas (Figure 4e). Tephra show a local maximum around 700–750 nm but their reflectances are generally low, less than 5% (Figure 4f), with limited variation. Their flat spectra increase in the visible range and decrease in the NIR range (750–1000 nm), followed by a gradual increase in the SWIR range.

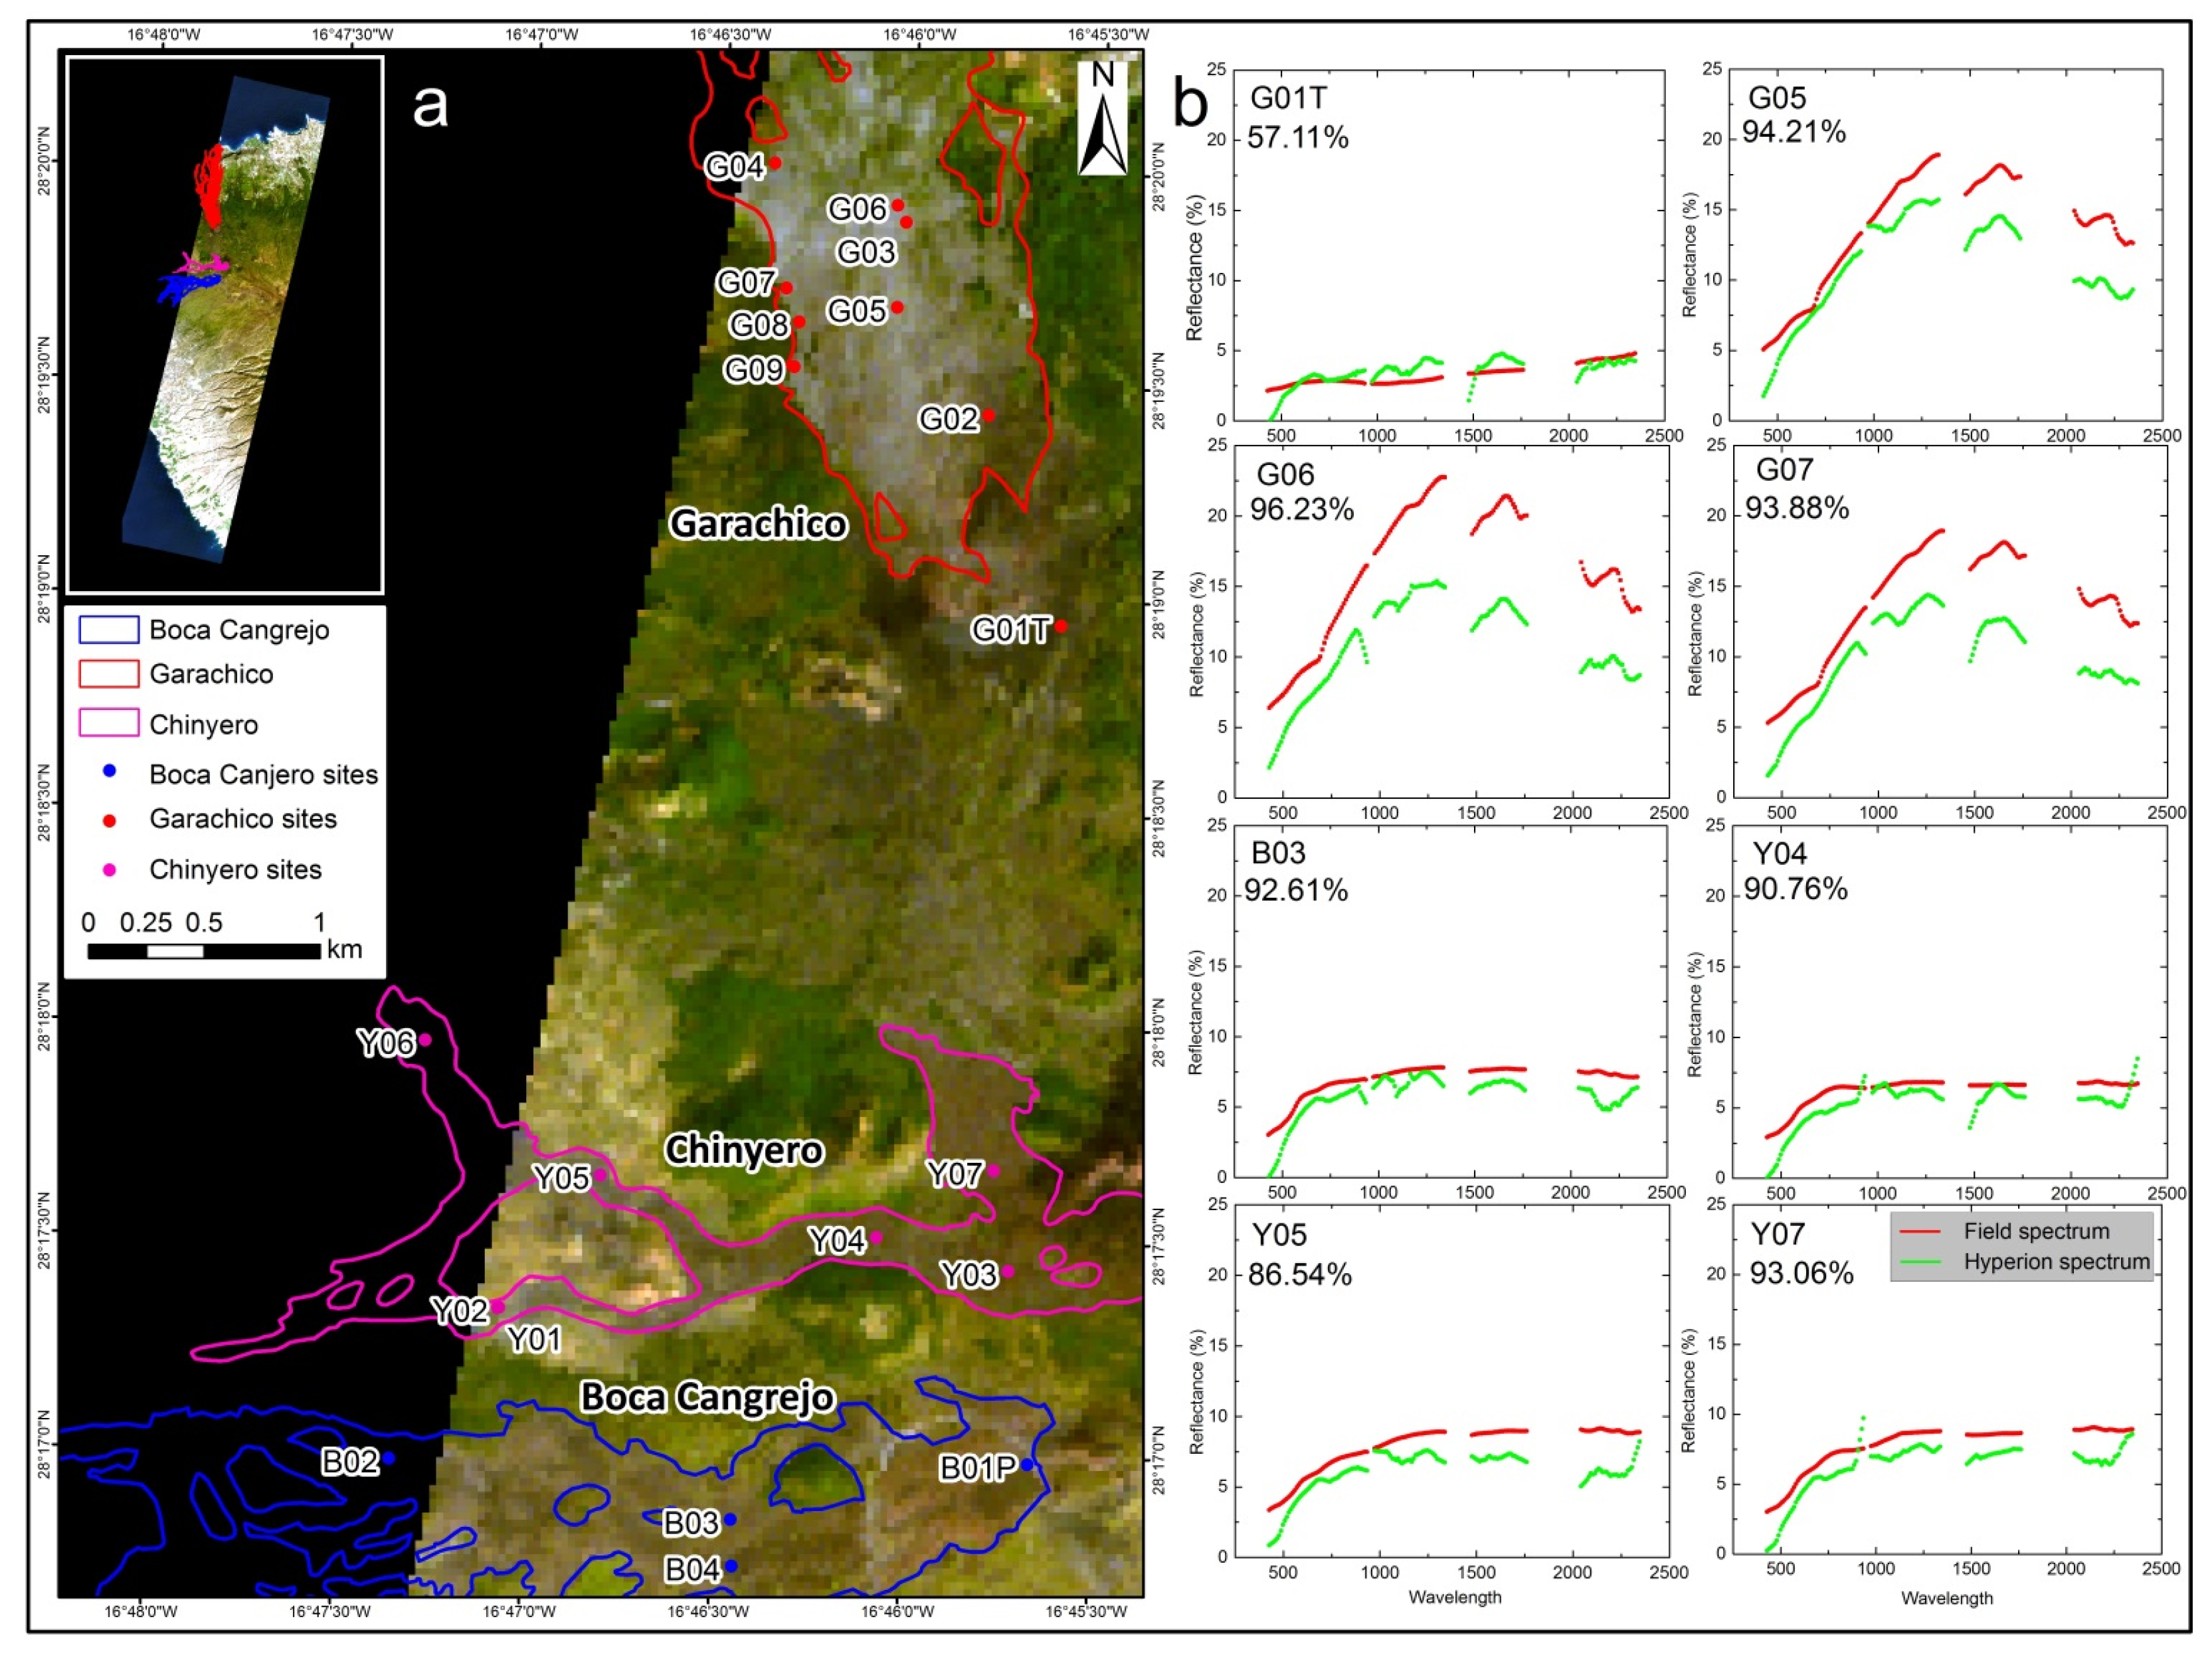
4.2. Comparison with Hyperspectral Image Data

Figure 5 shows the field-derived and Hyperion spectral curves for eight of the 18 sites covered by the Hyperion image. The Hyperion reflectance in the violet to blue range is often negative after atmospheric correction, due to the low SNR of the sensor at these wavelengths, and is therefore deleted before comparison. The comparison shows that: (1) field spectral reflectances are generally higher than Hyperion spectral reflectances except for the tephra surface (G01T); (2) large differences in reflectance are in the SWIR region for the Garachico lava sites; (3) the two spectral curves have similar shapes, notably for the Garachico lava sites; (4) the Hyperion and field derived spectral curves always show correlations >90%, except for the very flat spectral curve of the tephra surface; and (5) noise in the NIR and SWIR of Hyperion spectra tends to weaken spectral features or to create false ones, which may imply that derivation of spectral indices is less reliable. More importantly, the Hyperion data show clear differences between the various surfaces: the reflectance of tephra surfaces is up to 5%, which is lower than lava surfaces; oxidized lava surfaces tend to have flatter spectra than lichen-covered ones, which show reflectance higher than 10% in the NIR and clear lichen-related features, e.g., the decrease in reflectance between 1660 nm and 1725 nm.
Figure 5. (a) Hyperion image of Tenerife acquired on 10 September 2003, showing the extent of lava flows and measured sites indicated by their names; (b) Graphs comparing field spectra resampled to the wavelength of the Hyperion sensor (red curves) and smoothed Hyperion spectra (green curves) for selected sites including one tephra site on the Garachico cone (G01T), three Garachico lava sites characterized by lichen cover (G05–G07), one Boca Cangrejo lava site (B03) and three Chinyero lava sites characterized mainly by intermediate level of surface oxidation (Y04, Y05 and Y07). The correlations between the two spectral curves are provided below the site labels.
Remotesensing 07 15864 g005

4.3. Effect of Weathering
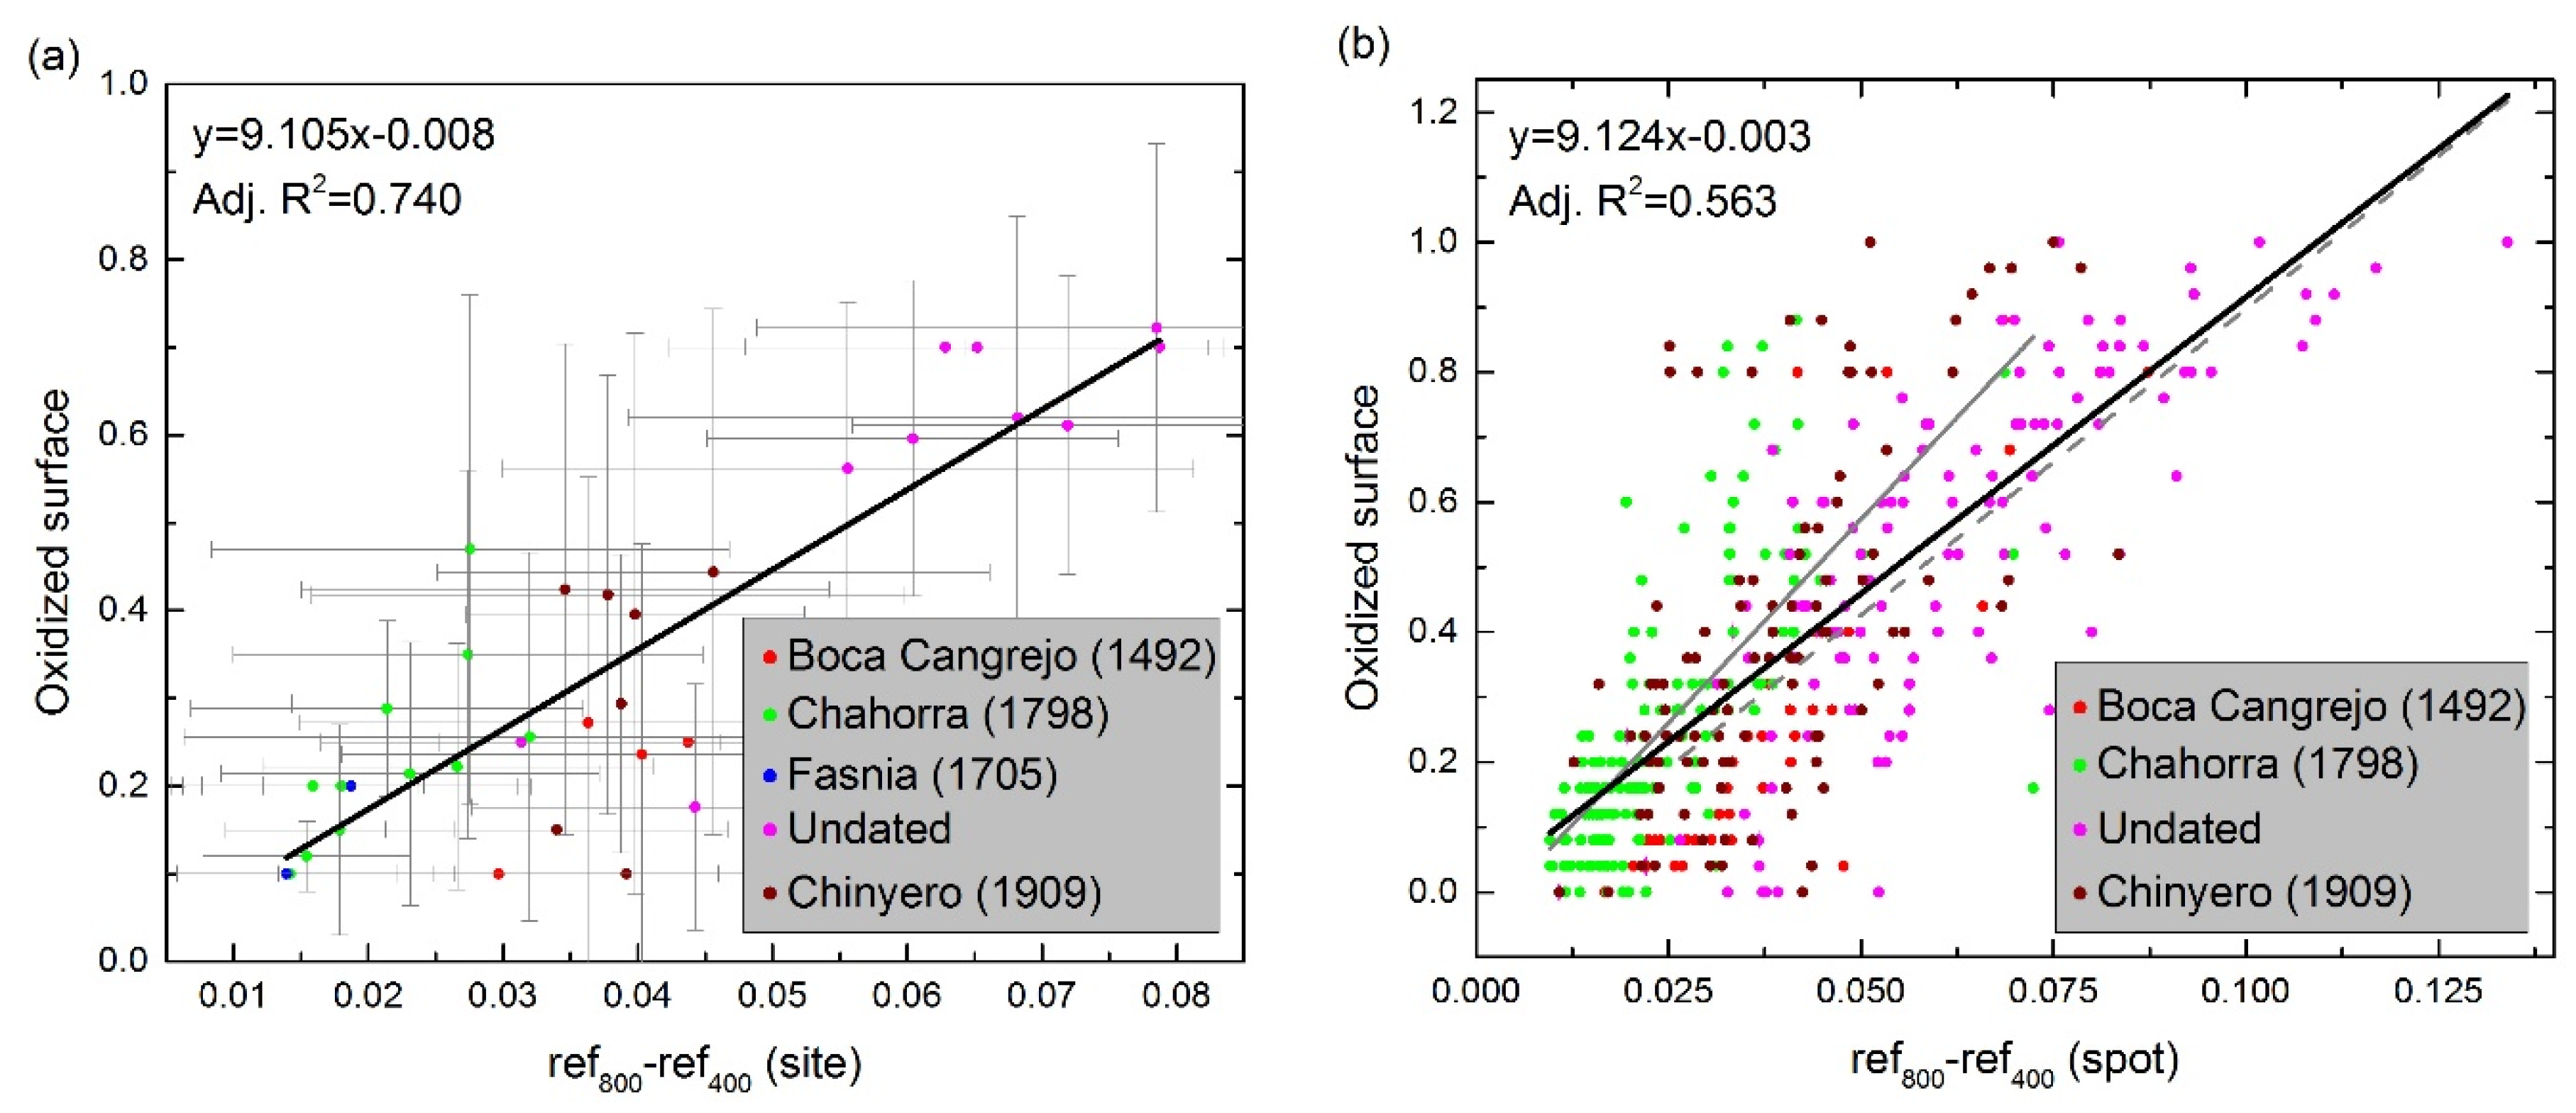
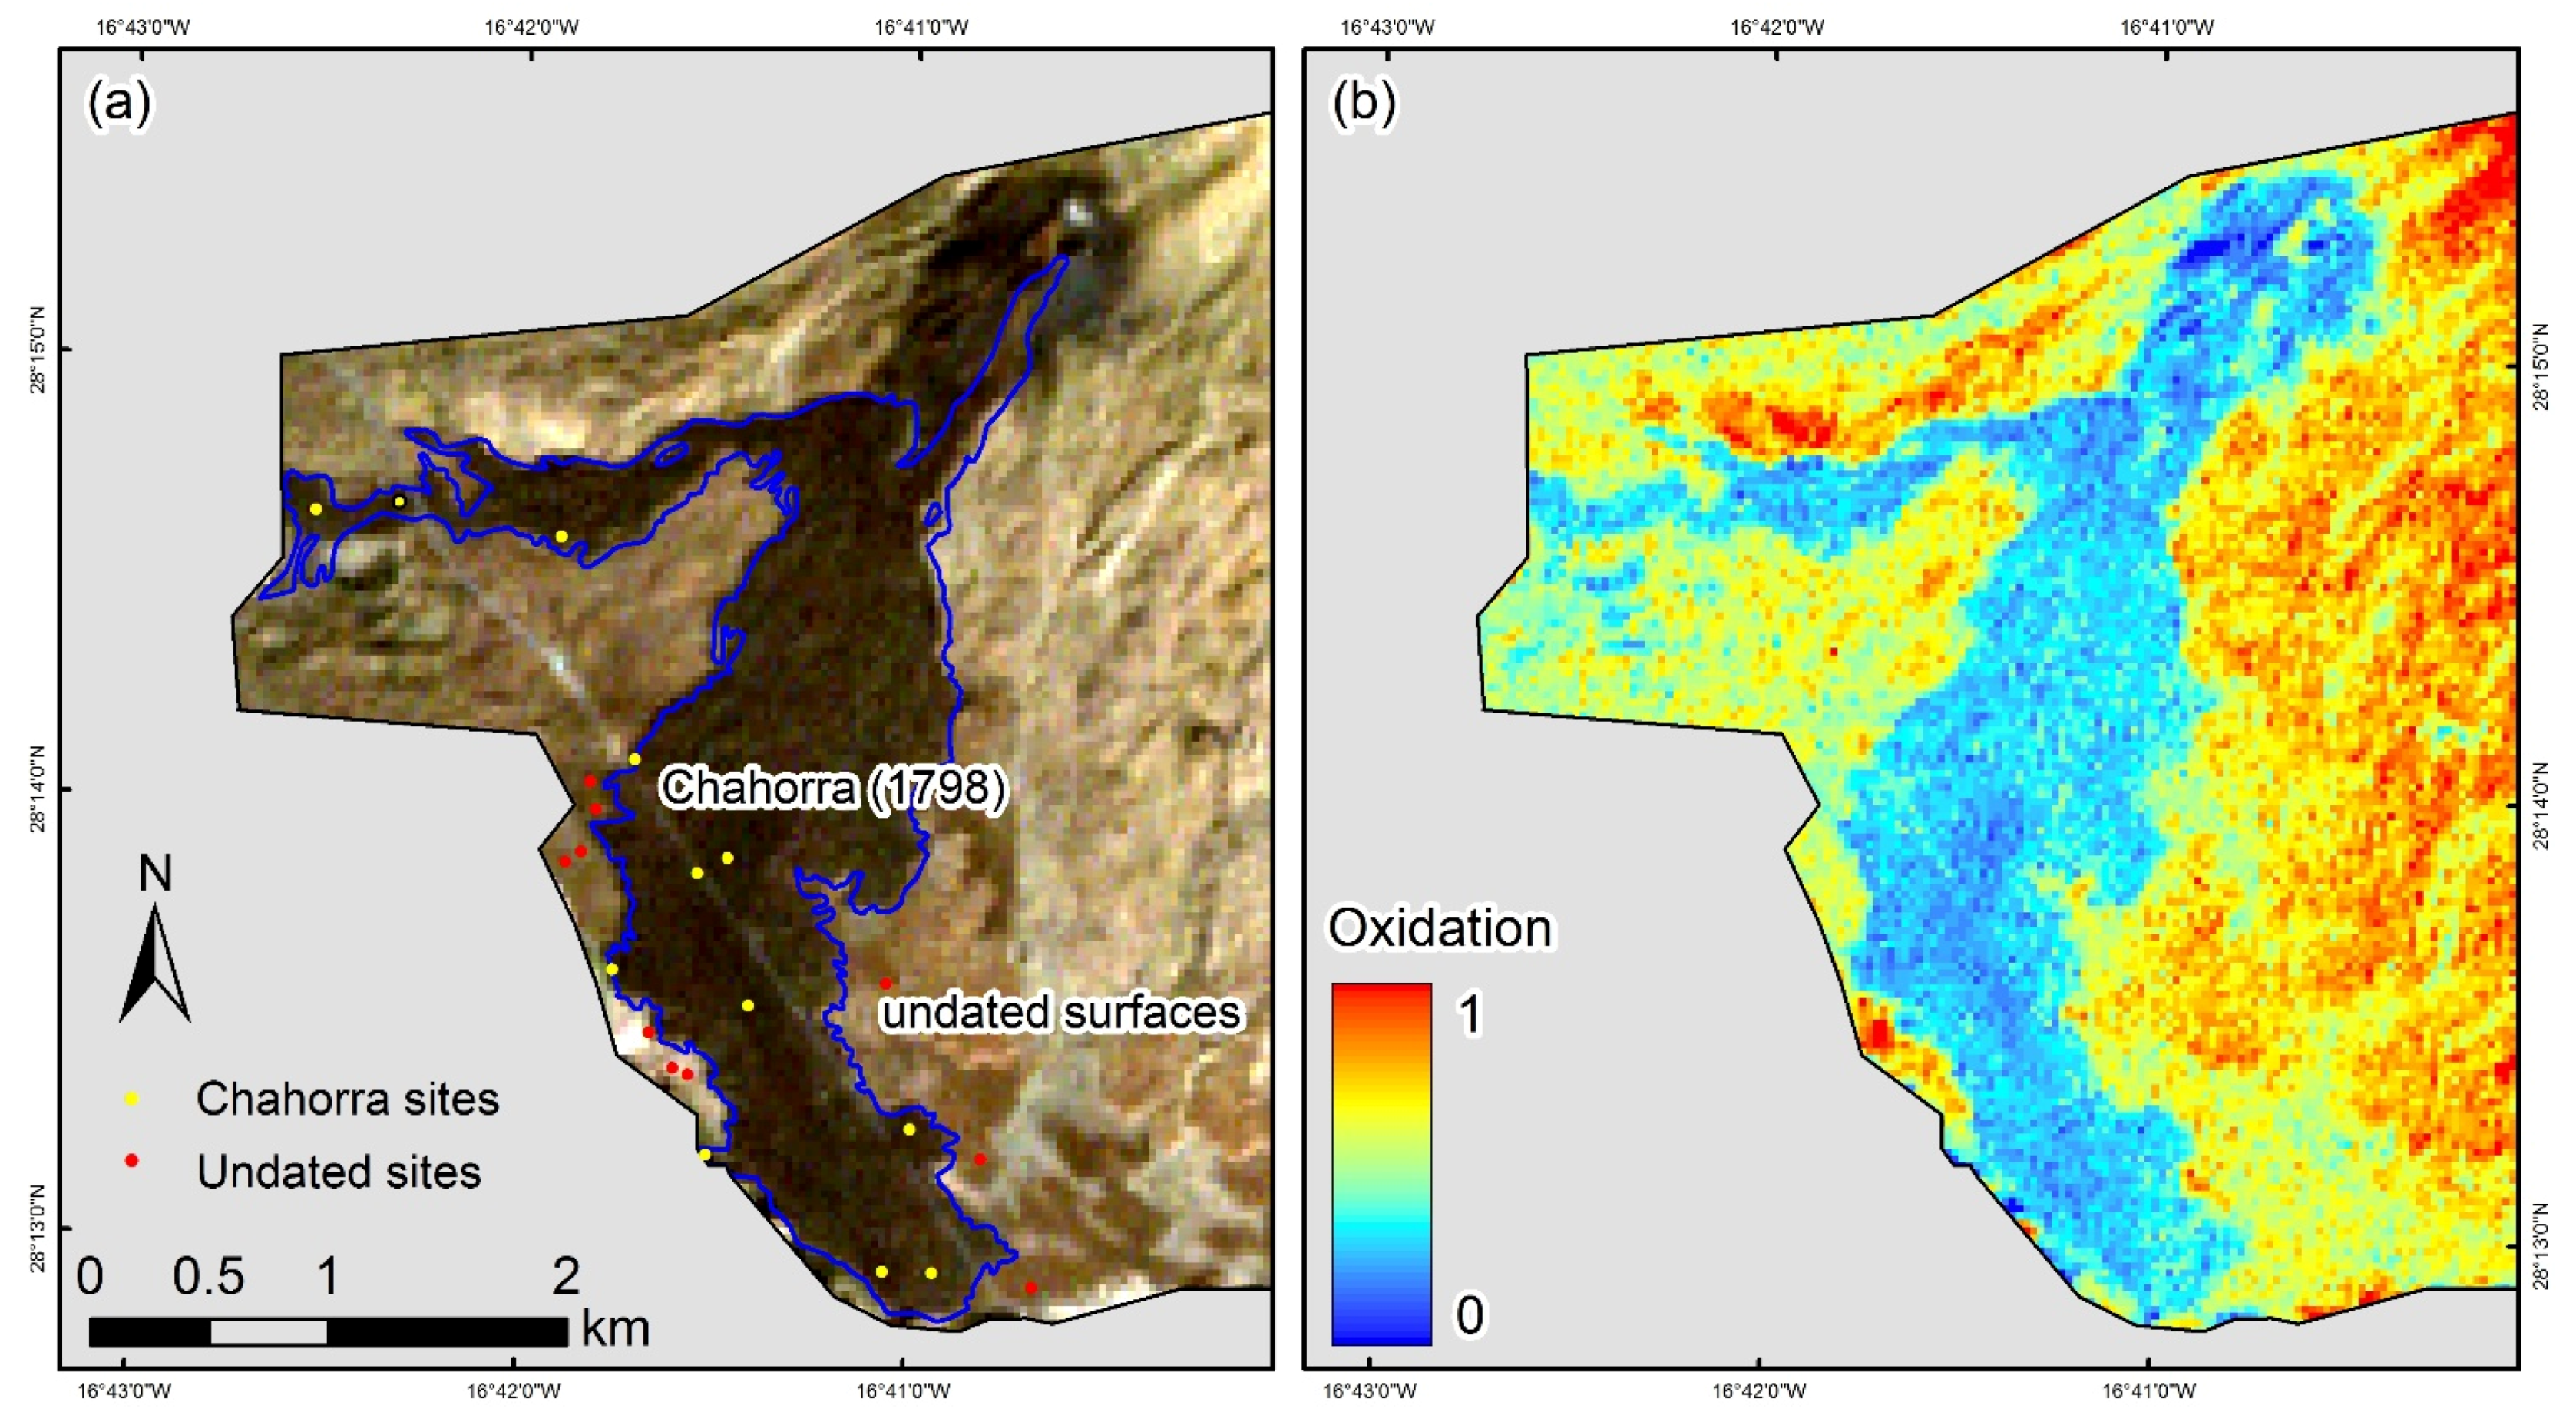
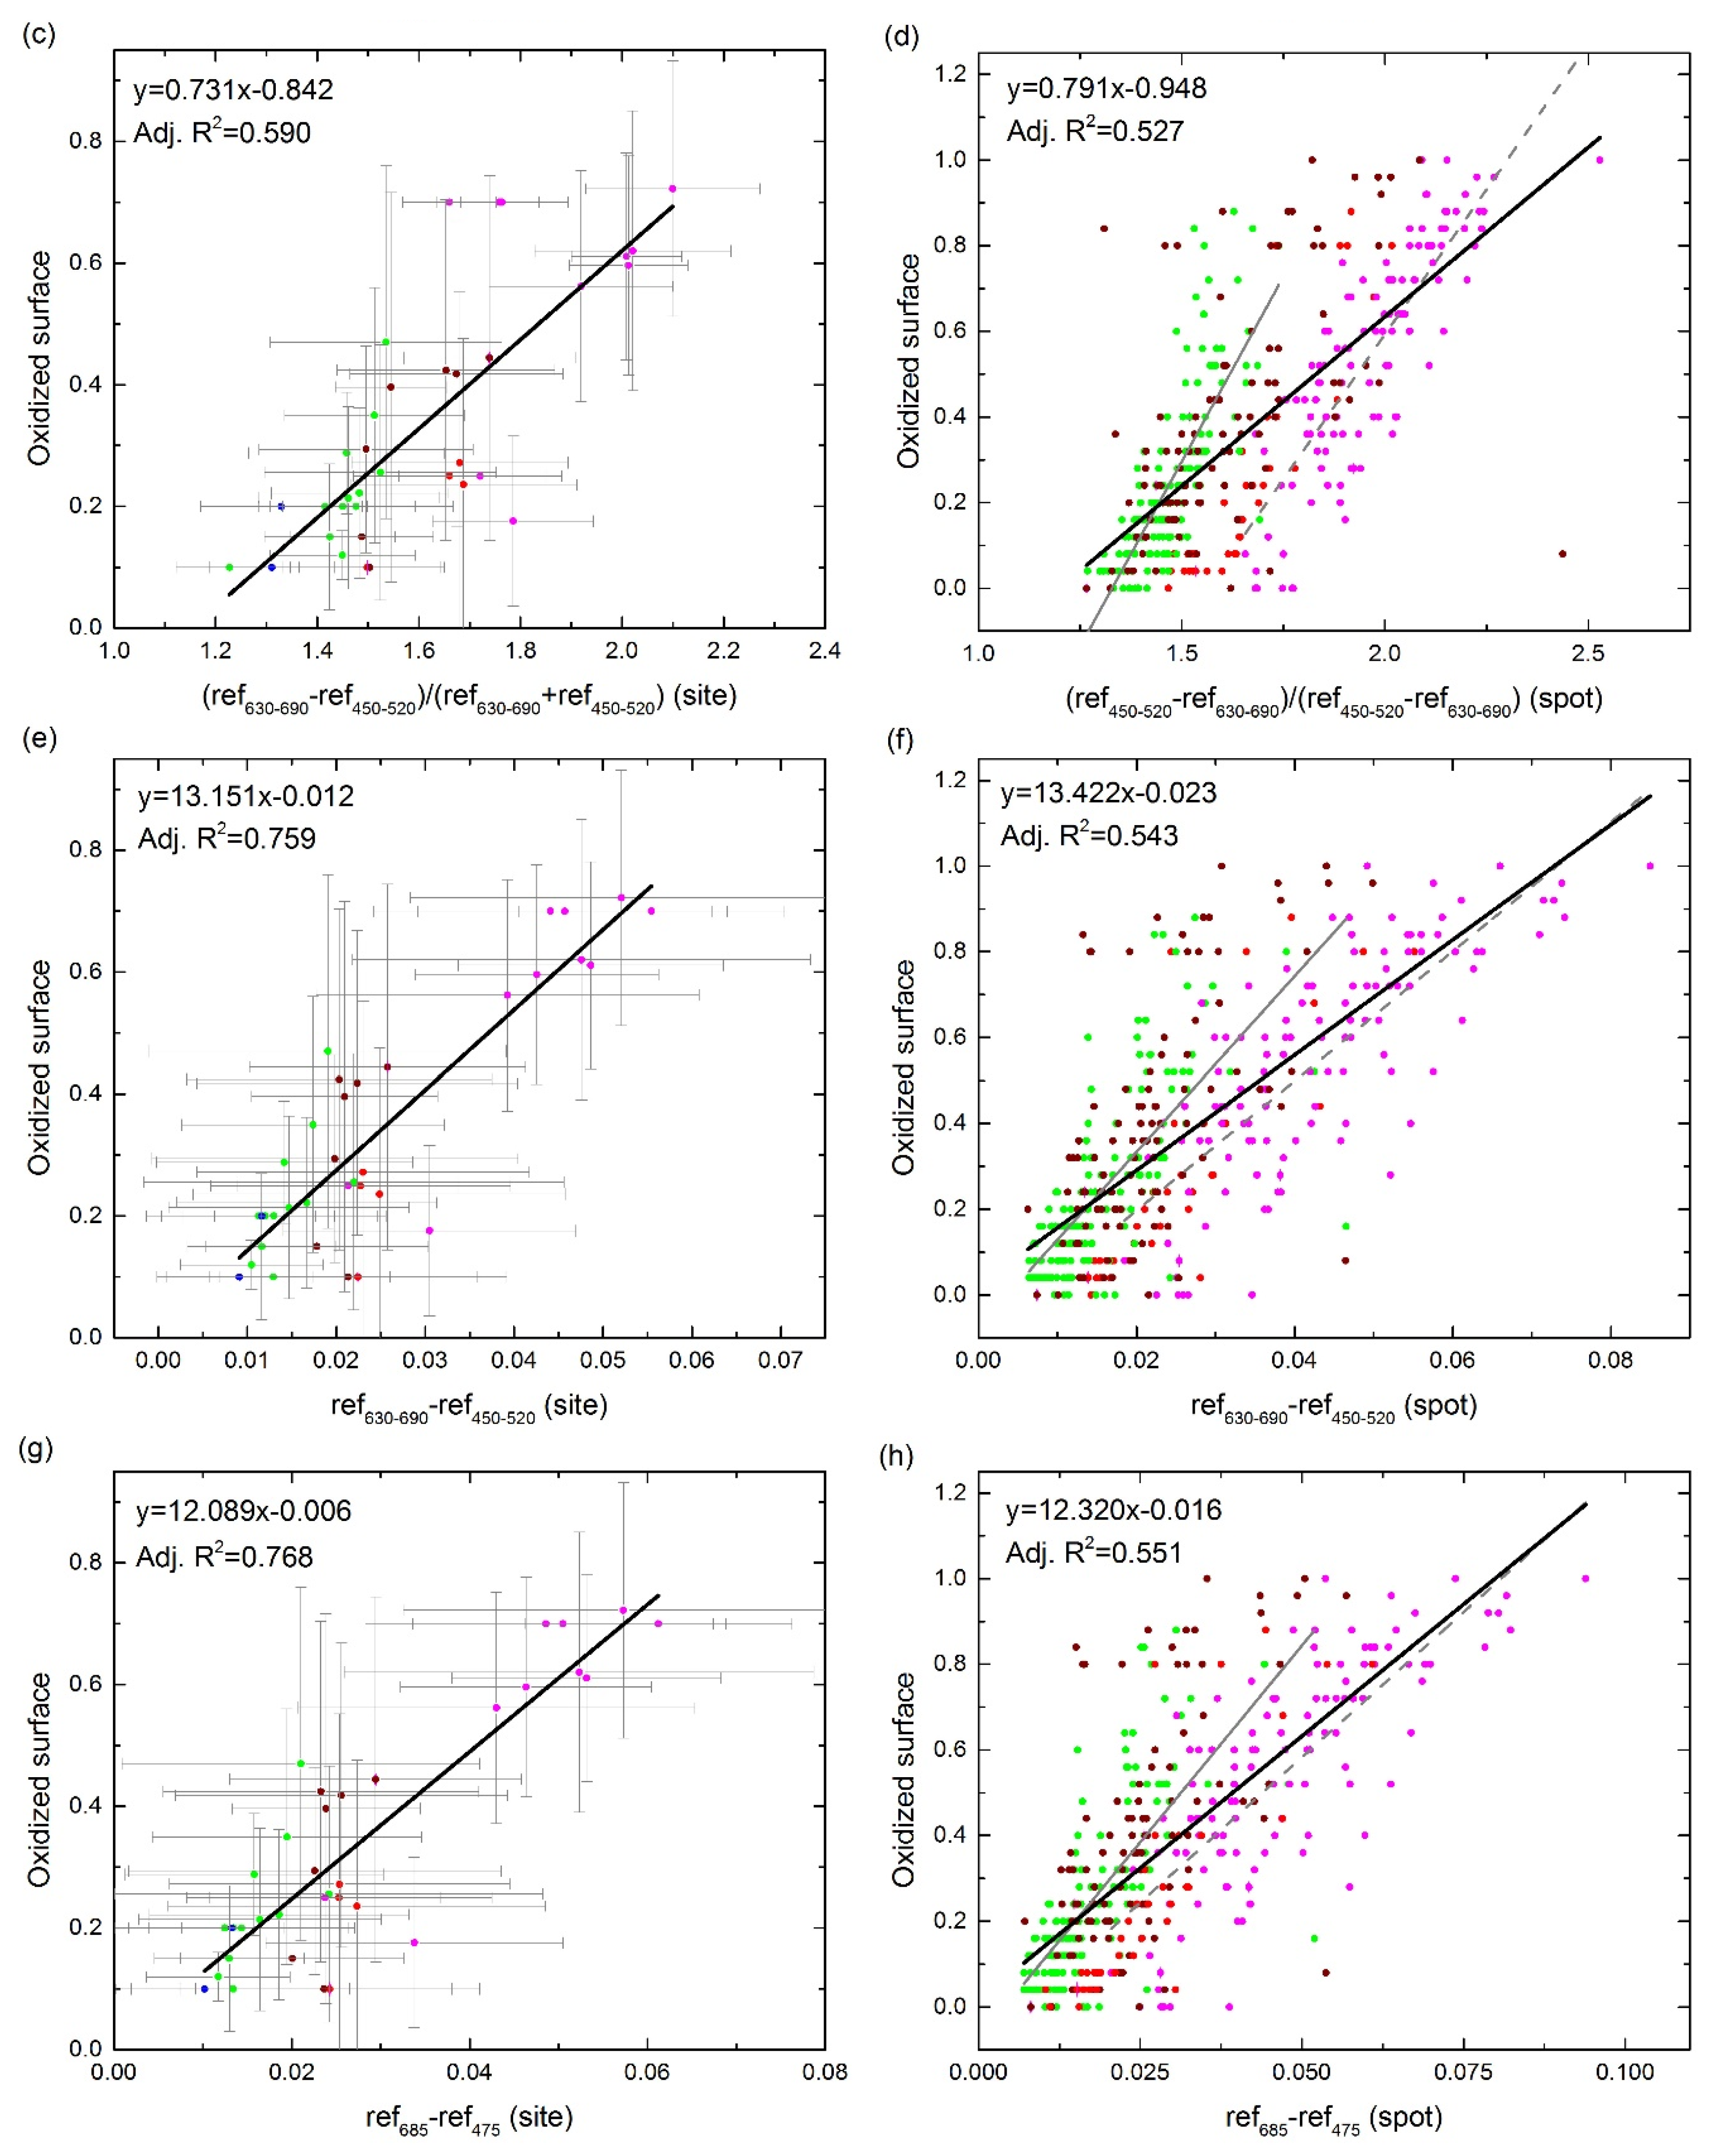
4.3.1. Oxidation

Based on the spectral signatures of oxidized lava surfaces and existing literatures, the following wavelengths and wavelength ranges were used for defining the oxidation indices:
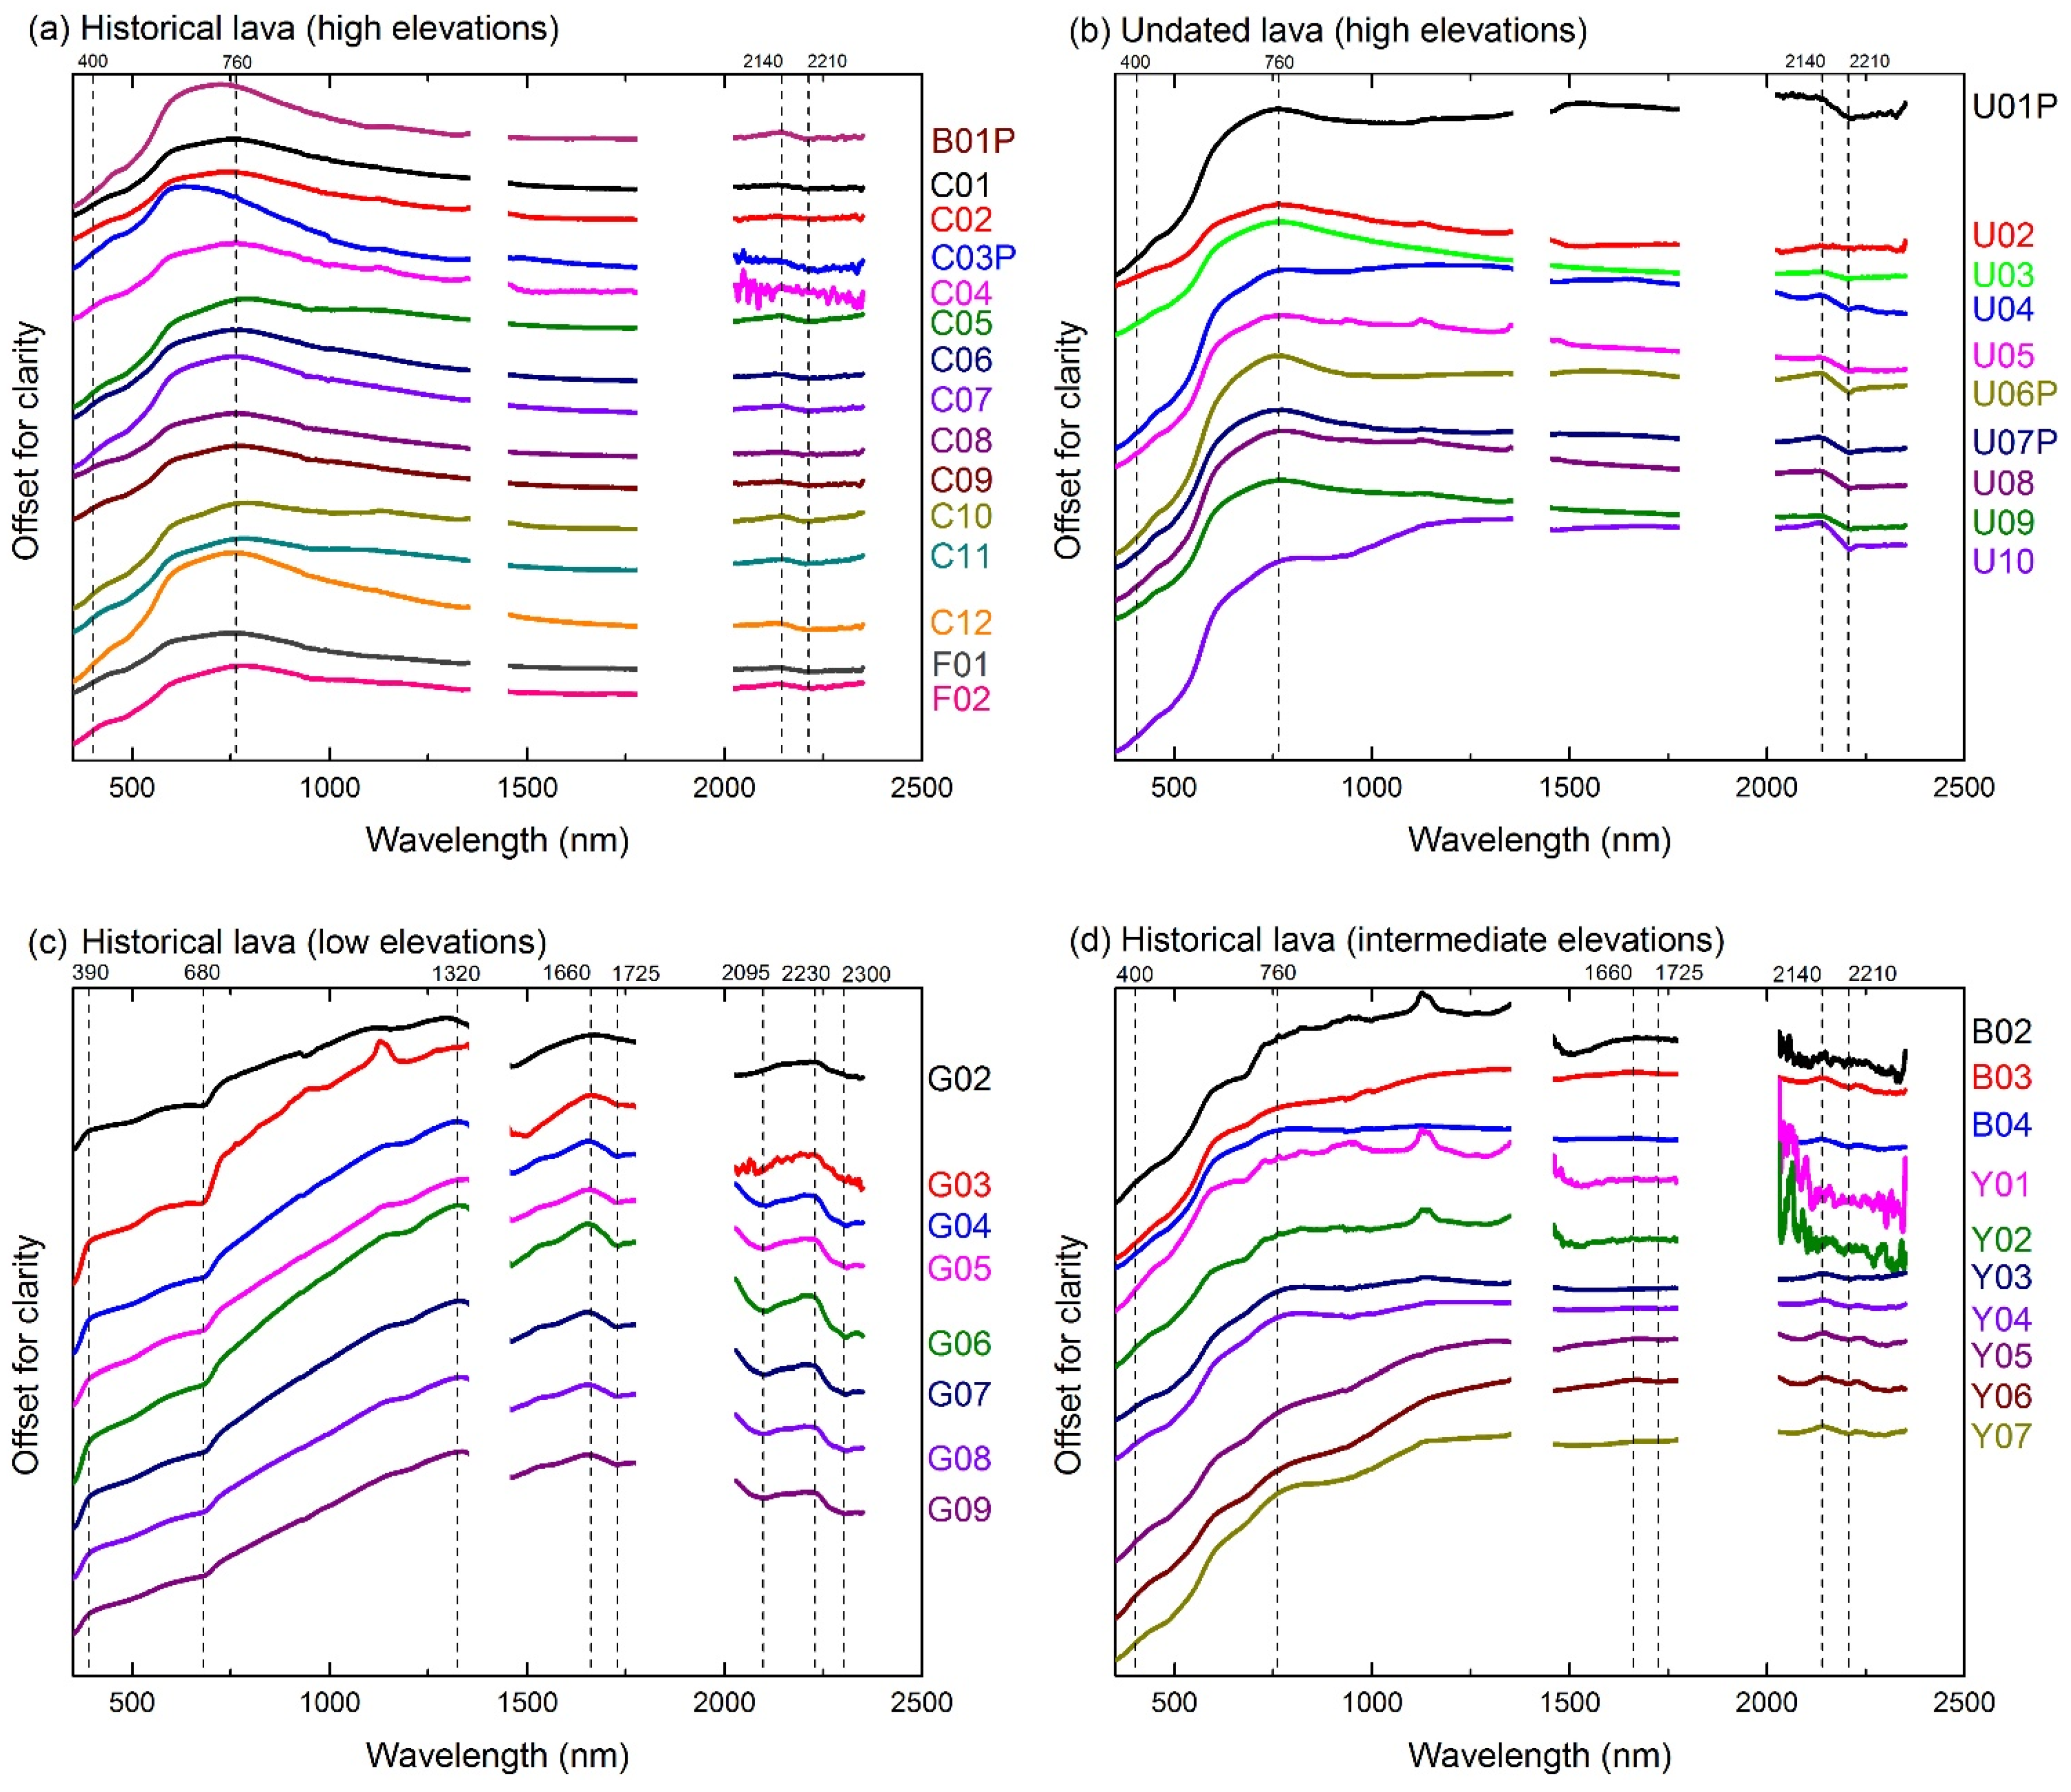
  • The slopes of the reflectance curves between 400 and ~800 nm have been reported to show a systematic increase with the relative ages of lava flows as well as the ferric iron content [15].
  • The ratio of the Landsat red band to blue band has been reported as useful for measuring the red coloration of rocks [56]. We therefore considered the wavelength ranges 450–520 nm and 630–690 nm, corresponding to Landsat band 1 (blue) and band 3 (red), respectively. The central wavelengths (485 nm and 660 nm) of the two ranges were also tested.
  • We also considered the 450–495 nm and 620–750 nm ranges, corresponding to the entire blue and red ranges of the electromagnetic spectrum, respectively, as well as their central wavelengths (475 nm and 680 nm).
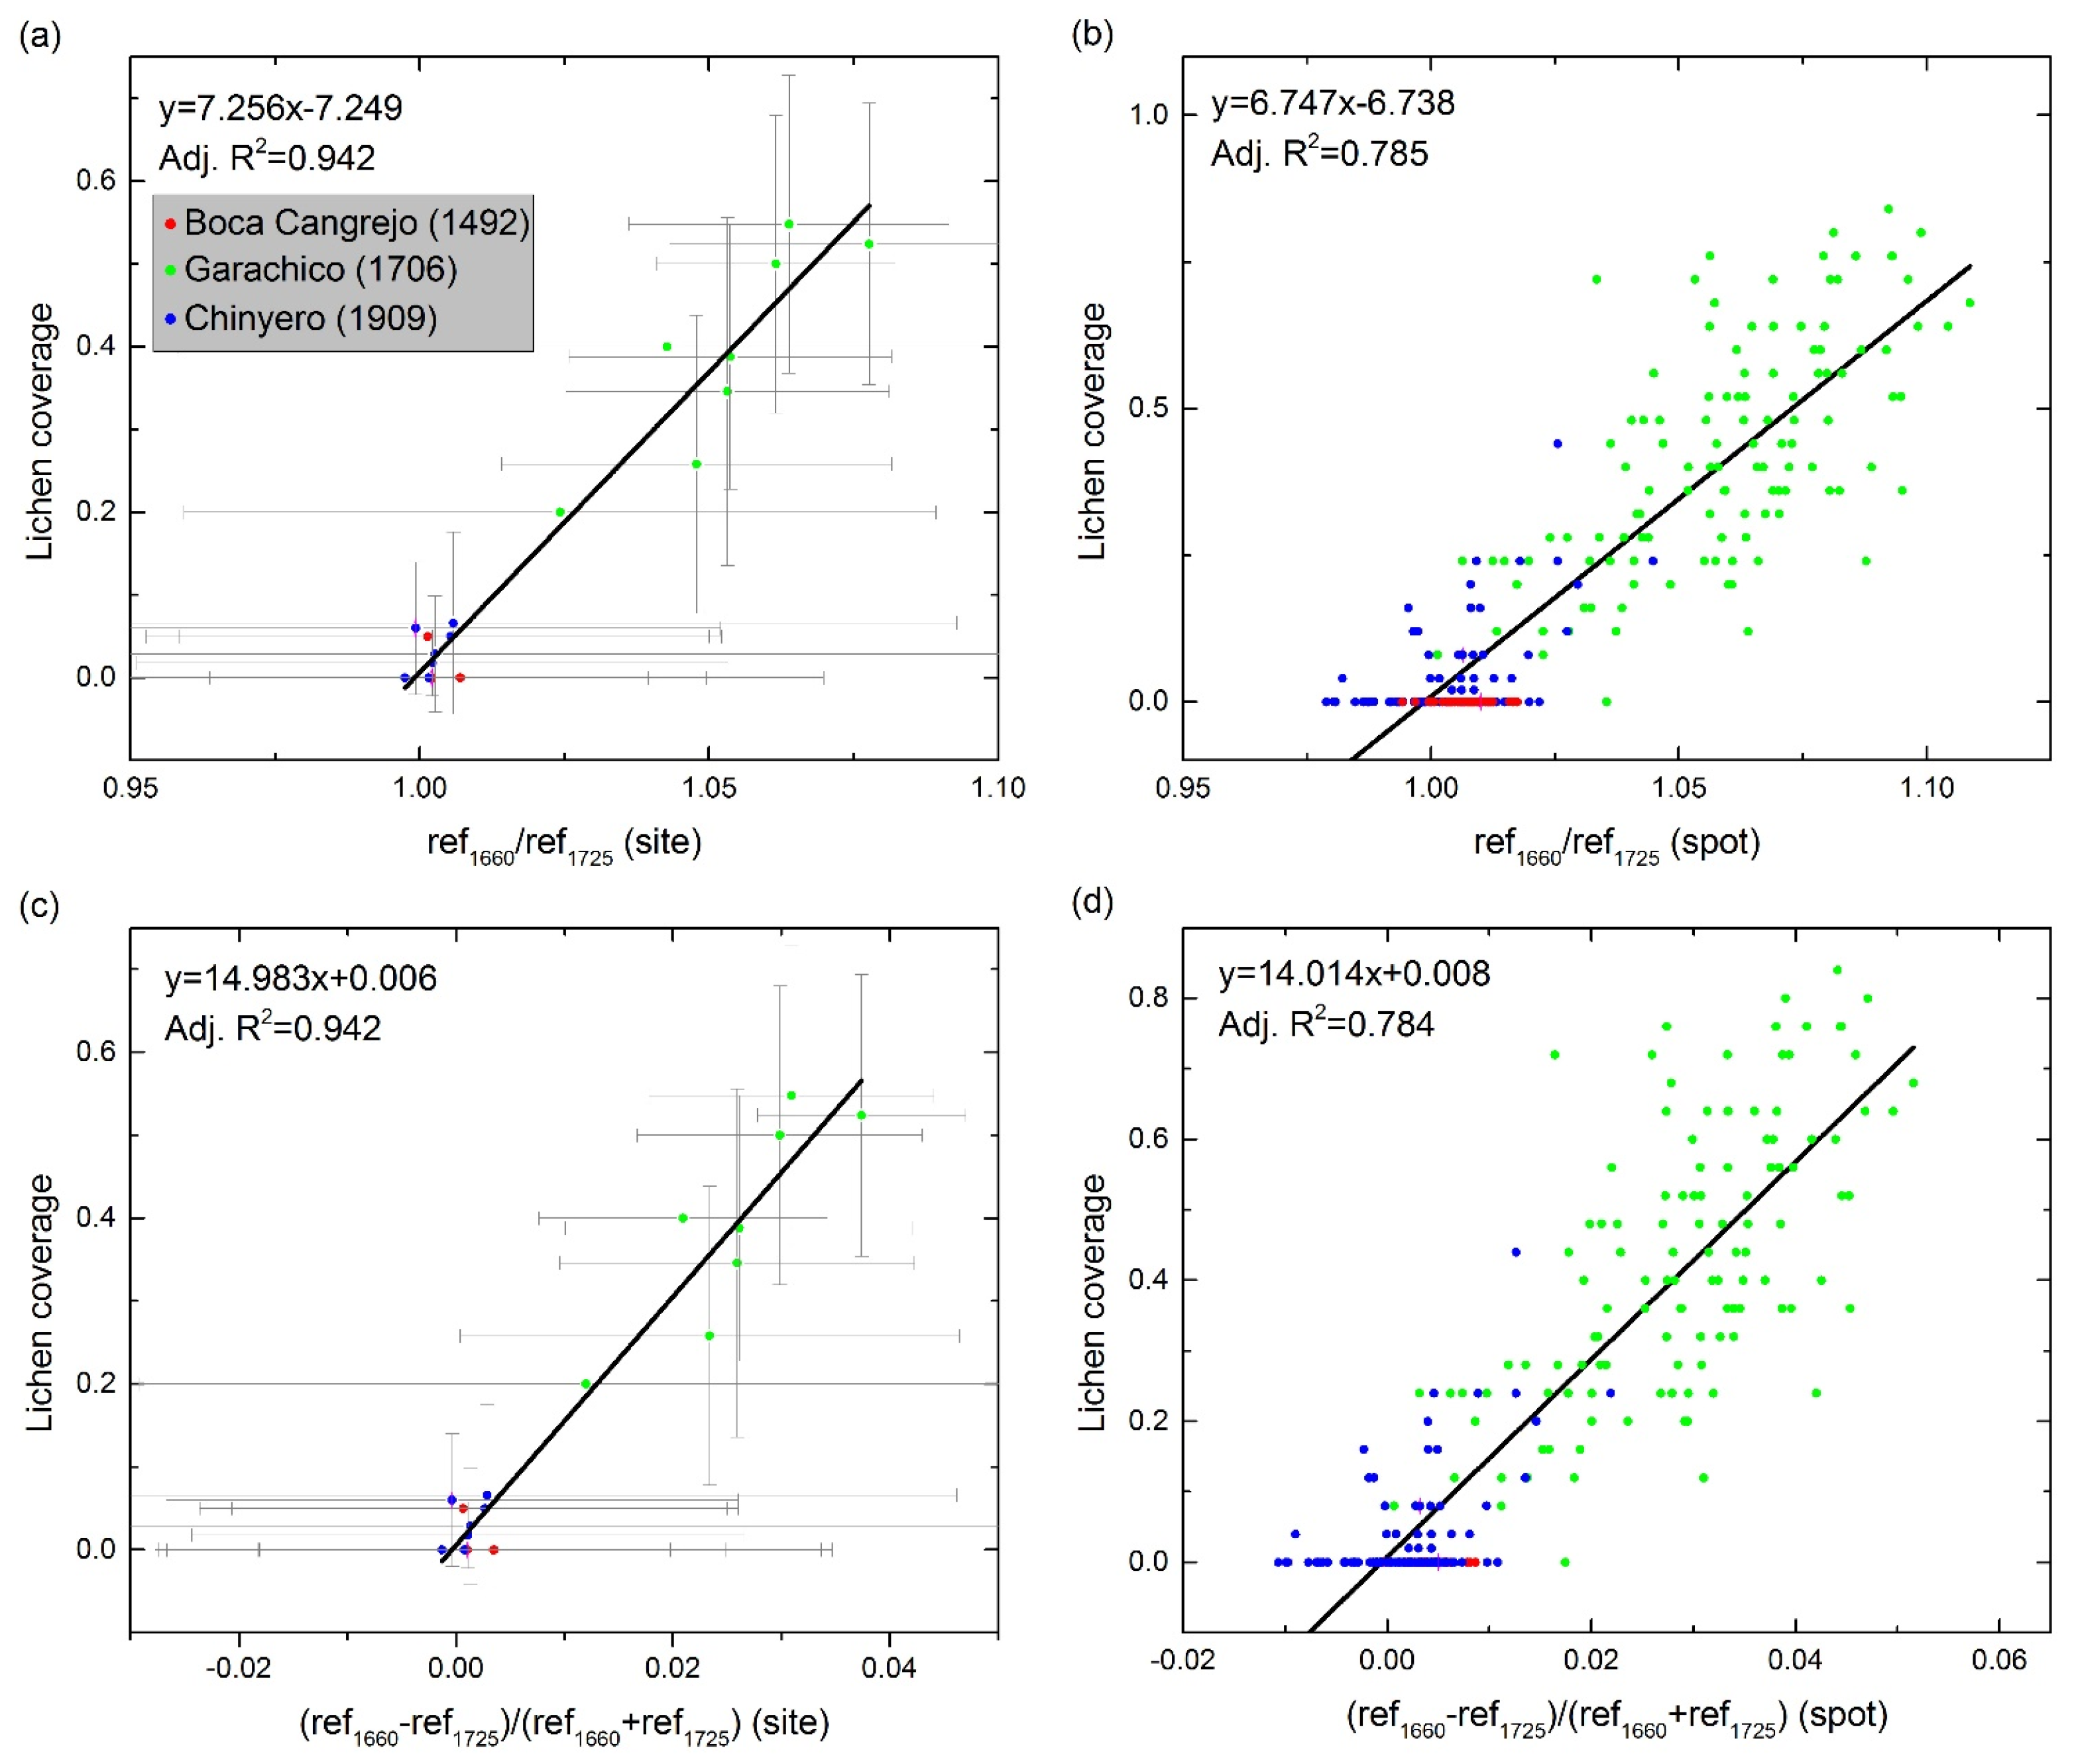
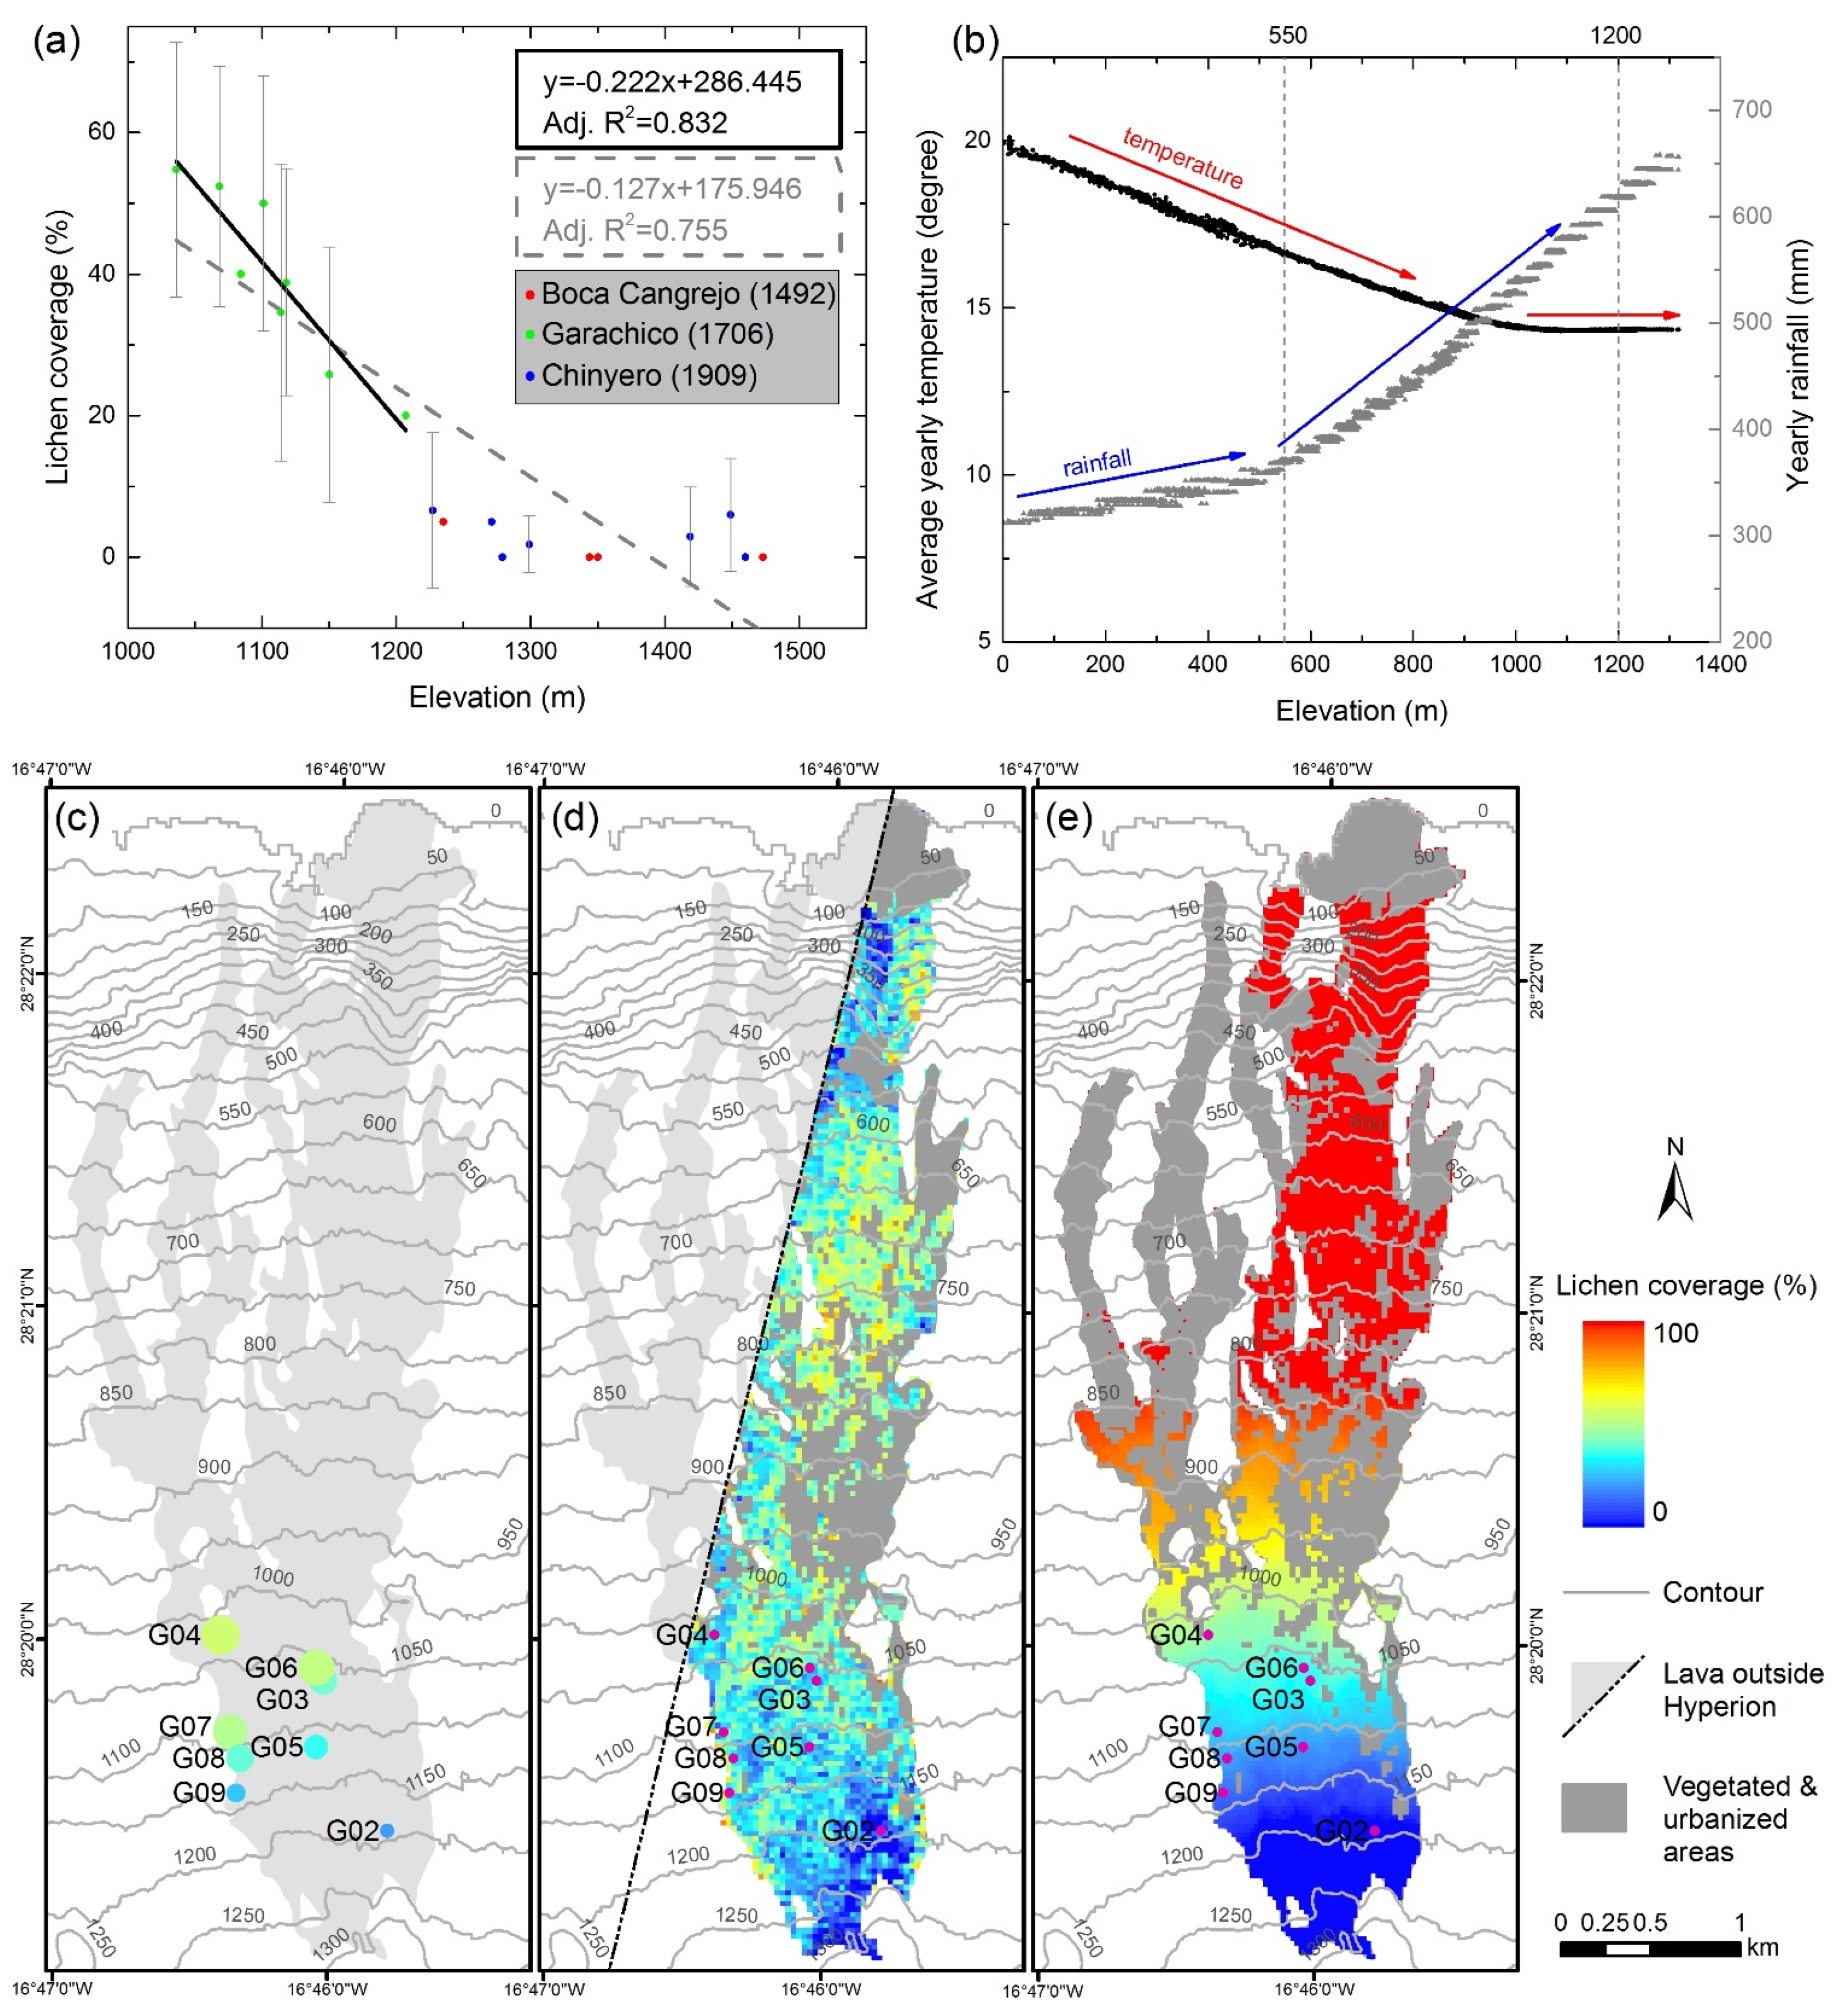
Linear relationships between different types of indices for each of the above wavelength definitions and the observed lava oxidation were analyzed. The sites of the Garachico lava flow were excluded from this analysis, as there is significant lichen coverage. The regression models obtained for the different indices at site and spot scales prove to be similar for the different wavelength definitions, except for 400 nm and 800 nm wavelengths (Figure 6 and Table A2). At the site scale, subtraction oxidation indices have clearly higher adjusted R2 values than ratio and normalized difference indices. For the 450–520 nm and 630–690 nm ranges, equivalent to Landsat bands 1 and 3, there are no differences in whether the entire range or the central wavelength is used for defining the oxidation indices. However, use of the central wavelengths for the 450–495 nm and 620–750 nm ranges, the entire red and blue ranges of the electromagnetic spectrum, slightly improves the adjusted R2 values for all oxidation indices at the site scale. The results show that the subtraction oxidation indices using the 450–520 nm and 630–690 nm ranges (Landsat ETM+), and the central wavelengths of the entire red and blue spectrum best characterize the relationship between spectral signatures of lava surfaces and their surface oxidation. Contrasted trends between the recent (Chahorra and Chinyero) and old flows (Boca Cangrejo and the undated) suggest that that field-based estimates of oxidized surface might be biased by the overall color of the lava surface, leading to overestimation of oxidization for fresh flows and underestimation for older ones.
Figure 6. Relationship between lava surface oxidation estimated in the field and different oxidation indices (see Table A2) at site and spot scales. (a) (ref800−ref400) vs. oxidation at site scale; (b) (ref800−ref400) vs. oxidation at spot scale; (c) ((ref630–690 − ref450–520)/(ref630–690 + ref450–520)) vs. oxidation at site scale; (d) ((ref630–690 − ref450–520)/(ref630–690 + ref450–520)) vs. oxidation at spot scale; (e) (ref630–690 − ref450–520) vs. oxidation at site scale; (f) (ref630–690 − ref450–520) vs. oxidation at spot scale; (g) (ref685 − ref475) vs. oxidation at site scale; (h) (ref685 − ref475) vs. oxidation at spot scale. At site scale (a,c,e and g), data for 35 sites is plotted including lava sites measured on Boca Cangrejo, Chahorra, Chinyero, Fasnia and undated lava flows in 2013 and 2014; at spot scale (b,d,f and h), there are 415 spots belonging to the sites measured on Boca Cangrejo, Chahorra, Chinyero and undated lava flows in 2014. Only sites and spots with no or limited lichen coverage were used to constrain the relationships. Standard deviations were calculated for the field oxidation observations and spectral indices for each site. The solid line and dashed line at different slopes represent the trend lines for the young and old lava sites, respectively.
Remotesensing 07 15864 g006aRemotesensing 07 15864 g006b

4.3.2. Lichen Cover

Based on data for the lava sites of Garachico, Boca Cangrejo and Chinyero where lichens were observed, several spectral indices were tested to estimate lichen coverage at both site and spot scales. The focus is on the spectral features of lichen-covered surfaces discussed above, in particular the increase from 680 nm to 1320 nm and the decreases from 1660 nm to 1725 nm and from 2230 nm to 2300 nm. The relationships between the subtraction, ratio and normalized difference indices using the specific wavelengths and the measured lichen coverage were found to be mostly linear except for the ratio and normalized difference indices using 680 nm and 1320 nm (Figure 7 and Table A3). Results show that indices using 1660 nm and 1725 nm are in general better than those using the other wavelengths. Although the indices using 2230 nm and 2300 nm have a very strong correlation with the lichen coverage, their capacity is overshadowed by the use of wavelengths in the SWIR region which is easily affected by atmospheric conditions. More interestingly, there are no differences between the ratio and normalized difference indices using 1660 nm and 1725 nm. As normalization helps to minimize the effects of variable irradiance (illumination) levels and to limit the index values from −1 to 1 [57,58], we considered that the normalized difference index using 1660 nm and 1725 nm is better in characterizing the relationship between spectral signatures of lava surfaces and their surface lichen coverage.
Figure 7. Relationship between lichen coverage observed in the field and the proposed lichen indices at site and spot scales. (a) (ref1660/ref1725) vs. lichen coverage at site scale; (b) (ref1660/ref1725) vs. lichen coverage at spot scale; (c) ((ref1660 − ref1725)/(ref1660 + ref1725)) vs. lichen coverage at site scale; (d) ((ref1660 − ref1725)/(ref1660 + ref1725)) vs. lichen coverage at spot scale. The site scale graphs include the 19 lava sites measured on the Garachico, Boca Cangrejo and Chinyero lava flows in 2013 and 2014, and the spot graph includes 260 spots belonging to the sites measured in 2014 only. Standard deviations for lichen coverage and spectral indices were calculated based on the measurements at the spot scale for each site. In order to enhance the visibility, one tenth of the standard deviations were shown for the spectral indices. The large variations for the spectral indices are because 1660 nm and 1725 nm are in the SWIR range that is easily affected by atmospheric conditions and errors propagate through multiple mathematical operations.
Remotesensing 07 15864 g007

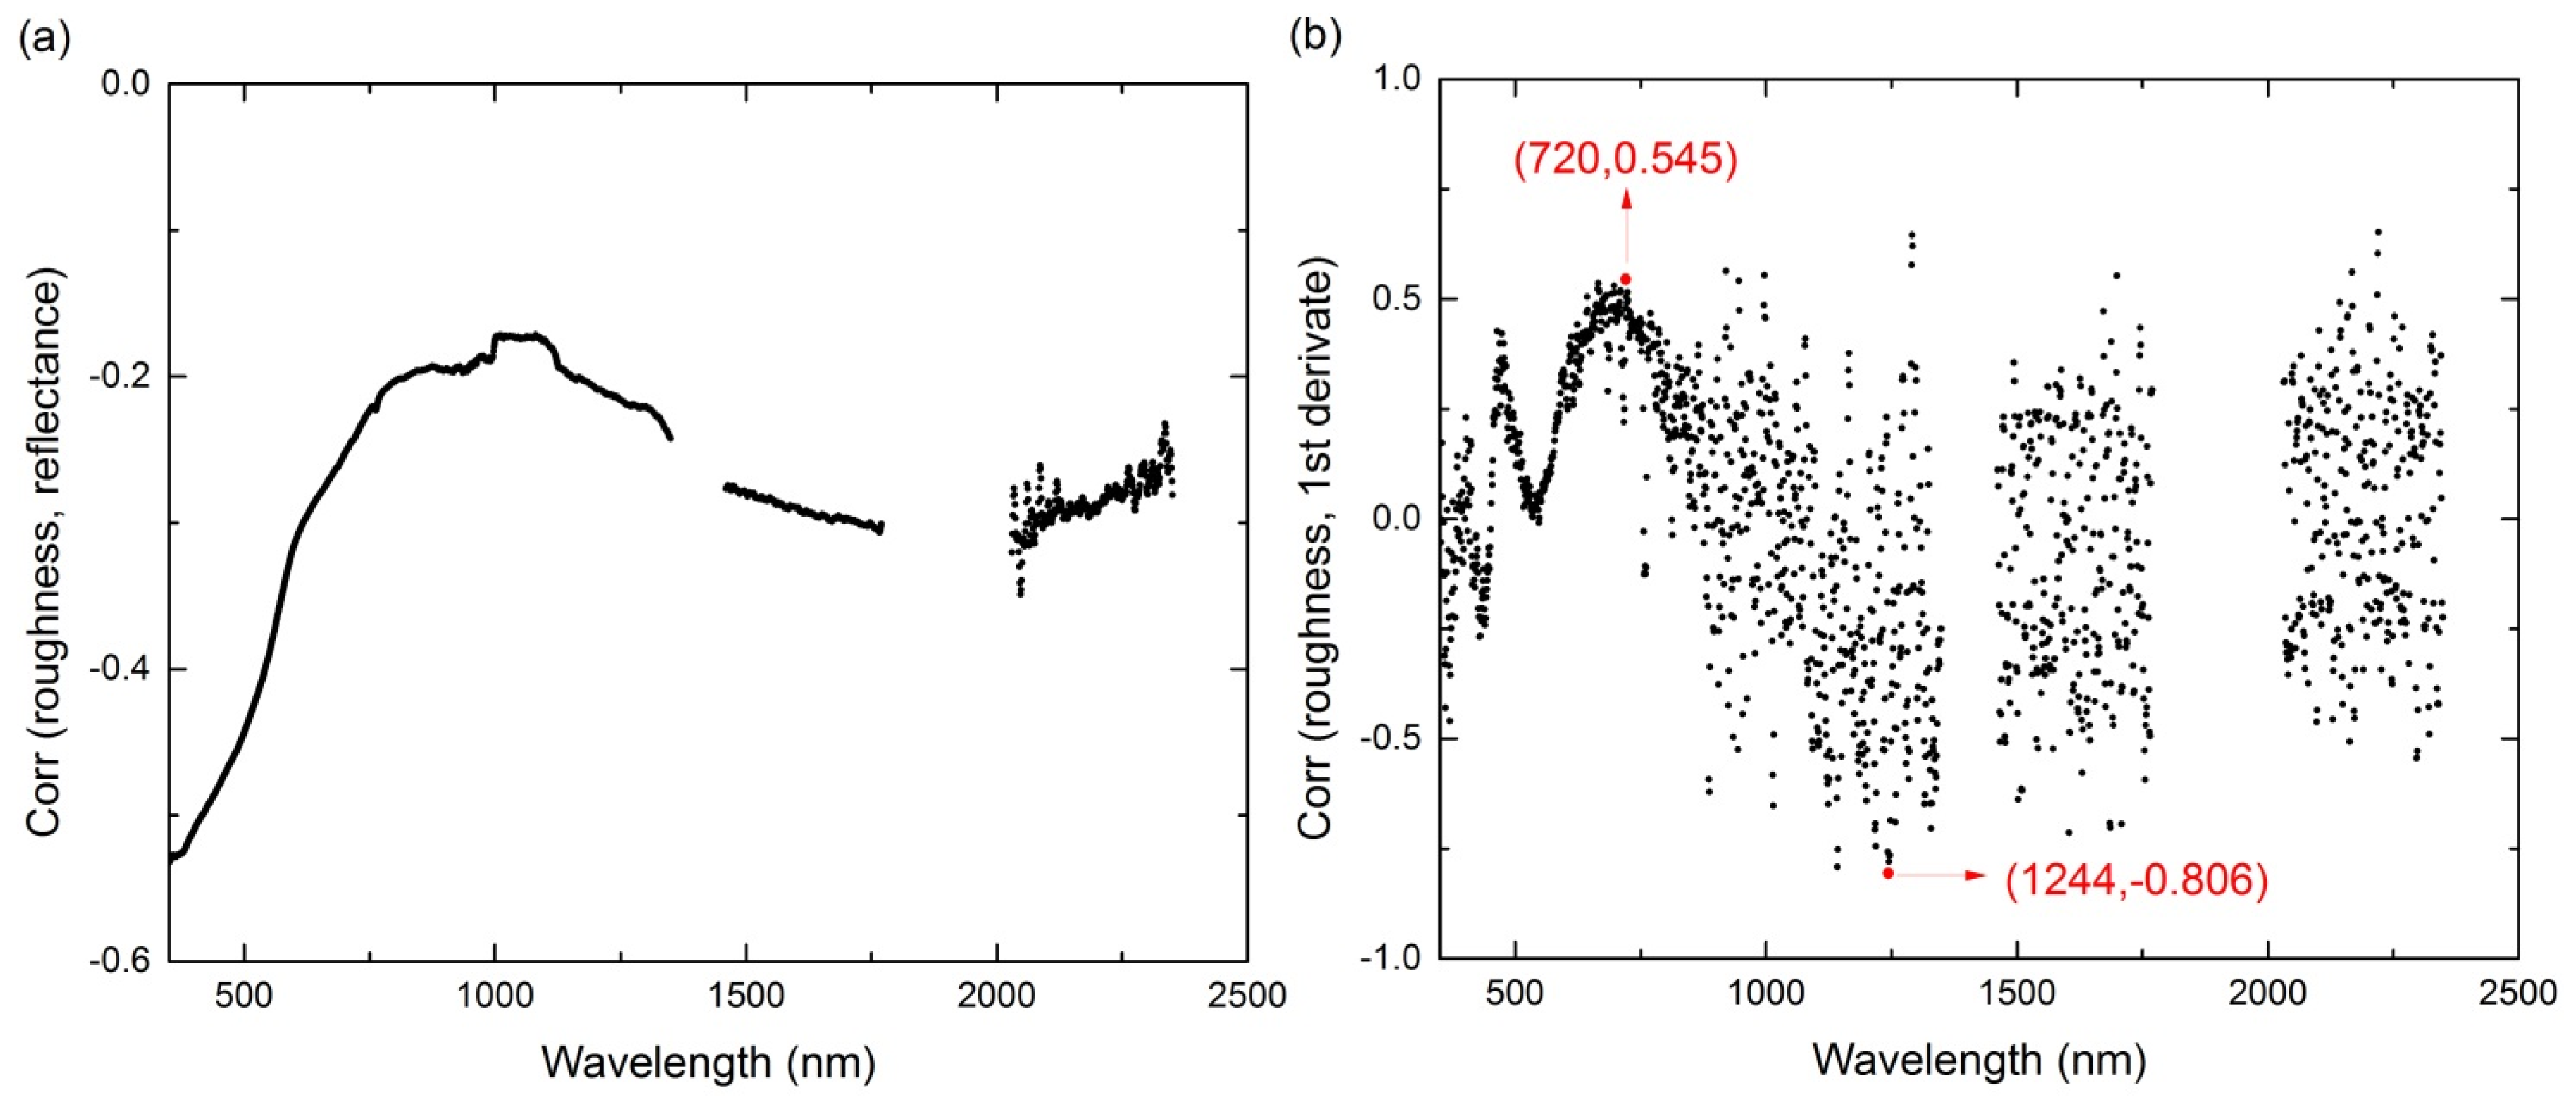
4.4. Effect of Surface Roughness

To understand how surface roughness can be related to reflectance, we focused on the correlation between the roughness index with both the reflectance and the first derivate of reflectance at each wavelength (Figure 8). Only sites of the Chahorra lava flow which are characterized by limited surface oxidation and absence of lichen were considered for this analysis. Correlation between roughness and reflectance is generally low for all wavelengths, particularly in the NIR and SWIR regions, with higher negative correlations (<−0.5) observed for wavelengths < 500 nm, i.e., the violet and blue of the visible region. When considering roughness and the first derivative of reflectance, we observe that the correlation coefficient varies strongly with wavelengths (Figure 8b), yet for some parts of the spectrum high correlations are obtained. The highest negative correlation of −0.806 occurs at 1244 nm and it implies that a flatter reflectance curve at 1244 nm is indicative of a smoother surface, while a steeper decrease in reflectance in this spectral range is associated with rougher lava surfaces. The correlation values in the SWIR are however highly variable, suggesting a low reliability of this estimate. On the other hand, a lower, but consistent, positive correlation is obtained between the roughness index and the first derivate of the spectra at the red to NIR transition (~720 nm).
Figure 8. (a) Correlation between surface roughness and reflectance at each wavelength; (b) Correlation between surface roughness and the first derivate of reflectance at each wavelength.
Remotesensing 07 15864 g008

5. Interpretation and Discussion

Understanding the spectral behaviors of different volcanic terrains could help to contrast and map different volcanic products using satellite imagery [21,24]. With the spectra of lava and vegetation endmembers, spectral unmixing has previously been used to map lava surfaces of different ages and vegetation colonization [20]. A thematic map of tephra distribution of Mt. Etna was created by combining the Hyperion spectra and field spectra of tephra [21]. Another potential application of spectral data would be relatively dating lava flows, which requires taking more factors (e.g., oxidation, vegetation, lichen cover) into account in the modelling. Although such applications fall beyond the scope of our current contribution, highlighting the contrasted spectral features of these different volcanic surfaces is a first step towards this improved mapping of volcanic terrains.

5.1. Interpretation of Lava Spectral Curves

In general, Tenerife’s lavas show the typical spectra of basalt (see C11 & U03 vs. basalt in Figure 9). Lava flows with no lichen but subjected to different levels of surface oxidation (the high elevation group) show a spectral reflection feature centered at 760 nm, which was previously identified at 800 nm for Hawaiian lava flows [15]. The general increase in the visible range can be attributed to the charge transfer effects in ferric ion (Fe3+) ([15,59]; Figure 9). The three absorption features in the VNIR range of hematite, centered at 530 nm, 630 nm and 880 nm [60,61,62], are weakly expressed in Tenerife lavas (Figure 9). The declining reflectance in the range beyond 760 nm is explained by ferrous iron (Fe2+) electronic effects. The weak absorption feature around 2210 nm, which was also tested for its association with the observed surface oxidation, is likely owing to formation of clay [15].
Figure 9. Comparison between field-derived spectra for Tenerife lavas with lab-measurement of samples for basalt, hematite and lichen. The basalt (igneous-mafic-fine-basal2) and hematite (oxide-none-coarse-o01a) spectra are obtained from the ASTER spectral library [63]. The lichen spectrum shows typical spectral features of Stereocaulon [33]. Spectral features for lichen and lavas, and for hematite, are indicated by dashed lines and arrows, respectively.
Remotesensing 07 15864 g009
When comparing lava flows of different ages, we observed that for older undated flows there is a higher reflectance at 760 nm and also a steeper ascending gradient from 400 nm to 760 nm (Figure 1a and Figure 4a,b,f). This agrees well with the observation made of the seven Hawaiian ʻaʻā lava flows of various age groups [15]. In addition, the decrease from 2130–2150 nm to 2200–2220 nm is much stronger for the undated flows than for the Chahorra flow (erupted in 1798), which might be explained by accumulation of clay on the lava surfaces over time.
The lava surfaces which are characterized by significant lichen coverage (the low elevation sites, Figure 4c) have a spectral reflectance that is strongly influenced by the lichen (Figure 9). Published lichen reflectance datasets highlight minimum values at 660–675 nm (agreeing with chlorophyll absorption maxima at 642 nm and 662 nm), 1160–1200 nm (probably because of absorption by water) and 2065–2110 nm (probably due to absorption by cellulose), and maximum values at 1265–1385 nm, 1655–1675 nm and 2230–2250 nm (e.g., [33]; Figure 9), as observed for the Garachico lavas. In addition, the 1720–1730 nm absorption in our lichen-covered lava spectra (likely because of the presence of cellulose) agrees with the minimum at 1720 nm for lichen-affected rock spectra [32] and at 1730–1790 nm measured for lichen spectra [33], in spite of a slight shift to the left of the latter (Figure 9). The absorption at 2300–2315 nm is characteristic of some lichen species [33] or might be explained by the presence of clay minerals containing magnesium hydroxide (Mg(OH)2) [64].
Lavas of the intermediate elevation sites (Figure 4d) seem to be characterized by spectral features found at both high and low elevation lava sites. They show a maximum reflectance at about 760 nm and a decrease from 2140 nm to 2210 nm, like reflectance recorded at high elevation sites, and an increase in the NIR range, which was also observed in the low elevation sites. Accordingly, we may conclude that: (1) lava spectra at high elevations are mainly affected by chemical weathering; (2) lava spectra at low elevations are mostly controlled by lichen and its associated biological weathering; and (3) lava spectra at intermediate elevations are jointly influenced by both effects.
Tephra (Figure 4e) measured on Tenerife range from 3 mm to 10 mm in diameter and from dark grey to black in color. Reflectances of the tephra surfaces are low and the recorded spectra are flat, which are similar to those described for the tephra on Mt. Etna [21]. These featureless spectra are significantly different from the lava surfaces measured on Tenerife.

5.2. Comparison with Spaceborn Sensor Data

Comparison between Tenerife’s field and Hyperion spectra shows that the differences of tephra spectra are more prominent than that of lava spectra, agreeing with the findings in the study of Mt. Etna [21]. Our results, showing larger reflectance gaps in the SWIR region than in the visible part of the spectrum, confirm the report of much higher errors in the Hyperion SWIR range as compared to its visible range [24]. This is attributed to the fact that photons at longer wavelengths carry less energy than at shorter wavelengths, and thus more likely suffer from atmospheric disturbance. In addition, the Hyperion sensor has low SNRs (VNIR SNR < 200 and SWIR SNR < 100): it is thus more difficult to acquire spectral information of low reflectance materials [24,65], such as lava in volcanic terrains. Furthermore, the occurrence of negative reflectance values for wavelengths shorter than 500 nm after atmospheric correction also reduces the applicability of some of the proposed spectral indices. In spite of these shortcomings, the Hyperion spectra still present well-marked spectral features that are similar to what is observed in the field spectral data. This allows differentiating volcanic surfaces, e.g., lapillus from lava, and oxidized lava from lichen-covered lava.

5.3. Effect of Weathering

The spectral evolution of lava flow surfaces associated with iron oxidation or lichen cover is reflected by contrasted features in the spectra of lavas at different wavelengths (Figure 3 and Table A1). These spectral features are dependent not only on time but also on climate factors controlling the type and rate of alteration. Quantitative analysis was performed on remote sensing and ground-based data to establish the link between field-observed surface alterations and spectral features, which could be used to characterize lava surfaces.

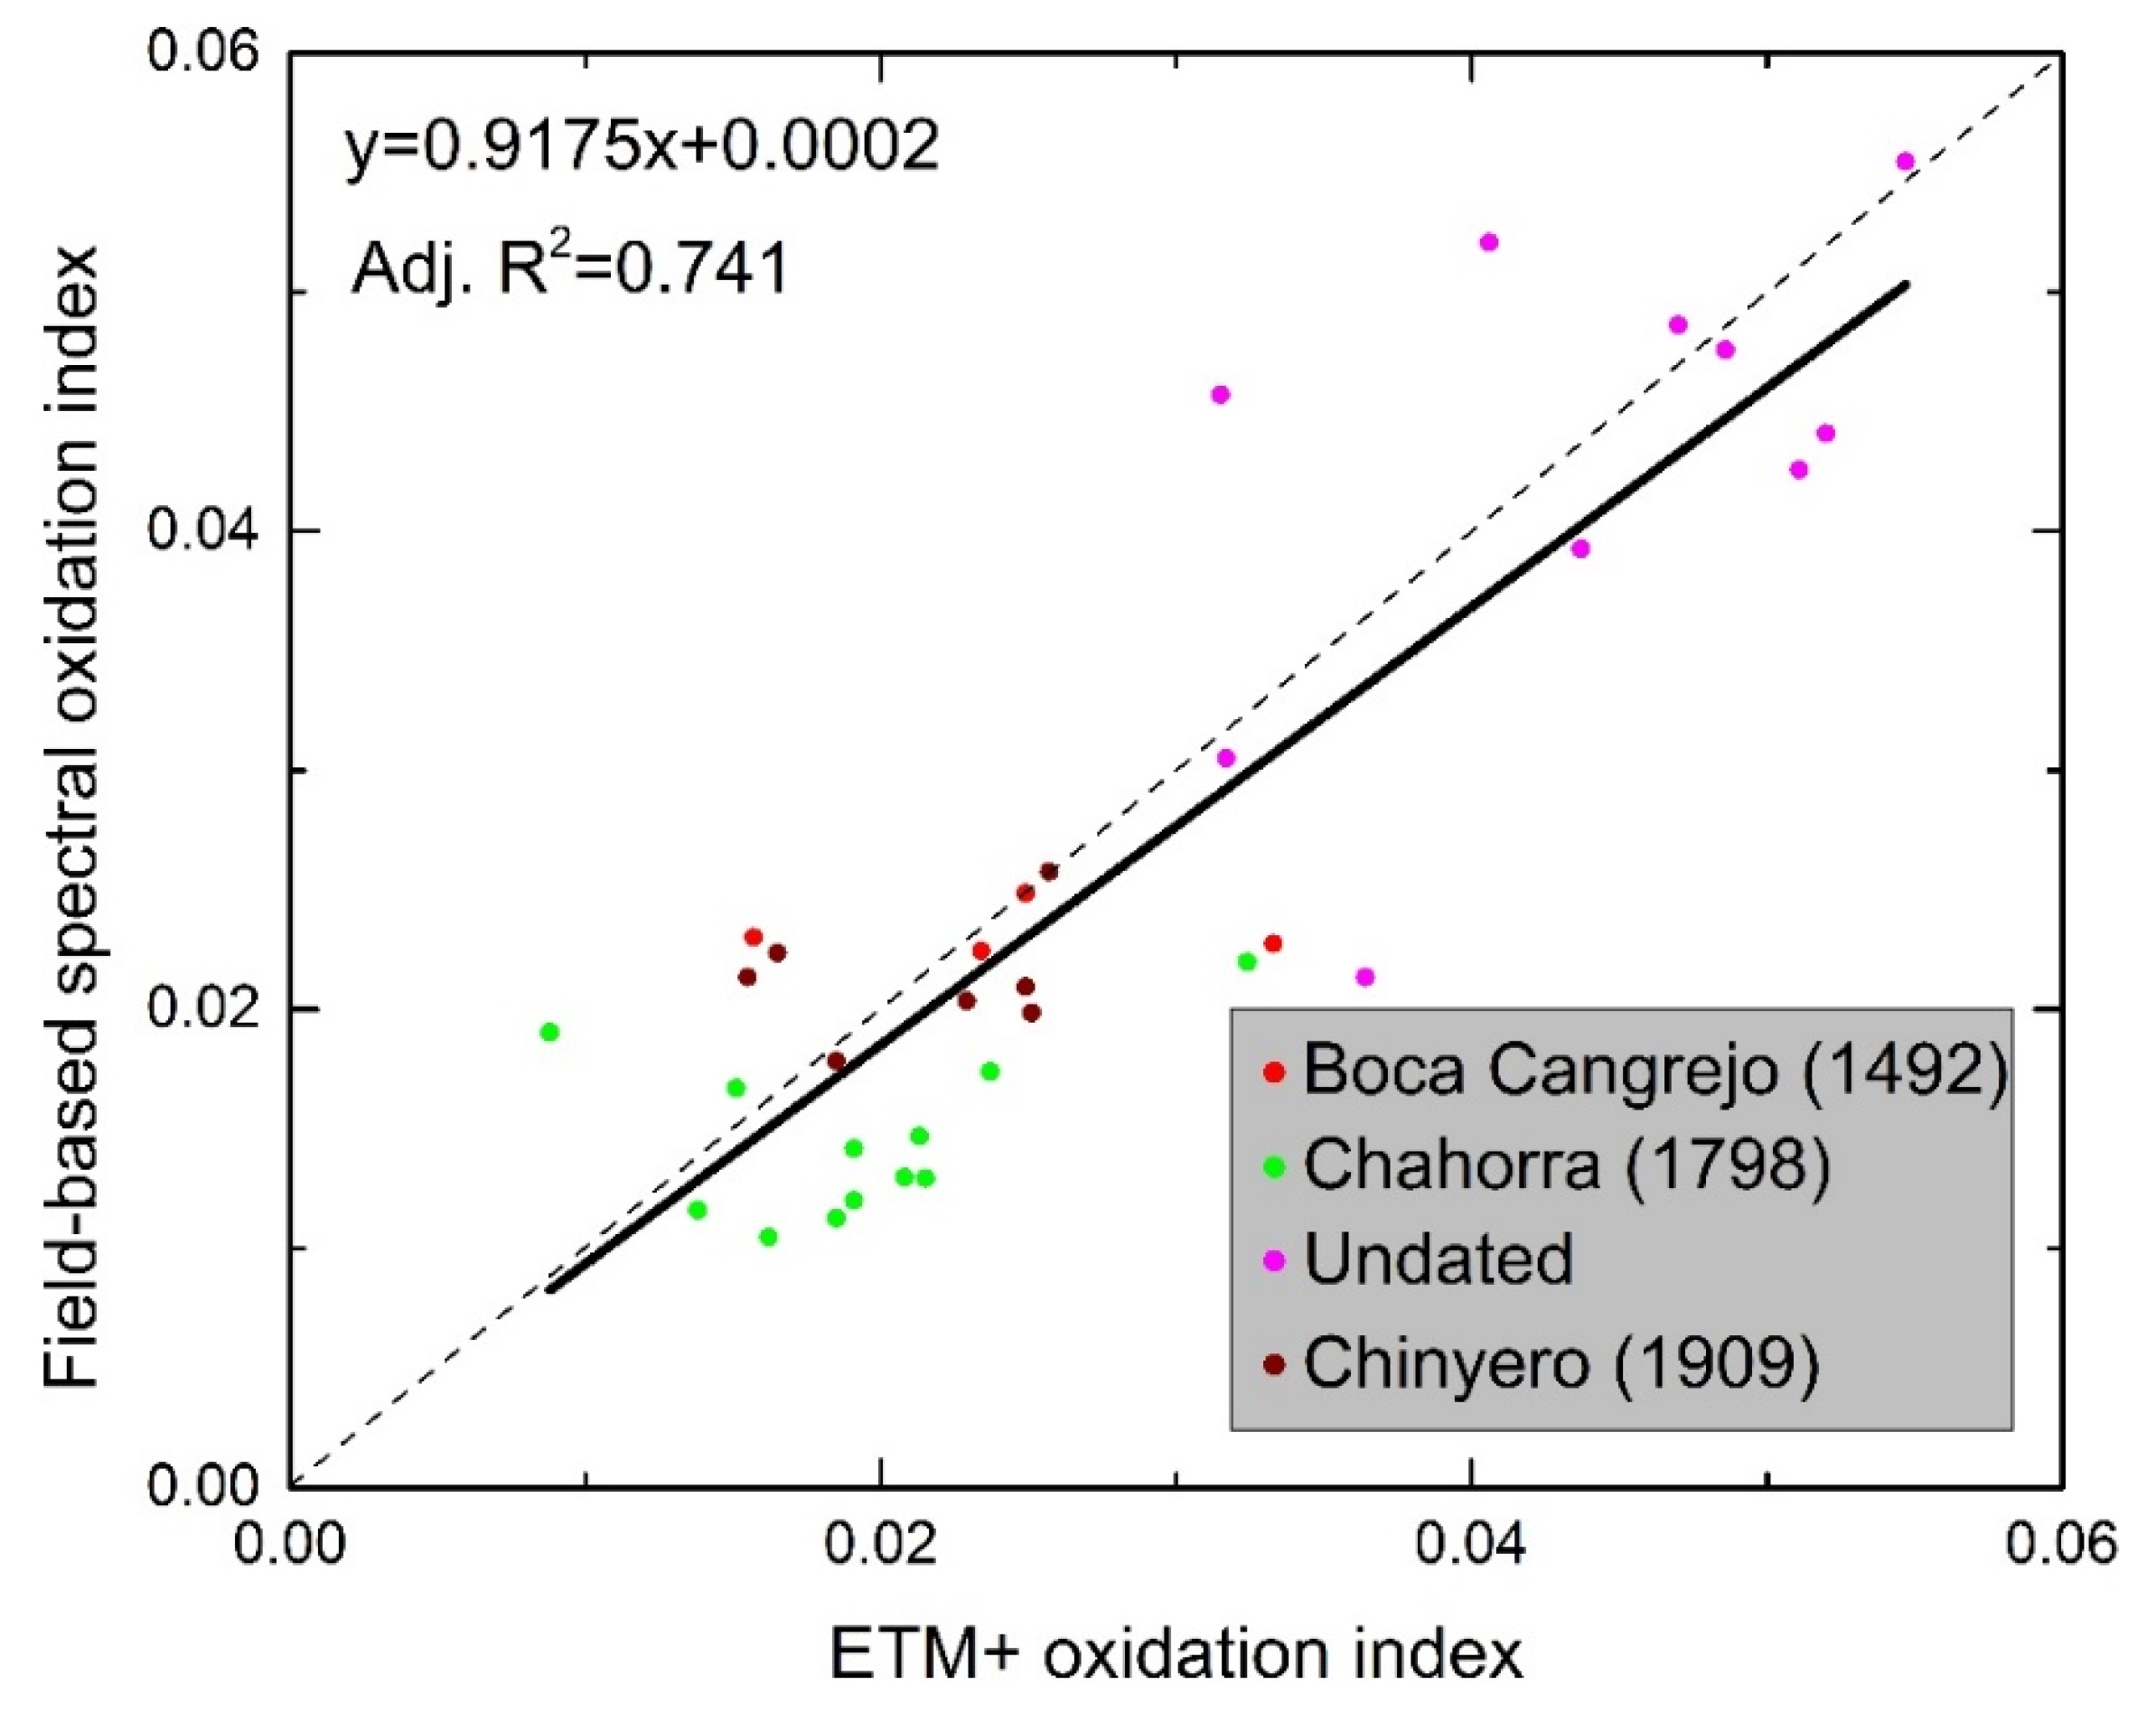
5.3.1. Oxidation Index and Its Application to Landsat ETM+ Image

Although our field observation of oxidization using the net method is only semi-quantitative, the observations based on surface color changes, from fresh dark black to weathered reddish-brown, seem to be a reasonable proxy for ferric iron content of lava surface [15,66]. The contrasted relationships obtained for recent and older flows in Figure 5 suggest, however, that the field-based oxidation estimate might have been influenced by the local context and created a bias when comparing different flows. The subtraction oxidation index using the wavelength ranges corresponding to the Landsat ETM+ red and blue bands was shown to be useful for estimating the oxidation level of lava surfaces.
Mapping the level of oxidation across an entire flow field is of interest to discriminate flow units of different ages or to identify the contrast in weathering which is associated with the primary oxidation during the emplacement of varying weathering rate. The subtraction oxidation index using the red (630–690 nm) and blue (450–520 nm) bands of the Landsat ETM+ is highly correlated with the same oxidation indices extracted from the field spectra (Figure 10). This suggests that the spectral characteristics generated from a Landsat image pixel are properly validated by the field measurements. Figure 10 highlights the large contrast in oxidation level between the Chahorra and the undated flows located in the caldera. The age variation is, however, not systematic: the Chinyero and Boca Cangrejo lava flows, situated at lower elevations, display a higher level of oxidation than the Chahorra, irrespective of their age.
Figure 10. Correlation between the subtraction oxidation index ( ref 630 690 ref 450 520 ) derived from the Landsat ETM+ image bands 1 and 3 and from the field spectral data, for 33 lava sites measured on the Boca Cangrejo, Chahorra, Chinyero and prehistorical lava flows. The grey dashed line is the 1:1 line.
Remotesensing 07 15864 g010
The correspondence of field- and satellite-derived oxidation indices suggests that it is possible to map the oxidation of lava surfaces from multispectral imagery (Figure 11), although the oxidation index has not been validated with independent chemical analyses but only with visual description of the surface. The map of the oxidation index derived from the Landsat ETM+ data shows a clear boundary between the Chahorra lava flow and the surrounding undated lava surfaces, as well as zones with various levels of oxidation within the pre-historical lava flows. Although the Chahorra and its surrounding lava surfaces are part of the same environment, they display remarkably different oxidation levels that in this case correlate positively with the ages of these lavas. The oxidation index is also sensitive to slope orientations, especially in shadow zones (Figure 11b). In an attempt to minimize the topographic effect, the ratio and normalization oxidation indices using the Landsat ETM+ bands were tested but they did not succeed in reducing the effect of shadows. Further research is required to investigate whether part of this effect might be related to real oxidation variation with slope gradient and orientation, or how a slope-independent oxidation index could be established within these low reflectance surfaces.

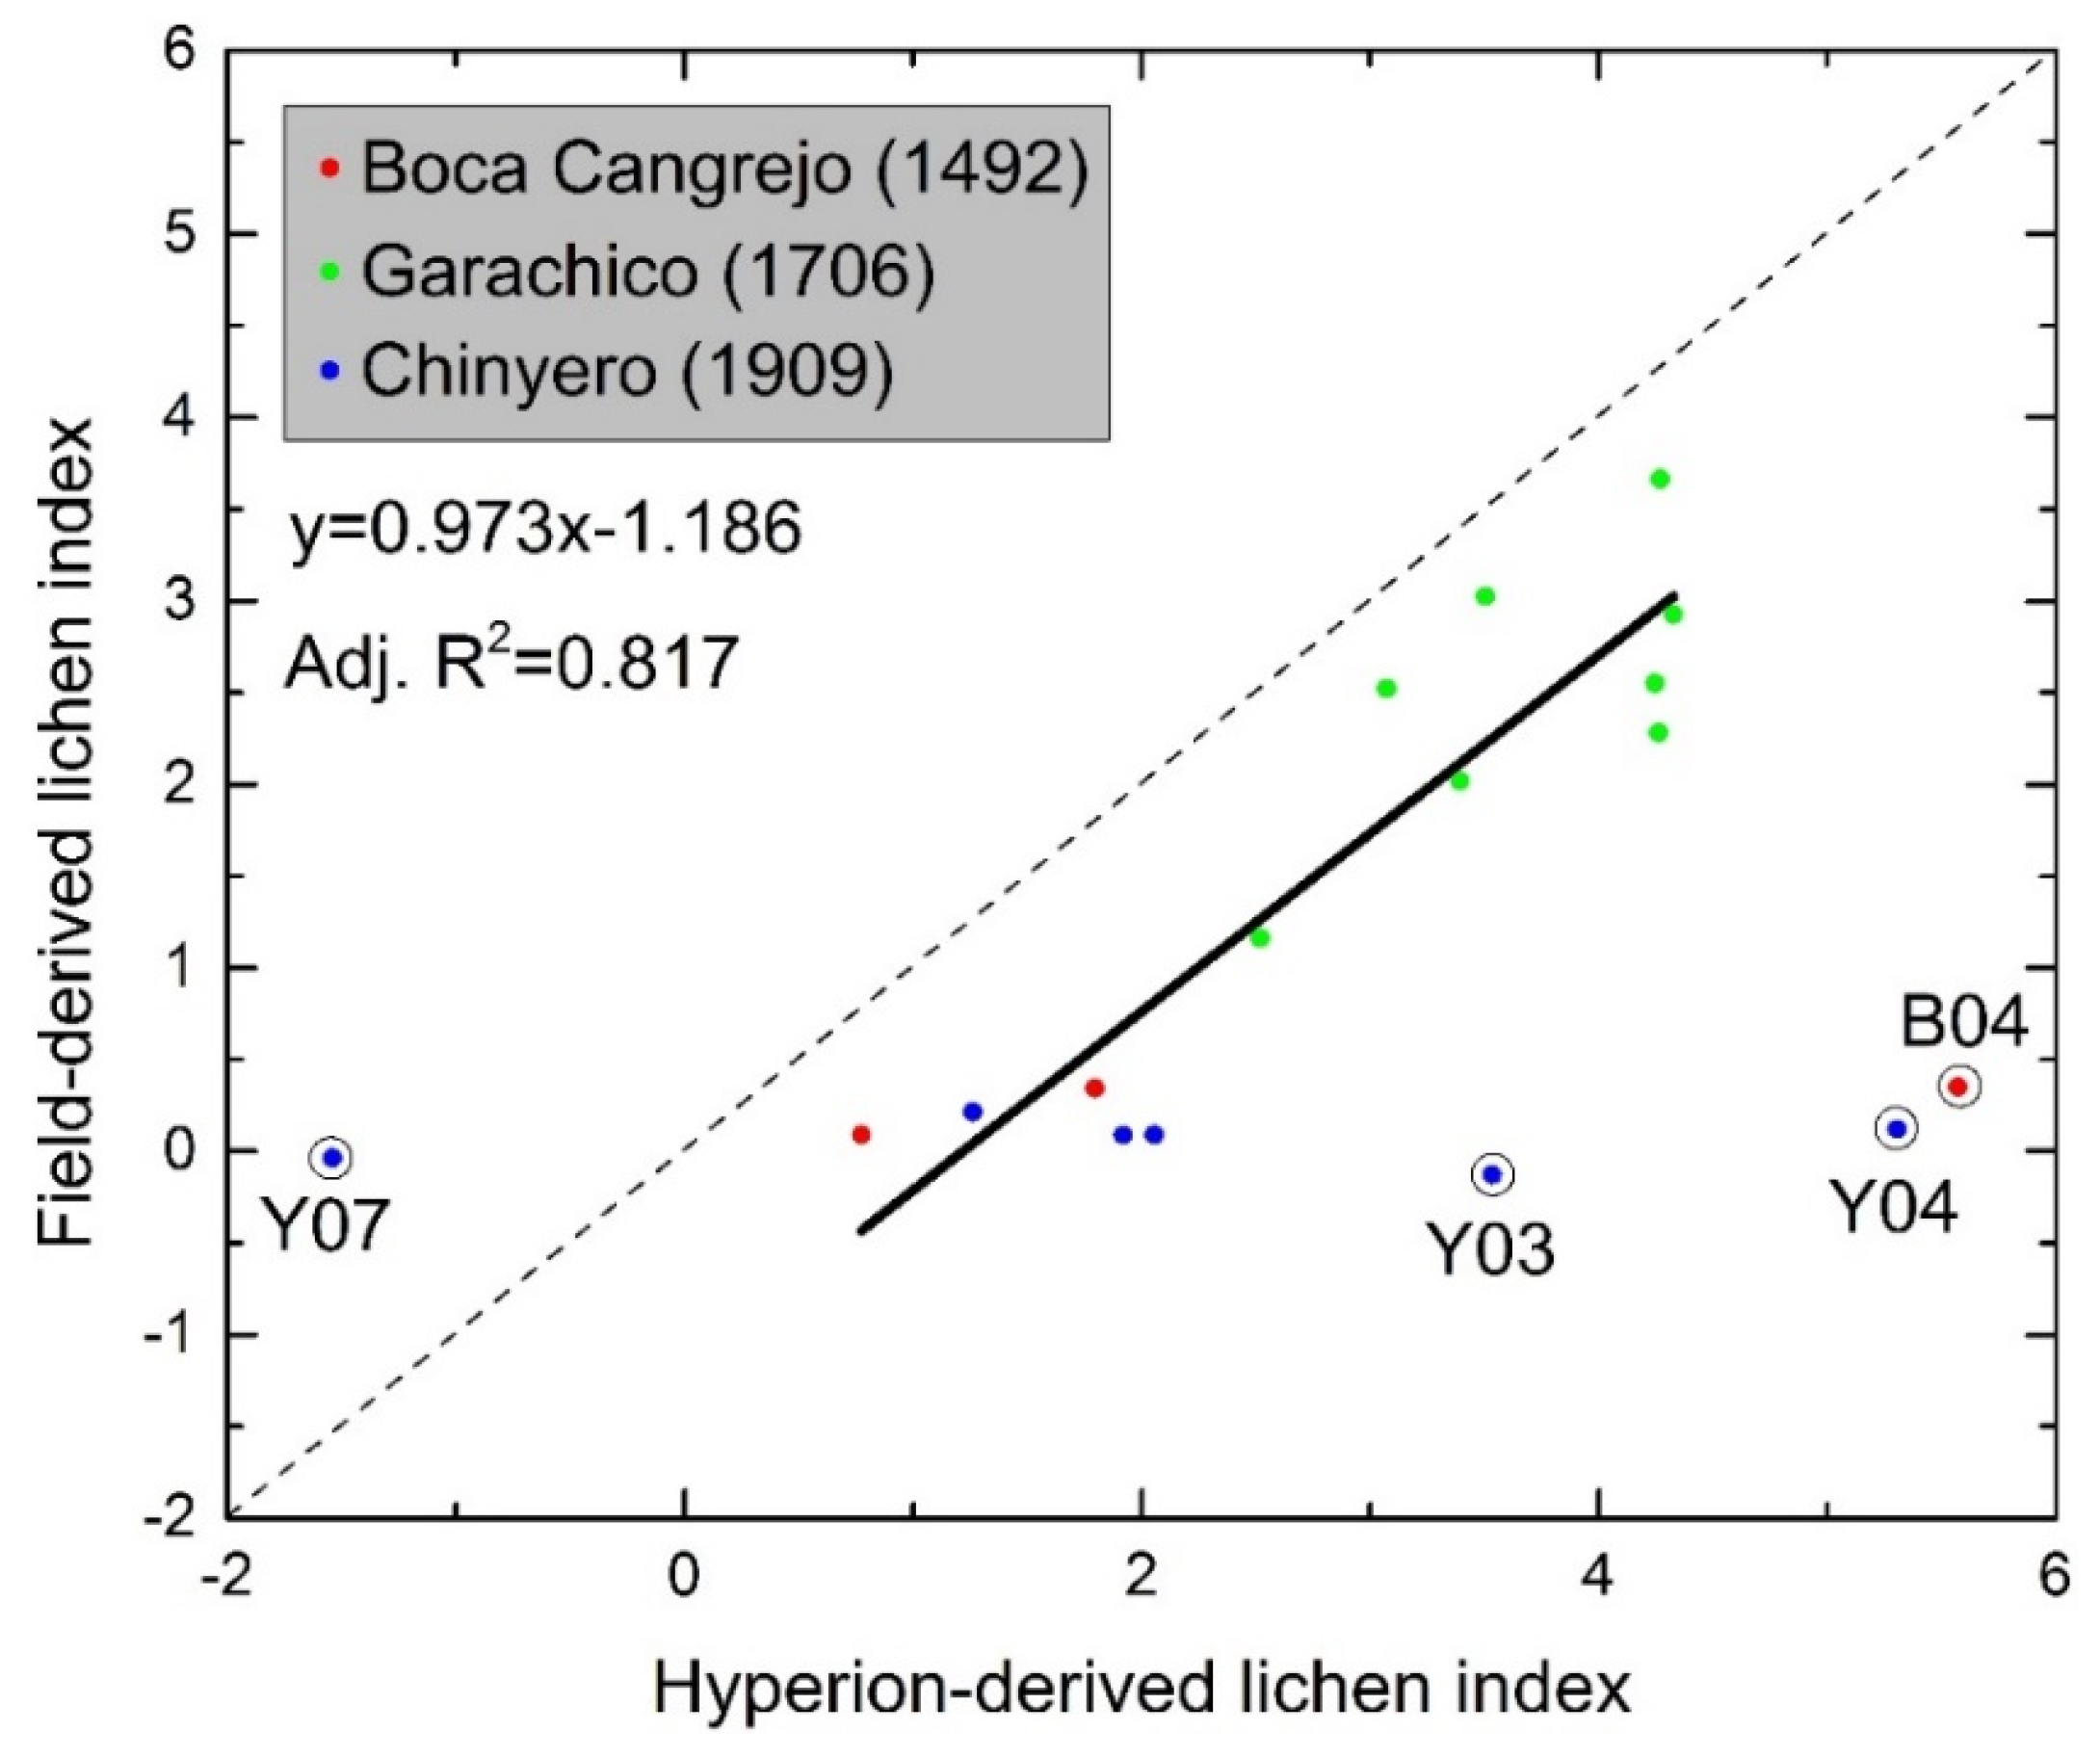
5.3.2. Lichen Index and Its Application to the Hyperion Image

The lichen index defined with field measurements has been calculated for the 17 lava sites covered by the Hyperion image. Figure 12 illustrates the linear relationship between lichen coverage estimates derived from field spectra and from smoothed Hyperion spectra. Only four sites with very low lichen coverage (B04,Y03, Y04, and Y07) do not follow this trend. These four outliers cannot be attributed to site heterogeneity—as their sites are all located on homogeneous lava surfaces—but is very likely due to the low SNRs of the Hyperion sensor, particularly in the SWIR wavelengths. The spectral feature in the rather narrow 1660–1725 nm range for defining the lichen index might therefore be less clear in the spectral profile, especially for low lichen coverage.
Figure 11. (a) Chahorra lava flow (1798) shown on the Landsat ETM+ image displayed in true color (R:G:B = b3:b2:b1); (b) Oxidation mapped from the Landsat ETM+ image using the relationship between oxidized surface and oxidation index shown in Figure 7c, calibrated based on the relationship between ETM+ and field spectra derived indices shown in Figure 10. The Chahorra lava flow is discriminated from its surrounding undated lava surfaces due to the contrast in oxidation level. Areas affected by steep topographic terrains and variable slope orientations are masked out (shown in grey) in the figure.
Remotesensing 07 15864 g011
Figure 12. Comparison between Hyperion-derived lichen index and field-derived lichen index ( ( ref 1660 ref 1725 ) / ( ref 1660 + ref 1725 ) ). The linear regression model was defined without the four outliers indicated by black circles. The grey dashed line is the 1:1 line.
Remotesensing 07 15864 g012
As lichen presence was very limited on the Boca Cangrejo and Chinyero lava flows due to their younger age, or higher elevations and/or drier climate than the Chahorra, the mapping of lichen coverage using Hyperion was applied to the Garachico flow only.
In order to minimize non-lichen effects, vegetated and urbanized areas on the Garachico lava flow were excluded. For comparison, the lichen coverage was modelled and mapped from the Hyperion image using a calibrated lichen index (Figure 13d) based on the relationship between field spectra and Hyperion derived indices shown in Figure 12. The lichen coverage may also be estimated (Figure 13e) using the high positive correlation between lichen coverage estimated in the field and elevation (Figure 13a). A strong linear relationship is obtained when considering only the Garachico sites, because in this case, interacting factors such as differences in age and varying slope orientation are excluded.
Figure 13. Lichen colonization on lava surfaces. (a) Relationship between field-derived spectra of lichen-covered lava sites on the Boca Cangrejo, Chinyero and Garachico lava flows and their elevations. Lichens tend to grow more at elevations <1200 m a.s.l. The black solid fitting line is plotted only for the Garachico sites and the grey dashed line is fitted to all the displayed sites; (b) Scatterplot of elevation vs. temperature and rainfall for the Garachico lava flow area. The temperature and rainfall maps were obtained from the Spanish Meteorological Agency (AEMET) [34]; (c) Lichen coverage observed in the field displayed with their point size and color representing the value of lichen coverage on the lava surface; (d) Lichen coverage derived from the calibrated Hyperion lichen index (Figure 12); (e) Lichen coverage based on the relationship between lichen coverage and elevation found in Figure 13a (the linear regression model only with the Garachico sites).
Remotesensing 07 15864 g013
The lichen estimation with the calibrated Hyperion lichen index (Figure 13d) shows that: (1) lichen coverage decreases with increasing elevation from 550 m to 1200 m a.s.l; (2) lichen coverage is lower on the steep slopes below 550 m a.s.l.; (3) lava surfaces close to the eruptive cone, where lava flow is partially covered by terphra, have lower lichen coverage; and (4) an oblique linear pattern within the index map suggests an artefact in the Hyperion image. Figure 13e also shows that an extrapolation of the lichen coverage based purely on elevation is over-simplistic, as the elevation-lichen relationship in Figure 13a is probably only valid for the 1000–1200 m elevation range, where field measurements were acquired.
Spatial contrast in lichen coverage can be explained by surface conditions and climate differences (Figure 13b). Despite of high rainfall, the lava areas close to the volcanic cone (>1200 m a.s.l.) have low lichen coverage, which is due largely to the prominent presence of tephra covering the lava surface. The significant amount of lichen at the intermediate elevations (550–1200 m. a.s.l.) is likely attributable to the favorable temperature and precipitation conditions, which have not yet allowed a full vegetation recovery. As for the low lichen coverage at elevations <550 m, this can be mostly attributed to the steep and dissected topography as well as potential human impact on the northwestern coast of Tenerife. This spatially-explicit estimation of lichens, as demonstrated in this study, creates new opportunities for characterizing the spatio-temporal pattern of biological colonization of newly emplaced lava flows.

5.4. Effect of Surface Roughness

In Figure 4a, it is shown that the wavelength corresponding to the reflectance peak in the visible part of the spectrum for the lava surfaces affected only by oxidation is shifted to shorter wavelengths for pāhoehoe lavas (B01P and C03P), as compared to ʻaʻā flows. This is confirmed by the moderate positive correlation between the slope of the reflectance curve and the roughness index measured in the field for the 640–730 nm wavelengths (Figure 8b).
In addition, the absolute reflectance in the visible region is higher for the pāhoehoe sites than for the ʻaʻā sites, especially in the shortest wavelengths (Figure 4f). This is confirmed by the negative correlation between the absolute reflectance in the visible region (particularly in the violet to blue (350–500 nm) range) and lava surface roughness (Figure 8a). Fresh pāhoehoe lava surfaces (sites B01P and C03P) are very smooth, have a blue tint to some extent, and are shiny, thus reflecting more energy over the entire spectral range but more specifically in the violet to blue range (Figure 2a and Figure 3h). Crystallization has been reported to alter the VNIR and mid-infrared spectral range of basalt (e.g., [67]) but the crystal content of Tenerife lavas is generally low [36,37] so the effect is limited. Loss of the quenched shiny surface through alteration might reduce this contrast between pāhoehoe and ʻaʻā surfaces, but sufficient pāhoehoe surfaces could not be found on different flows to test this systematically. Finally, a high negative correlation of more than 0.8 was found between the first-order derivative of reflectance and the roughness (Figure 8b) but the interpretation of this result is not clear.
One might question the reliability of the roughness measured by the chain method. Unlike soil, lava surfaces (particularly ʻaʻā) are rather rough, with scattered blocks of different sizes up to one meter, which makes surface roughness vary greatly from site to site, with also high directional variation and huge differences in scales (from millimeter to meter scale). This measurement strategy is however the only practicable method that could be adopted in such a physically challenging environment: its consistent application makes our results comparable with each other.

6. Conclusions

This study presents the results of spectral analyses of in situ spectral data of basaltic lava surfaces on Tenerife Island. Our main conclusions are as follows:
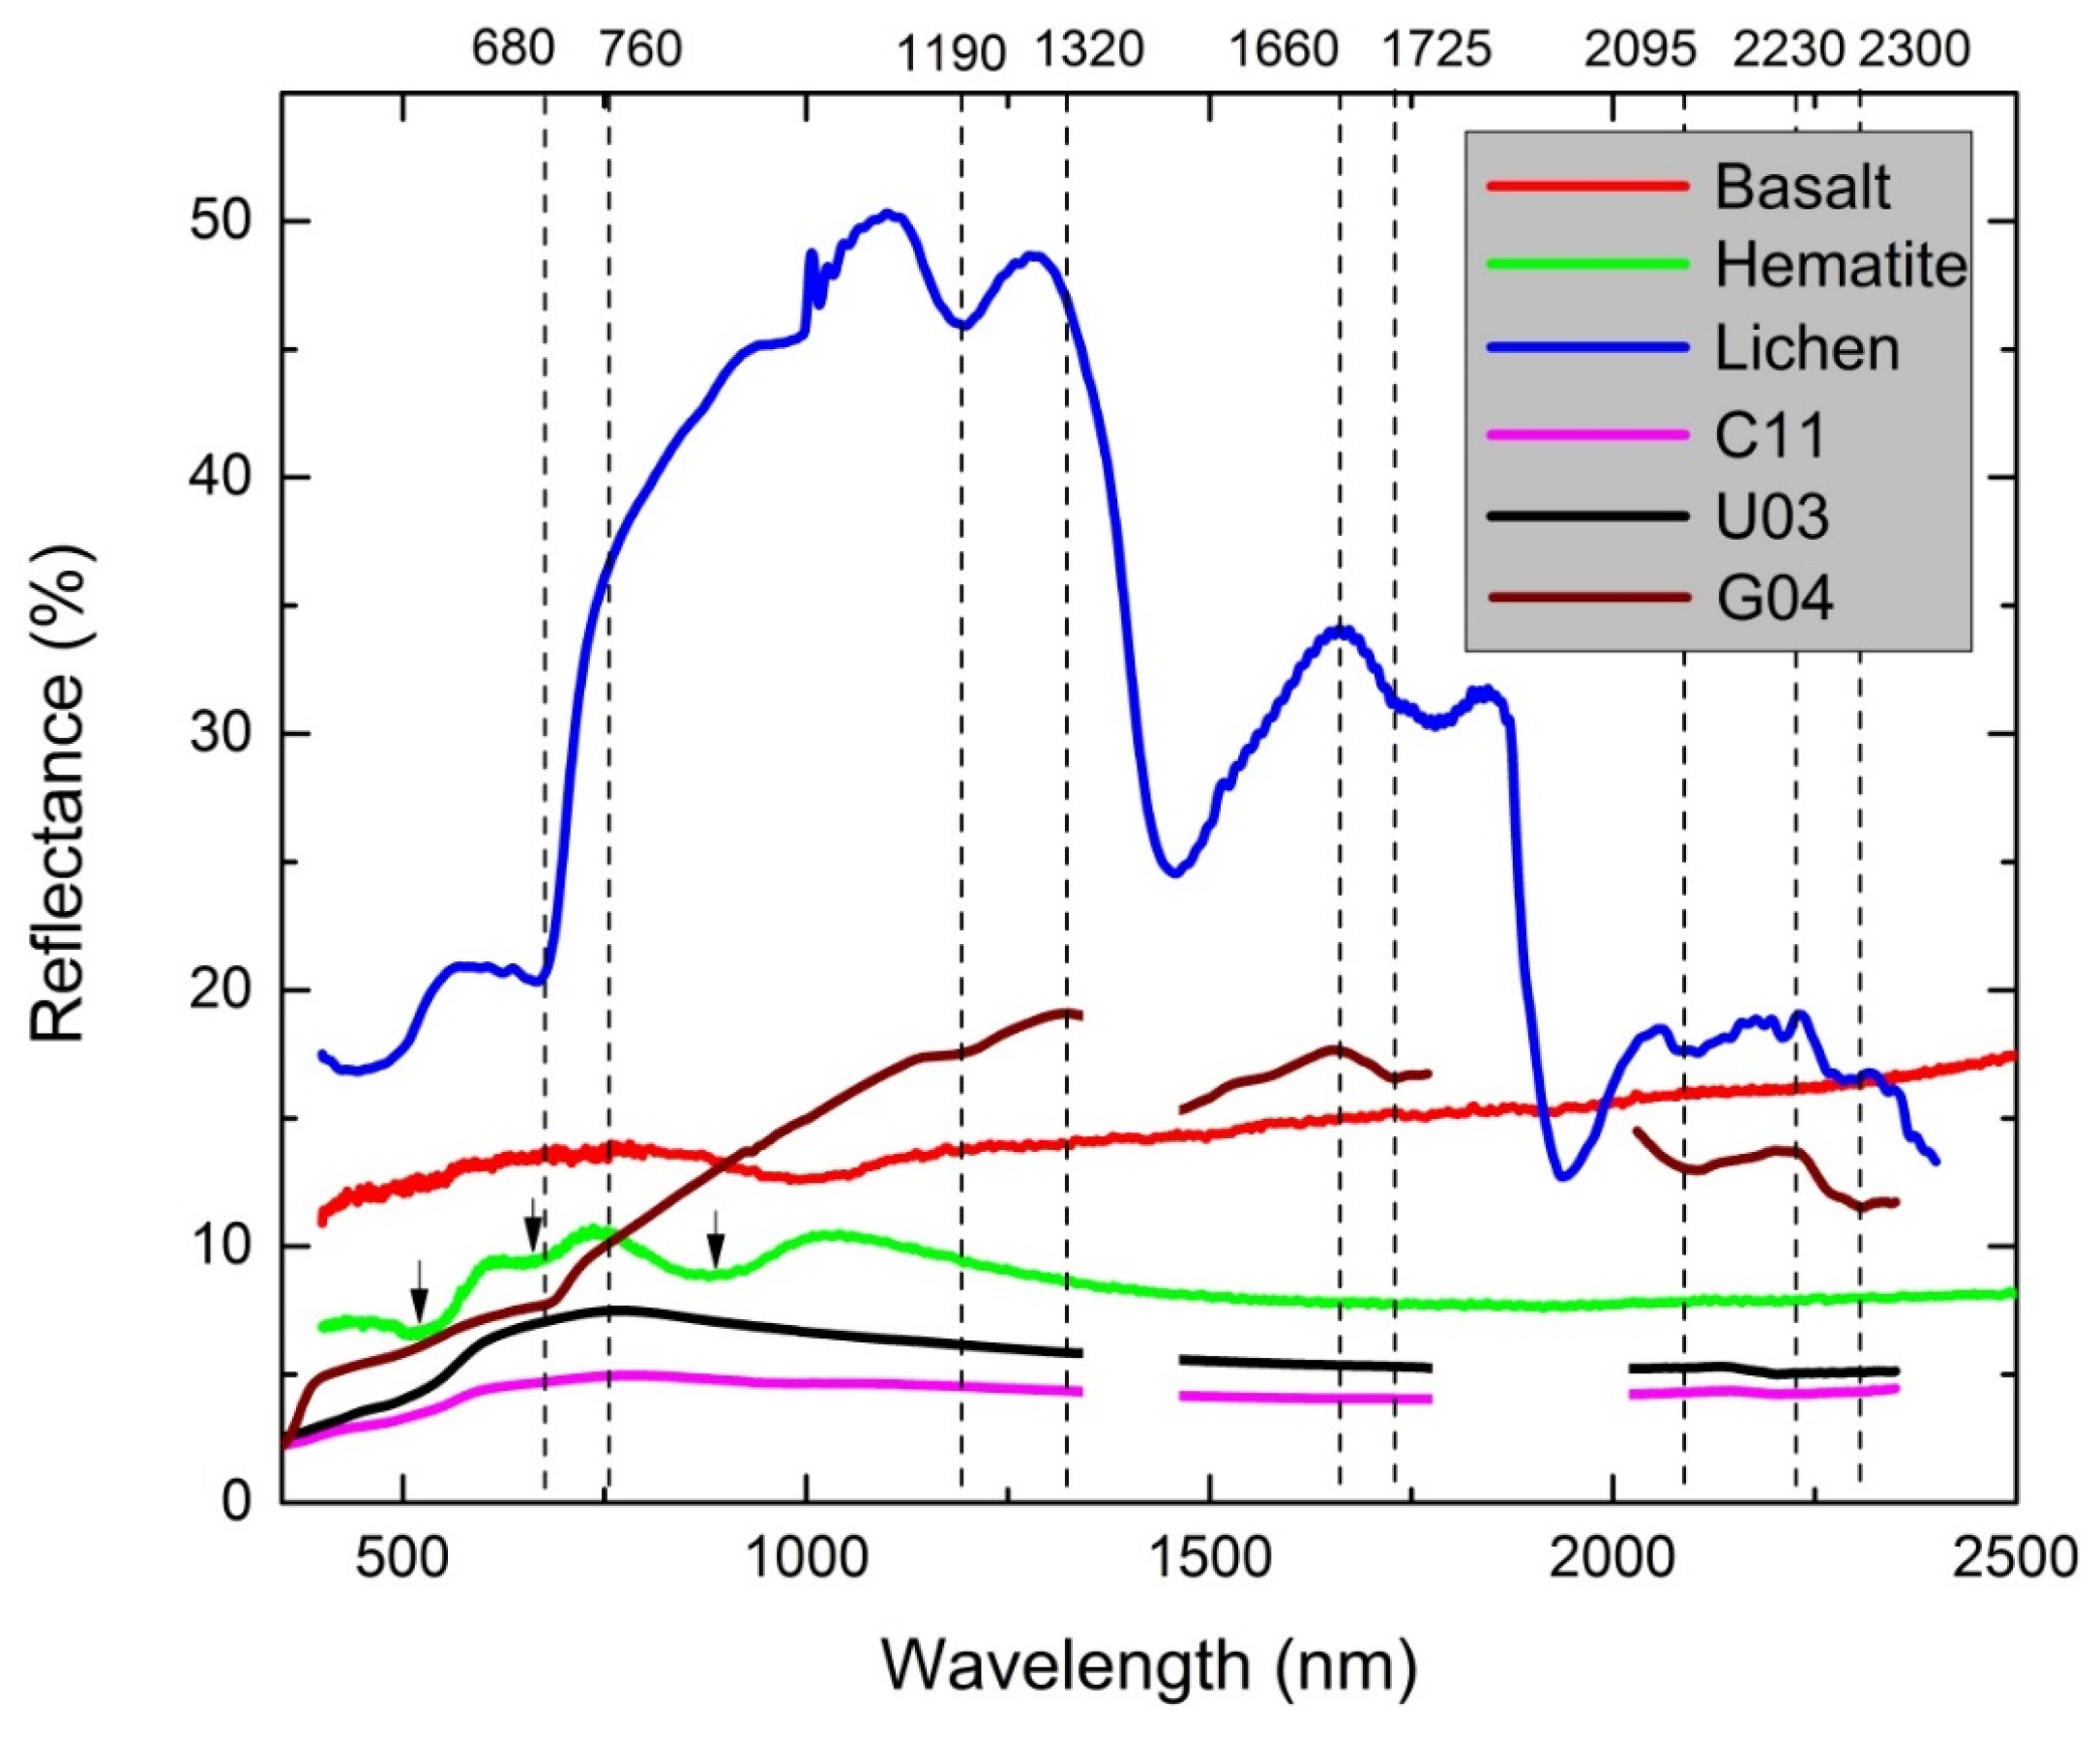
  • Chemical weathering in the form of oxidation and biological weathering as a result of lichen growth can affect the spectra of lavas considerably.
  • Bare lava surfaces with no lichen show low and flat reflectance spectra, increasing in the visible and decreasing in the infrared part of the spectrum. This trend tends to be more expressed for older lava flows which are affected by significant surface oxidation. Particularly, the slope of the reflectance curve from the blue to the red range of the spectrum increases as oxidation becomes stronger, a spectral feature which is useful for defining an oxidation index that is able to relatively quantify the oxidation degree of lava surfaces.
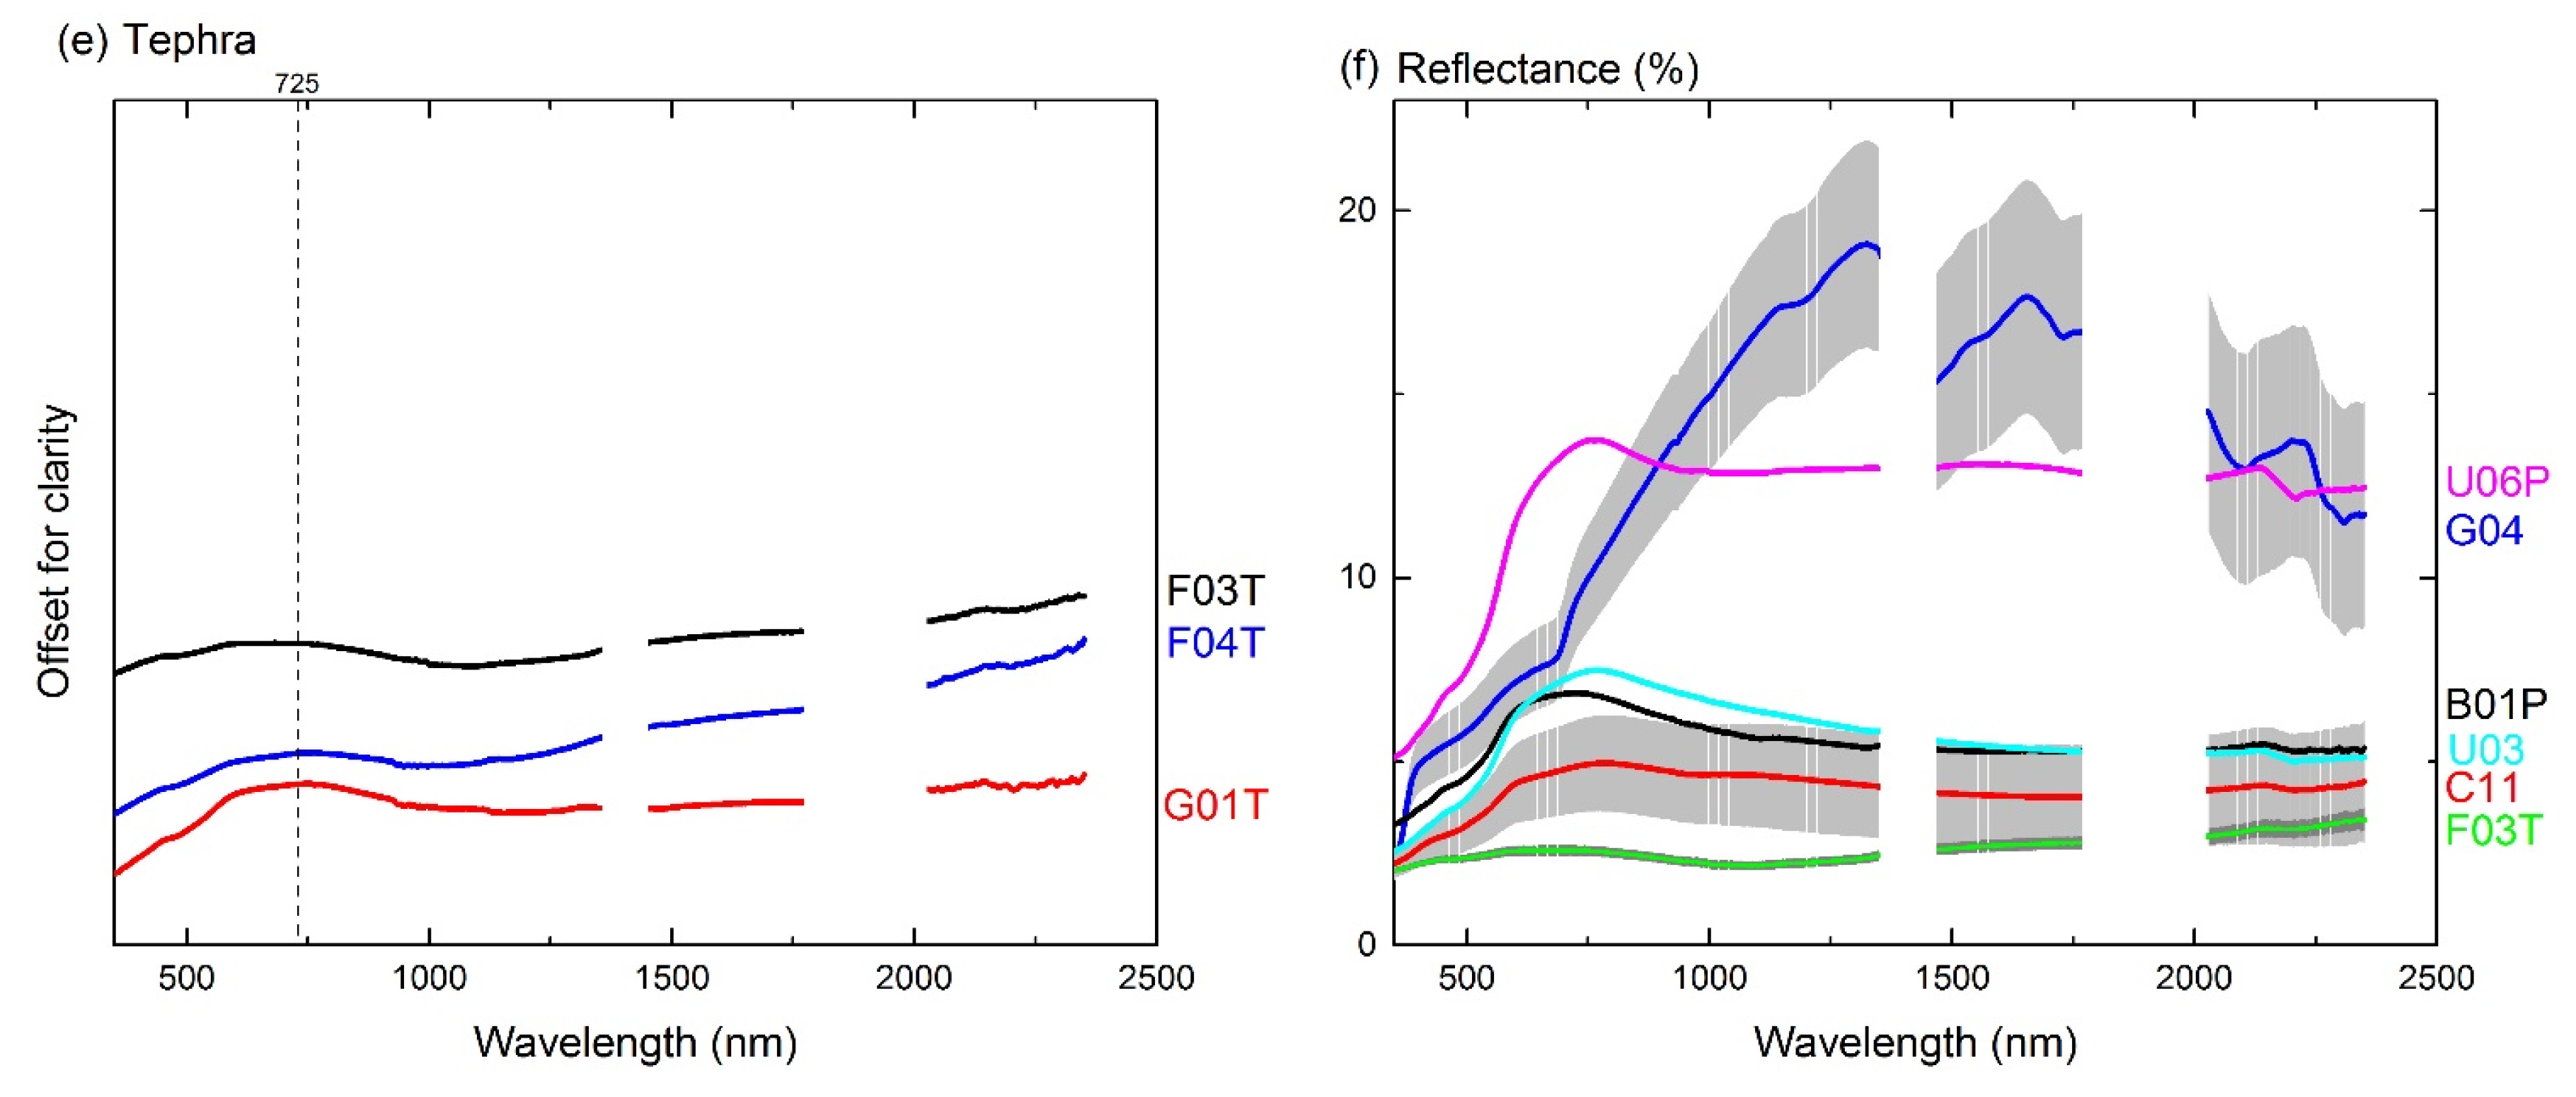
  • Lavas affected by lichens have spectral features that are similar to those of lichens. Wavelengths (1660 nm and 1725 nm) sensitive to lichen colonization have been identified and used to develop an NDVI-like lichen index. A strong linear relationship between this index and lichen coverage recorded in the field has been observed, which might be used for spatial-temporal analysis of lichen cover development.
  • Surface roughness has a limited but significant influence on the spectra of lavas. Smoother lava surfaces have higher reflectance than rough ones, especially at short wavelengths, and their maximum reflectance value is found at shorter wavelengths. Roughness is therefore positively correlated with the first-order derivative of reflectance at 720 nm. It requires further exploration to find out whether the visible and NIR bands of multispectral and hyperspectral images allow discriminating pāhoehoe from ʻaʻā lava surfaces.
Our study presents the first systematic spectroscopic survey of lava flows coupled with field-based characterization of surface oxidation, lichen coverage and roughness. Spectral properties of lava surfaces are quantitatively analyzed and important spectra-controlling factors are identified, contributing to the knowledge of spectral evolution of lava.
We also illustrate the use of the oxidation and lichen indices generated from Landsat ETM+ and Hyperion imagery, respectively, for mapping oxidation and lichen coverage on lava surfaces. These approaches could help in the future in mapping complex lava flow field. Further work on quantifying the degree of chemical alteration by oxidation or other processes using laboratory analysis might be beneficial to better understand how these processes affect spectral signatures of lava surfaces. Spatial quantification of chemical and biological weathering of lava flows using satellite imagery is useful for contrasting environmental and time controls on lava spectra evolution. It therefore might contribute to using lava flow spectra as a reliable indicator of relative lava flow age.

Acknowledgments

Long Li wishes to thank the China Scholarship Council (CSC) for the financial support enabling his research at VUB, the VUB Doctoral School of Natural Sciences for a travel grant for the second field mission, and the Teide National Park for authorizing the fieldwork. We gratefully acknowledge the assistance of José Mauricio Méndez Febles, Lien Bakelants and Annelies Verstraelen in the field. Advice from Audray Delcamp on her fieldwork experience on Tenerife, from Boud Verbeiren on spectrometry and from Weiwei Ma on data processing is appreciated. Discussion with Philippe Trefois is greatly appreciated in interpreting the spectral behaviors of rocks and minerals. We are grateful to Gareth Rees for sharing the spectral data of lichen and Javier Pórtoles for sharing the meteorological data of Tenerife with permission from AEMET. We also would like to thank the constructive comments from three anonymous reviewers, which have helped to significantly improve the quality of the manuscript. The dataset of field spectrometry presented in the manuscript can be obtained by a personal request to the authors.

Author Contributions

Long Li led the research design, data processing and analysis and drafted the manuscript. The fieldwork on Tenerife was planned and conducted by Long Li, Carmen Solana and Matthieu Kervyn with Frank Canters providing the spectroradiometer and advice at distance. Matthieu Kervyn supervised the research, reviewed and edited the manuscript. Carmen Solana, Frank Canters and Jonathan Cheung-Wai Chan reviewed and edited the manuscript and the latter two also advised on data processing and analysis. All authors have agreed with the final version of the manuscript.

Conflicts of Interest

The authors declare no conflict of interest.

Appendix

Descriptions of Sites Measured on Tenerife

List of all measured sites on volcanic surfaces. Names of these sites consist of 3~4 characters: the first letter is the abbreviation of the lava flow or cone where they were measured (B—Boca Cangrejo; C—Chahorra; F—Fasnia; G—Garachico; U—Undated; Y—Chinyero); the numbers show the order of the site on the lava flow. The sites whose names end with “P” and “T” were measured on pāhoehoe lava surfaces and tephra surfaces respectively. In total, there are 14 sites measured on lava surfaces and three on tephra fields in September 2013, and 29 on lava surfaces in November 2014. Note that numbers followed by an asterisk (*) point to sites for which oxidation and lichen coverage were estimated through observation in the field and from photos without using the plastic net method.
Table A1. Descriptions of sites measured on Tenerife.
SiteAcquisitionElevation (m)Roughness (m)Surface DescriptionLichen (%)Oxidation (%)
B01P2013147327.83Pāhoehoe lava, unvegetated, unnoticeable lichen, grey color with yellow dust, very smooth surface010*
B022013123527.8ʻAʻā lava, scattered pine trees, white lichen (5%), reddish alteration, platy blocks Ø = 0.1–1 m5 *25 *
B032014135026.69ʻAʻā lava, unvegetated, reddish alteration, blocks Ø = 0.1–0.5 m023.6 *
B042014134426.85ʻAʻā lava, unvegetated, reddish alteration, platy blocks Ø = 0.5–1.5 m027.2 *
C012013206125.26ʻAʻā lava, unvegetated, fresh, dark with weathering layer of brown-orange color, variable sizes020 *
C022013207726.25ʻAʻā lava, unvegetated, 30 m away from the caldera wall, fresh with weak weathering, blocks Ø = 0.05–0.5 m020 *
C03P2013210228.98Pāhoehoe lava, unvegetated, fresh, dark with little weathering, very smooth surface with broken pieces010 *
C042013210226.91ʻAʻā lava, unvegetated, fresh, dark with orange alteration, blocks Ø = 0.05–0.5 m020 *
C052014206626.93ʻAʻā lava, unvegetated, fresh, dark with limited weathering, blocks Ø = 0.5 m035
C062014210424.97ʻAʻā lava, unvegetated, fresh, dark with limited weathering, blocks Ø = 0.1–0.5 m028.8
C072014205423.85ʻAʻā lava, unvegetated, fresh, dark with weathering, blocks Ø = 0.1–0.5 m047
C082014210623.79ʻAʻā lava, unvegetated, fresh, dark with limited weathering, blocks Ø = 0.1–0.5 m012
C092014204025.65ʻAʻā lava, unvegetated, fresh, dark with limited weathering, blocks Ø = 0.1–0.5 m015
C102014203225.29ʻAʻā lava, unvegetated, fresh, dark with weathering, blocks Ø = 0.1–0.5 m022.2
C112014201626.24ʻAʻā lava, unvegetated, fresh, dark with weathering, blocks Ø = 0.02–0.5 m021.4
C122014106224.55ʻAʻā lava, unvegetated, fresh, dark with weathering, blocks Ø = 0.5–1 m025.6
F012013229428*ʻAʻā lava, unvegetated, fresh, dark with limited weathering, blocks Ø = 0.1–0.3 m010 *
F022013219128*ʻAʻā lava, unvegetated, fresh, dark with weathering, blocks Ø = 0.1–0.3 m020 *
F03T2013219829*Lapilli, scattered bushes, dark, Ø = 0.003–0.008 m00
F04T2013219429*Lapilli, scattered bushes, dark, Ø = 0.002–0.003 m, scattered bombs Ø = 0.1 m00
G01T2013130429*Lapilli, dark, Ø = 0.005–0.01 m, scattered bombs00
G022013120726*ʻAʻā lava, lichen, small shrubs of 0.2–0.3 m height, filled with lapilli Ø = 0.002–0.008 m20 *0
G032013108425.55ʻAʻā lava, much lichen, scattered pine trees, blocks Ø = 0.002–0.5 m40 *0
G042014103625.27ʻAʻā lava, much lichen, ferns of 0.15–0.3 m height and shrubs of 0.5–0.75 m, blocks Ø = 0.2–0.5 m 54.811.4
G052014111427.87ʻAʻā lava, much lichen, few ferns, blocks Ø = 0.1–0.8 m34.60
G062014106827.11ʻAʻā lava, much lichen, no vegetation, blocks Ø = 0.1–0.8 m52.40
G072014110127.17ʻAʻā lava, much lichen, scattered green ferns and brown bushes, blocks Ø = 0.1–0.8 m500
G082014111827.32ʻAʻā lava, much lichen, scattered green ferns and brown bushes, blocks Ø = 0.1–0.5 m38.80
G092014115026.05ʻAʻā lava, much lichen, scattered green ferns and brown bushes, blocks Ø = 0.1–0.5 m25.80
U01P2013207129.23Pāhoehoe lava, scattered dry bushes, hummocky surface, brown alteration070 *
U022013208726.85ʻAʻā lava, no vegetation, dark grey with orange alteration, blocks Ø = 0.05–0.4 m025 *
U032014208228.53ʻAʻā lava, scattered plants, brown alteration, blocks Ø = 0.05–0.3 m017.6
U042014207828.13ʻAʻā lava, brown bushes, brown alteration, blocks Ø = 0.05–0.3 m061.1
U052014208127.87ʻAʻā lava, no vegetation, brown alteration, blocks Ø = 0.05–0.3 m059.6
U06P2014207228.36Pāhoehoe lava, green bushes, hummocky surface, brown alteration070 *
U07P2014206828.36 *Pāhoehoe lava, green bushes, hummocky surface, brown alteration070 *
U082014207427ʻAʻā lava, no vegetation, brown alteration, blocks Ø = 0.05–1 m062
U092014205427.92ʻAʻā lava, no vegetation, brown alteration, blocks Ø = 0.05–1 m056.2
U102014204027.2ʻAʻā lava, no vegetation, yellow and brown alteration, blocks Ø = 0.05–1 m072.2
Y012013127925.1ʻAʻā lava, unnoticeable moss, flat slab with yellow alteration010 *
Y022013127125.1ʻAʻā lava, little lichen and moss, yellow alteration on large blocks Ø = 0.5 m5 *15 *
Y032013146024.18ʻAʻā lava, no vegetation, dark with mixed colors with much weathering, blocks Ø = 0.02–1 m042.4
Y042014141926.35ʻAʻā lava, no vegetation, grey dark, alteration of mixed colors, blocks Ø = 0.03-0.2 m, maximum size = 3 m2.941.8
Y052014129925.84ʻAʻā lava, no vegetation, grey dark, alteration of mixed colors, blocks Ø = 0.2–1 m1.839.6
Y062014122726.59ʻAʻā lava, no vegetation, grey dark, brown alteration, blocks Ø = 0.2–0.8 m6.629.4
Y072014144927.14ʻAʻā lava, no vegetation, alteration of mixed colors, blocks Ø = 0.1–1 m644.4

Regression Models for the Oxidation Indices

Linear regression models ( y   =   a x   +   b , where x is the oxidation index and y is the oxidized lava surface observed in the field) for the oxidation indices tested, using different wavelengths or wavelength ranges at site and spot scales. The ranges of 450–520 nm and 630–690 nm correspond to the blue and red bands of Landsat ETM+ respectively; the ranges of 450–495 nm and 620–750 nm cover the entire blue and red ranges of the electromagnetic spectrum, respectively. The model highlighted in bold was used for mapping oxidation from Landsat ETM+ image in the discussion.
Table A2. Regression models for the oxidation indices.
IndexScaleModelref1 (400); ref2 (800)ref1 (450–520); ref2 (630–690)ref1 (485); ref2 (660)ref1 (450–495); ref2 (620–750)ref1 (475); ref2 (685)
Subtraction r e f 2 r e f 1 sitea9.10413.15112.94012.14912.089
b−0.0080.0120.0110.0030.006
adj. R20.7400.7590.7590.7600.768
spota9.12413.42213.23912.37412.32
b0.0030.0230.0210.0130.016
adj. R20.5630.5430.5430.5540.551
Ratio r e f 2 / r e f 1 sitea0.3040.7310.7120.6220.638
b−0.334−0.842−0.825−0.726−0.749
adj. R20.4850.5900.5920.5650.590
spota0.3620.7910.7680.6900.691
b−0.474−0.948−0.925−0.853−0.85
adj. R20.5510.5270.5270.5410.539
Normalized difference r e f 2     r e f 1 r e f 2   +   r e f 1 sitea1.5112.5582.5282.3032.368
b−0.212−0.251−0.257−0.252−0.265
adj. R20.4590.5840.5850.5520.580
spota2.0742.9262.8852.7612.753
b−0.427−0.342−0.348−0.378−0.372
adj. R20.5380.5260.5270.5400.537

Regression Models for the Lichen Indices

Regression models for the lichen indices tested, using different wavelengths or wavelength ranges at site and spot scales. These wavelengths were selected because they are characteristic spectral features of lichen-covered lava surfaces. The model highlighted in bold was used for mapping lichen coverage from the Hyperion image in the discussion.
Table A3. Regression models for the lichen indices.
IndexScaleref1 (680); ref2 (1320)ref1 (1725); ref2 (1660)ref1 (2300); ref2 (2230)
Subtraction r e f 2 r e f 1 sitey = 4.112x − 0.030;
adj. R2 = 0.928
y = 39.818x + 0.029;
adj. R2 = 0.917
y = 21.716x + 0.0001;
adj. R2 = 0.924
spoty = 3.637x − 0.007;
adj. R2 = 0.615
y = 35.826x + 0.038;
adj. R2 = 0.762
y = 19.902x + 0.017;
adj. R2 = 0.727
Ratio r e f 2 / r e f 1 sitey = 0.232x2 − 0.490x + 0.266;
adj. R2 = 0.877
y = 7.256x − 7.249;
adj. R2 = 0.942
y = 2.568x − 2.586;
adj. R2 = 0.849
spoty = 0.024x2 + 0.211x − 0.253;
adj. R2 = 0.576
y = 6.747x − 6.738;
adj. R2 = 0.785
y = 2.584x − 2.590;
adj. R2 = 0.781
Normalized difference r e f 2 r e f 1 r e f 2 + r e f 1 sitey = 2.672x2 − 0.064x − 0.014;
adj. R2 = 0.859
y = 14.983x + 0.006;
adj. R2 = 0.942
y = 5.553x − 0.021;
adj. R2 = 0.838
spoty = 2.498x2 − 0.026x − 0.010;
adj. R2 = 0.602
y = 14.014x + 0.008;
adj. R2 = 0.784
y = 5.690x − 0.010;
adj. R2 = 0.778

References

  1. U.S. Geological Survey. Types of Volcano Hazards. Available online: http://volcanoes.usgs.gov/hazards/index.php (accessed on 30 October 2015).
  2. Harris, A.J.L. Basaltic lava flow hazard. In Volcanic Hazards, Risks and Disaters; Papale, P., Ed.; Elsevier: Amsterdam, Netherlands, 2014; pp. 27–46. [Google Scholar]
  3. Ernst, G.G.J.; Kervyn, M.; Teeuw, R.M. Advances in the remote sensing of volcanic activity and hazards, with special consideration to applications in developing countries. Int. J. Remote Sens. 2008, 29, 6687–6723. [Google Scholar] [CrossRef]
  4. Kervyn, M.; Kervyn, F.; Goossens, R.; Rowland, S.K.; Ernst, G.G.J. Mapping volcanic terrain using high-resolution and 3D satellite remote sensing. Geol. Soc. Lond. Spec. Publ. 2007, 283, 5–30. [Google Scholar] [CrossRef]
  5. Lombardo, V.; Buongiorno, M.F. Lava flow thermal analysis using three infrared bands of remote-sensing imagery: A study case from Mount Etna 2001 eruption. Remote Sens. Environ. 2006, 101, 141–149. [Google Scholar] [CrossRef]
  6. Webley, P.W.; Lopez, T.M.; Ekstrand, A.L.; Dean, K.G.; Rinkleff, P.; Dehn, J.; Cahill, C.F.; Wessels, R.L.; Bailey, J.E.; Izbekov, P.; et al. Remote observations of eruptive clouds and surface thermal activity during the 2009 eruption of Redoubt volcano. J. Volcanol. Geotherm. Res. 2013, 259, 185–200. [Google Scholar] [CrossRef]
  7. Harris, A. Thermal Remote Sensing of Active Volcanoes: A User’s Manual; Cambridge University Press: Camridge, UK, 2013. [Google Scholar]
  8. Dietterich, H.R.; Poland, M.P.; Schmidt, D.A.; Cashman, K.V.; Sherrod, D.R.; Espinosa, A.T. Tracking lava flow emplacement on the east rift zone of Klauea, Hawaii, with synthetic aperture radar coherence. Geochem. Geophys. Geosyst. 2012, 13, 1–17. [Google Scholar] [CrossRef]
  9. Pieri, D.; Abrams, M. ASTER observations of thermal anomalies preceding the April 2003 eruption of Chikurachki volcano, Kurile Islands, Russia. Remote Sens. Environ. 2005, 99, 84–94. [Google Scholar] [CrossRef]
  10. Blackett, M. Early Analysis of Landsat-8 thermal infrared sensor imagery of volcanic activity. Remote Sens. 2014, 6, 2282–2295. [Google Scholar] [CrossRef]
  11. Lu, Z.; Rykhus, R.; Masterlark, T.; Dean, K.G. Mapping recent lava flows at Westdahl Volcano, Alaska, using radar and optical satellite imagery. Remote Sens. Environ. 2004, 91, 345–353. [Google Scholar] [CrossRef]
  12. Patrick, M.; Dehn, J.; Papp, K.; Lu, Z.; Dean, K.; Moxey, L.; Izbekov, P.; Guritz, R. The 1997 eruption of Okmok Volcano, Alaska: A synthesis of remotely sensed imagery. J. Volcanol. Geotherm. Res. 2003, 127, 87–105. [Google Scholar] [CrossRef]
  13. Rowland, S. Slopes, lava fow volumes, and vent distrubtions on Volcan Fernandina, Galapagos Islands. J. Geophys. Res. 1996, 101, 27657–27672. [Google Scholar] [CrossRef]
  14. Kahle, A.B.; Gillespie, A.R.; Abbott, E.A.; Abrams, M.J.; Walker, R.E.; Hoover, G.; Lockwood, J.P. Relative dating of Hawaiian lava flows using multispectral thermal infrared images: A new tool for geologic mapping of young volcanic terranes. J. Afr. Earth Sci. 1988, 93, 15239–15251. [Google Scholar] [CrossRef]
  15. Abrams, M.; Abbott, E.; Kahle, A. Combined use of visible, reflected infrared, and thermal infrared images for mapping Hawaiian lava flows. J. Geophys. Res. 1991, 96, 475–484. [Google Scholar] [CrossRef]
  16. Tarquini, S.; Favalli, M.; Mazzarini, F.; Isola, I.; Fornaciai, A. Morphometric analysis of lava flow units: Case study over LIDAR-derived topography at Mount Etna, Italy. J. Volcanol. Geotherm. Res. 2012, 235–236, 11–22. [Google Scholar] [CrossRef]
  17. Ramsey, M.S.; Fink, J.H. Estimating silicic lava vesicularity with thermal remote sensing: A new technique for volcanic mapping and monitoring. Bull. Volcanol. 1999, 61, 32–39. [Google Scholar] [CrossRef]
  18. Gaddis, L.R.; Mouginis-Mark, P.J.; Hayashi, J.N. Lava flow surface textures—SIR-B radar image texture, field observations, and terrain measurements. 1990, 56, 211–224. [Google Scholar]
  19. Campbell, B.A.; Shepard, M.K. Lava flow surface roughness and depolarized radar scattering. J. Geophys. Res. 1996, 101, 18941. [Google Scholar] [CrossRef]
  20. Li, L.; Canters, F.; Solana, C.; Ma, W.; Chen, L.; Kervyn, M. Discriminating lava flows of different age within Nyamuragira’s volcanic field using spectral mixture analysis. Int. J. Appl. Earth Obs. Geoinf. 2015, 40, 1–10. [Google Scholar] [CrossRef]
  21. Spinetti, C.; Mazzarini, F.; Casacchia, R.; Colini, L.; Neri, M.; Behncke, B.; Salvatori, R.; Buongiorno, M.F.; Pareschi, M.T. Spectral properties of volcanic materials from hyperspectral field and satellite data compared with LiDAR data at Mt. Etna. Int. J. Appl. Earth Obs. Geoinf. 2009, 11, 142–155. [Google Scholar] [CrossRef]
  22. Head, E.M.; Maclean, A.L.; Carn, S.A. Mapping lava flows from Nyamuragira volcano (1967–2011) with satellite data and automated classification methods. Geomat. Nat. Hazards Risk 2013, 4, 119–144. [Google Scholar] [CrossRef]
  23. Sgavetti, M.; Pompilio, L.; Meli, S. Reflectance spectroscopy (0.3–2.5 μm) at various scales for bulk-rock identification. Geosphere 2006, 2, 142–160. [Google Scholar] [CrossRef]
  24. Amici, S.; Piscini, A.; Neri, M. Reflectance spectra measurements of Mt. Etna: A comparison with multispectral/hyperspectral satellite. Adv. Remote Sens. 2014, 3, 235–245. [Google Scholar] [CrossRef]
  25. Stretch, R.C.; Viles, H.A. The nature and rate of weathering by lichens on lava flows on Lanzarote. Geomorphology 2002, 47, 87–94. [Google Scholar] [CrossRef]
  26. Rothery, D.A.; Lefevre, R.H. The causes of age dependent changes in the spectral response of lavas, Craters of the Moon, Idaho, U.S.A. Int. J. Remote Sens. 1985, 6, 1483–1489. [Google Scholar] [CrossRef]
  27. Abbott, E.A.; Gillespie, A.R.; Kahle, A.B. Thermal-infrared imaging of weathering and alteration changes on the surfaces of basalt flows, Hawai’i, USA. Int. J. Remote Sens. 2013, 34, 1–24. [Google Scholar] [CrossRef]
  28. Benedetti, M. Chemical weathering of basaltic lava flows undergoing extreme climatic conditions: The water geochemistry record. Chem. Geol. 2003, 201, 1–17. [Google Scholar] [CrossRef]
  29. Di Figlia, M.G.; Bellanca, A.; Neri, R.; Stefansson, A. Chemical weathering of volcanic rocks at the island of Pantelleria, Italy: Information from soil profile and soil solution investigations. Chem. Geol. 2007, 246, 1–18. [Google Scholar] [CrossRef]
  30. Yamasaki, S.; Sawada, R.; Ozawa, A.; Tagami, T.; Watanabe, Y.; Takahashi, E. Unspiked K-Ar dating of Koolau lavas, Hawaii: Evaluation of the influence of weathering/alteration on age determinations. Chem. Geol. 2011, 287, 41–53. [Google Scholar] [CrossRef]
  31. Ager, C.M.; Milton, N.M. Spectral reflectance of lichens and their effects on the reflectance of rock substrates. Geophysics 1987, 52, 898–906. [Google Scholar] [CrossRef]
  32. Rollin, E.; Milton, E.; Roche, P. The influence of weathering and lichen cover on the reflectance spectra of granitic rocks. Remote Sens. Environ. 1994, 50, 194–199. [Google Scholar] [CrossRef]
  33. Rees, W.G.; Tutubalina, O.V.; Golubeva, E.I. Reflectance spectra of subarctic lichens between 400 and 2400 nm. Remote Sens. Environ. 2004, 90, 281–292. [Google Scholar] [CrossRef]
  34. Pórtoles, F.J.; Torres, L.; Ribalaygua, J.; Monjo, R. Monthly rainfall maps for Tenerife (Canary Islands): Comparing interpolation methods under local climate conditions. In Proceedings of 11th Annual Meeting of the European Meteorological Society (EMS) and the 10th European Conference on Applications of Meteorology (ECAM), Berlin, Germany, 12–16 September 2011.
  35. Del Arco Aguilar, M.-J.; González-González, R.; Garzón-Machado, V.; Pizarro-Hernández, B. Actual and potential natural vegetation on the Canary Islands and its conservation status. Biodivers. Conserv. 2010, 19, 3089–3140. [Google Scholar] [CrossRef]
  36. Solana, M.C. Development of unconfined historic lava flow fields in Tenerife: Implications for the mitigation of risk from a future eruption. Bull. Volcanol. 2012, 74, 2397–2413. [Google Scholar] [CrossRef]
  37. Cabrera Lagunilla, P.; Hernández Pacheco, A. Las erupciones históricas de Tenerife (Canarias) en sus aspectos vulcanológicos, petrológico y geoquímico. Rev. Mater. Procesos Geol. 1987, 5, 143–182. (In Spanish) [Google Scholar]
  38. Tenerife Island Council Digital Atlas of Tenerife. Available online: http://atlastenerife.es/portalweb/en/download-area/informacion-general (accessed on 27 November 2014).
  39. Analytical Spectral Devices. Field Spec Pro User’s Guide; Analytical Spectral Devices: Boulder, CO, USA, 2002. [Google Scholar]
  40. Mazzarini, F.; Pareschi, M.T.; Favalli, M.; Isola, I.; Tarquini, S. Lava flow identification and aging by means of LiDAR intensity: The Mt. Etna case. J. Geophys. Res. 2007, 112. [Google Scholar] [CrossRef]
  41. Chen, J.; Blume, H.-P.; Beyer, L. Weathering of rocks induced by lichen colonization—A review. Catena 2000, 39, 121–146. [Google Scholar] [CrossRef]
  42. Aghamiri, R.; Schwartzman, D.W. Weathering rates of bedrock by lichens: A mini watershed study. Chem. Geol. 2002, 188, 249–259. [Google Scholar] [CrossRef]
  43. Morris, A.R.; Anderson, F.S.; Mouginis-mark, P.J.; Haldemann, A.F.C.; Brooks, B.A.; Foster, J. Roughness of Hawaiian volcanic terrains. J. Geophys. Res. 2008, 113, 1–20. [Google Scholar] [CrossRef]
  44. McCarroll, D. The schmidt hammer, weathering and rock surface roughness. Earth Surf. Process. Landf. 1991, 16, 477–480. [Google Scholar] [CrossRef]
  45. Medapati, R.S.; Kreidl, O.P.; MacLaughlin, M.; Hudyma, N.; Harris, A. Quantifying surface roughness of weathered rock—Examples from granite and limestone. In Geo-Congress 2013; Meehan, C., Pradel, D., Pando, M.A., Labuz, J.F., Eds.; American Society of Civil Engineers: San Diego, CA, USA, 2013; pp. 12–128. [Google Scholar]
  46. Thurmond, A.K.; Abdelsalam, M.G.; Thurmond, J.B. Optical-Radar-DEM remote sensing data integration for geological mapping in the Afar Depression, Ethiopia. J. Afr. Earth Sci. 2006, 44, 119–134. [Google Scholar] [CrossRef]
  47. Saleh, A. Soil roughness measurement-chain method. J. Soil Water Conserv. 1993, 48, 527–529. [Google Scholar]
  48. Karami, M.; Rangzan, K.; Saberi, A. Using GIS servers and interactive maps in spectral data sharing and administration: Case study of Ahvaz Spectral Geodatabase Platform (ASGP). Comput. Geosci. 2013, 60, 23–33. [Google Scholar] [CrossRef]
  49. Rolfson, D. Collection of endmembers and their separability for spectral unmixing in rangeland applications. Master Thesis, University of Lethbridge, Lethbridge, AL, Canada, 2010. [Google Scholar]
  50. Roberts, P.; Hueni, A.; Kuekenbrink, D. SPECCHIO User Guide; SPECCHIO: Zurich, Switzerland, 2014. [Google Scholar]
  51. NASA Landsat 7 Science Data Users Handbook. Available online: http://landsathandbook.gsfc.nasa.gov/pdfs/Landsat7_Handbook.pdf (accessed on 30 April 2015).
  52. Griffin, M.K.; May-Hsu, S.; Burke, H.K.; Orloff, S.M.; Upham, C.A. Examples of EO-1 Hyperion data analysis. Lincoln Lab. J. 2005, 15, 271–298. [Google Scholar]
  53. IDE Canarias Mapa Topográfico 1:5.000 Año 2009. Available online: http://www.idecanarias.es/listado_servicios/mapa-topografico-5000-a%C3%B1o-2009 (accessed on 1 December 2013).
  54. Richter, R.; Kellenberger, T.; Kaufmann, H. Comparison of topographic correction methods. Remote Sens. 2009, 1, 184–196. [Google Scholar] [CrossRef] [Green Version]
  55. Teillet, P.M.; Guindon, B.; Goodenough, D.G. On the slope-aspect correction of multispectral scanner data. Can. J. Remote Sens. 1982, 8, 84–106. [Google Scholar] [CrossRef]
  56. Drury, S. Digital image processing. In Image Interpretation in Geology; Nelson Thornes: Cheltenham, UK, 2001; p. 145. [Google Scholar]
  57. Pinty, B.; Lavergne, T.; Widlowski, J.L.; Gobron, N.; Verstraete, M.M. On the need to observe vegetation canopies in the near-infrared to estimate visible light absorption. Remote Sens. Environ. 2009, 113, 10–23. [Google Scholar] [CrossRef]
  58. Viña, A.; Gitelson, A.A.; Nguy-Robertson, A.L.; Peng, Y. Comparison of different vegetation indices for the remote assessment of green leaf area index of crops. Remote Sens. Environ. 2011, 115, 3468–3478. [Google Scholar] [CrossRef]
  59. Hunt, G.R. Spectral signatures of particulate minerals in the visible and near infrared. Geophysics 1977, 42, 501–513. [Google Scholar] [CrossRef] [Green Version]
  60. Clark, R.N.; Swayze, G.A.; Wise, R.; Livo, K.E.; Hoefen, T.M.; Kokaly, R.F.; Sutley, S.J. USGS Digital Spectral Library splib06a; U.S. Geological Survey: Reston, VA, USA, 2007. [Google Scholar]
  61. Rockwell, B.W. Spectral Variations in Rocks and Soils Containing Ferric Iron Hydroxide and(or) Sulfate Minerals as Seen by AVIRIS and Laboratory Spectroscopy; U.S. Geological Survey: Reston, VA, USA, 2004. [Google Scholar]
  62. Tayebi, M.H.; Tangestani, M.H.; Vincent, R.K. Sub-pixel mapping of iron-bearing minerals using ALI data and MTMF algorithm, Masahim volcano, SE Iran. Arab. J. Geosci. 2015, 8, 3799–3810. [Google Scholar] [CrossRef]
  63. Baldridge, A.M.; Hook, S.J.; Grove, C.I.; Rivera, G. The ASTER spectral library version 2.0. Remote Sens. Environ. 2009, 113, 711–715. [Google Scholar] [CrossRef]
  64. Drury, S. Electromagnetic radiation and materials. In Image Interpretation in Geology; Nelson Thornes: Cheltenham, UK, 2001; pp. 7–11. [Google Scholar]
  65. Kruse, F.A.; Boardman, J.W.; Huntington, J.F.; Mason, P.; Quigley, M.A. Evaluation and validation of EO-1 Hyperion for geologic mapping. In Proceedings of the IEEE International Geoscience and Remote Sensing Symposium (IGARSS 2002), Toronto, ON, Canada, 24–28 June 2002; pp. 593–595.
  66. Lockwood, J.P.; Lipman, P.W. Holocene eruptive history of Mauna Loa volcano. In Volcanism in Hawaii; U.S. Geological Survey: Reston, VA, USA; pp. 509–535.
  67. Minitti, M.E.; Mustard, J.F.; Rutherford, M.J. Effects of glass content and oxidation on the spectra of SNC-like basalts: Applications to Mars remote sensing. J. Geophys. Res. 2002, 107. [Google Scholar] [CrossRef]

