Early Analysis of Landsat-8 Thermal Infrared Sensor Imagery of Volcanic Activity

Centre for Disaster Management and Hazards Research, Coventry University, Priory Street, Coventry, CV1 5FB, UK
Remote Sens. 2014, 6(3), 2282-2295; https://doi.org/10.3390/rs6032282
Submission received: 18 October 2013
/
Revised: 21 February 2014
/
Accepted: 10 March 2014
/
Published: 12 March 2014
(This article belongs to the Special Issue Analysis of Remote Sensing Image Data)
Abstract
:The Landsat-8 satellite of the Landsat Data Continuity Mission was launched by the National Aeronautics and Space Administration (NASA) in April 2013. Just weeks after it entered active service, its sensors observed activity at Paluweh Volcano, Indonesia. Given that the image acquired was in the daytime, its shortwave infrared observations were contaminated with reflected solar radiation; however, those of the satellite’s Thermal Infrared Sensor (TIRS) show thermal emission from the volcano’s summit and flanks. These emissions detected in sensor’s band 10 (10.60–11.19 μm) have here been quantified in terms of radiant power, to confirm reports of the actual volcanic processes operating at the time of image acquisition, and to form an initial assessment of the TIRS in its volcanic observation capabilities. Data from band 11 have been neglected as its data have been shown to be unreliable at the time of writing. At the instant of image acquisition, the thermal emission of the volcano was found to be 345 MW. This value is shown to be on the same order of magnitude as similarly timed NASA Earth Observing System (EOS) Moderate Resolution Imaging Spectroradiometer thermal observations. Given its unique characteristics, the TIRS shows much potential for providing useful, detailed and accurate volcanic observations in the future.

1. Introduction
At the time of writing, the newest satellite for earth observation is Landsat-8, launched as part of the Landsat Data Continuity Mission (LDCM) on 11 April 2013. This is the most recent spacecraft of the Landsat series of satellites which have been in service since 1972. It was designed as a successor to the Landsat-7 Mission, being constructed and launched by the National Aeronautics and Space Administration (NASA) and operationally controlled by the US Geological Survey (USGS) [1]. The satellite is endowed with two earth-observation sensors: the Operational Land Imager (OLI), with spectral bands ranging from the visible to shortwave, largely for observing electromagnetic signals reflected from Earth’s surface, and the Thermal Infrared Sensor (TIRS), with two thermal infrared bands for Earth-emitted electromagnetic signal detection [2,3] (see Table 1). Like its predecessors, Landsat-8 has a temporal resolution of 16-days.
This paper examines the first thermally anomalous volcanic observation made by the TIRS, analysing an image acquired of Paluweh volcano, Indonesia (8.3288°S, 121.7091°E) little more than two weeks (on 29 April 2013) after its launch. It attempts to highlight the sensor’s potential for volcanic observations, and to use its data to quantify the thermal emission of the volcano at the instant of image acquisition. At the time of writing, data from the TIRS band 11 have been found to be unsuitable for quantitative analysis and as such, only that from band 10 is used here, following the application of the currently published constant offset correction [5].
2. Thermal Remote Sensing of Volcanic Activity
Since the 1960s, the infrared remote sensing of volcanoes has developed into a discipline in its own right. It commenced with largely qualitative observations from both aerial and space-borne platforms, e.g., [6,7], and has since developed into a quantitative discipline, utilising some of the most up to date and sensitive orbiting sensors to detect and monitor global volcanic activity (see [8] for an in depth review of current and future progress).
A common issue for all space-based sensors (thermal or otherwise) that are used to make volcanic observations is that none have been launched with the specific aim of volcanic remote sensing; this has simply been one of a number of possible applications for many such sensors. This remains the case for Landsat-8; in fact, the mission was not originally envisaged as possessing any thermal infrared detection capabilities at all [1]—something which would have severely hindered its utility for volcanic remote sensing. Fortunately however, the platform was ultimately provided with this capability in the later stages of its design. This means the LDCM continues to offer utility in all manner of applications which require thermal emission observations, and this is not simply restricted to volcanic observations but extends to the observation of other thermally anomalous phenomena including fires and urban heat islands [3,9].
Active volcanic surfaces are particularly amenable to their remote study using thermal infrared detectors by virtue of their emission of heat. Indeed, the thermal emissions of an active volcanic surface relate directly to the volcanic activity at a specific time, be it a fresh lava flow, active lava lake or a subtly warm fumarole field [10,11]. Examples of direct relationships between thermal infrared emissions and volcanic activity include the detection of cyclical volcanic emissions related to physical processes on the ground [12], the determination of lava effusion rates (e.g., [13,14]) and the discrimination of different activity styles and lava types [15]. Obviously one significant benefit of such studies is the potential to gather data while avoiding the risks and costs associated with on-the-ground volcanic fieldwork.
The reason for the direct relationship between thermal emissions and volcanic activity is that all objects above absolute zero (0 K) emit electromagnetic radiation at a wavelength and quantity that are each a function of the characteristics of the emitting surface in terms of its temperature and radiating efficiency (emissivity). As the temperature of a surface increases, so too does the radiance it emits; this is according to the Stefan-Boltzmann Law [16,17]:
where: E = radiant flux density (W·m−2·σ = Stefan-Boltzmann Constant (5.6697 × 10⁻⁸ W·m−2·K−4), ε = emissivity of the surface (unitless) and T = temperature of the surface as a greybody (K) (where a greybody is a non-perfect emitter of radiation as compared to a perfect emitter, otherwise called a blackbody). Consequently, a hotter volcanic surface will radiate more energy (i.e., a higher radiant flux density) than a cooler one, and variations in this value represent variations in volcanic activity on the ground.
The overall spectral radiance, Lλ, (in units of W·m−2·sr−1·μm−1), emitted by a blackbody at a particular temperature (T) and wavelength (λ), is given by the Planck Equation (2) [18]. This quantifies Wien’s Displacement Law which states that the spectral radiance emitted from a surface will increase with its temperature while at the same time, the chief emissions will become of shorter wavelength (Wien [19]):
Constants of C1 and C2 have stipulated values of 1.19 × 10⁻¹⁶ W·m−2·sr−1 and 1.44 × 10⁻² m·K, respectively [20].
3. The Landsat-8 TIRS and Volcanic Observations
The thermal infrared bands present on many satellite sensors have been widely used for the monitoring of volcanic ash plumes (e.g., [21]) and thermally anomalous volcanic phenomena on the ground (e.g., [11,22–24]) and as such, have a proven utility in volcanic monitoring. Despite this, until 2009, NASA had planned not to include any thermal infrared detectors on the Landsat-8 spacecraft and it was only due to lobbying by the US Western States Water Council that thermal detection capabilities of the new satellite were provided via the TIRS [1]. The TIRS detects thermal emissions from Earth’s surface in two separate bands: 10.60–11.19 μm and 11.50–12.51 μm (bands 10 and 11 respectively), effectively splitting the one thermal infrared band of the previous Thematic Mapper and Enhanced Thematic Mapper + sensors and in turn, providing data to allow for more accurate atmospheric corrections [25]. The 100 m spatial resolution of the TIRS bands is a retrograde step compared to the 60 m resolution of the previous Landsat ETM+ but was a necessary compromise given the shorter time-scale (only 3 years) for its development [1]. Despite this apparent retrograde step, the TIRS displays other advantages over its predecessor TIR Landsat sensors in that its imagery are collected in a “push-broom” manner (as compared with a “whisk broom” manner), which reduces the signal to noise ratio, its TIR bands have a greater dynamic range and the TIR imagery collected are combined with OLI imagery to form one registered image [1,26,27]. Unfortunately at the time of writing, data from the TIRS band 11 are of dubious reliability and we are advised not to use it for quantitative analysis [5]. The band 10 TIRS image of Paluweh Volcano on 29 April 2013 is shown in Figure 1 ([28]).
The spectral range of sensitivity within which the TIRS bands operate, and the temperature ranges they are capable of detecting, are shown in Figure 2, overlain on Planck Function curves displaying the infrared emissions from surfaces at a range of temperatures. Evidently, the TIRS bands are particularly sensitive to surfaces at temperatures of 320–350 K, whereas for molten temperatures (e.g., >900 K), the use of shortwave infrared (SWIR) and mid-infrared (MIR) bands would be more appropriate. Although 320–350 K might initially appear a low temperature when viewing an active volcanic surface, the 10,000 m2 pixels of the TIRS are likely to be heterogeneous and to view surfaces displaying a range of temperatures associated with both active (and relict) volcanism and also unaffected ground and vegetation. Additionally, the presence of a lava dome at the volcano [29] suggests that only a very small proportion of the surface (i.e., cracks in the chilled lava dome surface) will be of incandescent temperature [30–32]. As such, the overall temperature detected at the pixel scale (the pixel integrated temperature, or PIT) is likely to average out at significantly below incandescence and quite possibly at around 320–350 K. This is corroborated by Figure 3a, which simulates a range of volcanic-like surfaces consisting of a hot component (at varying temperature) and a cooler component (at 300 K), each of varying proportions, that would produce a PIT at the peak of detection for TIRS bands: 360 K [1], and also by Figure 3b which displays the range of PITs that the individual pixel detection components of the TIRS would detect on viewing a variety of configurations of simulated volcanic-like surfaces, again assuming two surface components: a hot component of varying temperature and a cooler component of 300 K. The detection capabilities of the thermal infrared bands to surfaces at ambient temperature does mean, however, that these ambient emissions must be removed from those of the brighter volcanic pixels to retrieve the purely anomalous radiant emissions attributable solely to volcanic activity.
4. Methods
The first Landsat-8 image of an active volcano was acquired on 29 April 2013, at 10.00 Eastern Indonesia time (02.00 UTC). This image, in all 11 bands, was downloaded from the United States Geological Survey’s Global Visualisation Viewer [28]. Data from the TIRS band 10 was extracted and contrast enhanced to allow for the isolation of pixels attributable to volcanic heat emissions; these were bright compared with pixels imaging the non-active surroundings and the associated volcanic ash plume (Figure 1). To ensure the complete radiant signal from the volcanically active surface was captured, while minimising contributions from non-volcanic regions, a region fully encompassing the surface emitting anomalous volcanic radiant signals, and also including a portion of the non-volcanically active surroundings, and a small part of the associated ash plume, was extracted (i.e., the rectangular region outlined in red in Figure 1).
Individual pixel data from the extracted region were converted to top of atmosphere (TOA) radiance (LTOA, W·m2·sr−1·μm−1) following:
where: ML = rescaling factor (3.342 × 10⁻⁴ for Landsat-8 band 10); Qcal = pixel digital number (DN) values and AL = rescaling factor (0.1 for Landsat-8 band 10) [33]. Subsequent calibrations have shown that the subtraction of an additional 0.29 W·m2·sr−1·μm−1 will correct for discrepancies in band 10 calibrations [5] and as such, this step was also applied.
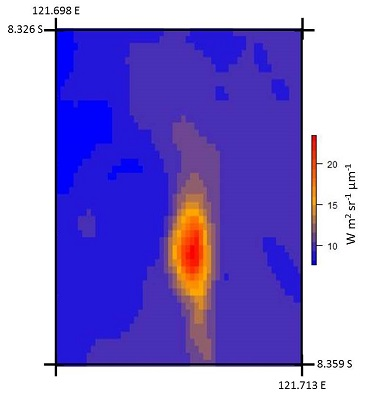
The TOA spectral radiances associated with the extracted region are shown in Figure 4. Here it should be acknowledged that the radiance associated with each pixel is a pixel integrated value for the heterogeneous surface; that is, an average of the emissions over the whole of the pixel area which might include thermally anomalous volcanic and non-thermally anomalous sources (see Figure 3 for a representation of such a pixel). In examining this dataset, only one pixel displayed the maximum detectable radiant signal (360 K), potentially suggesting saturation. Where saturation does occur in such a dataset, it often results in an underestimation of the radiant signal, thereby hindering accurate quantitative analyses [24]. This limited presence of saturation here is encouraging therefore, as it suggests that for similar volcanic surfaces and TIRS observations, saturation might also be avoided thereby facilitating quantitative analyses.
Top of atmosphere values provide an indication of the temperatures at the surface but, being at an altitude of 708 km in the case of Landsat-8, to accurately determine the emissions of energy actually leaving the surface and hence, the true PIT at the surface, the radiant signal must be corrected for the influence of the atmosphere that it has passed through; the emissivity of the emitting surface must also be considered. The emissivity of a surface is the ratio of the radiance it emits to the radiance that a blackbody would emit at the same temperature, and its value for the volcanic surface at Paluweh was selected as 0.982. This value was derived from the NASA Moderate Resolution Imaging Spectroradiometer [MODIS] Land Surface Temperature and Emissivity Product, MOD11A1 [34], obtained from [28] for the day and surface in question. Although this value derives from a larger (1000 m × 1000 m) MODIS pixel, it is comparable to emissivity values derived at other volcanic sites [35].
The influence of the atmosphere is in terms of its attenuation and augmentation of the surface emitted radiant signal. To determine the transmissivity (τ) of the atmosphere to TIRS band 10 signals, the MODO v. 4 software (a graphical user interface to the MODTRAN atmospheric transmission correction code) was used, initialised with surface level data, a tropical atmosphere and using the precise spectral response for this band (from: [36]). An online simulation (as described in [37]) was then run to retrieve the corresponding upwelling (Lu) and downwelling (Ld) atmospheric radiance components. The outputs were: τ = 0.77, Lu = 2.28 W·m2·sr−1·μm−1 and Ld = 3.62 W·m2·sr−1·μm−1.
Using these data, the spectral radiance leaving the emitting surface at temperature T (K) (Lλ, W·m2·sr−1·μm−1) could be calculated by rearranging the following equation from [37]:
This was then then converted to brightness temperature using the inverse of the Planck Equation (5) where λ = the central band 10 bandpass, i.e., 10.95 μm:
These procedures were applied for all pixels within the extracted region. In a nighttime Landsat 8 image, it would have been possible to do this by simply isolating the corresponding anomalously radiant pixels in the associated OLI SWIR imagery (i.e., following [38]), however because of the presence of reflected sunlight, this was not possible. As such, following [32] in the analysis of ASTER TIR imagery of Bezymianny volcano, Russia, the background temperature of the bands in question was obtained by averaging that of surrounding, clearly non-volcanic pixels within the extracted region of Figure 1 (
). Care was taken to ensure those pixels chosen for this purpose did not represent the cooler volcanic plume.
To objectively isolate only those pixels truly representing the thermally anomalous surface, the standard deviation of the same, clearly non-volcanic pixels (σbg10) was also determined, with the aim of representing the “normal” background temperature variability. Only pixels within the extracted region, with temperatures greater than
, were extracted as thermally anomalous. Although the use of 3 × σ is rather arbitrary, examination showed it to satisfactorily isolate just volcanically active pixels which are outlined in blue in Figure 1 and the brightness temperatures of which are shown in Figure 5. This method compares with that used by [39], although using their 2 × σ value in this case would have left, unmasked, discrete areas within the background far from the main thermal anomaly and as such, unlikely to have been related to the volcanic activity.
The total radiant flux density associated with the thermally anomalous pixels isolated (Q in W), and that associated with the values of
(i.e., Qbg10), was then calculated using the Stefan Boltzman equation (Equation (1)) incorporating both the pixel brightness temperature (T in K) and area (A, 10,000 m2):
From the data of the isolated thermally anomalous pixels, the corresponding Qbg10 was subtracted, to leave behind a radiant flux density value theoretically attributable only to the volcanic processes at the surface. These retrievals were summed to produce a radiant power value for the surface which related to the instant the image was acquired. Given that this retrieval relates only to one observation, we unfortunately cannot use it to make any assumptions as to variations in the volcano’s activity over time [40], although it provides both a useful snapshot of the volcano’s activity and a glimpse at the potential utility that such observations will have in the future. In terms of accuracy, that of this retrieval will be heavily dependent on the accuracy of the data incorporated into the calculations. As such, a sensitivity analysis was conducted into the influence of these variables on the retrievals. With regard to transmissivity and emissivity, amending the values by a certain percentage changed the retrieval by a similar proportion. In contrast, changing the upwelling and or downwelling values had a negligible effect on overall retrievals.
5. Results
The retrieval of radiant power for the thermally anomalous pixels at Paluweh was 345 MW for the TIRS band 10. Given such data, previous workers have often gone on to calculate lava effusion rates. This is not done here as the data are based on just one observation and [41] shows that variations in lava effusion rates may occur over timescales of tens of minutes, suggesting that such instantaneous readings might not be truly representative. However, the instantaneous value does provide a useful indicator against which the volcano’s activity can be compared with similar data recorded at other volcanoes. For example, [42] shows that for Lascar volcano, Chile, 2001–2005, which similarly to Paluweh displays lava dome activity, radiant power emissions reached nearly 70 MW. Such thermal emissions compare less favourably with those of other sorts of volcanic activity with, for example [43] showing, for throughout 2001, emissions reaching 2250 MW at Kilauea and 10,000 MW at Mount Etna.
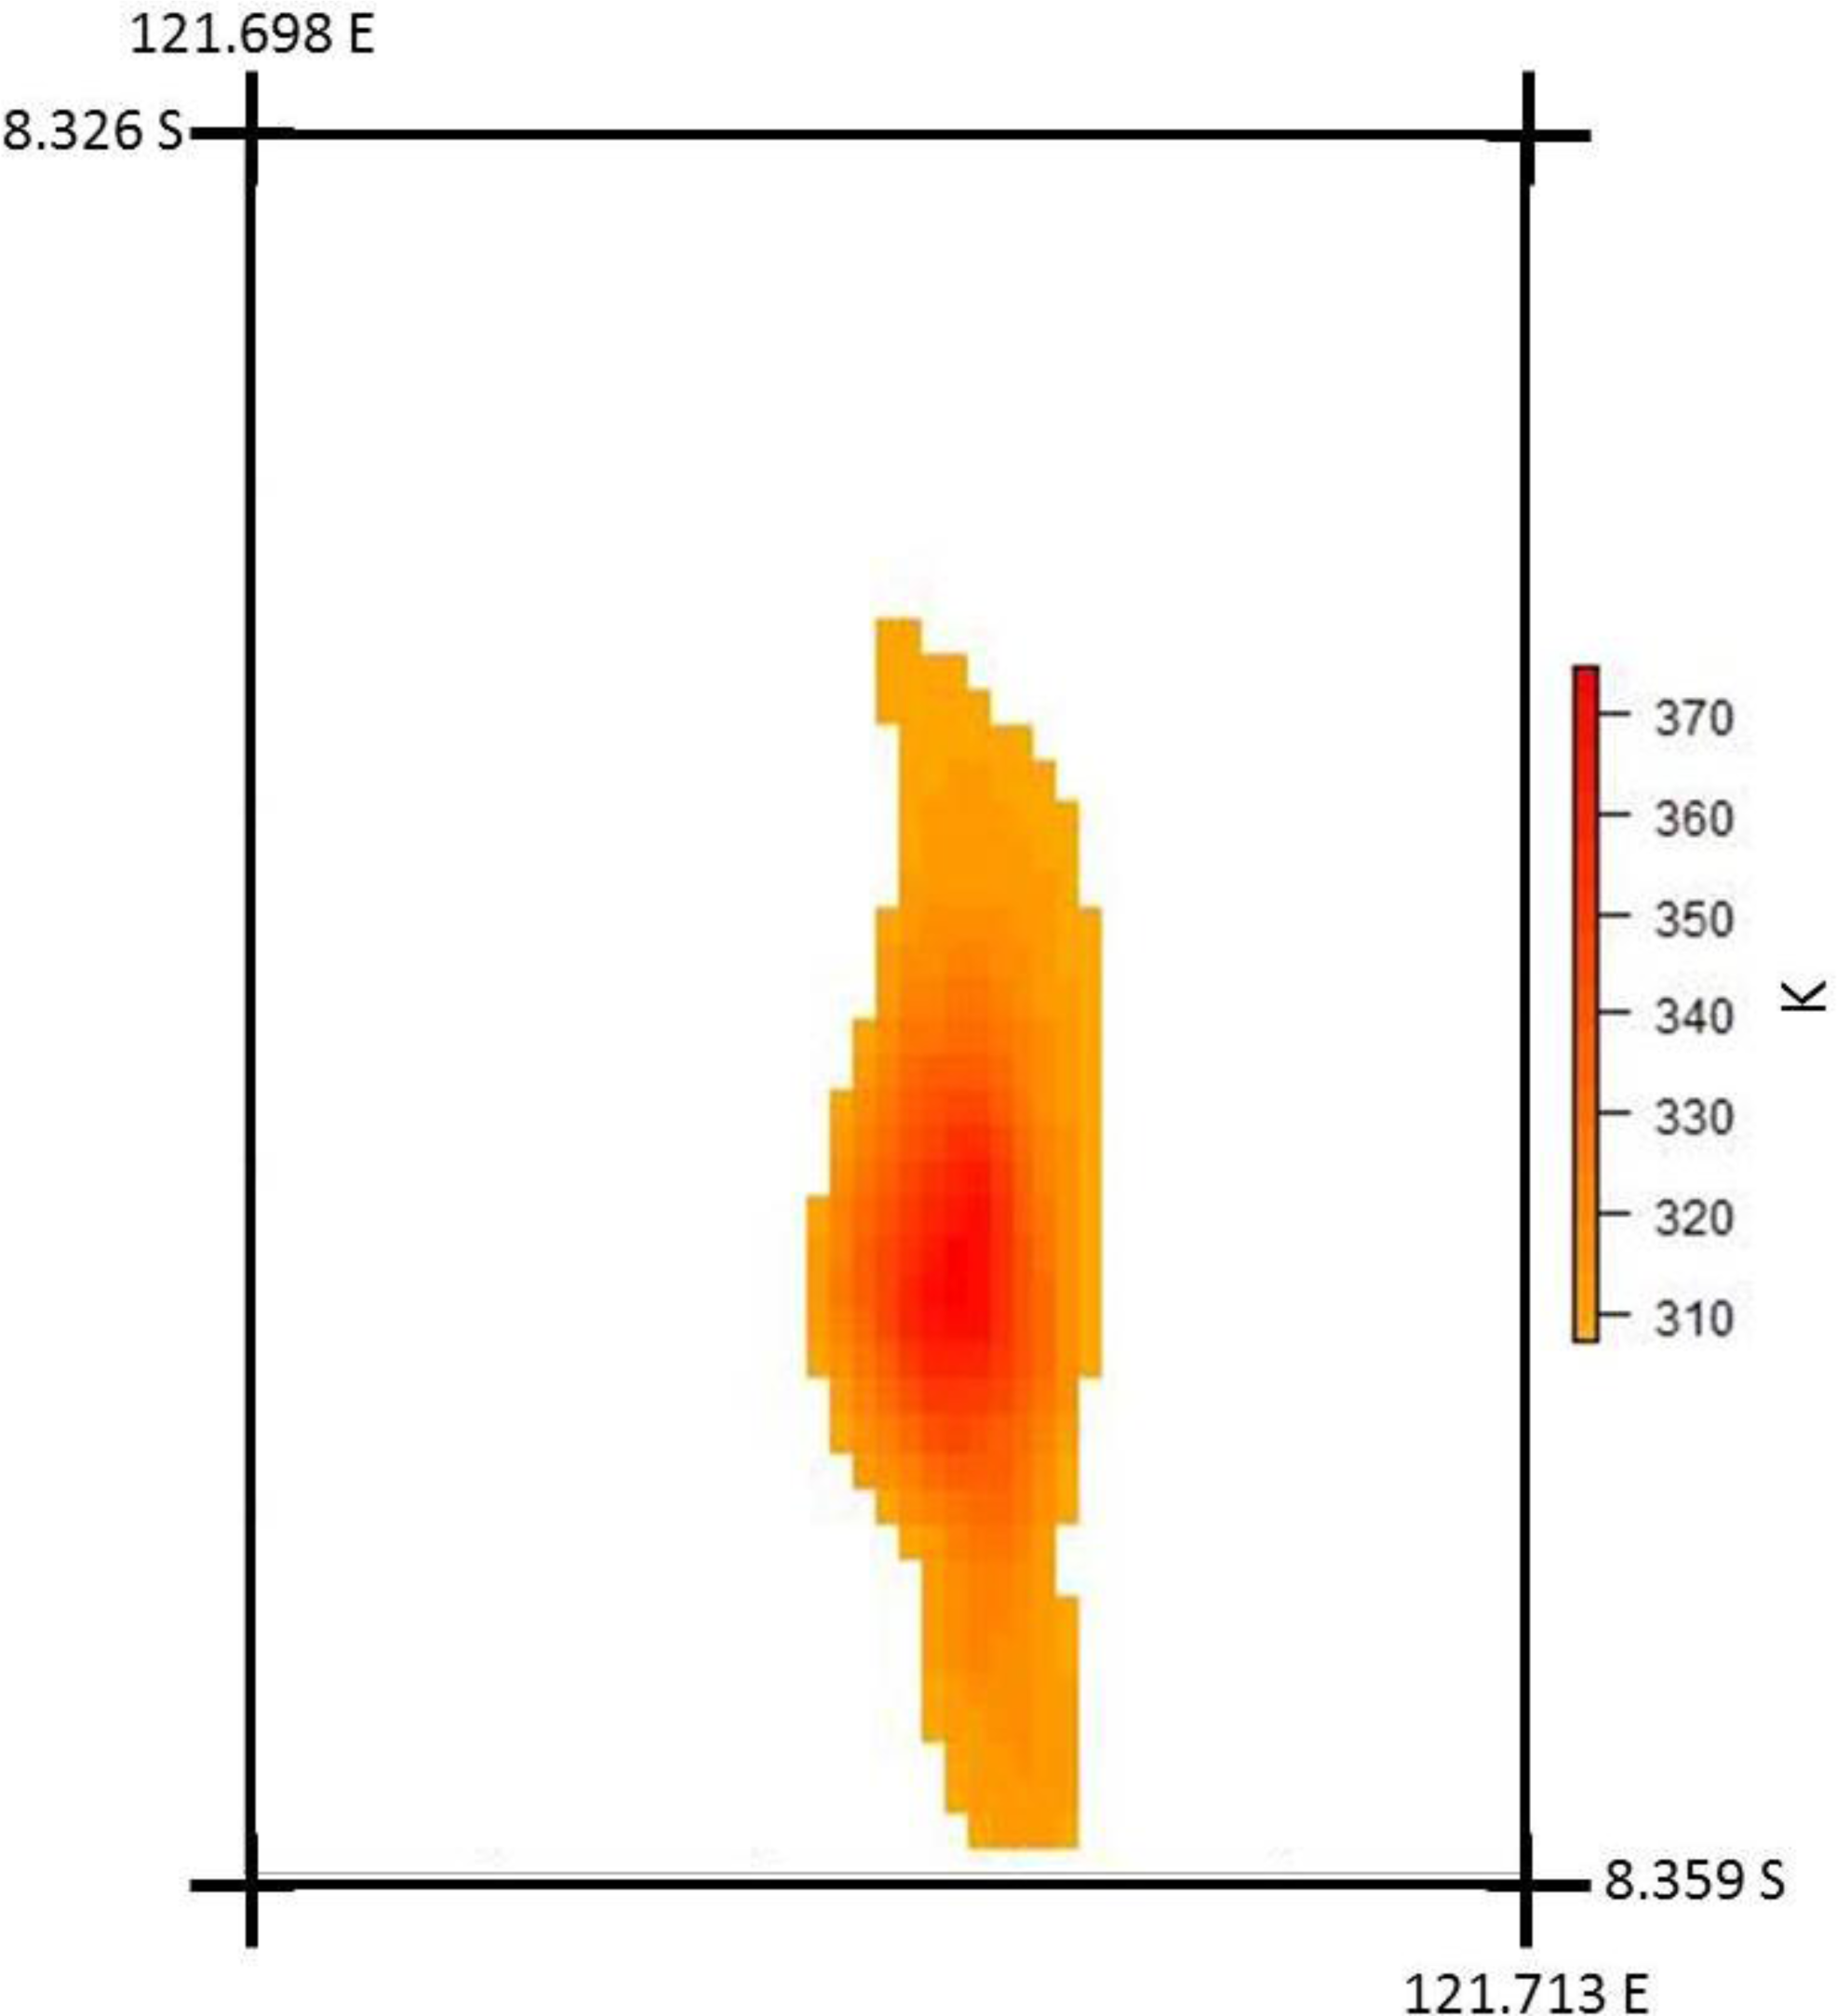
The thermal anomaly isolated in the Landsat-8 image of Paluweh was spread over 264 pixels (2.64 km2) (Figure 5). Given the intensity of the anomalous surface towards its northern centre, this precise area is assumed to represent the active lava dome, with the cooler pixels stemming north and south from it most likely representing active and/or cooling pyroclastic flows that were reported as associated with the eruption [29].
Unfortunately, Paluweh is a relatively under studied and remote volcano and, as such, no ground measurements are available to corroborate the values determined here. However, what is available are observations acquired from other sensors. As such, data from the MODIS Fire Product (MOD14A1) were acquired from [28]. This product identifies potential fire (or thermally anomalous volcanic) pixels and, for those classified as such, outputs the corresponding radiant power emissions based on volcanic MIR detections as compared with detections from adjacent non-anomalous pixels [44,45]. Extraction of the relevant MOD14A1 data for Paluweh for a two week period around this Landsat-8 acquisition showed retrievals of up to 258.3 MW. This is obviously within the same order of magnitude but lower than the TIRS retrieval. There are a number of possible reasons for this apparent underestimation. Firstly, the MOD14A1 product is derived from mid-infrared observations (around 4 μm) [44]. Surfaces emitting chiefly in this region of the spectrum are of particularly high temperature and such temperatures might not have been reached over large areas at Paluweh. Secondly, the pixels of MODIS are 1000 m × 1000 m and hence, one hundred times the size of those of the TIRS. As such, emissions from non-volcanic (i.e., non-thermally anomalous) surfaces are likely to dominate detections, as opposed to those from active surfaces. Thirdly, at the time of MODIS image acquisitions, the volcanic plume may have obscured the surface.
6. Conclusion
Given its compliment of thermal infrared bands, the LCDM provides an appropriate continuation in the thermal detection capabilities of the Landsat range of satellites, and with their increased number and improved signal to noise ratio and dynamic range, as compared with previous TIR Landsat bands, they show potential for the acquisition of highly accurate data. Its first observation of volcanic activity on 29 April 2013 (just two weeks after its launch) has been shown to provide useful quantitative data relating to the activity of the volcano at the time. This paper however, is just an initial examination of the first available active volcanic Landsat-8 observation and there is much more which now needs to be studied, including examining some of its more recent imagery (now that the satellite is out of its 100-day commissioning period [46]), using the sensor’s SWIR bands in night time volcanic imagery, applying dual band techniques to its data to glean a sub-pixel impression of volcanic activity and utilising, together, its TIR and OLI data which are combined within one image in its Level 1 products. There is also the opportunity, once the calibrations problems of the TIRS band 11 are rectified, of using the satellite’s two thermal bands for application of split-window algorithms, something never before possible with only one TIR band on previous Landsat satellites, and for deriving a timeseries of observations from which the derivation of varying lava effusion rates might be derived more appropriately than with just one image.
Other sun-synchronous satellites with TIR observation capabilities have fewer bands (e.g., Landsat-7), a poorer spatial resolution (e.g., AVHRR) or have actually surpassed their planned lifetimes (e.g., the NASA Terra and Aqua satellites which host the Advanced Spaceborne Thermal Emission and Reflection Radiometer [ASTER] and MODIS sensors). As such, LCDM TIRS observations are likely to increase in value in the coming years. With its three year lifetime, the TIRS bands will not provide the continuity of data to which we have become accustomed but, given their high quality and resolution, the remote sensing community must take every opportunity to analyse and interpret the data they acquire for the furtherance of volcanic knowledge, to inform future sensor design and to highlight the utility of TIR bands for new and planned Earth-observation spacecraft.
Acknowledgments
The author acknowledges the USGS for making Landsat-8 data available via its Global Visualization Viewer (Glovis) so rapidly after its launch. The author also acknowledges the use of the MODO v.4 software from ReSe-Remote Sensing Software Applications.
Conflicts of Interest
The authors declare no conflict of interest.
References
- Irons, J.R.; Dwyer, J.L.; Barsi, J.A. The next Landsat satellite: The Landsat Data Continuity Mission. Remote Sens. Environ 2012, 122, 11–21. [Google Scholar]
- Irons, J.R.; Dwyer, J.L. An overview of the Landsat Data Continuity Mission. Proc. SPIE 2010, 7695. [Google Scholar] [CrossRef]
- Thome, K.; Reuter, D.; Lunsford, A.; Montanaro, M.; Smith, R.; Tesfaye, Z.; Wenny, B. Calibration of the Thermal Infrared Sensor on the Landsat Data Continuity Mission. Proceedings of 2011 IEEE International Geoscience and Remote Sensing Symposium (IGARSS), Vancouver, BC, Canada, 24–29 July 2011; pp. 985–988.
- USGS. Frequently Asked Questions about the Landsat Missions. 2013. Available online: http://landsat.usgs.gov/band_designations_landsat_satellites.php (accessed on 31 July 2013).
- USGS Landsat Missions. Landsat 8 (L8) Operational Land Imager (OLI) and Thermal Infrared Sensor (TIRS) Calibration Notices. 2014. Available online: http://landsat.usgs.gov/calibration_notices.php (accessed on 25 January 2014).
- Fisher, W.A.; Mozham, R.M.; Polcyn, F.; Landis, G.H. Infrared surveys of Hawaiian Volcanoes. Science 1964, 146, 733–742, (Abstract). [Google Scholar]
- Gawarecki, S.J.; Lyon, R.J.P.; Nordberg, W. Infrared spectral returns and imagery of the Earth from space and their application to geological problems: Scientific experiments for manned orbital flight. Am. Astronaut. Soc. Sci. Tech 1965, 4, 13–33. [Google Scholar]
- Ramsey, M.S.; Harris, A.J.L. Volcanology 2020: How will thermal remote sensing of volcanic surface activity evolve over the next decade? J. Volcanol. Geothermal Res 2012. [Google Scholar] [CrossRef]
- Smith, R.L.; Thome, K.; Richardson, C.; Irons, J.; Reuter, D. Terrestrial Applications of the Thermal Infrared Sensor, TIRS; NASA Goddard Space Flight Center Technical Report 20100003053; NASA: Greenbelt, MD, USA, 2009. [Google Scholar]
- Rothery, D.A.; Francis, P.W.; Wood, C.A. Volcano monitoring using short wavelength infrared data from satellites. J. Geophys. Res 1998, 93, 7993–8008. [Google Scholar]
- Glaze, L.; Francis, P.W.; Rothery, D.A. Measuring thermal budgets of active volcanoes by satellite sensing. Nature 1989, 338, 144–146. [Google Scholar]
- Wooster, M.J.; Rothery, D.A. Thermal monitoring of Lascar Volcano, Chile, using infrared data from the along-track scanning radiometer: A 1992–1995 time series. Bull. Volcanol 1997, 58, 566–579. [Google Scholar]
- Harris, A.J.L.; Flynn, L.P.; Keszthelyi, L.; Mouginis-Mark, P.J.; Rowland, S.K.; Resing, J.A. Calculation of lava effusion rates from Landsat TM data. Bull. Volcanol 1998, 60, 52–71. [Google Scholar]
- Hirn, B.; Di Bartola, C.; Laneve, G.; Cadau, E.; Ferrucci, F. SEVIRI Onboard Meteosat Second Generation, and the Quantitative Monitoring of Effusive Volcanoes in Europe and Africa. Proceedings of 2008 IEEE International Geoscience and Remote Sensing Symposium (IGARSS), Boston, MA, USA, 7–11 July 2008; pp. 374–377.
- Wright, R.; Glaze, L.; Baloga, S.M. Constraints on determining the eruption style and composition of terrestrial lavas from space. Geology 2011, 39, 1127–1130. [Google Scholar]
- Stefan, J. Über die Beziehung zwischen der Wärmestrahlung und der Temperatur. Sitzungsberichte der mathematisch-naturwissenschaftlichen Classe der kaiserlichen Akademie der Wissenschaften 1897, 79, 391–428. [Google Scholar]
- Boltzmann, L. Ableitung des Stefan'schen Gesetzes, betreffend die Abhängigkeit der Wärmestrahlung von der Temperatur aus der electromagnetischen Lichttheorie. Annalen der Physik und Chemie 1884, 22, 291–294. [Google Scholar]
- Planck, M. On the law of distribution of energy in the normal spectrum. Annalen der Physik 1901, 4, 553–563. (In German) [Google Scholar]
- Wien, W. Uber die Energieverteilung in Emissionspektrum eines schwarzen Korpers. Ann. Phys 1896, 58, 662–669. [Google Scholar]
- Wooster, M.J. Small-scale experimental testing of fire radiative energy for quantifying mass combusted in natural vegetation fires. Geophys. Res. Lett 2002. [Google Scholar] [CrossRef]
- Pieri, D.; Abrams, M. ASTER watches the world’s volcanoes: A new paradigm for volcanological observations from orbit. J. Volcanol. Geothermal Res 2004, 135, 13–28. [Google Scholar]
- Ramsey, M.S.; Dehn, J. Spaceborne observations of the 2000 Bezymianny, Kamchatka eruption: The integration of high-resolution ASTER data into near real-time monitoring using AVHRR. J. Volcanol. Geothermal Res 2004, 135, 127–146. [Google Scholar]
- Solikhin, A.; Thouret, J.; Gupta, A.; Harris, A.J.L.; Liew, S. Geology, tectonics, and the 2002–2003 eruption of the Semeru Volcano, Indonesia: Interpreted from high-spatial resolution satellite imagery. Geomorphology 2012, 138, 364–379. [Google Scholar]
- Oppenheimer, C.; Rothery, D.A.; Francis, P.W. Thermal distributions at fumarole fields: Implications for infrared remote sensing of active volcanoes. J. Volcanol. Geothermal Res 1993, 55, 97–115. [Google Scholar]
- Reuter, D.; Richardson, C.; Irons, J.; Allen, R.; Anderson, M.; Budinoff, J.; Casto, G.; Coltharp, C.; Finneran, P.; Forsbacka, B.; et al. The Thermal Infrared Sensor on the Landsat Data Continuity Mission. Proceedings of 2010 IEEE International Geoscience and Remote Sensing Symposium (IGARSS), Hoholulu, HI, USA, 25–30 July 2010; pp. 754–757.
- Markham, B.; Reuter, D.; Montanaro, M.; Lunsford, A.; Barsi, J.; Hook, S.; Schott, S.; Raqueno, N. Landsat-8(formerly LDCM): Mission Update and Thermal Infrared Sensor (TIRS) Initial Post Launch Performance (Abstract). Proceedings of Conference on Characterization and Radiometric Calibration for Remote Sensing (CALCON), Logan, UT, USA, 19–22 August 2013.
- Schott, J.; Gerace, A.; Brown, S.; Gartley, M.; Montanaro, M.; Reuter, D.C. Simulation of image performance characteristics of the Landsat Data Continuity Mission (LDCM) Thermal Infrared Sensor (TIRS). Remote Sens 2012, 4, 2477–2491. [Google Scholar]
- Glovis. USGS Global Visualization Viewer. 2013. Available online: http://glovis.usgs.gov/ (accessed on 31 July 2013).
- Paluweh Volcano (Lesser Sunda Islands, Indonesia): News & Updates. 2013. Available online: http://www.volcanodiscovery.com/paluweh/news.html (accessed on 31 July 2013).
- Harris, A.J.L.; Rose, W.I.; Flynn, L.P. Temporal trends in lava dome extrusion at Santiaguito 1922–2000. Bull. Volcanol 2003, 65, 77–89. [Google Scholar]
- Sahetapy-Engel, S.M.; Flynn, L.P.; Harris, A.J.L.; Bluth, G.; Rose, W.I. Surface temperature and spectral measurements at Santiaguito lava dome, Guatemala. Geophys. Res. Lett 2004, 31, L19610. [Google Scholar]
- Carter, A.J.; Girina, O.; Ramsey, M.S.; Demyanchuk, Y. ASTER and field observations of the 24 December 2006 eruption of Bezymianny Volcano, Russia. Remote Sens. Environ 2008, 112, 2569–2577. [Google Scholar]
- USGS. Using the USGS Landsat 8 Product. 2013. Available online: https://landsat.usgs.gov/Landsat8_Using_Product.php (accessed on 31 July 2013).
- Wan, Z.; Zhang, Y.; Zhang, Q.; Li, Z.L. Validation of the land-surface temperature products retrieved from Terra Moderate Resolution Imaging Spectroradiometer data. Remote Sens. Environ 2002, 83, 163–180. [Google Scholar]
- Harris, A.J.L. Thermal Remote Sensing of Active Volcanoes: A User’s Manual; Cambridge University Press: Cambridge, UK, 2013. [Google Scholar]
- USGS Landsat Missions. Using the USGS Spectral Viewer. 2014. Available online: http://landsat.usgs.gov/instructions.php (accessed on 1 February 2014).
- Barsi, J.A.; Schott, J.R.; Palluconi, F.D.; Hook, S.J. Validation of a web-based atmospheric correction tool for single thermal band instruments. Proc. SPIE 2005. [Google Scholar] [CrossRef]
- Rothery, D.A.; Coltelli, M.; Pirie, D.; Wooster, M.J.; Wright, R. Documenting surface magmatic activity at Mount Etna using ATSR remote sensing. Bull. Volcanol 2001, 63, 387–397. [Google Scholar]
- Murphy, S.M.; de Souza Filho, C.R.; Oppenheimer, C. Monitoring volcanic thermal anomalies from space: Size matters. J. Volcanol. Geothermal Res 2011, 203, 48–61. [Google Scholar] [Green Version]
- Harris, A.J.L.; Dehn, J.; Calvari, S. Lava effusion rate definition and measurement: A review. Bull. Volcanol 2007, 70, 1–22. [Google Scholar]
- Bailey, J.E.; Harris, A.J.L.; Dehn, J.; Calvari, S.; Rowland, S.K. The changing morphology of an open lava channel on Mt. Etna. Bull. Volcanol 2006, 68, 497–515. [Google Scholar] [Green Version]
- Blackett, M. Review of the Utility of Infrared Remote Sensing for Detecting and Monitoring Volcanic Activity with the Case Study of Shortwave Infrared Data for Lascar Volcano from 2001–2005. In Remote Sensing of Volcanoes and Volcanic Processes: Integrating Observation and Modelling; Pyle, D.M., Mather, T.A., Biggs, J., Eds.; Special Publication 380; Geological Society London: London, UK, 2013; pp. 107–135. [Google Scholar]
- Wright, R; Flynn, L.P. A space-based estimate of the volcanic heat flux into the atmosphere during 2001 and 2002. Geology 2004, 32, 189–192. [Google Scholar]
- Justice, C.O.; Giglio, L.; Korontzi, S.; Owens, J.; Morisette, J.T.; Roy, D.P.; Descloitres, J.; Alleaume, S.; Petitcolin, F.; Kaufman, Y. The MODIS fire products. Remote Sens. Environ 2002, 83, 244–262. [Google Scholar]
- Giglio, L.; Descloitres, J.; Justice, C.O.; Kaufman, Y.J. An enhanced contextural fire detection algorithm for MODIS. Remote Sens. Environ 2003, 87, 273–282. [Google Scholar]
- USGS. Landsat 8 Mission Updates. 2013. Available online: http://www.nasa.gov/mission_pages/landsat/main/mission-updates.html (accessed on 17 October 2013).
Figure 1.
Landsat-8 band 10 image of Paluweh Volcano on 29 April 2013. The volcano forms an island in the Flores Sea to the north of the Indonesia island of Flores. Evident here are bright regions to the centre and south of the landform which constitute the thermally anomalous activity at the volcano. To the west, the plume emanating from the volcano can be seen as a darker (cooler) region. The rectangular region outlined in red is that which was extracted for analysis. It encompasses the anomalous volcanic radiant signals, here outlined in blue, and also a portion of the non-volcanically active surroundings and a small part of the associated ash plume. Image source: [28].
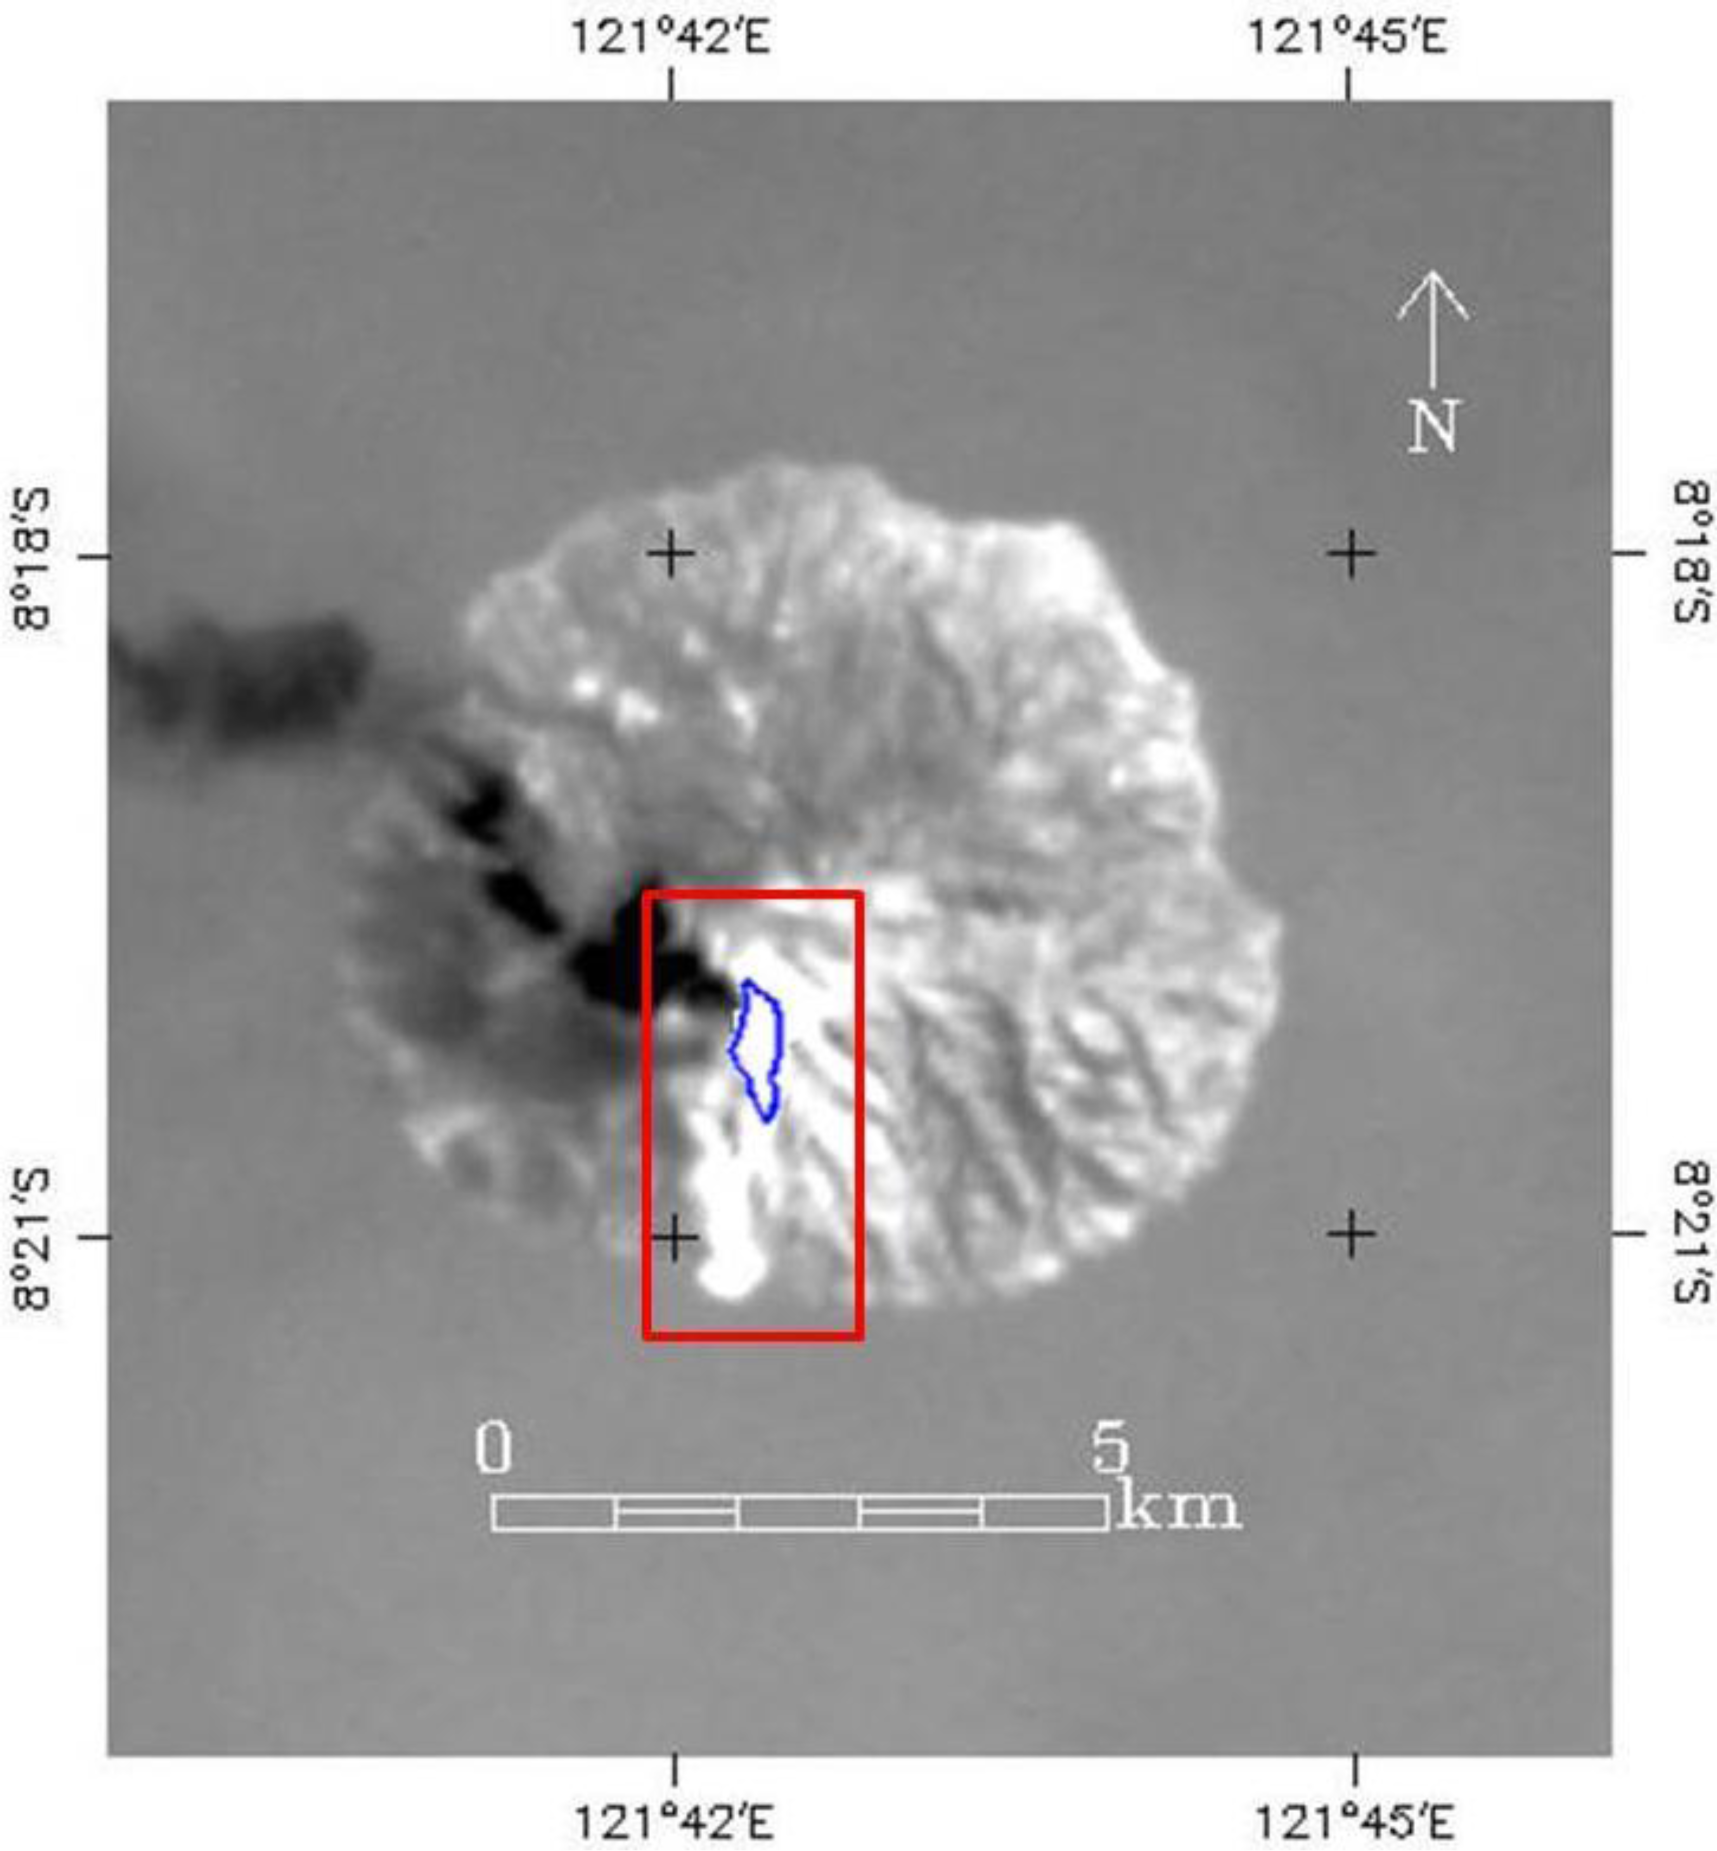
Figure 2.
The spectral range of sensitivity within which the TIRS bands (Landsat-8 bands 10 and 11) operate, overlain on the Planck Function displaying the temperature range these bands are capable of detecting and, for comparison, the infrared emissions from surfaces at a range of temperatures.
Figure 2.
The spectral range of sensitivity within which the TIRS bands (Landsat-8 bands 10 and 11) operate, overlain on the Planck Function displaying the temperature range these bands are capable of detecting and, for comparison, the infrared emissions from surfaces at a range of temperatures.
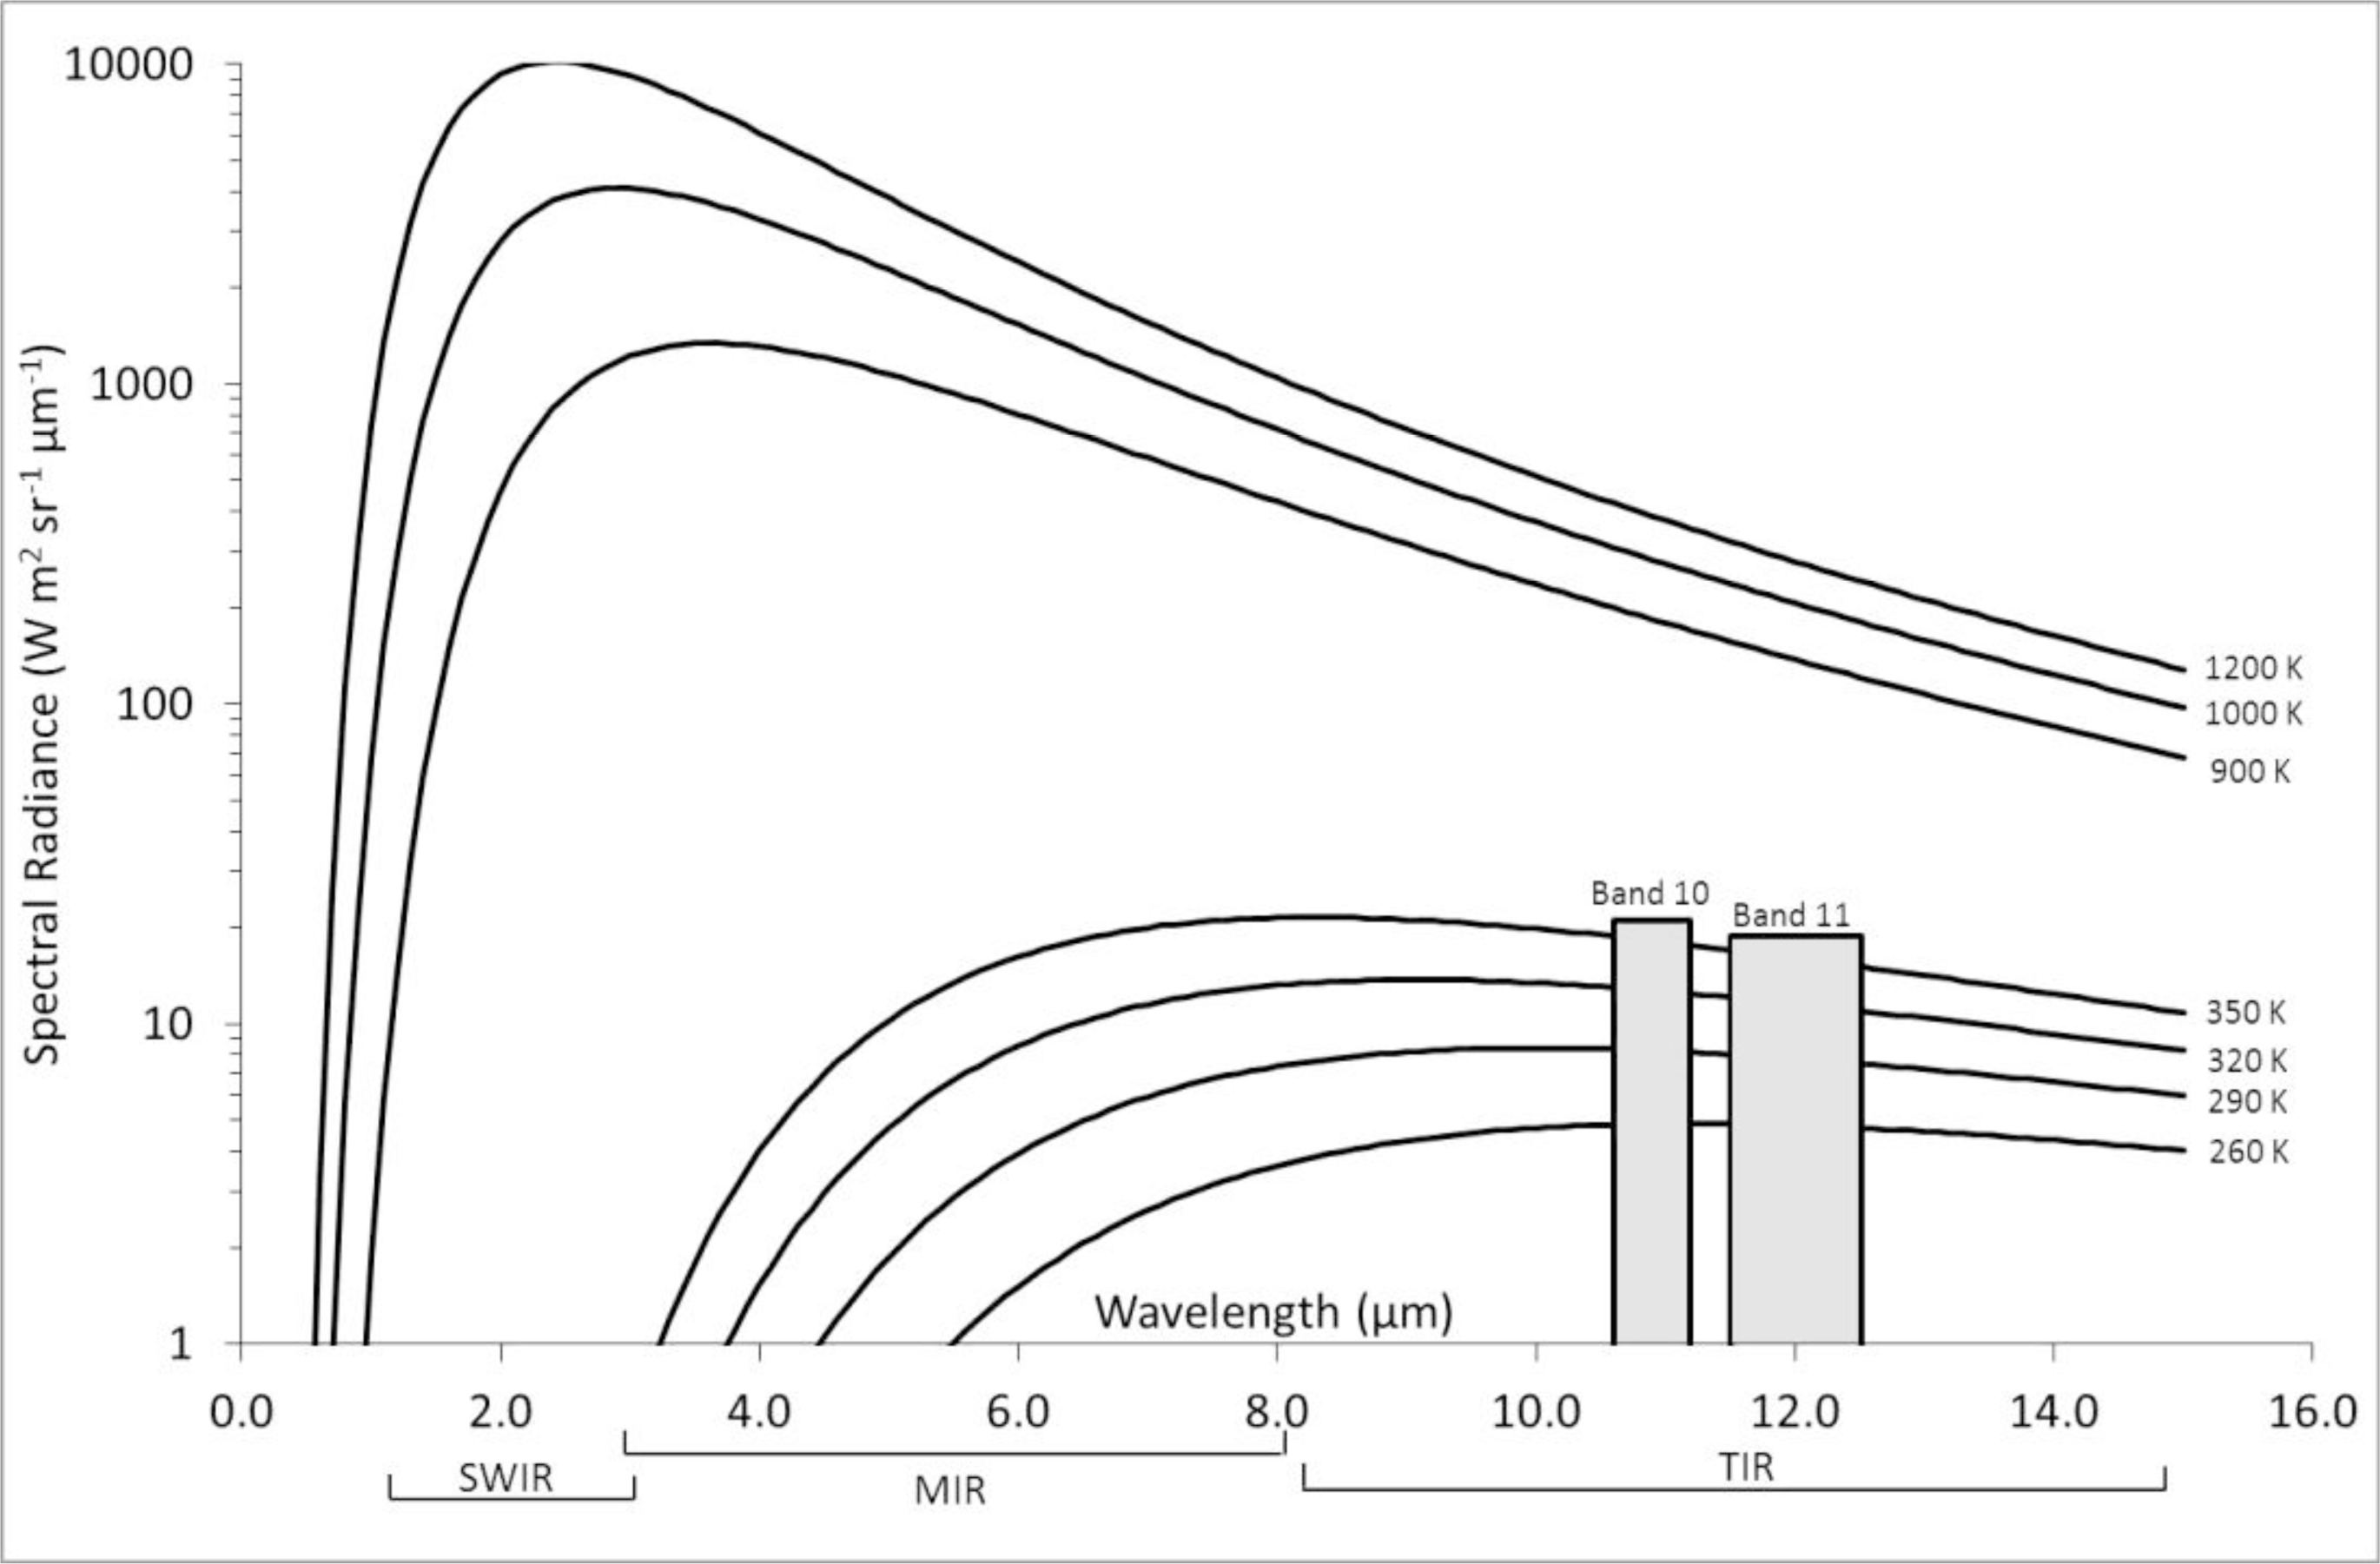
Figure 3.
(a) Simulated volcanic-like surfaces being viewed within one TIRS pixel, with two sub-pixel components of varying size and temperature which would produce a TIRS pixel integrated temperature at the peak of detection for 10,000 m2 TIRS pixels: 360 K [1]; this assumes a cooler component temperature of 300 K. Inset: a representation of the theoretical heterogeneous pixel assumed in these scenarios, with a small hot component representing high temperature elements such as fresh lava or cracks in the carapace of a lava dome, and a larger cooler component (here at 300 K) representing the non-volcanic background surface. (b) The range of pixel integrated temperatures (PITs) that individual TIRS pixel detection components would detect as emitted from a surface with a cooler component (or background) temperature of 300 K and a hotter component with the characteristics displayed. The red line represents the limit of detection for TIRS.
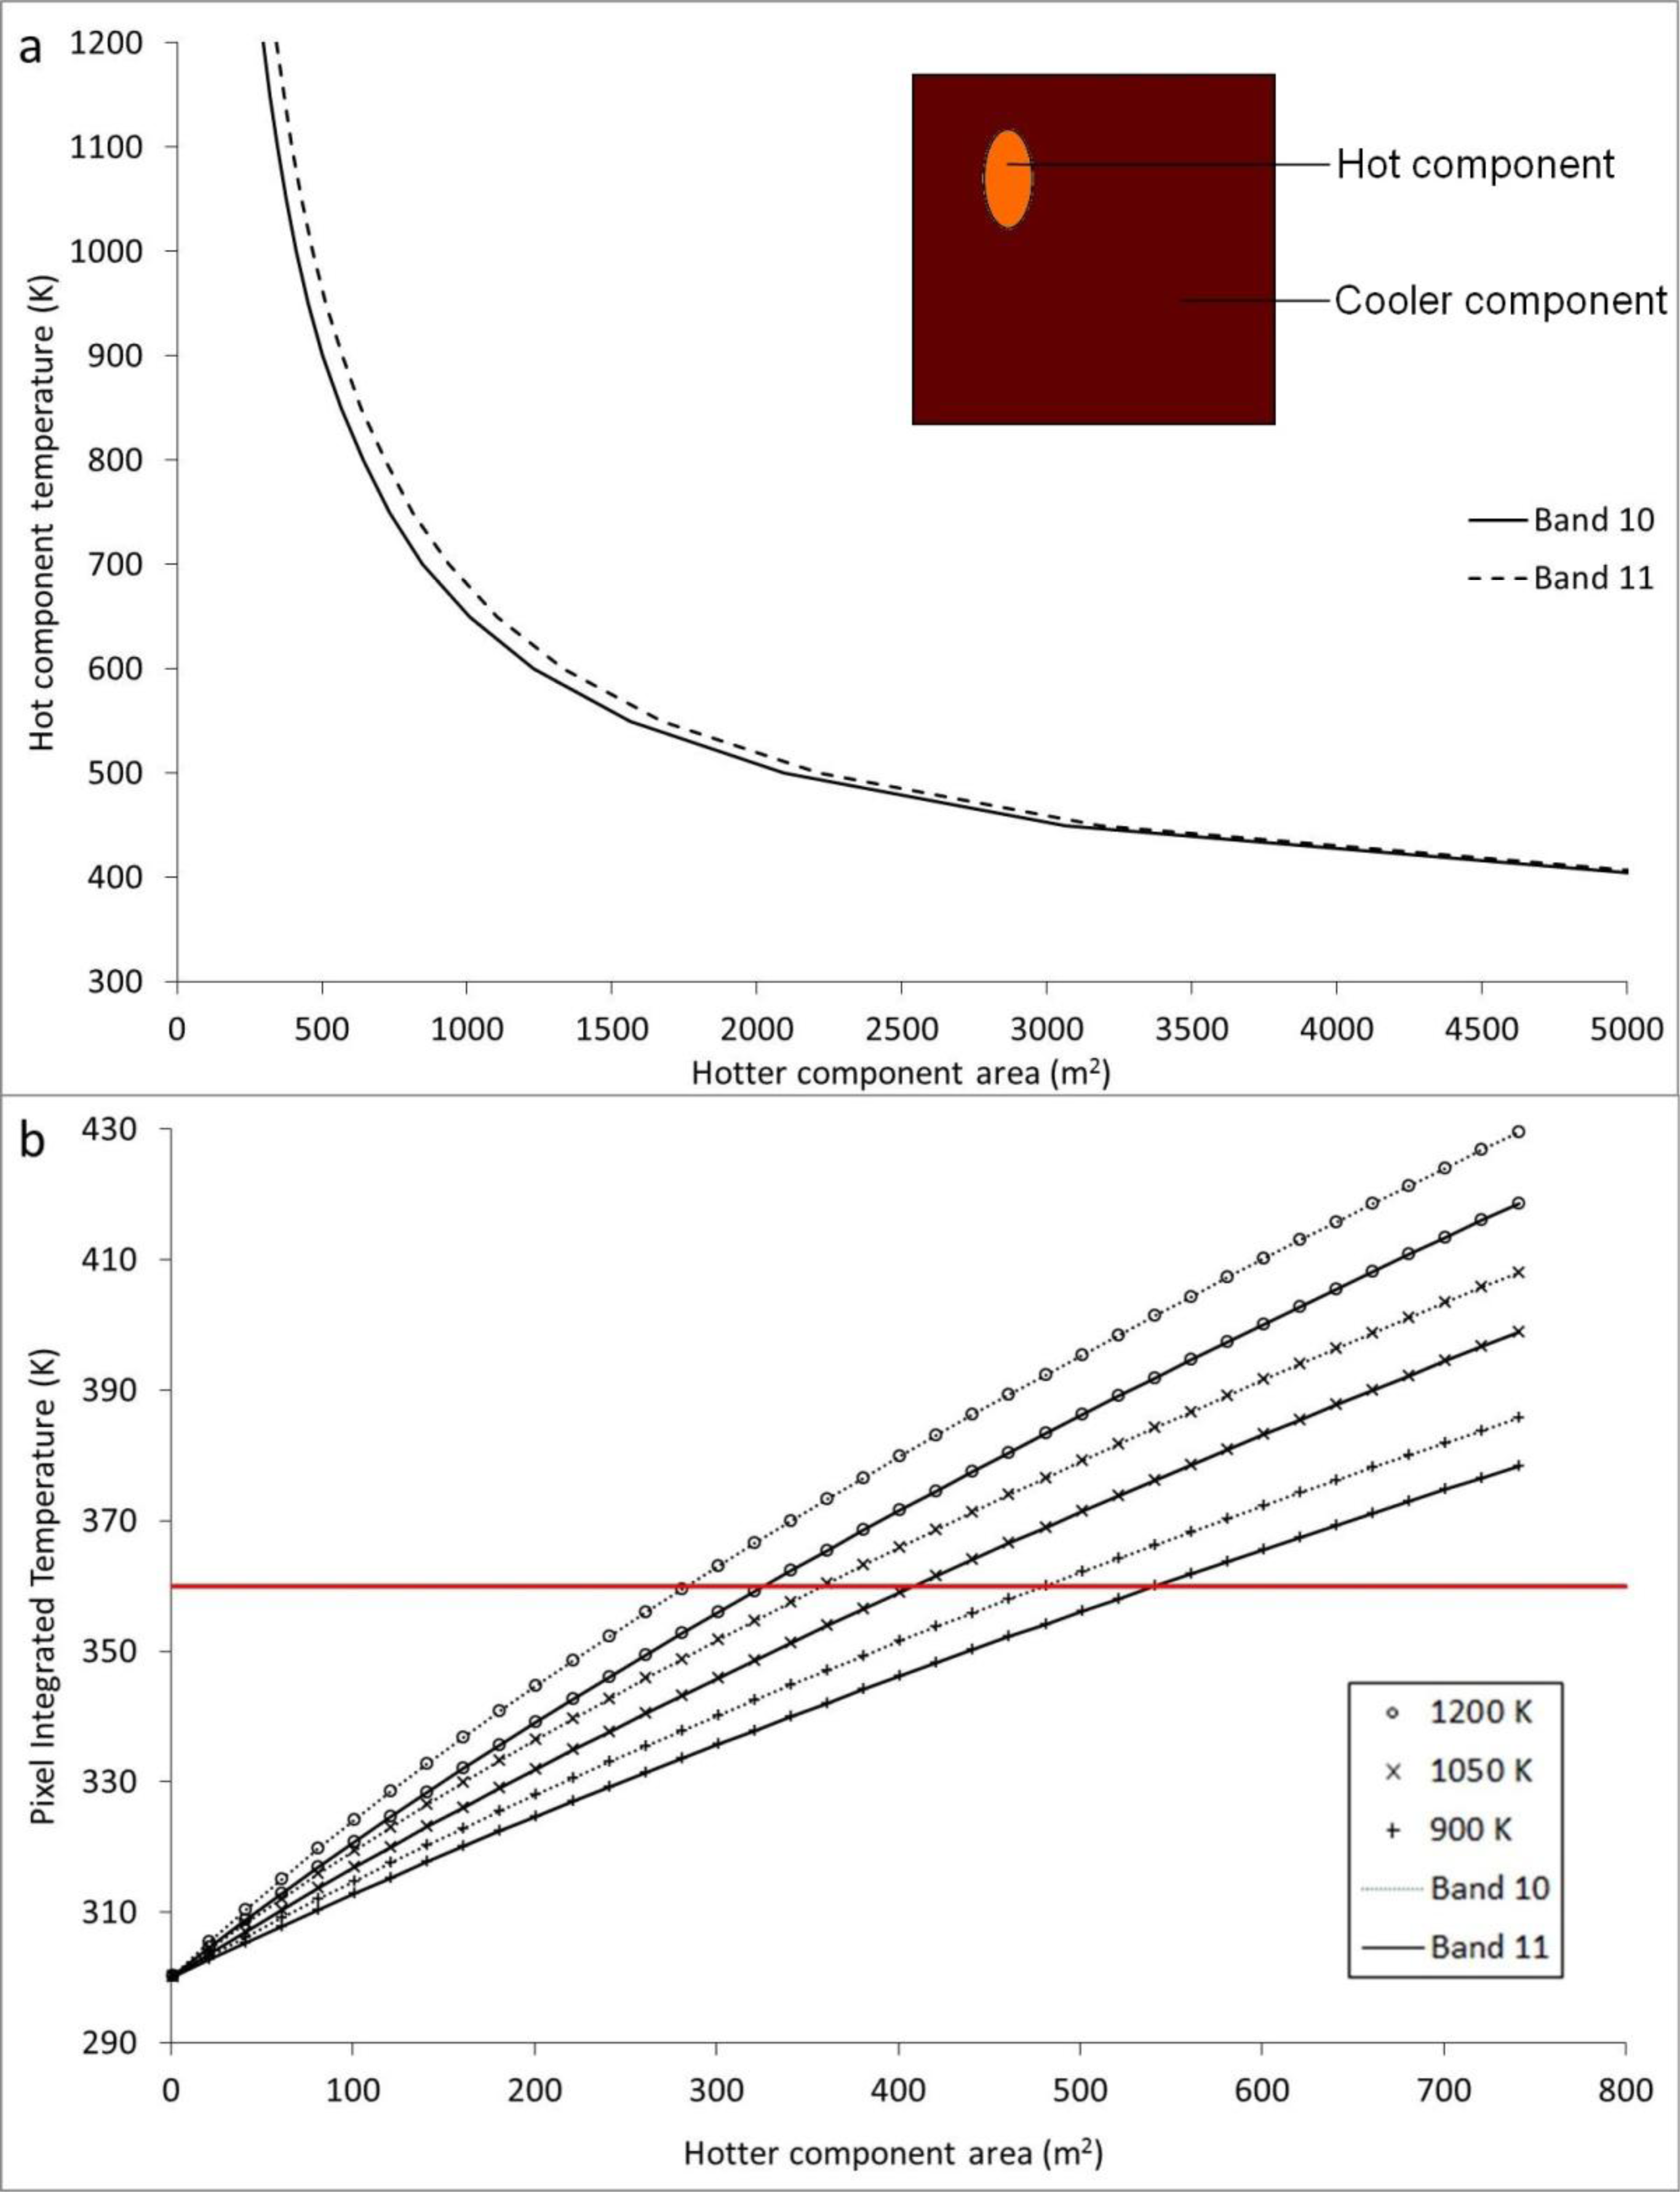
Figure 4.
Top of atmosphere radiant signals associated with the extracted region (see Figure 1), for the TIRS band 10.
Figure 4.
Top of atmosphere radiant signals associated with the extracted region (see Figure 1), for the TIRS band 10.
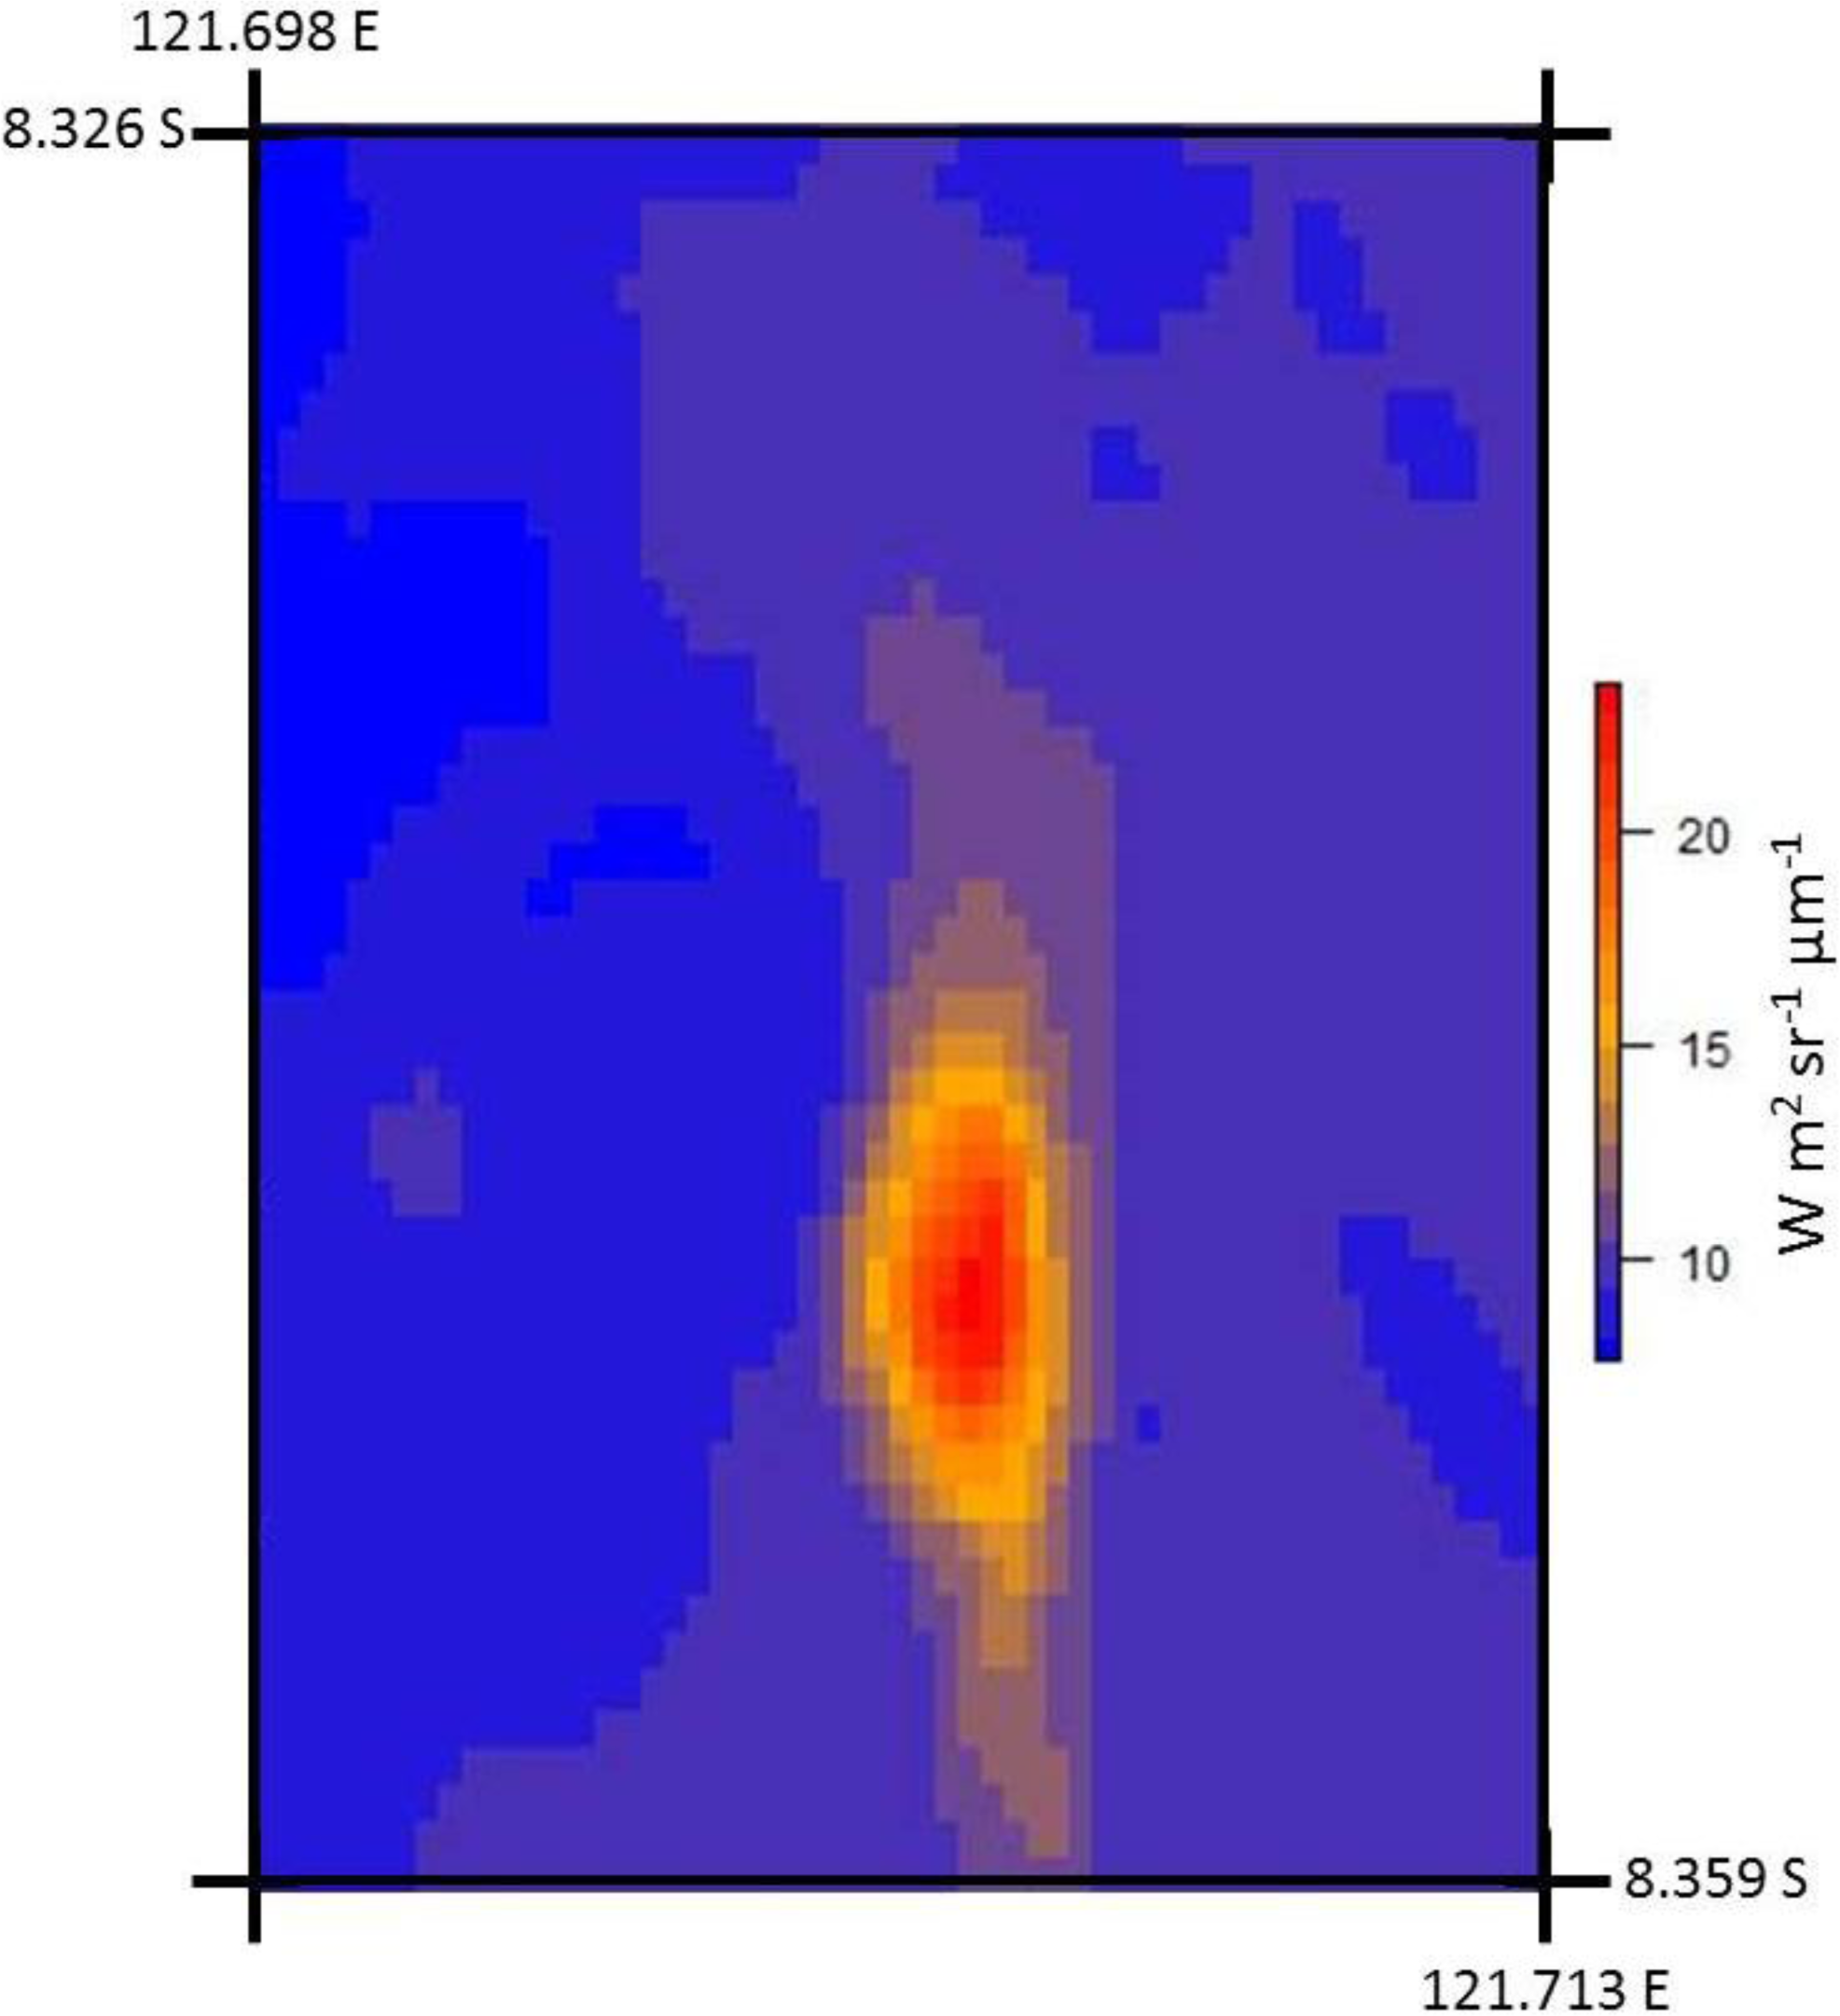
Figure 5.
The brightness temperature of pixels isolated as anomalous within the region of extracted thermal anomaly for the TIRS band 10. The region for which data are represented here relates to that outlined in blue in Figure 1.
Figure 5.
The brightness temperature of pixels isolated as anomalous within the region of extracted thermal anomaly for the TIRS band 10. The region for which data are represented here relates to that outlined in blue in Figure 1.

Table 1.
Characteristics of the Landsat 8 Operational Land Imager (OLI) and Thermal Infrared Sensor (TIRS) bands [4].
| Instrument | Band | Spectral Range (μm) | Spatial Resolution (m) |
|---|---|---|---|
| OLI | 1 | 0.43–0.45 | 30 |
| 2 | 0.45–0.51 | 30 | |
| 3 | 0.53–0.59 | 30 | |
| 4 | 0.64–0.67 | 30 | |
| 5 | 0.85–0.88 | 30 | |
| 6 | 1.57–1.65 | 30 | |
| 7 | 2.11–2.29 | 30 | |
| 8 | 0.50–0.68 | 15 | |
| 9 | 1.36–1.38 | 30 | |
| TIRS | 10 | 10.60–11.19 | 100 |
| 11 | 11.50–12.51 | 100 | |
© 2014 by the authors; licensee MDPI, Basel, Switzerland This article is an open access article distributed under the terms and conditions of the Creative Commons Attribution license (http://creativecommons.org/licenses/by/3.0/).
Share and Cite
MDPI and ACS Style
Blackett, M. Early Analysis of Landsat-8 Thermal Infrared Sensor Imagery of Volcanic Activity. Remote Sens. 2014, 6, 2282-2295. https://doi.org/10.3390/rs6032282
AMA Style
Blackett M. Early Analysis of Landsat-8 Thermal Infrared Sensor Imagery of Volcanic Activity. Remote Sensing. 2014; 6(3):2282-2295. https://doi.org/10.3390/rs6032282
Chicago/Turabian StyleBlackett, Matthew. 2014. "Early Analysis of Landsat-8 Thermal Infrared Sensor Imagery of Volcanic Activity" Remote Sensing 6, no. 3: 2282-2295. https://doi.org/10.3390/rs6032282