Article

Airborne Laser Scanning for the Site Type Identification of Mature Boreal Forest Stands

1
School of Forest Sciences, University of Eastern Finland, P.O. Box 111, 80101 Joensuu, Finland
2
Joensuu Research Unit, Finnish Forest Research Institute, P.O. Box 68, 80101 Joensuu, Finland
*
Author to whom correspondence should be addressed.
Remote Sens. 2011, 3(1), 100-116; https://doi.org/10.3390/rs3010100
Submission received: 8 November 2010 / Revised: 17 December 2010 / Accepted: 27 December 2010 / Published: 10 January 2011

Abstract

:
In Finland, forest site types are used to assess the need of silvicultural operations and the growth potential of the forests and, therefore, provide important inventory information. This study introduces airborne laser scanner (ALS) data and the k-NN classifier data analysis technique applicable to the site quality assessment of mature forests. Both the echo height and the intensity value percentiles of different echo types of ALS data were used in the analysis. The data are of 274 mature forest stands of different sizes, belonging to five forest site types, varying from very fertile to poor forests, in Koli National Park, eastern Finland. The k-NN classifier was applied with values of k varying from 1 to 5. The best overall classification accuracy achieved for all the forest site types and for a single type, were 58% and 73%, respectively. The conclusion is that when conducting large-scale forest inventories ALS-data based analysis would be a useful technology for the identification of mature boreal site types. However, the technique could still be improved and further studies are needed to ensure its applicability under different local conditions and with data representing earlier stages of stand development.

1. Introduction

In Finland, forest stands are classified into forest site types according to their understorey vegetation. This site classification technique is based on Cajander’s [1] forest site type theory and is a classic example of the indirect site quality estimators in forestry context [2]. Vegetation of conifer dominated boreal forests is a composition of a few tree species and various plants with different shapes and sizes [3]. There are also many biological (succession stage, dominant tree species, etc.) and physical (topography, soil and geology) factors affecting the vegetation characteristics of forests. The current forest site types of Finnish forest stands have been located and mapped in conventional stand-based forest inventories [4]. The delineation of forest stand borders is subjectively made by forest inventory personnel from aerial photographs and field measurements and errors in the determination of the borderlines are common [5]. Despite the limits of the inventory method it is widely approved and commonly used in forestry. There is, however, a need for new methods in order to increase the accuracy and cost-efficiency of large-scale forest inventories.
Aerial photographs have typically only been used to delineate different forest stands, since the photos obtained are not detailed or accurate enough to use for the purposes of large-scale forest inventories [6]. However, Airborne Laser Scanning (ALS), which provides spatially accurate three-dimensional (3D) information on forests and is already being applied in practical forestry, could replace conventional field inventory methods for determining tree stocking quantities [7,8]. The 3D nature of ALS data has proven to provide excellent information on landscapes (e.g., [9]), and especially in forestry applications the height above ground is of the greatest interest [8,10,11,12,13,14].Various echo types (e.g., first, last, intermediate and only echoes) can be identified by processing the backscattering energy of a single laser pulse. In addition, the intensity value which describes the amount of backscattering of the echo can be utilized. The height characteristics of ALS data have been used in various studies: When analyzing the modeled canopy fuel parameters of vertical forest structures for the purposes of fire behavior assessment [15,16], distinguishing dominant and understorey layers of vegetation [17,18,19], analysis of natural regeneration [20]. and to predict the characteristics of dead wood in a given sample area [21,22]. Intensity values have been studied by Brennan and Webster [23], for example, who found them to be suitable for distinguishing between different surfaces, but it is only very recently that their applicability to the determination of forest characteristics has been investigated (e.g., [24,25]). This is mainly due to difficulties in scaling and normalizing intensity values or lack of knowledge in their interpretation [26].
Due to the fact that different height attributes are estimated accurately from laser data [11,12], the ALS technique has also been applied to the determination of standwise site quality indicators based on the height distribution characteristics [27,28]. These remote sensing based approaches, in fact, correspond to the traditional growth and yield studies, in which the site classification is based on the dominant height-age dependency (cf. [29]). In Finnish forest inventories the site quality by forest stands is, however, determined using Cajander’s [1] forest site type classification system, which operates on assessable stand characteristics, i.e., ground vegetation characteristics and indicator species, rather than explicitly measurable tree variables. In her study, Pitkänen [30] showed that the connection between different stand structures and variation in ground vegetation exist. This phenomenon can be further studied by applying ALS data techniques. In the recent study by Korpela et al. [31] they found that ALS data can be used in assessment of different boreal mire surface patterns, vegetation and habitats. The applicability of ALS data to the identification of forest stands with high herbaceous plant diversity was recently studied by Vehmas et al. [32]. One of the discrimination techniques applied by Vehmas et al. [32] was the k-nearest neighbor (k-NN) method: In their study the herb-rich forest stands were distinguished from less fertile forest stands. The k-NN method discrimination technique utilized the differences in laser height distributions of these two forest fertility classes [32]. However, high herbaceous forest stands cover less than 1% of the total area of forests and therefore the applicability of the method is rather limited.
The nearest neighbor methods have been widely used for estimating continuous forest variables (e.g., by [8,33,34]) and some extent for determining discrete forest variables (e.g., [32,35]). Peuhkurinen et al. [36] studied species-specific diameter distributions and saw log recoveries with the k-NN method by using first pulses of the data and noted that the method they introduced can also be applied in different classification procedures. Earlier findings by Vehmas et al. [32] suggested that the ALS technology could be applied to distinguish the forest site types because of differences in crown structures and vertical profiles that differ between different forest site types.
In this study, we applied an ALS data k-NN method [36] to distinguish forest site types of forest stands in wall-to-wall coverage by employing two alternative uses of data: (1) Whole data with leave-one-out cross-validation; and (2) an example calculation with separate sets of modeling and test data to be compared in terms of classification accuracy. In the analysis we used various echo types.

2. Material and Methods

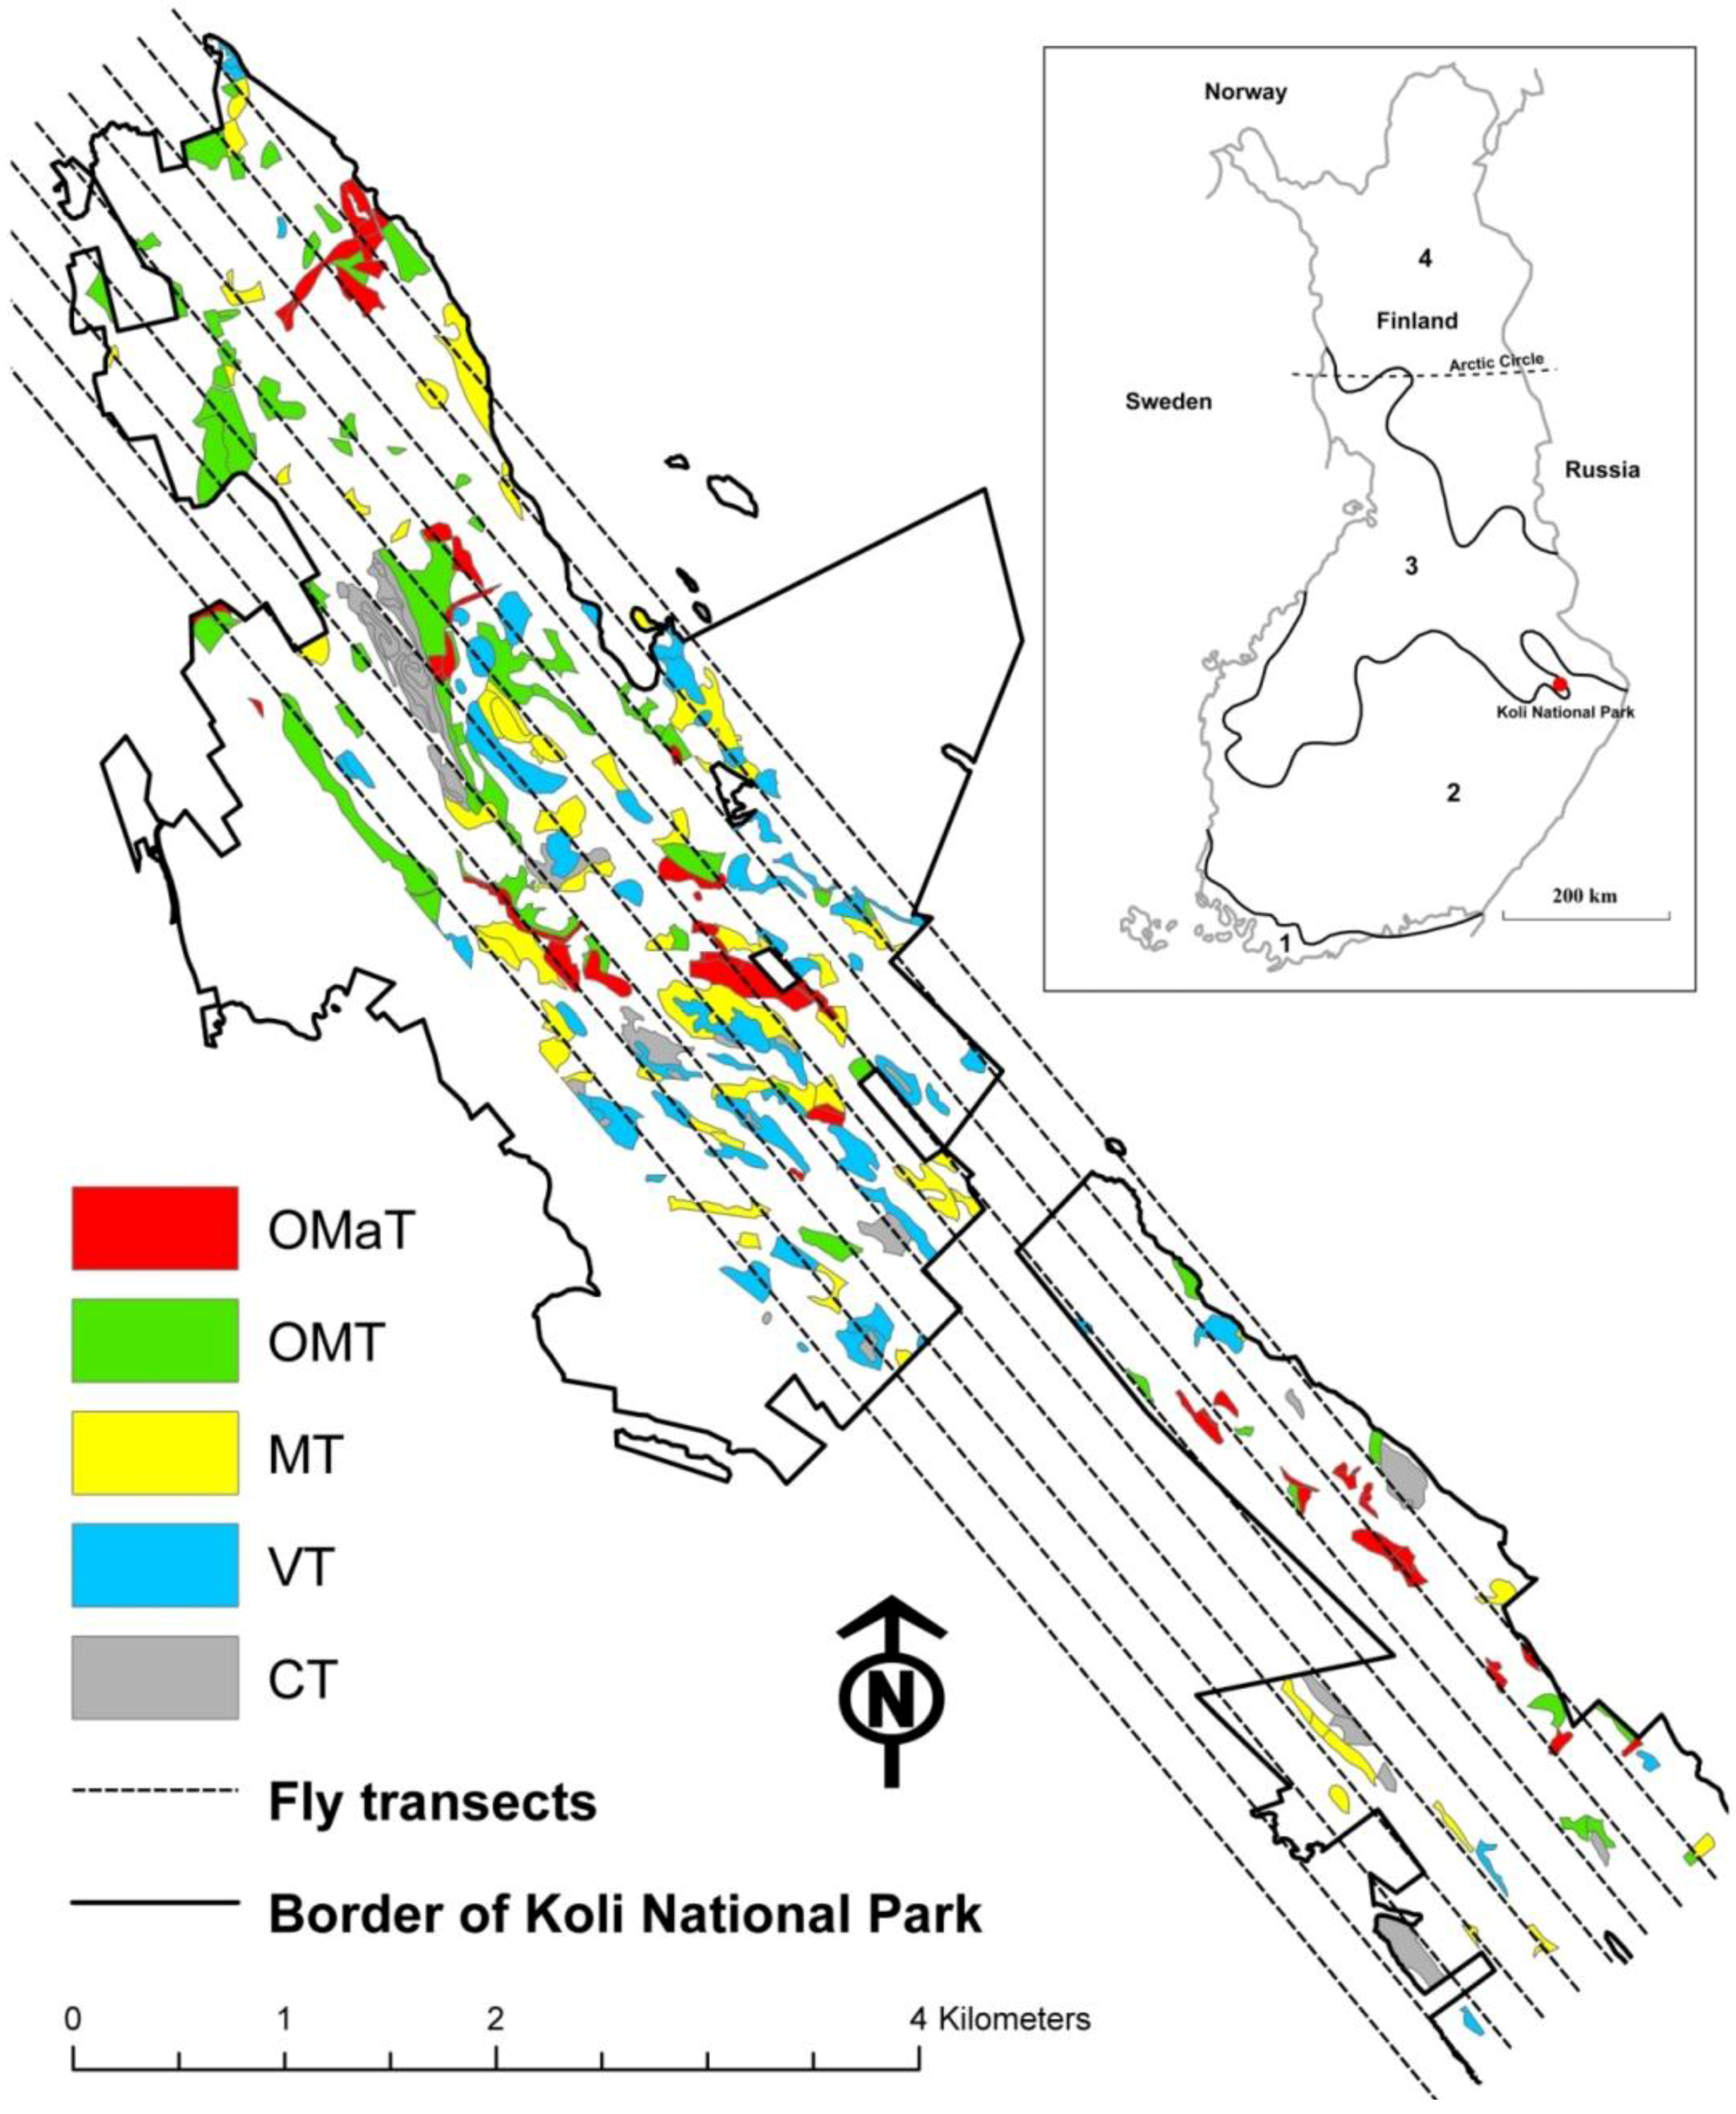
2.1. Study Area and Forest Inventory Data

The forest area concerned here is located in the Koli National Park (29°50′E, 63°05′N) in eastern Finland, on the borderline between the southern and middle boreal forest vegetation zones after Kalela [37] (Figure 1). The total area of Koli National Park is about 3,000 ha, of which 930 ha was the study area. Extensive areas in the northern part of the National Park have been left unmanaged for decades, whereas forest management operations were carried out in the southern part until the early 1990s. The area is characterized by a highly variable boreal landscape and tree species structure, with altitudes varying between 95 and 347 m a.s.l. [38].
Forests in the area are dominated by Norway spruce [Picea abies (L.) Karst.] and Scots pine (Pinus sylvestris L.) with a highly variable admixture of silver birch (Betula pendula Roth.), downy birch (B. pubescens Ehrh.), European aspen (Populus tremula L.) and grey alder [Alnus incana (L.) Moench] [38,39]. This rather small area includes various types of forest soils from infertile to very nutrient-rich. Boreal very rich forests are characterized by mixtures of broad-leaved and coniferous trees, and by soils with structural complexity and values of pH indicating near neutrality [40]. Their understorey vegetation is therefore denser both vertically and horizontally than in less fertile soils. Following the classification of Cajander [1], the forest site types identified in Koli National Park were in five classes: (1) Very-rich (e.g., Oxalis-Maianthemum type, OMaT); (2) rich (Oxalis-Myrtillus, OMT, herb-rich heath forest); (3) medium (Myrtillus type, MT, mesic heath forest); (4) rather poor (Vaccinum type, VT/EMT, subxeric heath forest); and (5) poor (Calluna type, CT/MCClT, xeric heath forest). The inventory data were collected by the Finnish Forest Research Institute in 2004. We used ALS echo distribution data to classify these five forest site type classes (Figure 2).
Figure 1. Map of the Koli National Park in eastern Finland, with locations of the stands of the different fertility classes. OMaT denotes very rich, OMT rich, MT medium, VT rather poor and CT poor forest site types [1]. Forest vegetation zones after Kalela [37]: South Finland (1 Hemiboreal and 2 Southern boreal), Pohjanmaa-Kainuu (3 Middle boreal), and Peräpohjola and Metsä-Lappi (4 Northern boreal).
Remotesensing 03 00100 g001
Figure 2. First and only pulse (fo) height distributions in different fertility classes by Cajander [1].
Remotesensing 03 00100 g002
The total number of stands within the study area was 680. The stands were delineated according to the rules documented by Davis and Johnson [41], where the forest stand is considered to be homogeneous in respect to, for example, soil and growing stock. In terms of development classes, the stands used in the analyses were mature stands, as these closed-canopy stands represented advanced successional stages of boreal forests with an advanced ground vegetation and were therefore ideal for site type classification by the method of Cajander [1]. The whole data used in this study included 274 selected forest stands covering an area of 337 ha, which included stands from the northern and southern parts of the National Park. As an example, the data were also randomly assigned into modeling data and test data. The modeling data consisted of 184 forest stands and comprised an area of 241 ha, while the test data consisted of 90 forest stands and covered a total area of 96 ha. The descriptive area statistics for whole data (Table 1) were similar to the model and test data.
Classification accuracies were compared in different fertility classes and different stand size classes. The size classes in ha were 0.05–0.25, 0.26–0.50, 0.51–0.75, 0.76–1.0, 1.1–2.0 and 2.1–12.1 (maximum stand size). The number of stands (n) in each size class was 45, 48, 40, 39, 54, and 48, respectively.
Table 1. Descriptive statistics for stand areas in ha by forest site type in the whole data. The number of stands is n; Min is the minimum, Max is the maximum, Mean is the average area of the forest site types in ha and S.D. the standard deviation. Very-rich denotes OMaT (1), rich OMT (2), medium MT (3), rather poor VT (4) and poor CT (5) forest site types by Cajander [1].
Forest site typeWhole data 336.7 ha (n = 274)
nMinMaxMeanS.D.
Very-rich (1)610.035.800.730.91
Rich (2)600.1312.131.482.12
Medium (3)600.167.771.381.37
Rather poor (4)600.126.461.291.14
Poor (5)330.047.021.301.58

2.2. Airborne Laser Scanner Data

The ALS survey was performed on 13 July 2005, using an Optech ALTM 3100 laser scanning system. A total of nine ALS lines (Figure 2) was flown at an altitude of 900 m and a flight speed of 75 m/s. The area covered was approximately 2,200 ha. The laser pulse repetition rate was 100 KHz and the scanning frequency of a swath was 70 Hz, at an angle of ±11 degrees. The pulse density of the data was 3.9/m2, but because of nominal side overlap (35%), and variation in the terrain, the actual ground hits varied from approximately 3.2/m2 to 7.8/m2.
The data echoes collected included coordinates (x,y) and height value (z), flight line numbers, intensity values (range from 1 to 180) and echo types in four classes: 1 = only echo, 2 = first echo, 3 = intermediate echo and 4 = last echo. A digital terrain model (DTM) was produced from the last and only echo data using a pixel size of 1 m × 1 m, employing TerraScan software, which uses the method proposed by Axelsson [42]. In order to analyze the ALS data, the first step was to convert the orthometric heights to an above-ground scale by subtracting the DTM from the corresponding ALS heights [43]. The laser echo characteristics are presented by forest site types in Table 2.
Table 2. Numbers of laser echoes/m2 by forest site types and proportions (%) of the different types of echoes including the z value and intensity value in the whole data. The letters f, o, l and i indicate the first, only, last, and intermediate echoes, respectively, whereas fo is the sum of first and only echoes.
Forest site typeallfof/fo, %o/fo, %l/fo, %i/fo, %all/fo, %
Very-rich (1)7.35.037.362.738.06.2144.2
Rich (2)7.05.035.764.336.35.6141.9
Medium (3)6.84.834.965.135.75.1140.8
Rather poor (4)6.44.732.167.932.84.0136.8
Poor (5)6.25.022.577.522.91.7124.6
2.3. k-NN Classification
In order to distinguish forest stands by forest site types using the k-NN classifier, we applied two different ways to analyze our data. In the first approach, we used the whole data with leave-one-out cross-validation. In the second approach the data were divided into reference (modeling) and target (test) data.
The classification of forest site types was obtained by using the non-parametric k-NN classifier method introduced by Peuhkurinen et al. [36]. At least three issues need to be considered when using the k-NN method: (1) A suitable distance metric; (2) the number of neighbors to be used; and (3) the weighting of the neighbors [44]. This study used a Minkowski distance metric of order one between the distributions. The Minkowski distance is applicable for measuring similarity between objects and takes into consideration the whole variability and the heterogeneous structure of laser distributions. In case of discrete distributions, it can be defined using Equation 1:
D p q = i = 1 n | p i q i |
where Dpq is the distance between either laser height distribution or laser intensity distribution to be compared, pi is the proportion of observations in class i from the all observations of the target distribution (sum (pi) = 1), qi is the proportion of observations in class i from all observations of the reference distribution (sum (qi) = 1), and n is the number of classes in the distributions. The value of Dpq (Equation 1) ranges between 0 (the distributions compared are the same) and 2 (the distributions compared have no observations in the same classes). The chosen distance metric is based on the absolute differences between the laser echo distributions of the target and reference stands and is suitable in situations in which the predictor variables are distributions with unknown characteristics (in this case laser echo height and intensity distributions) and it is assumed that the form of the distribution contains most of the information on the variables of interest (in this case forest site type classes). The distance value can be used in weighting the neighbors by subtracting it from the maximum value, which is 2. When using more than one predictor (i.e., distributions of laser echoes of different types), the distances are calculated separately from each distribution. The final distances are then the sum of distances. The distances are then weighted using subsequently determined optimal weights for the predictors:
D p q = w j j = 1 m i = 1 n | p j i q j i |
where m is the predictor (laser height or intensity distribution of certain laser echo type) and wj is the weight of the predictor j.
The classification rule needed for applying the k-NN based classifier was adjusted for the case of several neighbors (k) as follows:
  • k = 1: the value of the predicted variable is the value of the nearest neighbor
  • k > 1: the weights of the neighbors are summed by forest site type class and the estimated forest site type class for the target unit is the one with the highest sum of weights.
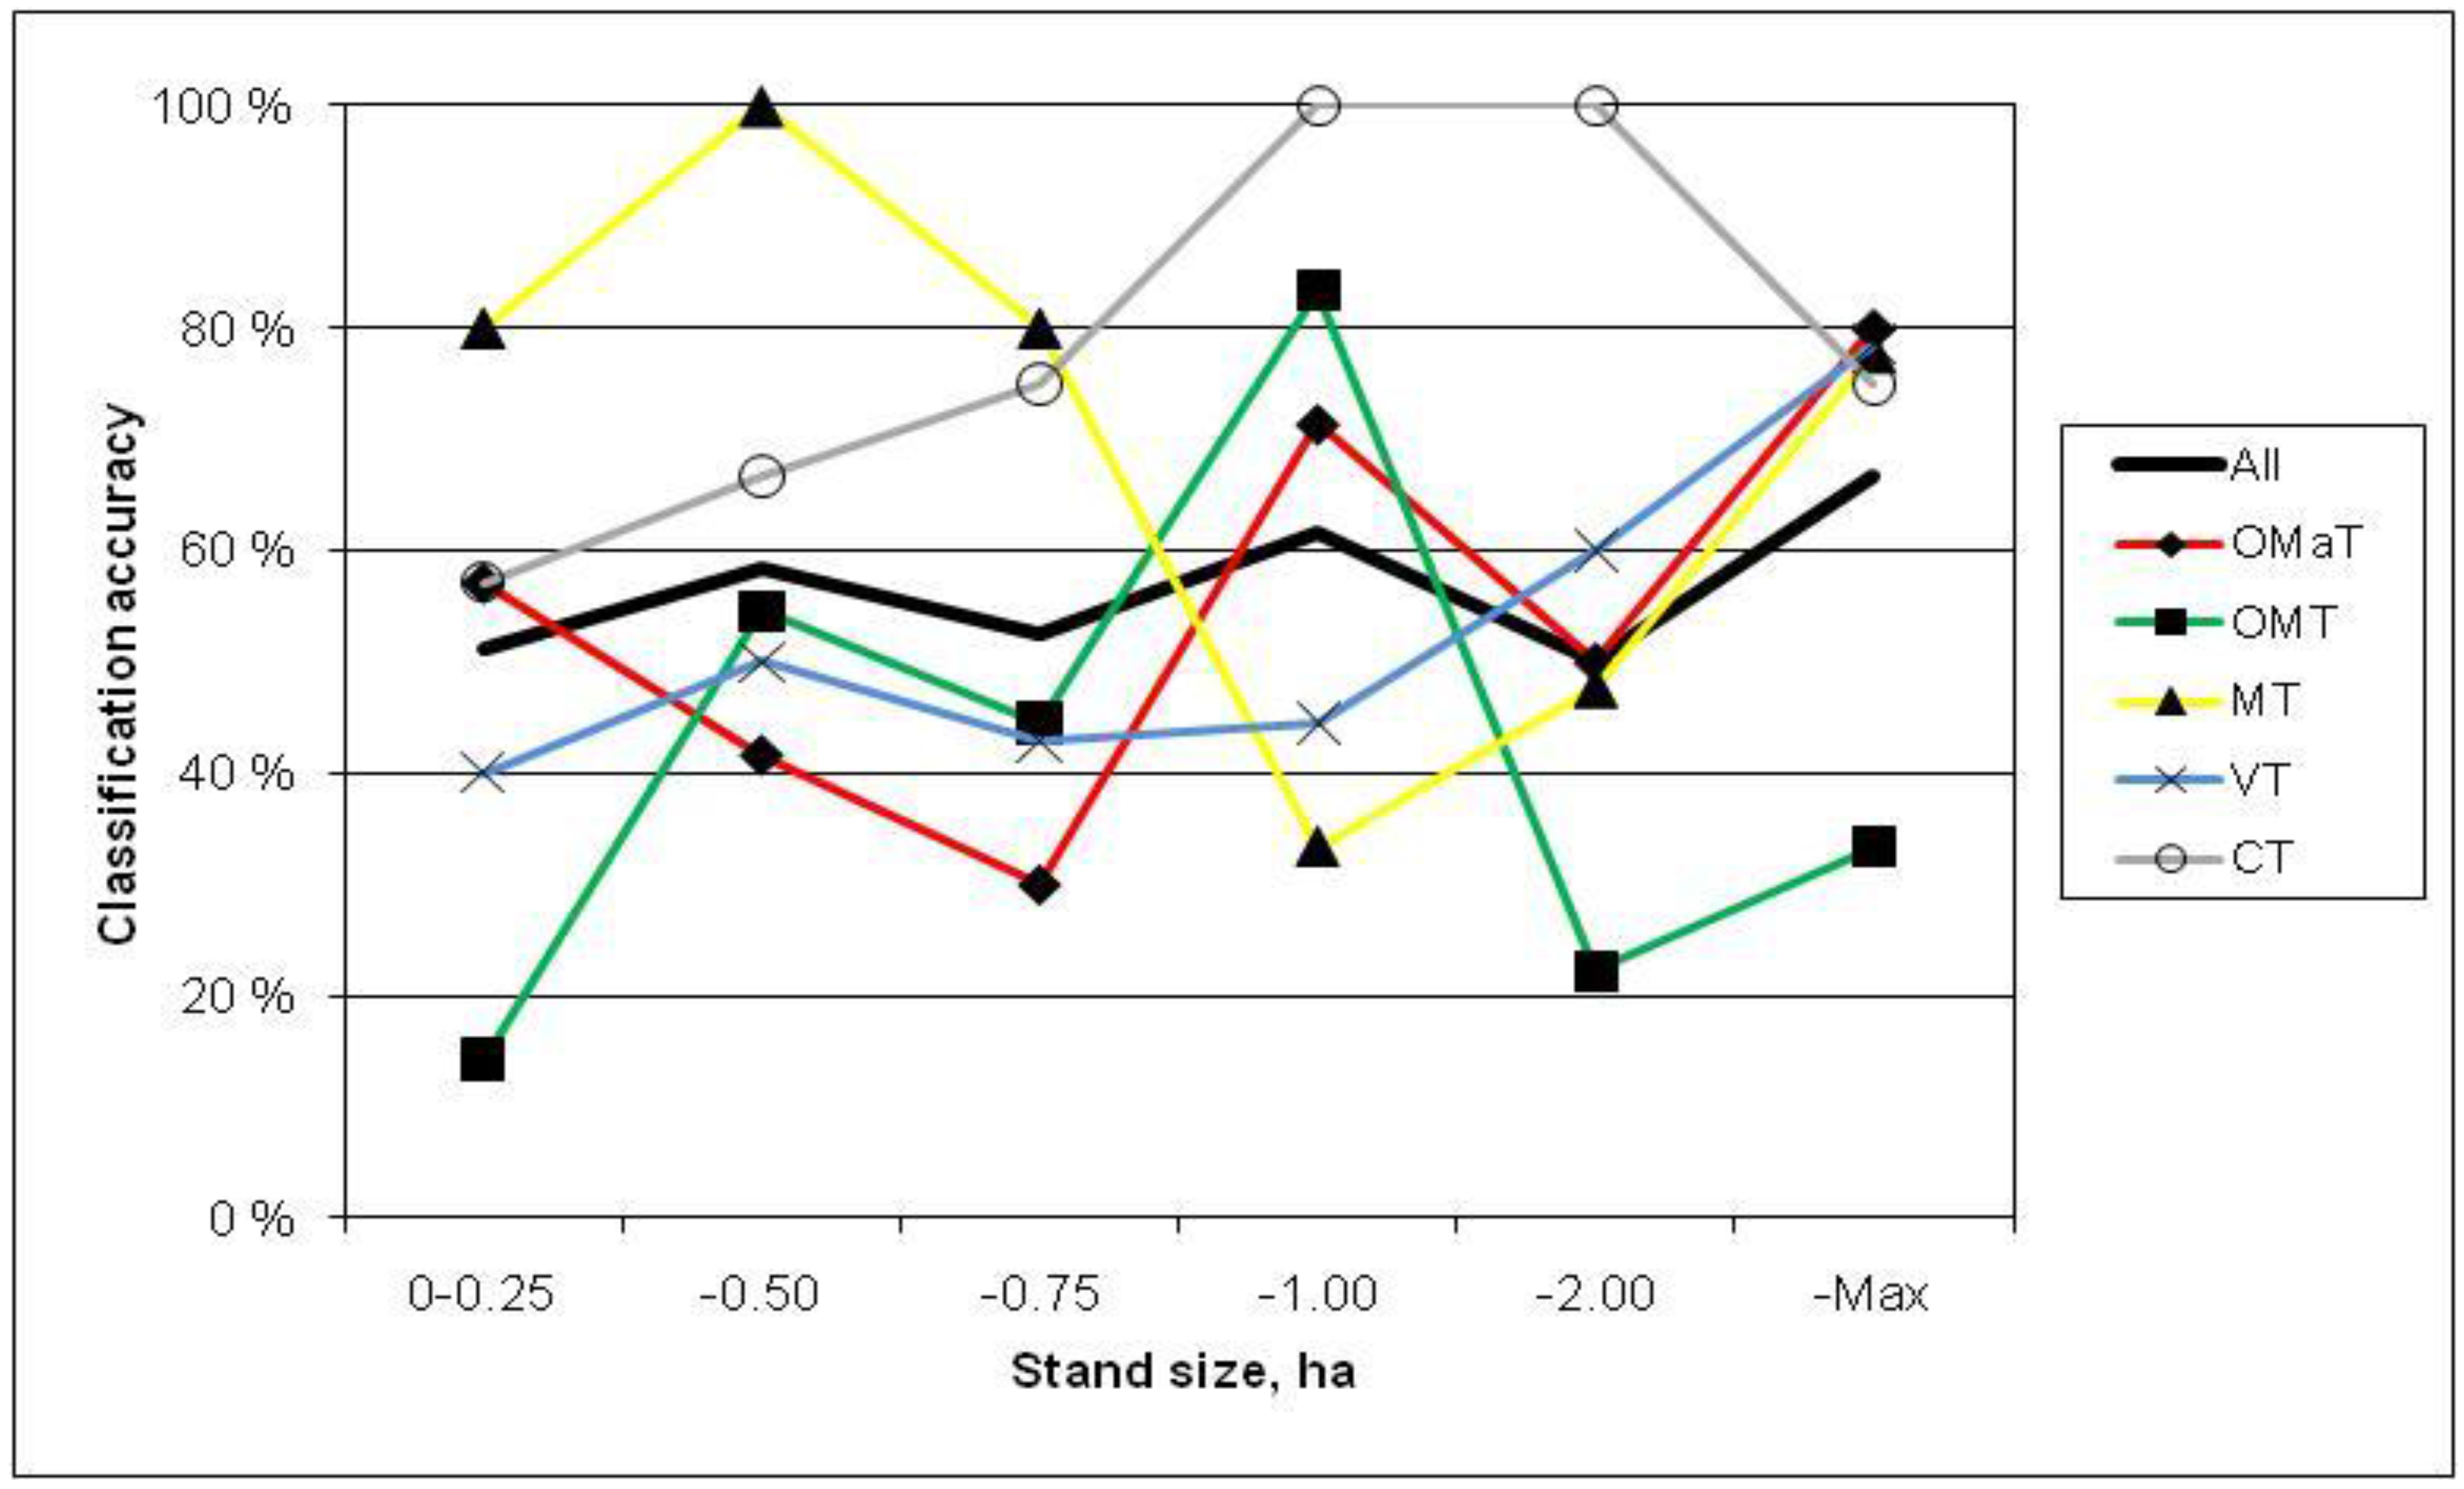
For the k-NN classification procedure the laser echo heights were classified into 10 cm classes, with the negative echo heights assigned to a class 0 (note that some ALS hits always occur below the DTM level). This classification provided enough observations for all the approximately 300 classes (0 to 30 m with 10 cm interval). Furthermore, the laser echo intensities were classified to 10 even classes according to the range of intensity values.
The optimal weights for the different types of echoes were searched for by optimizing the overall classification accuracy. The optimization algorithm weighted the combinations systematically so that every echo type was given a weight from 0 to 1 at intervals of 0.1. In addition, all the combinations of weights, which summed to 1, were examined. The optimization was performed on the whole data with a leave-one-out cross-validation technique in which the target unit was left out of the reference data. In the second approach the optimization was performed on the modeling data, after which the test stands were classified using the pre-determined optimal weights and the nearest neighbors were searched for only from the modeling (reference) data. In the case of several neighbors (k > 1), the procedure provides not only class estimates but also an idea of the closeness of the target unit to the other classes. However, it should be remembered that the forest site type classes may express the fertility levels on an ordinal scale, but the tree cover of those types are on a nominal scale.
The performance of the k-NN estimation method was verified by calculating overall classifications for five different forest site types and by deriving classification matrices, i.e., two-dimensional contingency tables. In addition, a Cohen’s kappa statistic [45] was used to measure agreement between the classifications with different numbers of neighbors and respective to different datasets.

3. Results

The classification results were calculated for the whole data as well as the test data, with one, three and five nearest neighbors, and optimal weights were determined for the accuracy of classification of the stands into five different forest site types. Both the height and the intensity values were used with different weights (Table 3) to optimize the classification results. The heights have the highest weights with one neighbor, whereas the weight of the intensity increases with three and five neighbors.
Table 3. Weights of variable distributions used in the k-NN method with 1, 3 and 5 neighbors in two approaches: (1) Whole data (n = 274); (2) test data (n = 90). f is the first pulse, l the last pulse, i the intermediate pulse, fo the first and only pulses together and lo the last and only pulses together.
ClassificationHeightIntensity values (i)
methodsumflifolosum iflifolo
1-NN–(1)0.8 0.2 0.10.50.20.1 0.1
1-NN–(2)0.90.10.2 0.30.30.1 0.1
3-NN–(1)0.40.10.1 0.20.60.10.1 0.4
3-NN–(2)0.2 0.2 0.80.10.10.40.2
5-NN–(1)0.5 0.2 0.10.20.50.3 0.10.1
5-NN–(2)0.40.1 0.30.60.20.20.1 0.1
A forest confusion matrix for all of the five forest types is presented in Table 4, where the diagonal shows the correct classifications. The best overall classification result (58.0%) in the entire data was achieved with the 5-NN and the best single class classification (poor, CT 72.7%) with the 1-NN. In the case of the whole data, the decreased numbers of neighbors (1 or 3) altered the classification of some stands and decreased the overall classification accuracy (Table 4). The accuracy rates obtained for the classification of herb-rich forests, for example, were 52.5% and 62.3% with one neighbor and five neighbors, respectively. The classification done using the test data gave only slightly worse overall classification percentages than with the whole data. In addition, some single class classifications were even better when using the test dataset. Moreover, the overall classification accuracy increased notably (83.3–92.2%) when the next nearest class was taken as correct classification result (Table 4).
With the 1-NN the classification to class 3 (medium, MT) was highest (34.4%) and decreased to classes 1 (17.8%) (very rich, OMaT) and 5 (11.1%) (poor, CT). With 5-NN the classification to the different classes varied more evenly over the five classes (Table 4).
Table 4. Classification success rates (%) matrix obtained by the k-NN method with 1, 3 and 5 nearest neighbors for all forest site types in two approaches: (1) Whole data (n = 274); (2) test data (n = 90). *1 denotes very rich forests (e.g., OMaT), 2 rich (OMT), 3 medium (MT), 4 rather poor (VT) and 5 poor (e.g., CT), including all poor forest sites [1].
1-NN–(1) 56.6; 89.4 3-NN–(1) 56.9; 88.7 5-NN–(1) 58.0; 89.8
*12345 12345 12345
*152231825 159211523 162201305
215453280 218472780 220432880
371563132 3101860102 3102058102
423235715 408176510 408126812
50032473 50064252 50004258
1719302014 192127249 2020242411
1-NN–(2) 55.6; 92.23-NN–(2) 55.6; 83.35-NN–(2) 54.4; 90.0
12345 12345 12345
160202000 160103000 165251000
210504000 225452055 220403550
3101560150 315156550 353055100
405354515 41010205010 41015155010
50003070 50004060 50003070
1820341711 2418301810 2224261810
In both data (whole and test data) there was a medium agreement in classification of different k-NN classifiers in terms of their kappa values (0.423–0.469). The correspondence among the k-NN-based classifications was good when the kappa between the k-NNs with respective values of 3 and 5 was compared with the kappa values for the other two comparisons. With the k-NN values of 1 and 3 correspondence was weak (Table 5).
Stand size had no effect on the classification results. There is no trend in classification and accuracies over different fertility classes (Figure 3). Classification accuracy varies from 14% (OMT with stand size under 0.25 ha) to 100% (MT 0.26–0.50 ha, CT 0.76–1.0 ha and 1.01–2.0 ha). In general, the average classification accuracy was 59% varying from 50% (under 0.25 ha) to 69% (over 2 ha). Only in the case of the CT (poor) class, is the identification consistently more accurate than in all stands together (All).
When analyzing which stands were used as neighbors, it can be said that, in the classification results with the 1-NN, 78.5% of the stands (n = 274) were used as classifiers, 32.1% of which were classified in pairs because of their extreme similarity. When the classification accuracies of all neighbors were inspected, the non-weighted 3-NN and 5-NN yielded to the accuracy measures of 45% (n = 822) and 47% (n = 1,370), respectively. If the next nearest (‘nearby’) class was accepted as a correct neighbor then the accuracy measure increased to 86% when obtained for the multi-neighbor cases. The rates of accuracy obtained for evident cases (more than half of the neighbors were correct) of the 3-NN and the 5-NN were 47.8% and 42.7%, respectively.
Table 5. Values of kappa statistics for the differences between given k-NN classifiers.
Whole dataTest data
1-NN/3-NN0.3530.370
1-NN/5-NN0.4480.484
3-NN/5-NN0.5600.663
Figure 3. Classification accuracies of different forest site types obtained by stand size classes.
Remotesensing 03 00100 g003

4. Discussion

The site type classification is characteristic to Finnish forest inventory even if it requires well-trained fieldwork personnel in order to succeed. With the understorey vegetation, based on the site classification method by Cajander [1], it is in most cases easy to define the correct site type at any given point. However, visiting all parts of the stand is practically impossible and, therefore, the right delineation of the stand boundaries is critical to get reliable results. Using the ALS-based approach of this study it becomes, however, possible to collect information for the site classification over complete forest areas and to analyze connections between structural forest stand characteristics and ALS data variables.
The aim of this work was to employ ALS data and the k-NN method in an automated identification of forest site types by mature forest stands in wall-to-wall coverage. The weights for the predictors were identified for every value of k separately and, therefore, the prediction models were different in each set up of the k-NN. The method yielded promising results for distinguishing forest site types. We used two data approaches and found that the difference between the analyses, based on the whole data approach and the modeling and test data approach, were negligible. With the whole data, the k-NN provided slightly better results in classification with more than one neighbor, whereas in modeling and test data the best results were achieved with only one neighbor. However, there is no major difference in which approach is used; the larger data provided more options to choose the ‘right’ site type. In the case of 1-NN 32% of the stands were classified in pairs because of their extreme similarity. The classification results based on ALS data are slightly dependent on the classifier selected because the kappa statistics between the different k-NN classifiers varied from 0.42 to 0.47. More research would be needed in order to gain a clearer apprehension of the use of these classifiers.
One interesting result was that more fertile site types appeared to have higher proportions of first, last and intermediate laser echoes, as well as the total amounts of echoes. One explanation could be that more fertile forest stands usually have more understorey vegetation resulting in the higher number of echoes. In addition, higher proportions of only echoes were observed in stands belonging to the poorest forest site types (Table 2). A visual inspection of classification accuracies, obtained separately for different forest site types by stand size classes, showed that the stand size did not affect the classification accuracy except in the case of the forest site type ‘CT’. This exception was, however, mainly due to the differences in vertical structures of laser distributions between stands with varying size. However, there were some differences in accuracies within classes OMT and MT (Figure 3). Generally, these two classes are the most difficult to identify, because they have relatively similar vertical structure (see Figure 2). Especially, when the stand sizes are less than one hectare there might be great variety between the stands in these two classes.
The method of this study was based on differences in vertical changes of different forest site types (Figure 1). In the poorer site types the height of the forest is generally lower and therefore the vertical distributions are narrower. The proportion of deciduous trees is higher in more fertile forests, which might be one explanation for the significance of vertical indicator characteristics, because the crown characteristics of deciduous trees differ from those of spruce. In addition, there is more vegetation of lower height (e.g., ferns) in more fertile forests. Moreover, the intensity value was found to correlate positively with the number of deciduous trees (see also [32]). One explanation for this could be that the laser pulse operates at the near-infrared part of the spectrum and therefore backscatters more strongly from deciduous canopies.
Forest management practices were applied in the forests in the southern part of the National Park until the mid-1990s and the proportion of young forests was higher there than in the northern part. The variation in altitude was also smaller. Due to the somewhat limited number of forest stands applicable to the analysis it was not, however, possible to make any partition between the northern and southern parts of the area when distributing the stands into the modeling and test data. In the validations we used, however, the leave-one-out method which yielded a case where every stand had 273 possibilities to the nearest neighbors. One problem in our study was the generalized stand delineation, which was also applied to the reference data. It was observed that the larger reference data together with more advanced stand delineation would result in a more accurate k-NN classifier for forest site types.
We used one commonly applied distance metric in our study: The Minkowski distance shows only the size of the difference between two distributions, not where the difference is. Thus two totally different forest stands can give similar distance values, when compared with some reference distribution (see also [36]). However, according to results (Table 4), the classification in this application with Minkowski distance metric succeeded in approximately 90% accuracy when the next nearest class was taken as correct classification result. We noticed that in future studies of site type classification also other distance metrics should be tested and compared.
The k-NN estimator uses data efficiently because of its ability to utilize a high number of explanatory variables. In most of the cases when classification failed the resulting class was, however, in the ’nearby‘ classes with a most similar tree species structure and silvicultural recommendations corresponding to the correct forest type class. Classification accuracy increased to about 90% with all approaches used in this study, when a ‘nearby’ class was taken as a correct classification. This result is significant because it shows that ALS data and the non-parametric k-NN classifiers can be used in assessing forest site types. Furthermore, in the determination of forest site types in a forest inventory by stands (i.e., in field visual assessment) mistakes in borderline cases are also possible. In general, nearest neighbor methods are sensitive to the reference data, and biased estimates can be reduced by putting more emphasis on the process of choosing the extensive reference data. The k-NN method was applicable to the identification of the five forests site types, and the results show that the success rates were moderate varying from 54 to 58%. In their recent study, Vehmas et al. [32] succeeded in distinguishing two classes (the most fertile forest site type from the less fertile forest site types) from each other with an accuracy of almost 90%.
At this point it still remains unsolved whether the subjective standwise inventory technique or the objective ALS data based method provides more dependable results in assessing forest site type classes. Furthermore, there are evidently no exact limits in real forest site types. Using the k-NN method in classifying forest site types, there is also a need for information on the development class of the stand. Otherwise it is possible that younger fertile stands and mature stands with lower fertility may be mixed. Additionally, so far there has not been any success in separating different kinds of young stands from each other with ALS because of the similarities in earlier stages of forest succession. Therefore this field of research requires more effort in the future. One issue which would require more attention is the within forest stand variation of site quality characteristics. It is possible, for instance, to divide the stands into more homogenous “micro-stands” or grids to be applied as the basic units for forest site type classification. A wall-to-wall forest site type map could thereafter be produced by combining predicted site types respective to adjacent grids or subdivisions of stands. In addition, digital aerial images and digital terrain models could be a valuable source of additional information for classification purposes. Moreover, our method is based on the vertical distribution of vegetation and can, therefore, be used in other vegetation zones where the ALS is applicable (e.g., no echoes originate from the ground in dense rain forests). However, the confirmation of the method should be examined under various local conditions.
If the correct classification rates 58% and 90% (including an adjacent class prediction) are discussed from the operational perspective of the forestry, it can be concluded that the achieved accuracies are truly satisfactory for certain purposes. The decisions on management programs including harvesting schedules and, especially, the timing of the regeneration felling, are partly based on forest standwise determined forest site types. When selecting the regeneration techniques specific to the clear-felled areas, forest site typing is also used in deciding the cultivation method for soil preparation and the species to be planted. In Finland, the selection regarding the species is usually done between the three most favored indigenous species, i.e., Scots pine, Norway spruce and silver birch. For selecting the species, the accurate classification between the site types MT (medium) and VT (rather poor) is the most important since Scots pine prefers the VT and less fertile sites whereas the MT and more fertile sites are favorable for Norway spruce. Therefore, we reclassified the results of Table 3 (whole data, one neighbor) to show distinction between the forest site types of MT and VT. Thus, all estimates of MT and more fertile sites were combined to MT class and, correspondingly, all estimates of VT and less fertile to VT class. The results showed that the classification rate was then about 87%. For practical forestry, this figure can be regarded as highly satisfactory. On the other hand, forest site type is also used as an independent variable in the currently applied growth and yield models (e.g., [46]). Therefore it is also likely that the use of any misclassified site type cause bias in the model-based predictions. However, it is important to note that our results were based on forest stands of one National Park where the structural variation between and within individual forest stands can be regarded as highly heterogeneous. In managed forests, however, the forest stand structure is usually more stable due to the forest management activities, and therefore it can be expected that better classification results can be obtained by using the approach of this study. Furthermore, when applying micro segment based sub-stands, the within stand variation, which was considerable among the delineated forest stands of this study, is reduced and it can therefore be expected that also this procedure would increase the classification rate of forest site types based on the ALS information.

5. Conclusions

Classification to the five different fertility classes succeeded in approximately 58% of the mature forest stands by using ALS data and the k-NN method with five neighbors. Our results implicate that the different site quality classes of forests with characteristic growth and yield potentials can be moderately separated from each other on the grounds of differences in the vertical and horizontal changes in laser pulse distributions. The k-NN method was found to be applicable to classification of mature boreal forest stands. However, its employment in classifying young stands with ALS data still needs to be developed further. Forest site types can be defined from ALS data by employing the method suggested here together with extensive reference data. The technique should also be useful in the efficient identification of forest site types in large-scale forest inventories. Classification results could be further improved by developing new methods by using them in conjunction with a more accurate delineation of the area and by employing aerial images, laser scanner data, and digital terrain maps.

Acknowledgements

This research was conducted in the University of Eastern Finland, and the Joensuu Research Unit of the Finnish Forest Research Institute. It was partly funded by the Maj & Tor Nessling foundation and the Finnish Ministry of the Environment through the project ‘A monitoring system based on modern remote sensing imagery for natural forests and restored forests in conservation areas’ (Decision No. YM89/5512/2004). We are grateful to these institutions for resources and funding. The text of this study is partly based on the paper by Vehmas et al. in Silvilaser 2008.

References and Notes

  1. Cajander, A.K. The Theory of Forests Types. Acta Forestalia Fennica 1926, 29, 1–108. [Google Scholar]
  2. Clutter, J.L.; Fortson, J.C.; Pienaar, L.V.; Brister, G.H.; Bailey, R.L. Timber Management: A Quantitative Approach; John Wiley & Sons: New York, NY, USA, 1983. [Google Scholar]
  3. Kuusipalo, J. An ecological study of upland forest site classification in Southern Finland. Acta Forestalia Fennica 1985, 192, 1–77. [Google Scholar]
  4. Poso, S. Kuvioittaisen arviomismenetelmien perusteita. Basic features of forest inventory by compartments. Silva Fennica 1983, 17, 313–349, (In Finnish, with English summary). [Google Scholar] [CrossRef]
  5. Hyppänen, H.; Pasanen, K.; Saramäki, J. Päätehakkuiden kuviorajojen päivitystarkkuus. Metsätieteen aikakauskirja 1996, 4, 321–335. (In Finnish) [Google Scholar]
  6. Uuttera, J.; Hyppänen, H. Determination of potential key-biotope areas in managed forests of Finland using existing inventory data and digital aerial photographs. Forest Landscape Res. 1998, 1, 415–429. [Google Scholar]
  7. Næsset, E. Practical large-scale forest stand inventory using small-footprint airborne scanning laser. Scand. J. Forest Res. 2004, 19, 164–179. [Google Scholar] [CrossRef]
  8. Maltamo, M.; Malinen, J.; Packalén, P.; Suvanto, A.; Kangas, J. Nonparametric estimation of stem volume using airborne laser scanning, aerial photography, and stand-register data. Can. J. Forest Res. 2006, 36, 426–436. [Google Scholar] [CrossRef]
  9. Ritchie, J.C.; Jackson, T.J.; Everitt, J.H.; Escobar, D.E.; Murphey, J.B. Airborne laser: A tool to study landscape surface features. J. Soil Water Conserv. 1992, 47, 104–107. [Google Scholar]
  10. Lim, K.; Treitz, P.; Wulder, M.; St-Onge, B.; Flood, M. ALS remote sensing of forest structure. Prog. Phys. Geog. 2003, 27, 88–106. [Google Scholar] [CrossRef]
  11. Næsset, E. Determination of mean tree height of forest stands using airborne laser scanner data. ISPRS J. Photogramm. Remote Sens. 1997, 52, 49–56. [Google Scholar] [CrossRef]
  12. Magnussen, S.; Boudewyn, P. Derivations of stand heights from airborne laser scanner data with canopy-based quantile estimators. Can. J. Forest Res. 1998, 28, 1016–1031. [Google Scholar] [CrossRef]
  13. Hyyppä, J.; Kelle, O.; Lehikoinen, M.; Inkinen, M. A segmentation-based method to retrieve stem volume estimates from 3-dimensional tree height models produced by laser scanner. IEEE Trans. Geosci. Remote Sens. 2001, 39, 969–975. [Google Scholar] [CrossRef]
  14. Hopkinson, C.; Chasmer, L.; Lim, K.; Treitz, P.; Creed, I. Towards a universal Lidar canopy height indicator. Can. J. Remote Sens. 2006, 32, 139–152. [Google Scholar] [CrossRef]
  15. Riaño, D.; Meier, E.; Allgöwer, B.; Chuvieco, E.; Ustin, S.L. Modeling airborne laser scanning data for the spatial generation of critical forest parameters in fire behaviour modelling. Remote Sens. Environ. 2003, 86, 177–186. [Google Scholar] [CrossRef]
  16. Andersen, H-E.; McGaughey, R.J.; Reutebuch, S.E. Estimating forest canopy fuel parameters using LIDAR data. Remote Sens. Environ. 2005, 94, 441–449. [Google Scholar]
  17. Maltamo, M.; Packalén, P.; Yu, X.; Eerikäinen, K.; Hyyppä, J.; Pitkänen, J. Identifying and quantifying structural characteristics of heterogenous boreal forests using laser scanner data. Forest Ecol. Manage. 2005, 216, 41–50. [Google Scholar] [CrossRef]
  18. Goodwin, N.R.; Coops, N.C.; Bater, C.; Gergel, S.E. Assessment of Sub-Canopy Structure in a Complex Coniferous Forest. In Proceedings of ISPRS Workshop on Laser Scanning 2007 and SilviLaser 2007, Espoo, Finland, September 12–14, 2007; In The International Archives of the Photogrammetry and Remote Sensing and Spatial Information Sciences. ISPRS: Vienna, Austria, 2007; Vol. XXXVI, Part 3/W52. pp. 169–172. [Google Scholar]
  19. Hill, R.A. Going Undercover: Mapping Woodland Understorey from Leaf-On and Leaf-Off Lidar Data. In Proceedings of ISPRS Workshop on Laser Scanning 2007 and SilviLaser 2007, Espoo, Finland, September 12–14, 2007; In The International Archives of the Photogrammetry and Remote Sensing and Spatial Information Sciences. ISPRS: Vienna, Austria, 2007; Vol. XXXVI, Part 3/W52. pp. 184–189. [Google Scholar]
  20. Bollandsås, O.M.; Hanssen, K.H.; Martiniussen, S.; Næsset, E. Measures of spatial forest structure derived from airborne laser data are associated with natural regeneration patterns in an uneven-aged spruce forest. Forest Ecol. Manage. 2008, 255, 953–961. [Google Scholar] [CrossRef]
  21. Bater, C.W.; Coops, N.C.; Gergel, S.E.; Goodwin, N.R. Towards the Estimation of Tree Structural Class in Northwest Coastal Forests Using Lidar Remote Sensing. In Proceedings of ISPRS Workshop on Laser Scanning 2007 and SilviLaser 2007, Espoo, Finland, September 12–14, 2007; In The International Archives of the Photogrammetry and Remote Sensing and Spatial Information Sciences. ISPRS: Vienna, Austria, 2007; Vol. XXXVI, Part 3/W52. pp. 38–43. [Google Scholar]
  22. Pesonen, A.; Maltamo, M.; Eerikäinen, K.; Packalén, P. Airborne laser scanning-based prediction of coarse woody debris volumes in a conservation area. Forest Ecol. Manage. 2008, 255, 3288–3296. [Google Scholar] [CrossRef]
  23. Brennan, R.; Webster, T.L. Object-oriented land cover classification of lidar-derived surfaces. Can. J. Remote Sens. 2006, 32, 162–172. [Google Scholar] [CrossRef]
  24. Hopkinson, C.; Chasmer, L. Modelling Canopy Gap Fraction from Lidar Intensity. In Proceedings of ISPRS Workshop on Laser Scanning 2007 and SilviLaser 2007, Espoo, Finland, September 12–14, 2007; In The International Archives of the Photogrammetry and Remote Sensing and Spatial Information Sciences. ISPRS: Vienna, Austria, 2007; Vol. XXXVI, Part 3/W52. pp. 190–194. [Google Scholar]
  25. Ørka, H.O.; Næsset, E.; Bollandsås, O.M. Utilizing Airborne Laser Intensity for Tree Species Classification. In Proceedings of ISPRS Workshop on Laser Scanning 2007 and SilviLaser 2007, Espoo, Finland, September 12–14, 2007; In The International Archives of the Photogrammetry and Remote Sensing and Spatial Information Sciences. ISPRS: Vienna, Austria, 2007; Vol. XXXVI, Part 3/W52. pp. 300–304. [Google Scholar]
  26. Ahokas, E.; Kaasalainen, S.; Hyyppä, J.; Suomalainen, J. Calibration of the Optech ALTM 3100 Laser Scanner Intensity Data Using Brightness Targets. In Proceedings of ISPRS Commission I Symposium, Paris, France, May 2–6, 2006; In The International Archives of the Photogrammetry and Remote Sensing and Spatial Information Sciences. ISPRS: Vienna, Austria, 2006; Vol. XXXVI. Part A1, T03-11. [Google Scholar]
  27. Rombouts, J.H. Exploring the Potential of Airborne LiDAR for Site Quality Assessment of Radiate Pine Plantations in South Australia: Initial Results. In Proceedings of Forest Measurement and Information Systems, Biennial Meeting 2006, Research Working Group 2, Woodend, Australia, November 21–24 2006.
  28. Gatziolis, D. Lidar-Derived Site Index in the US Pacific Northwest—Challenges and Opportunities. In Proceedings of ISPRS Workshop on Laser Scanning 2007 and SilviLaser 2007, Espoo, Finland, September 12–14, 2007; In The International Archives of the Photogrammetry and Remote Sensing and Spatial Information Sciences. ISPRS: Vienna, Austria, 2007; Vol. XXXVI, Part 3/W52. pp. 136–143. [Google Scholar]
  29. Eerikäinen, K. A site dependent simultaneous growth projection model for Pinus kesiya plantations in Zambia and Zimbabwe. Forest Sci. 2002, 48, 518–529. [Google Scholar]
  30. Pitkänen, S. Correlation between stand strucure and ground vegetation: An analytical approach. Plant Ecol. 1997, 131, 109–126. [Google Scholar] [CrossRef]
  31. Korpela, I.; Koskinen, M.; Holopainen, M.; Vasander, H.; Minkkinen, K. Airborne small-footprint discrete-return LiDAR data in the assessment of boreal mire surface patterns, vegetation and habitats. Forest Ecol. Manage. 2009, 258, 1549–1566. [Google Scholar] [CrossRef]
  32. Vehmas, M.; Eerikäinen, K.; Peuhkurinen, J.; Packalén, P.; Maltamo, M. Identification of boreal forest stands with high herbaceous plant diversity using airborne laser scanning. Forest Ecol. Manage. 2009, 257, 46–53. [Google Scholar] [CrossRef]
  33. Moeur, M.; Stage, A.R. Most similar neighbor: An improved sampling inference procedure for natural resource planning. Forest Sci. 1995, 41, 337–359. [Google Scholar]
  34. Holmström, H.; Nilsson, M.; Ståhl, G. Simultaneous estimations of forest parameters using aerial photograph interpreted data and the k nearest neighbour method. Scand. J. Forest Res. 2001, 16, 67–78. [Google Scholar] [CrossRef]
  35. Thessler, S.; Sesnie, S.; Ramos Bendaña, Z.; Ruokolainen, K.; Tomppo, E.; Finegan, B. Using k-NN and discriminant analyses to classify rain forest types in a Landsat TM image over northern Costa Rica. Remote Sens. Environ. 2008, 112, 2485–2494. [Google Scholar] [CrossRef]
  36. Peuhkurinen, J.; Maltamo, M.; Malinen, J. Estimating species-specific distributions and saw log recoveries of boreal forests from airborne laser scanning data and aerial photographs: A distribution-based approach. Silva Fennica 2008, 42, 625–641. [Google Scholar] [CrossRef]
  37. Kalliola, R. Suomen kasvimaantiede. Werner Söderström Osakeyhtiö: Porvoo, Finland, 1973. (In Finnish) [Google Scholar]
  38. Lyytikäinen, A. Kolin luonto, maisema ja kulttuurihistoria. Kolin luonnonsuojelututkimukset: Vesi- ja ympäristöhallituksen monistesarja, 1991; 308. (In Finnish) [Google Scholar]
  39. Grönlund, A.; Hakalisto, S. Management of Traditional Rural Landscapes in Koli National Park. Separate Plan of Koli National Park; Regional Environmental Publications 104; North Karelia Regional Environment Centre: Joensuu, Finland, 1998; pp. 1–81, (In Finnish, with English summary). [Google Scholar]
  40. Hokkanen, P. Vegetation Patterns of Boreal Herb-Rich Forests in the Koli Region, Eastern Finland: Classification, Environmental Factors and Conservation Aspects. Ph.D. Dissertation, Faculty of Forestry, University of Joensuu, Joensuu, Finland, 2006. [Google Scholar]
  41. Davis, L.S.; Johnson, K.N. Forest Management, 3rd ed.; McGraw-Hill: New York, NY, USA, 1987. [Google Scholar]
  42. Axelsson, P. DEM Generation from Laser Scanner Data Using TIN Models. In Proceedings of XIXth ISPRS Congress: Technical Commission IV, Amsterdam, The Netherlands, July 16–23, 2000; In The International Archives of the Photogrammetry and Remote Sensing and Spatial Information Sciences. ISPRS: Vienna, Austria, 2000; Vol. XXXIII, Part B4/1. pp. 110–117. [Google Scholar]
  43. Hyyppä, H.; Yu, X.; Hyyppä, J.; Kaartinen, H.; Kaasalainen, S.; Honkavaara, E.; Rönnholm., P. Factors Affecting the Quality of DTM Generation in Forested Areas. In Proceedings of the ISPRS Workshop Laser scanning 2005, Enschede, The Netherlands, September 12–14, 2005; In International Archives of Photogrammetry, Remote Sensing and Spatial Information Sciences. ISPRS: Vienna, Austria, 2005; Vol. XXXVI, Part 3/W19. pp. 85–90. [Google Scholar]
  44. LeMay, V.; Temesgen, H. Comparison of nearest neighbor methods for estimating basal area and stems per hectare using aerial auxiliary variables. Forest Sci. 2005, 51, 109–119. [Google Scholar]
  45. Cohen, J. A coefficient of agreement for nominal scales. Educ. Psychol. Meas. 1960, 20, 37–46. [Google Scholar] [CrossRef]
  46. Hynynen, J.; Ojansuu, R.; Hökkä, H.; Siipilehto, J.; Salminen, H.; Haapala, P. Models for Predicting Stand Development in MELA System; Research Papers 835; Finnish Forest Research Institute: Vantaa, Finland, 2002; p. 116. [Google Scholar]

