
Building Extraction and Floor Area Estimation at the Village Level in Rural China Via a Comprehensive Method Integrating UAV Photogrammetry and the Novel EDSANet

 , and
, and
Abstract
:1. Introduction
- (1)
- We propose a comprehensive method combining UAV oblique photogrammetry and deep learning technology for building extraction and floor area estimation of village-level homesteads. A novel EDSANet model is proposed to tackle the problem of complex surface feature scenes in remote sensing images and improve performance in building extraction;
- (2)
- We designed a semantic encoding module by applying three down-sample stages (with atrous convolution) to enlarge the receptive field and a spatial information encoding module with only six layers and three stages using one eighth of the original input to enrich spatial details and improve the accuracy in building extraction;
- (3)
- A dual attention module is proposed to extract useful information from the kernel and channel, respectively. To adjust the excessive convergence of building feature information after attention extraction, we propose an attention feature refinement module to further improve the extraction effect of the model for useful features by redefining the attention features, thereby improving the accuracy.
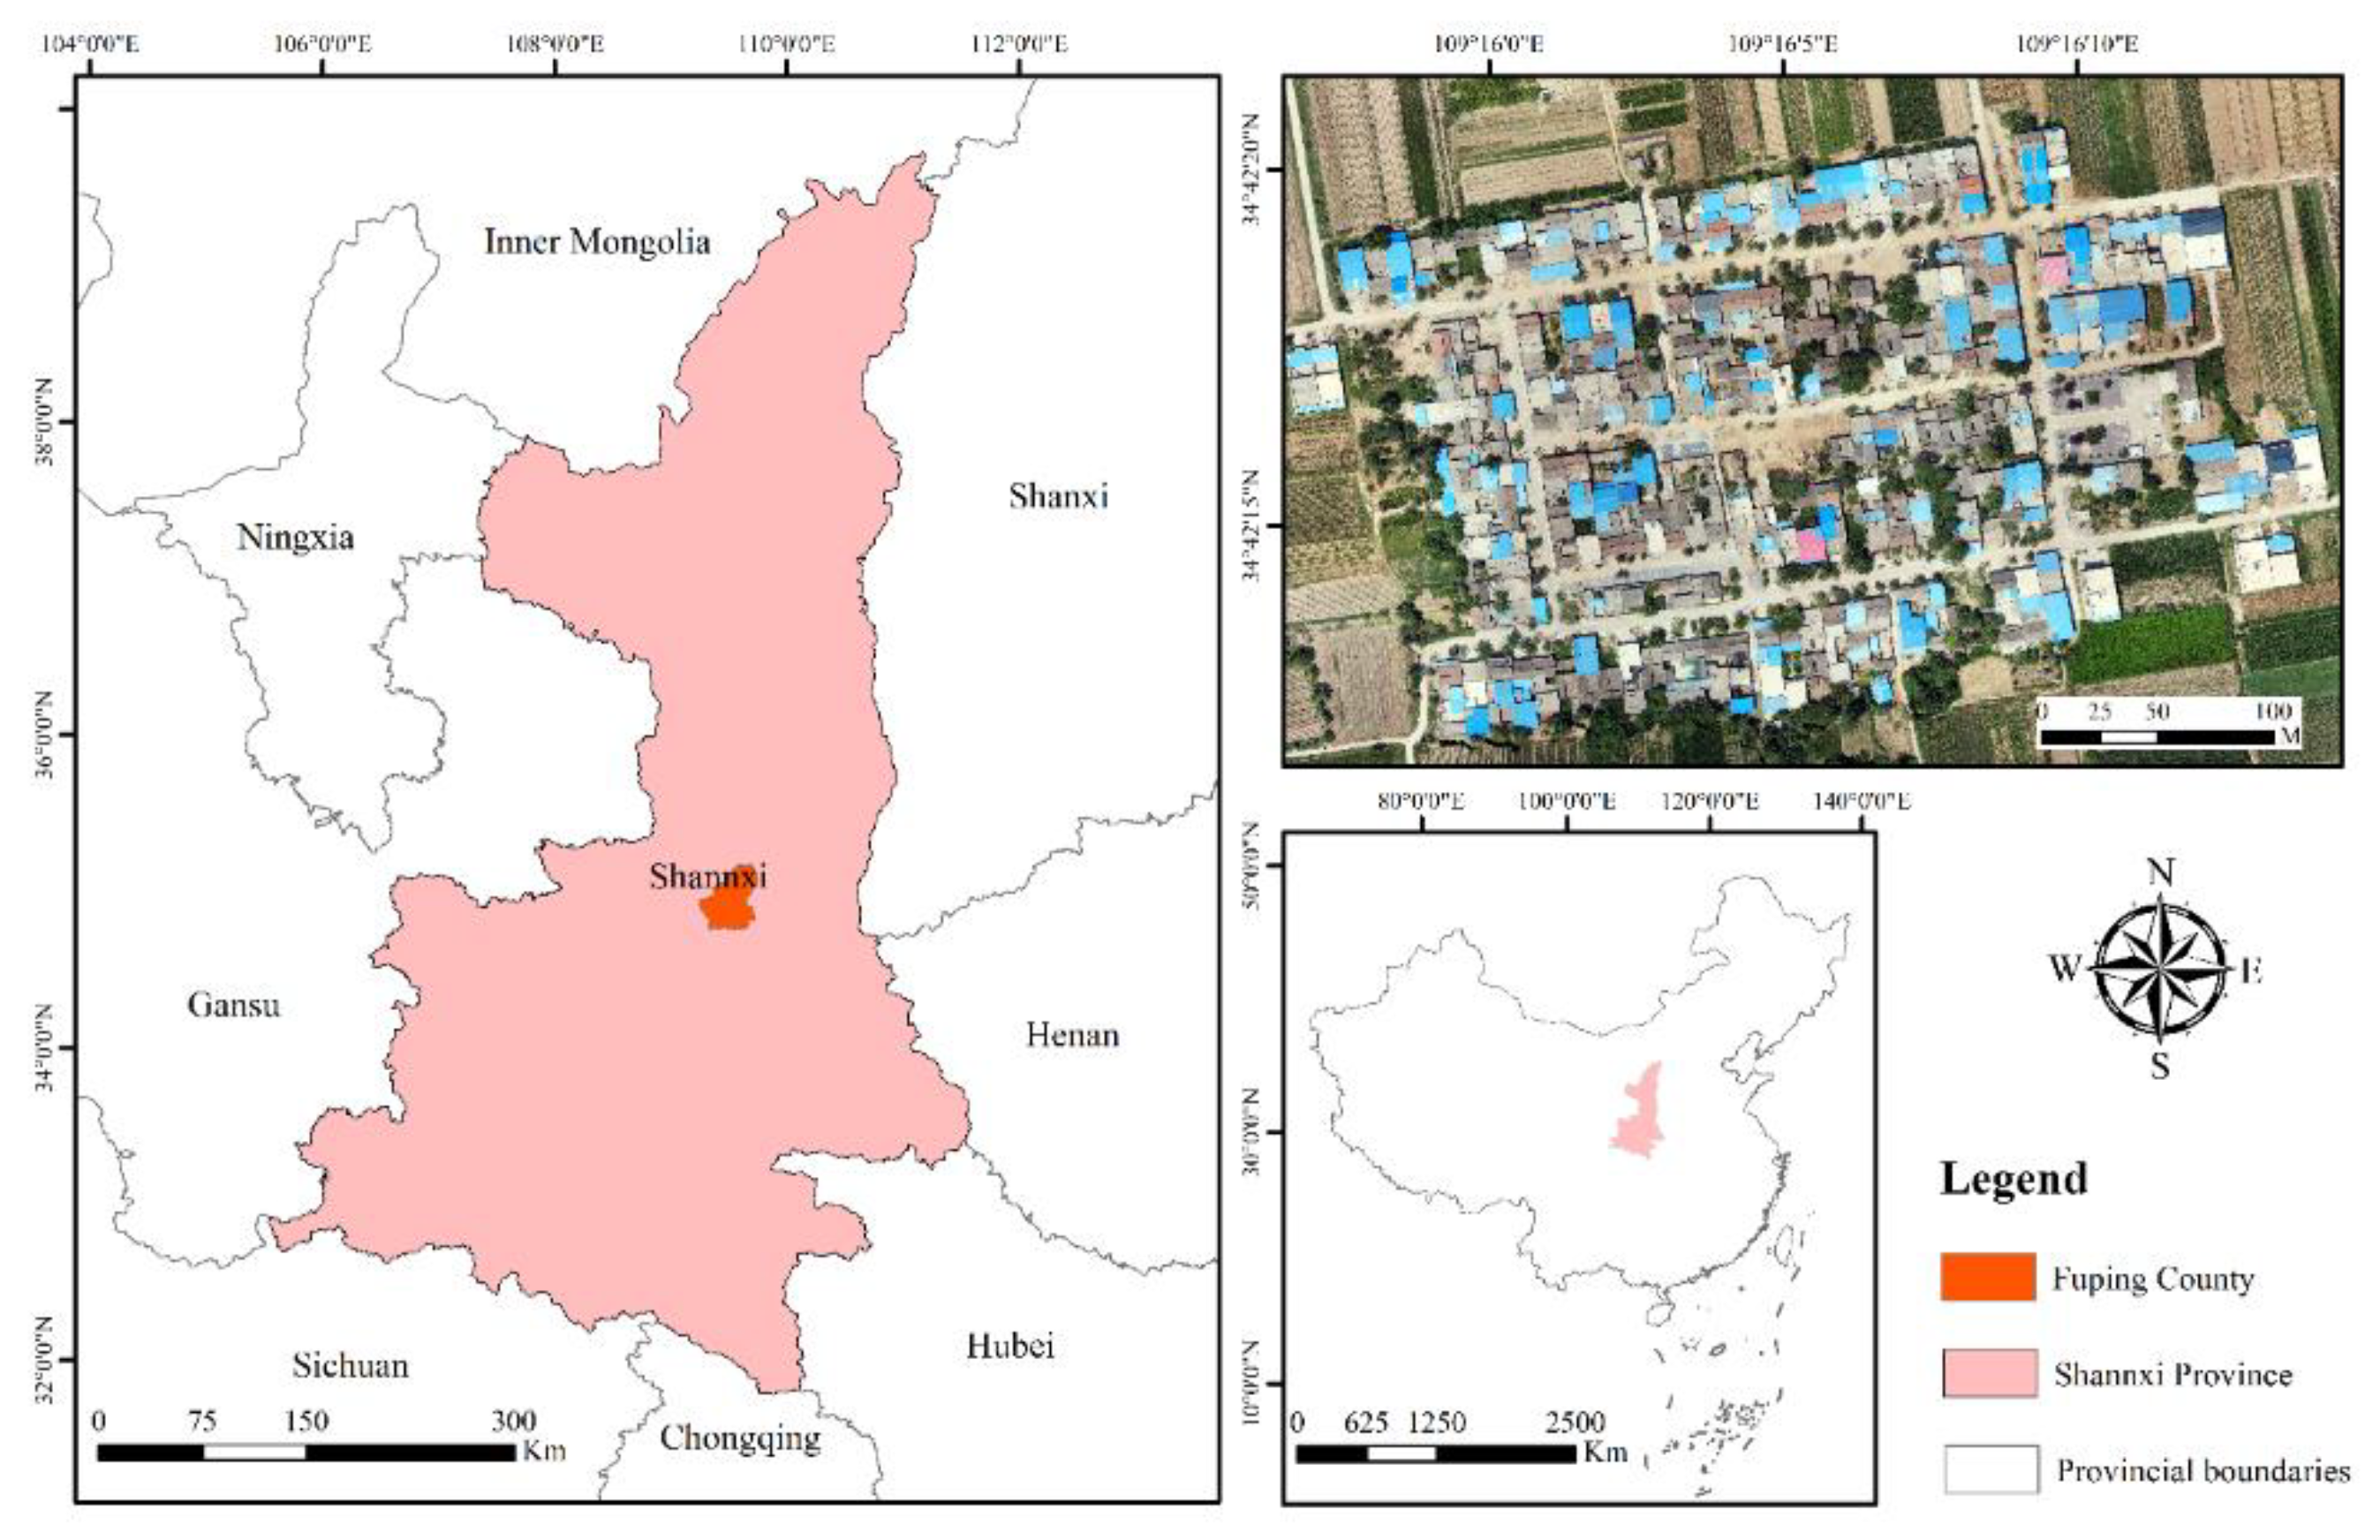
2. Study Area and Data
2.1. Study Area
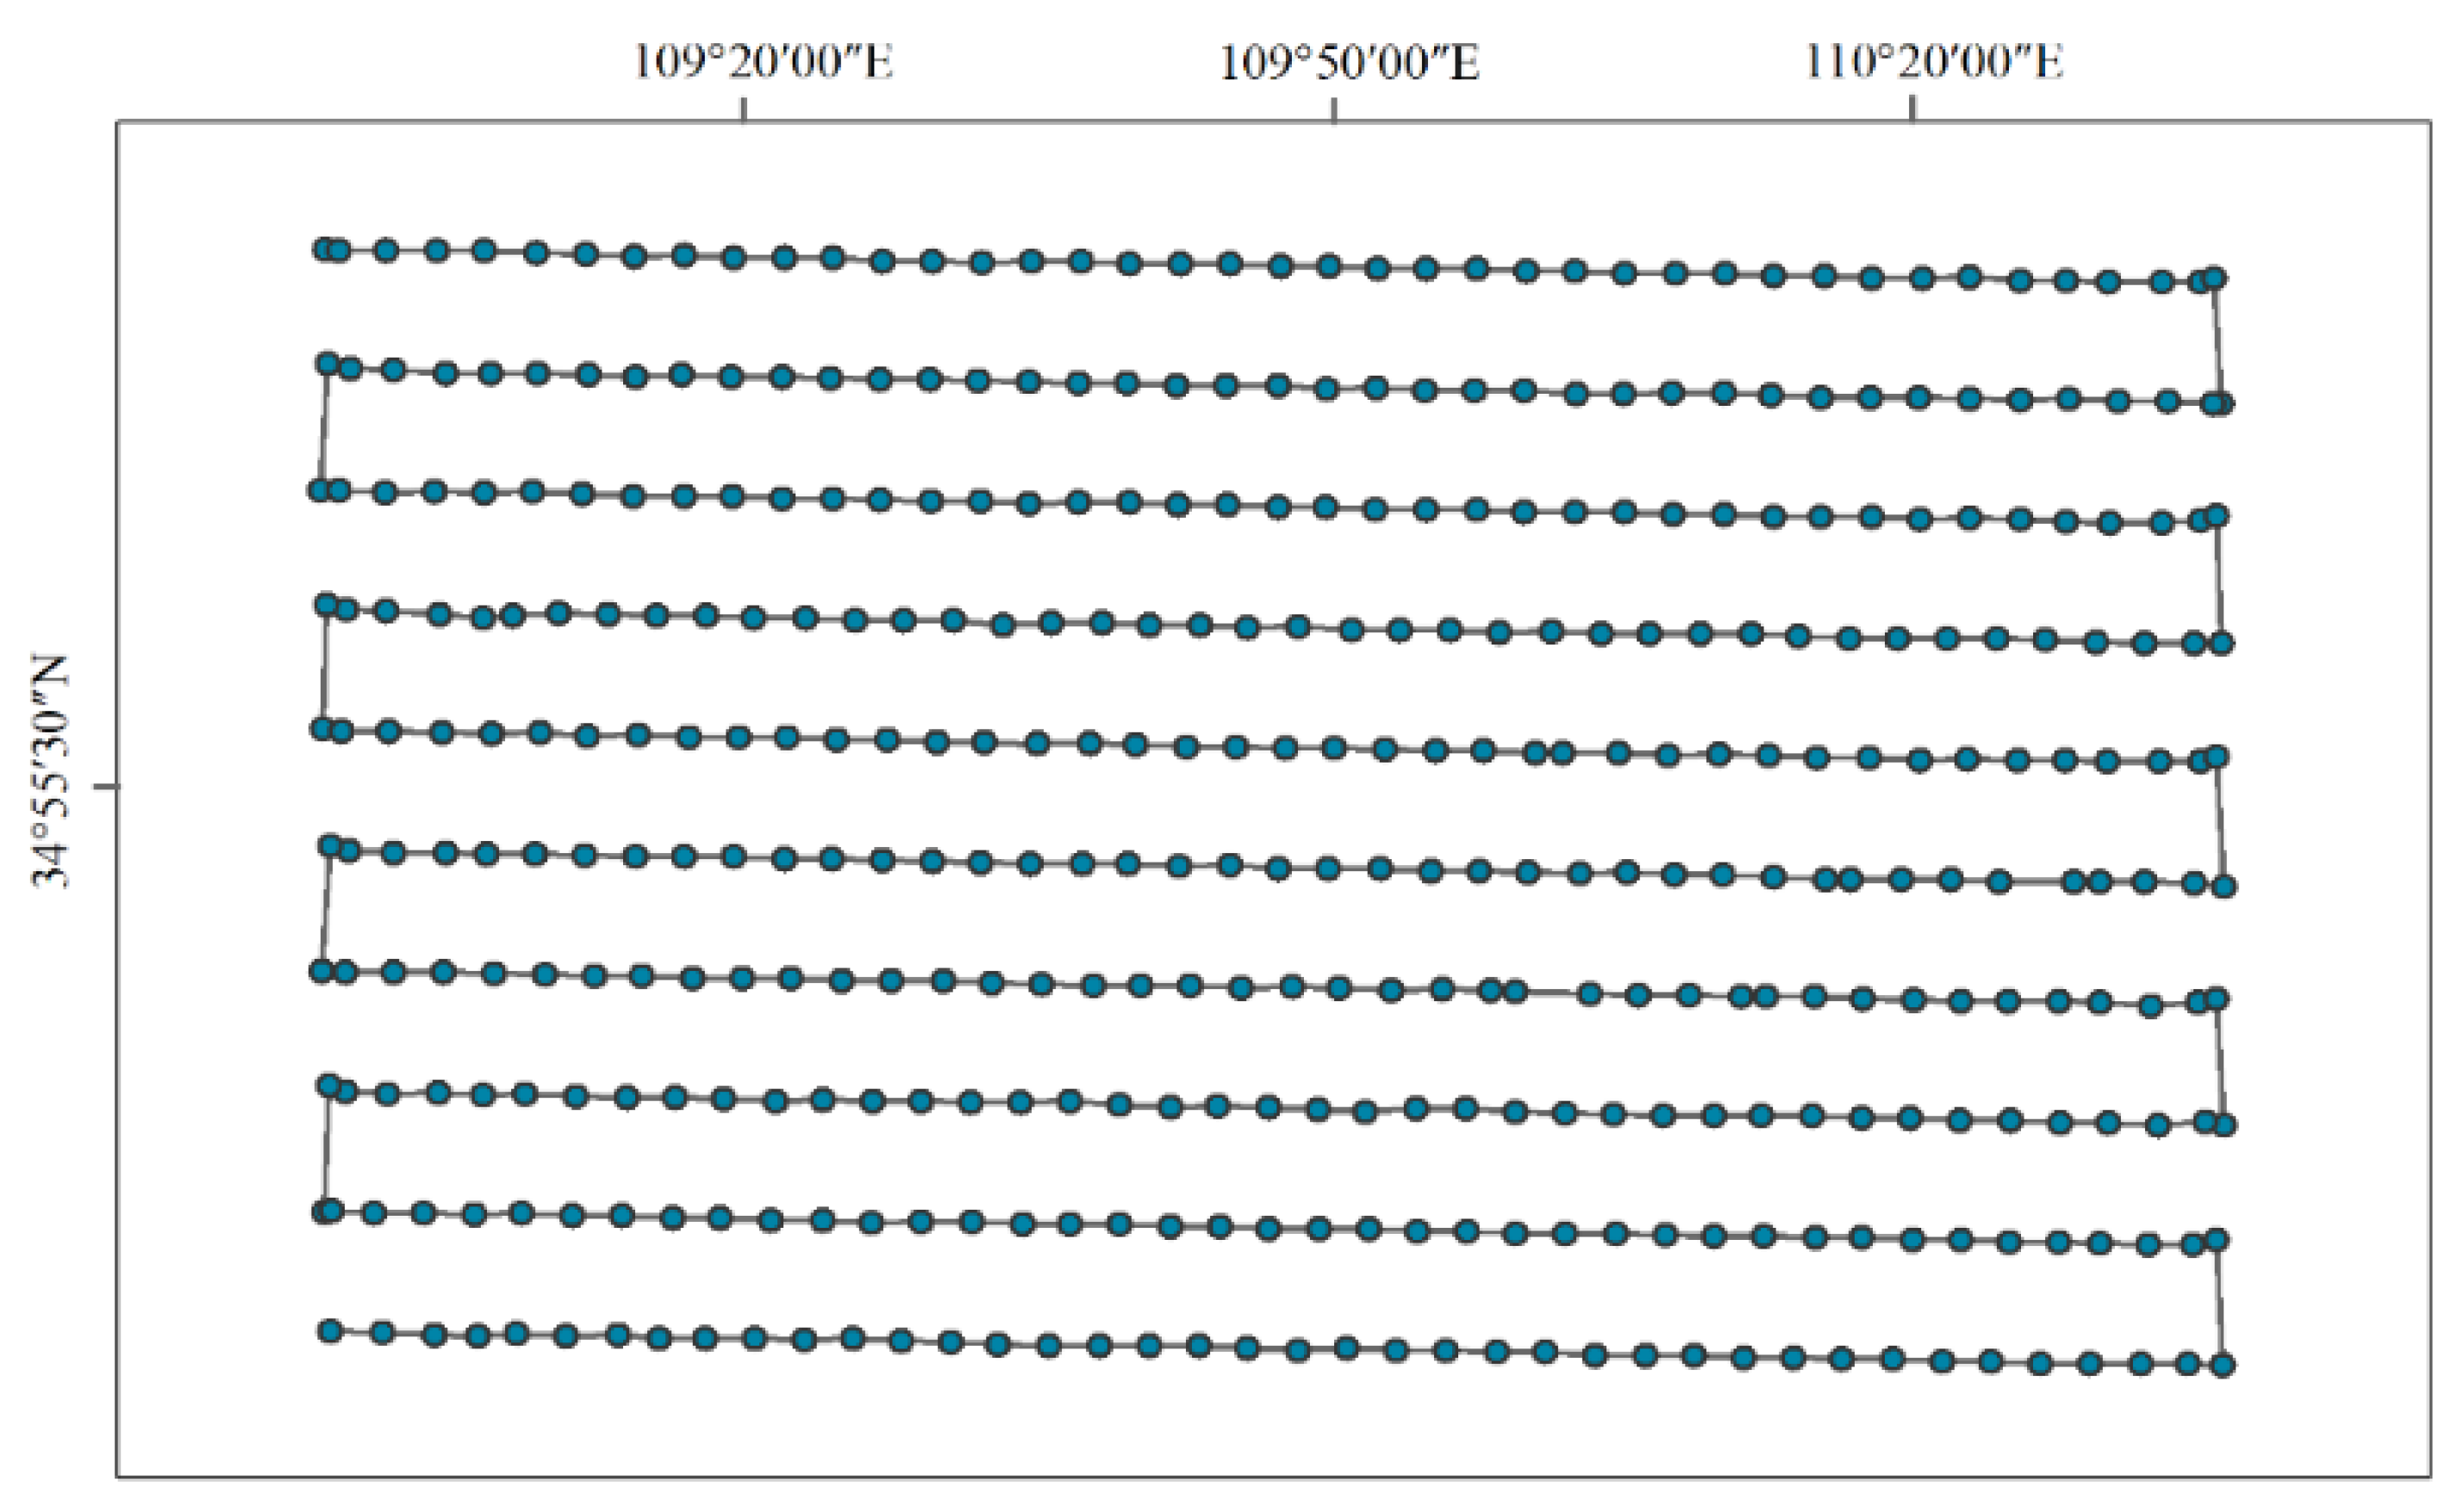
2.2. UAV Data
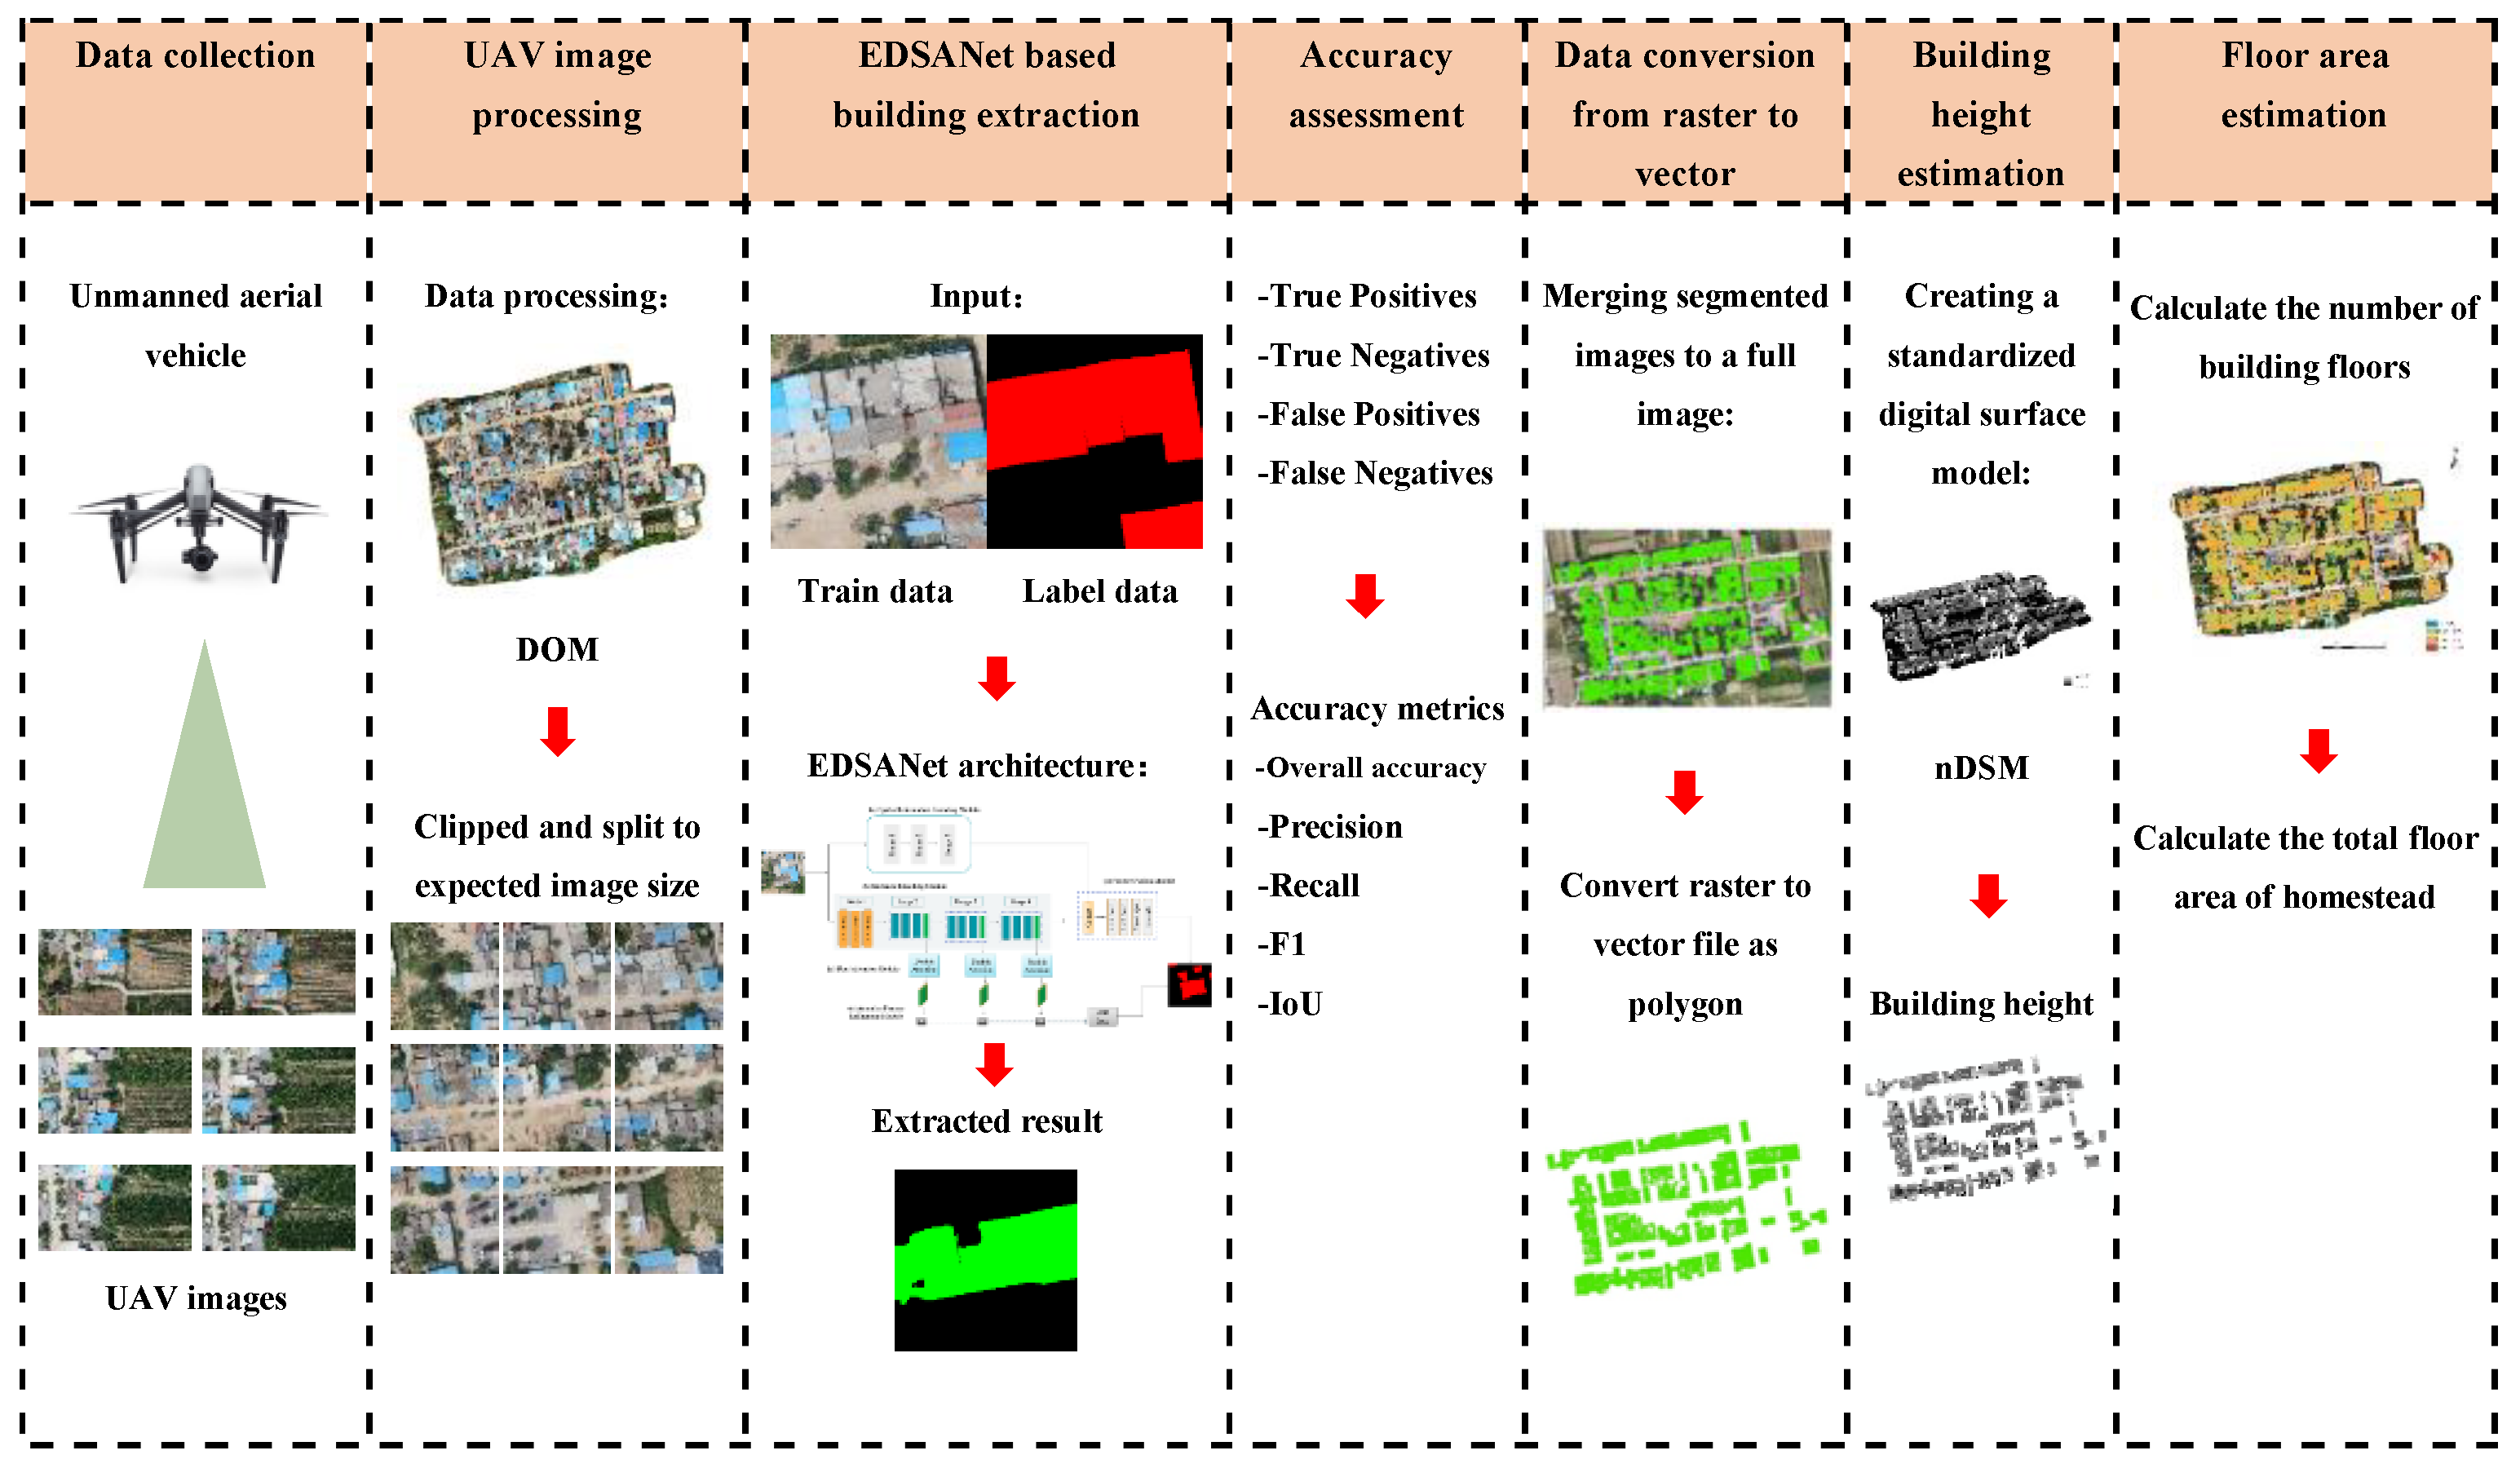
3. Methodology
3.1. Methodology
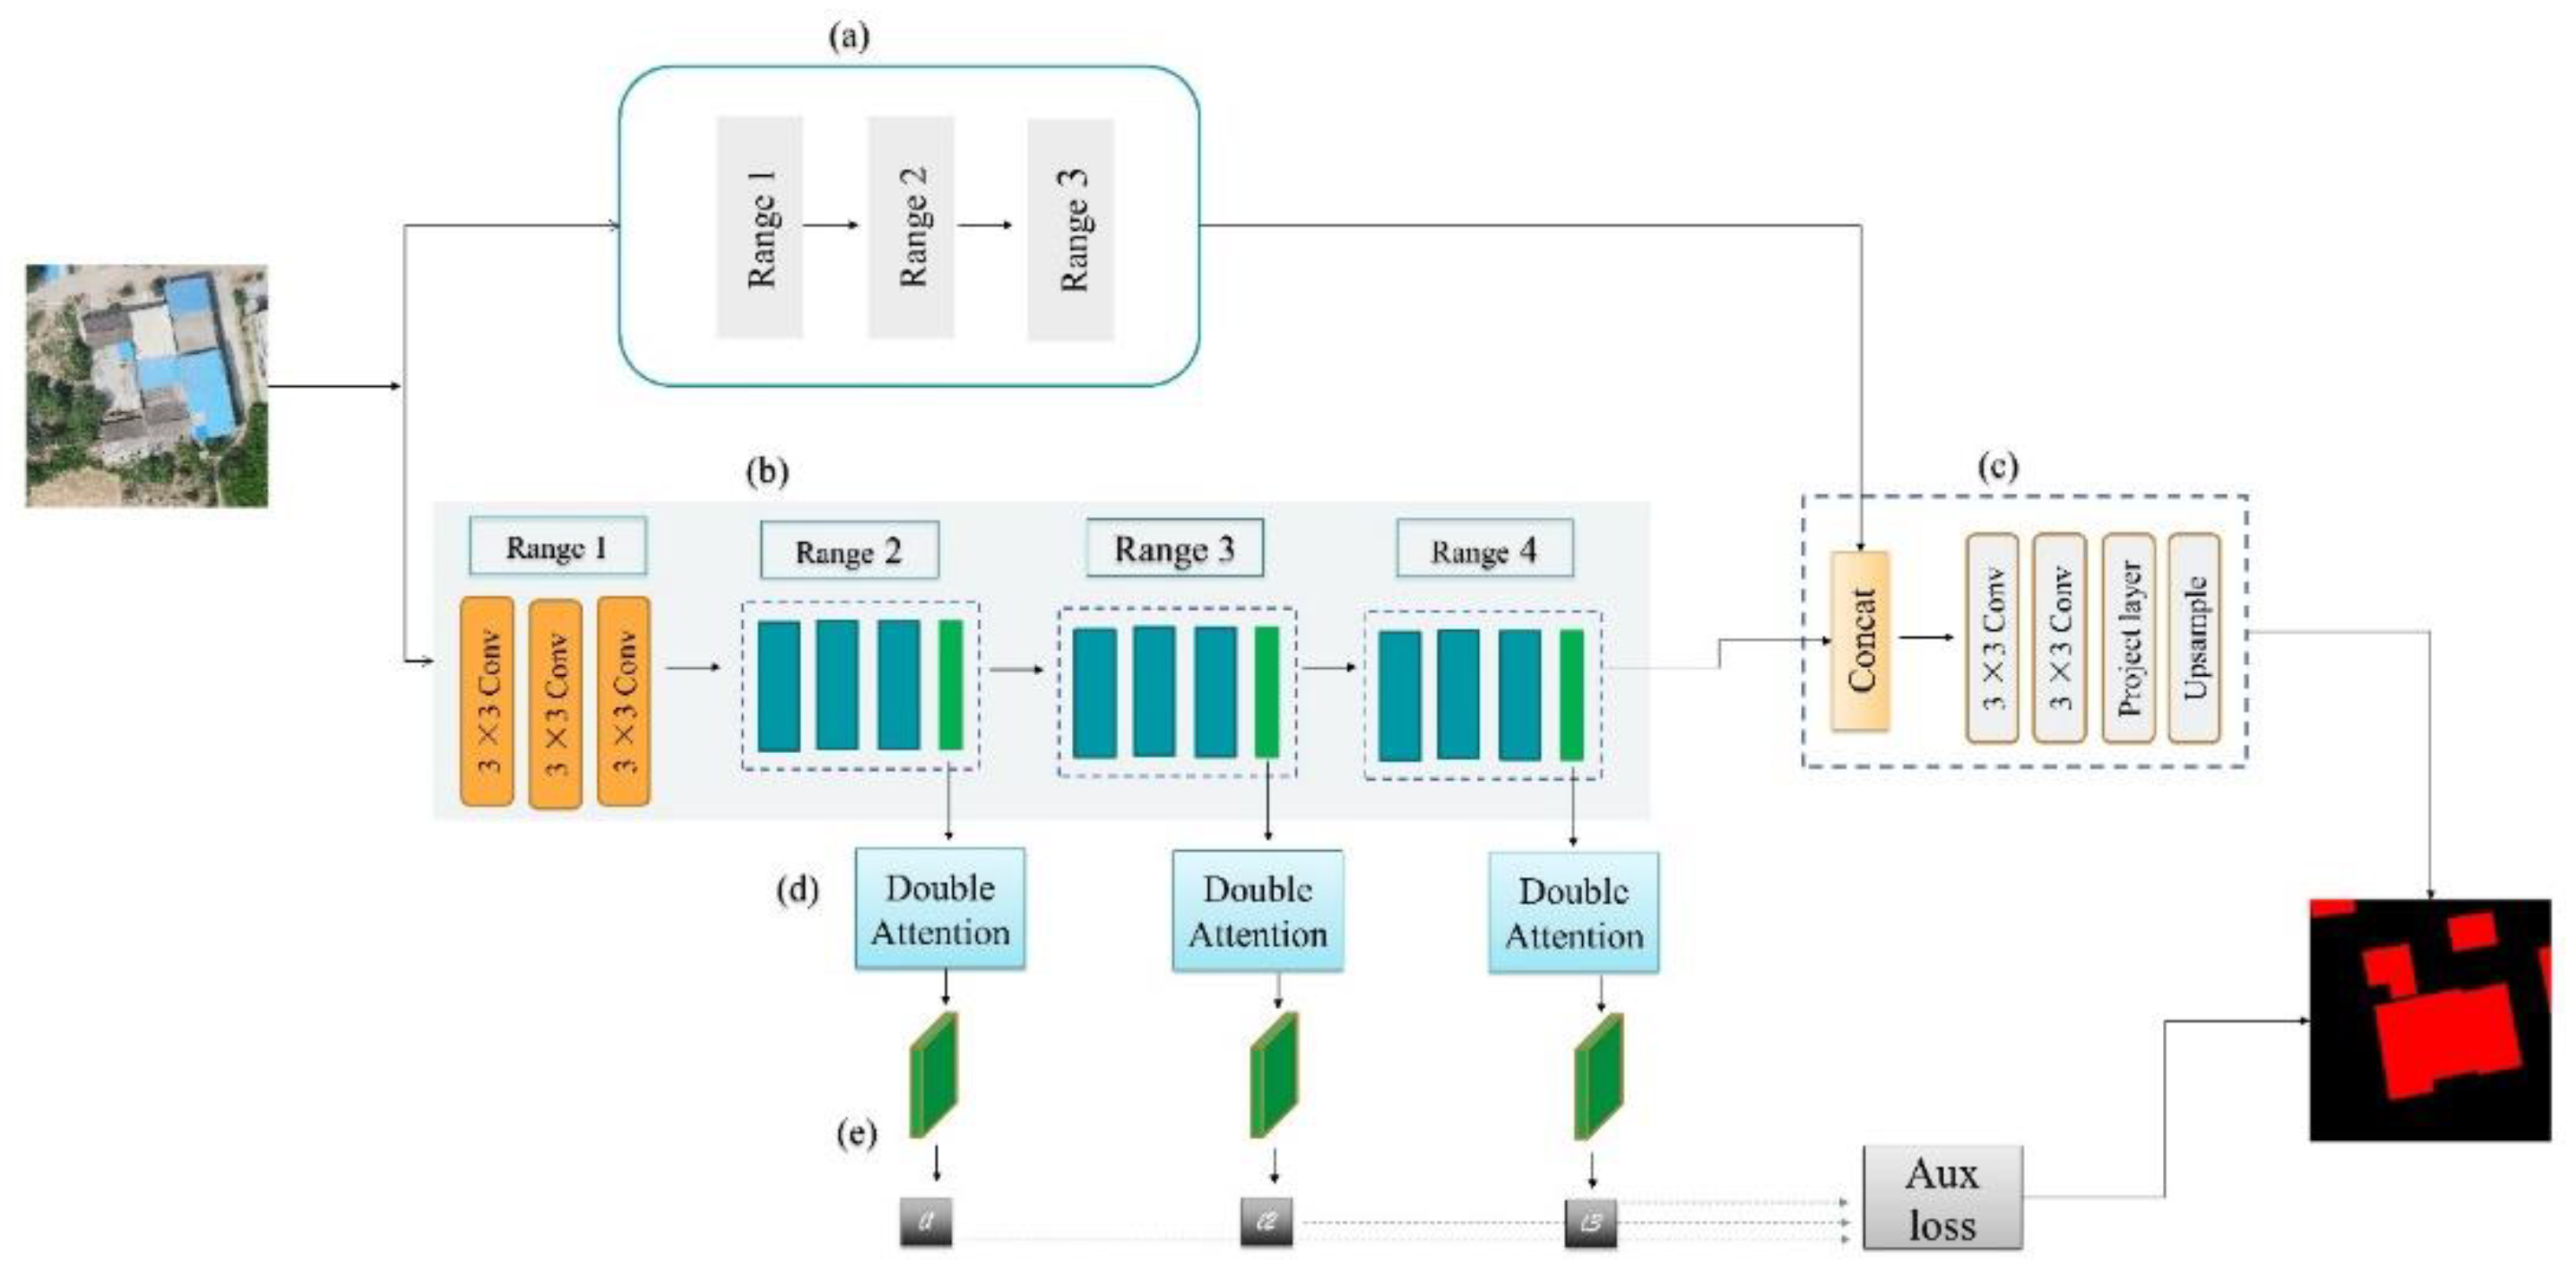
3.1.1. EDSANet Architecture
3.1.2. Semantic Encoding Module (SEM)
3.1.3. Spatial Information Encoding Module (SIEM)
3.1.4. Dual Attention Module (DAM)
3.1.5. Deep Supervision
3.1.6. Loss Function
3.2. Data Preprocessing
3.3. Experimental Setting
3.4. Evaluation Metrics
3.5. Building Height and Floor Area Estimation
4. Results
4.1. Building Extraction Using Deep Learning Models
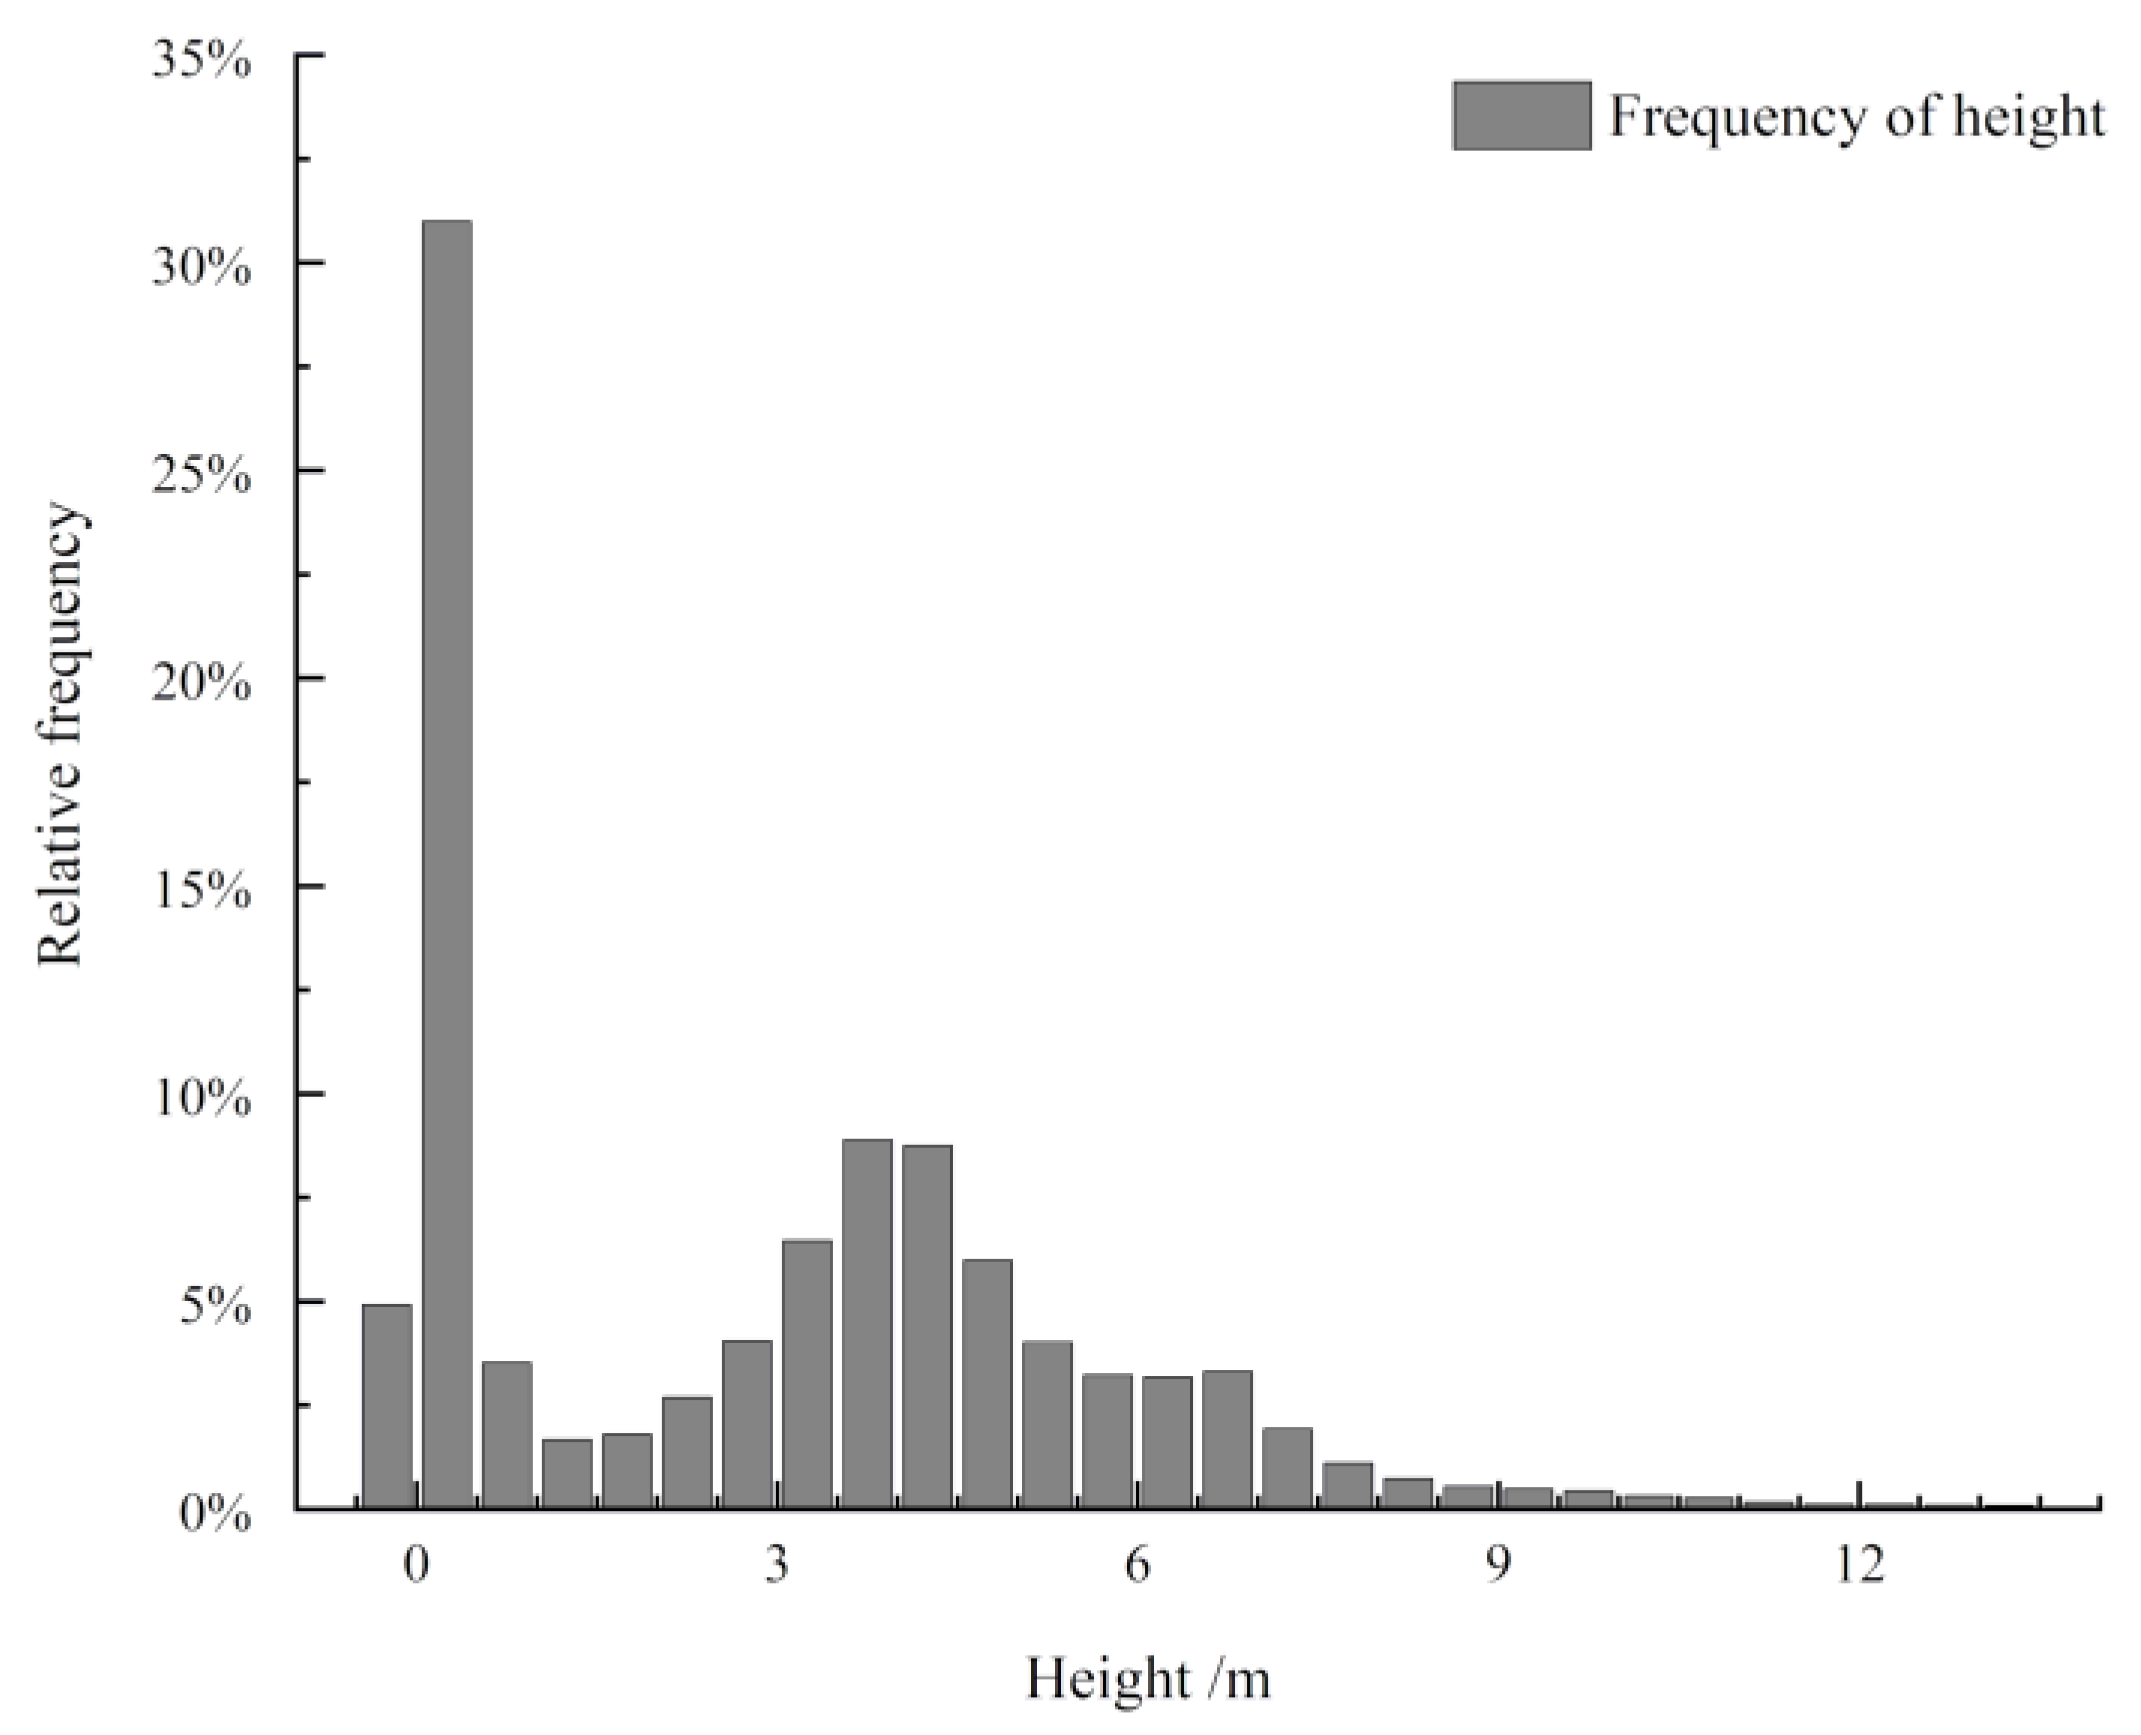
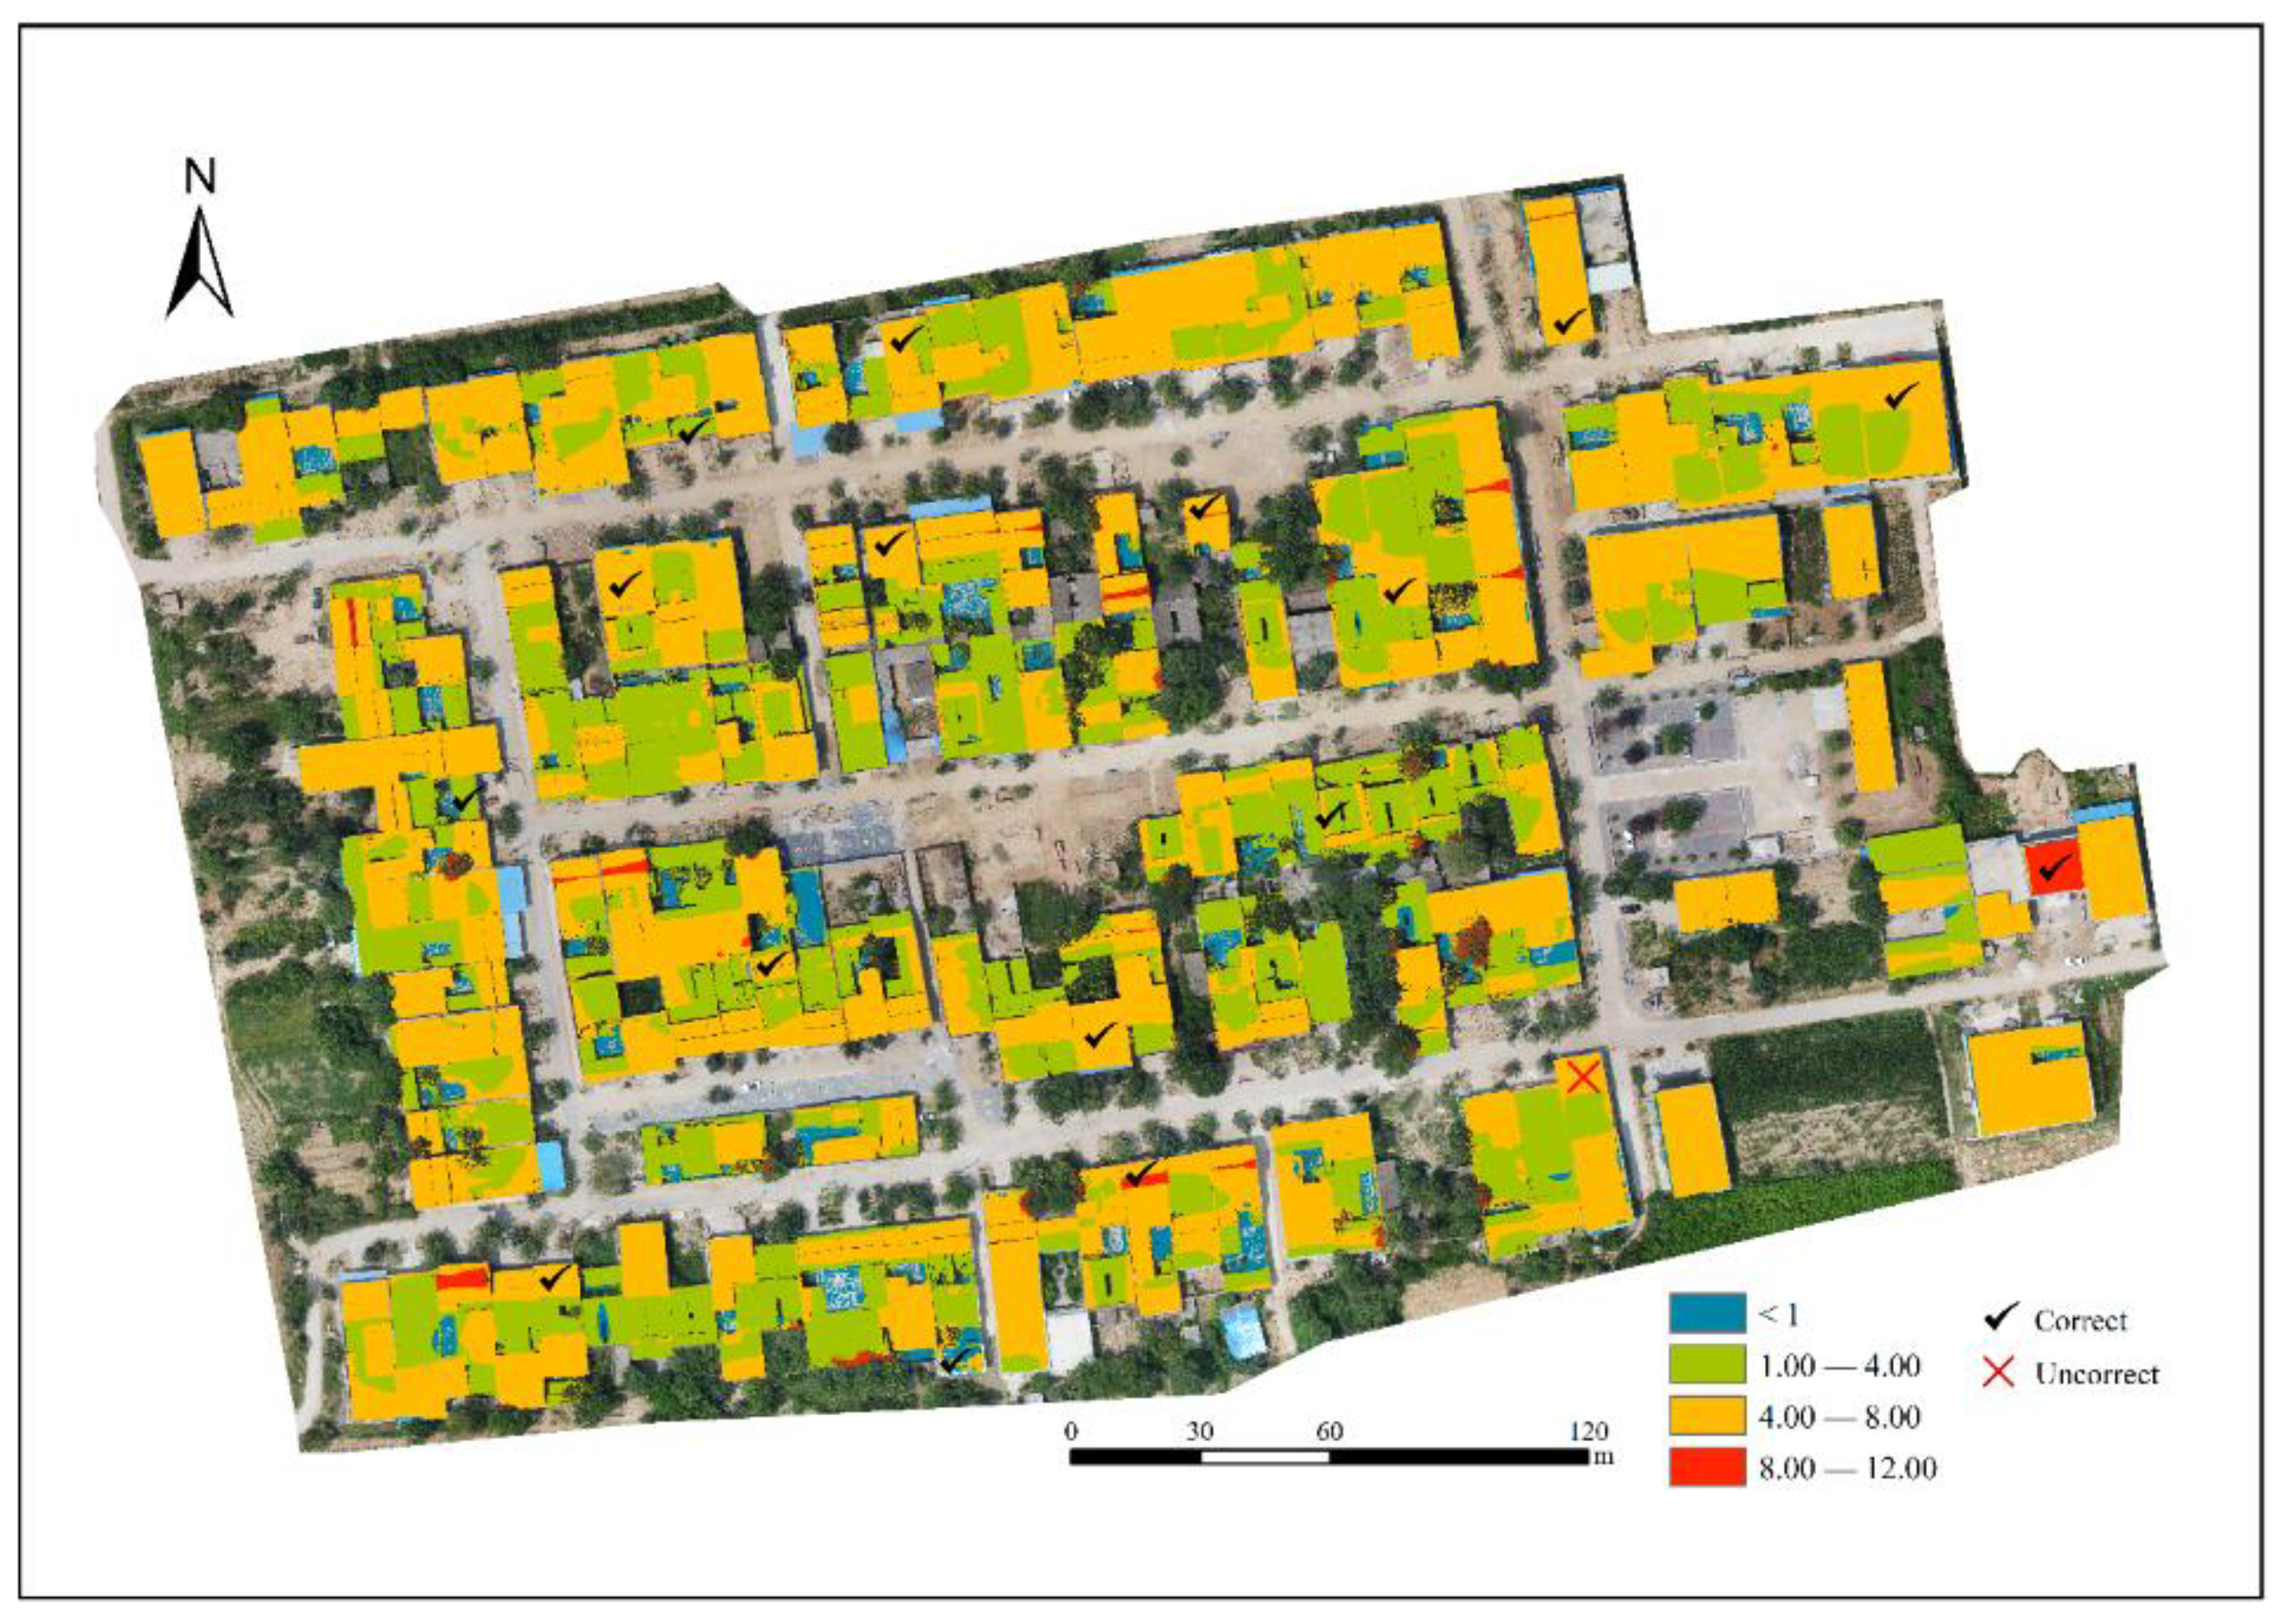
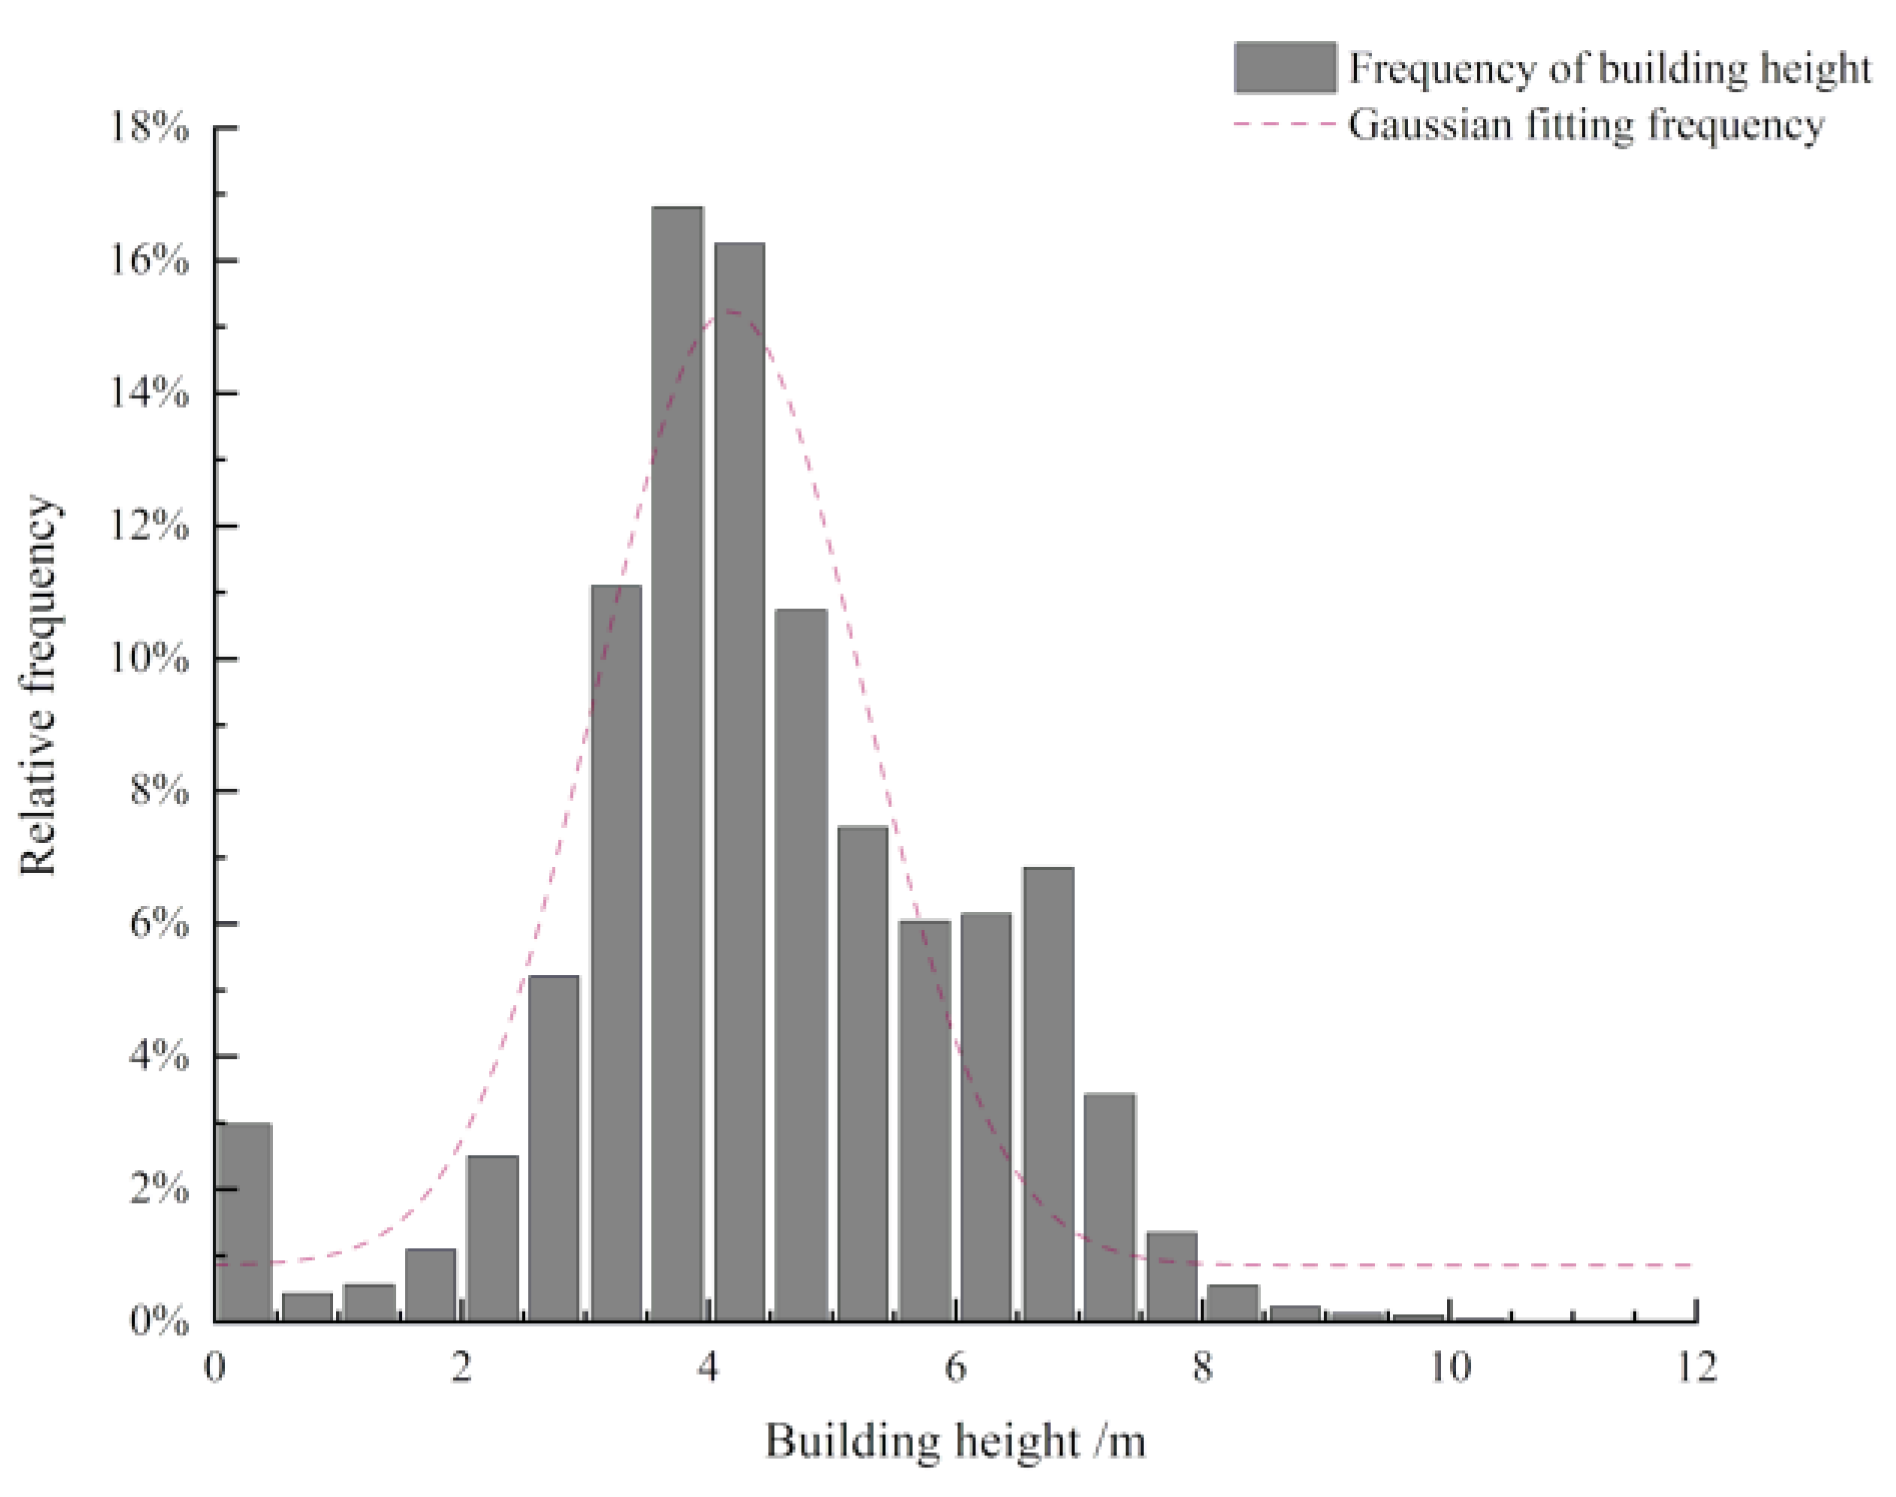
4.2. Building Height Estimation
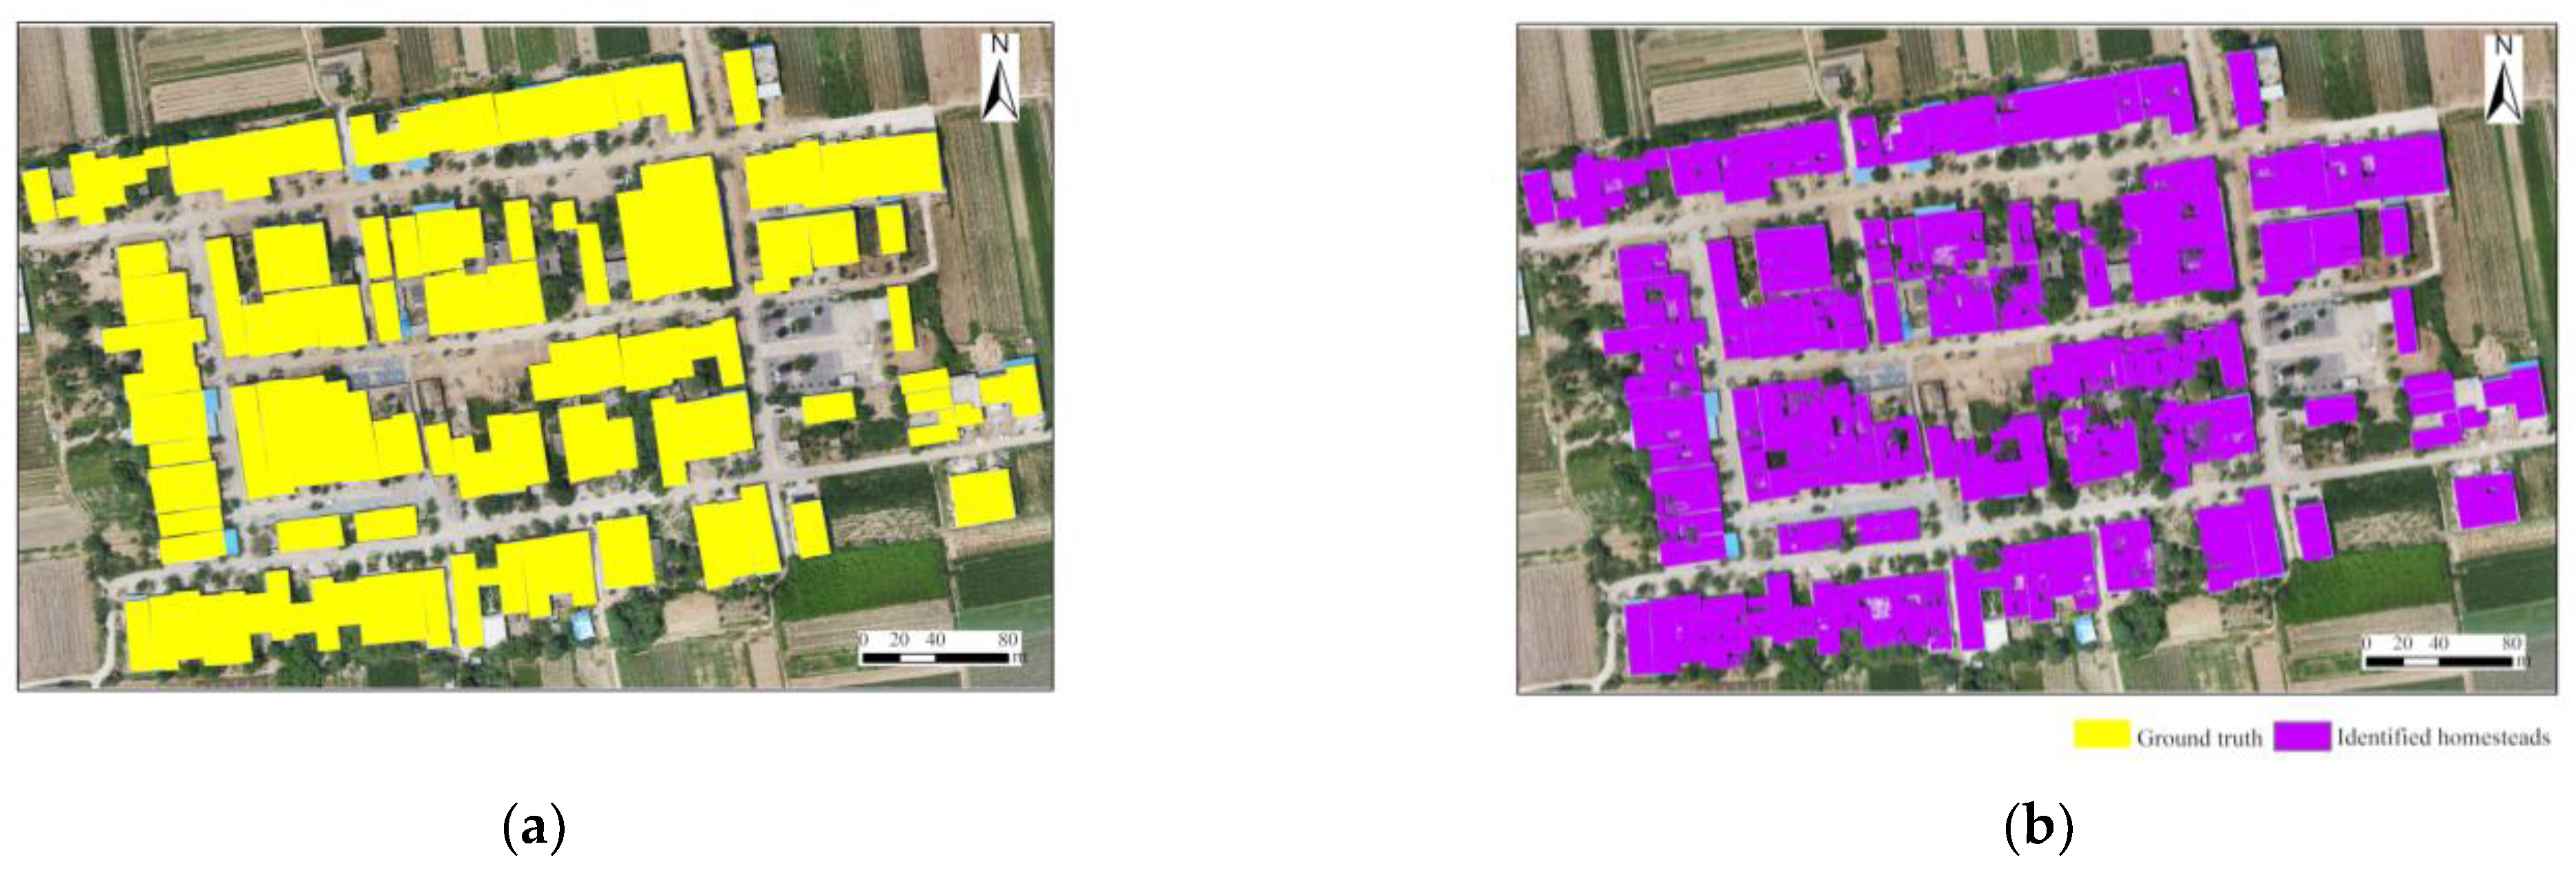
4.3. Floor Area Estimation
5. Discussion
5.1. Ablation Experiments
5.2. Summaries and Limitations
6. Conclusions
Author Contributions
Funding
Data Availability Statement
Acknowledgments
Conflicts of Interest
References
- Li, X.; Li, Z.; Yang, J.; Li, H.; Liu, Y.; Fu, B.; Yang, F. Seismic vulnerability comparison between rural Weinan and other rural areas in Western China. Int. J. Disaster Risk Reduct. 2020, 48, 101576. [Google Scholar] [CrossRef]
- Liu, Y.; So, E.; Li, Z.; Su, G.; Gross, L.; Li, X.; Qi, W.; Yang, F.; Fu, B.; Yalikun, A.; et al. Scenario-based seismic vulnerability and hazard analyses to help direct disaster risk reduction in rural Weinan, China. Int. J. Disaster Risk Reduct. 2020, 48, 101577. [Google Scholar] [CrossRef]
- Zhu, Q.; Li, Z.; Zhang, Y.; Guan, Q. Building Extraction from High Spatial Resolution Remote Sensing Images via Multiscale-Aware and Segmentation-Prior Conditional Random Fields. Remote Sens. 2020, 12, 3983. [Google Scholar] [CrossRef]
- Liu, S.Y.; Xiong, X.F. Property rights and regulation: Evolution and reform of China’s homestead system. China Econ. Stud. 2019, 6, 17–27. [Google Scholar]
- Liu, Y.; Fang, F.; Li, Y. Key issues of land use in China and implications for policy making. Land Use Policy 2014, 40, 6–12. [Google Scholar] [CrossRef]
- Yu, B.; Liu, H.; Wu, J.; Hu, Y.; Zhang, L. Automated derivation of urban building density information using airborne LiDAR data and object-based method. Landsc. Urban Plan. 2010, 98, 210–219. [Google Scholar] [CrossRef]
- Liu, Y.; Zheng, X.; Ai, G.; Zhang, Y.; Zuo, Y. Generating a High-Precision True Digital Orthophoto Map Based on UAV Images. ISPRS Int. J. Geo Inf. 2018, 7, 333. [Google Scholar] [CrossRef] [Green Version]
- Allouche, M.K.; Moulin, B. Amalgamation in cartographic generalization using Kohonen’s feature nets. Int. J. Geogr. Inf. Sci. 2005, 19, 899–914. [Google Scholar] [CrossRef]
- Dandabathula, G.; Sitiraju, S.R.; Jha, C.S. Retrieval of building heights from ICESat-2 photon data and evaluation with field measurements. Environ. Res. Infrastruct. Sustain. 2021, 1, 011003. [Google Scholar] [CrossRef]
- Kamath, H.G.; Singh, M.; Magruder, L.A.; Yang, Z.-L.; Niyogi, D.J. GLOBUS: GLObal Building heights for Urban Studies. arXiv 2022, arXiv:2205.12224. [Google Scholar]
- Weidner, U.; Förstner, W. Towards automatic building extraction from high-resolution digital elevation models. ISPRS J. Photogramm. Remote Sens. 1995, 50, 38–49. [Google Scholar] [CrossRef]
- Sefercik, U.G.; Karakis, S.; Bayik, C.; Alkan, M.; Yastikli, N. Contribution of Normalized DSM to Automatic Building Extraction from HR Mono Optical Satellite Imagery. Eur. J. Remote Sens. 2014, 47, 575–591. [Google Scholar] [CrossRef]
- Ji, C.; Tang, H. Gross Floor Area Estimation from Monocular Optical Image Using the NoS R-CNN. Remote Sens. 2022, 14, 1567. [Google Scholar] [CrossRef]
- Toth, C.; Jozkow, G. Remote sensing platforms and sensors: A survey. Isprs J. Photogramm. Remote Sens. 2016, 115, 22–36. [Google Scholar] [CrossRef]
- Colomina, I.; Molina, P. Unmanned aerial systems for photogrammetry and remote sensing: A review. ISPRS J. Photogramm. Remote Sens. 2014, 92, 79–97. [Google Scholar] [CrossRef] [Green Version]
- Wang, J.Z.; Lin, Z.J.; Li, C.M.; Hong, Z.G. 3D Reconstruction of Buildings with Single UAV Image. Remote Sens. Inf. 2004, 4, 11–15. [Google Scholar]
- Ma, Y.; Wu, H.; Wang, L.; Huang, B.; Ranjan, R.; Zomaya, A.; Jie, W. Remote sensing big data computing: Challenges and opportunities. Futur. Gener. Comput. Syst. 2015, 51, 47–60. [Google Scholar] [CrossRef] [Green Version]
- Zhong, Y.; Ma, A.; Ong, Y.S.; Zhu, Z.; Zhang, L. Computational intelligence in optical remote sensing image processing. Appl. Soft Comput. 2018, 64, 75–93. [Google Scholar] [CrossRef]
- Meng, Y.; Peng, S. Object-Oriented Building Extraction from High-Resolution Imagery Based on Fuzzy SVM. In Proceedings of the 2009 International Conference on Information Engineering and Computer Science, Wuhan, China, 19–20 December 2009. [Google Scholar]
- Dahiya, S.; Garg, P.K.; Jat, M.K. Object Oriented Approach for Building Extraction from High Resolution Satellite Images. In Proceedings of the 2013 3rd IEEE International Advance Computing Conference (IACC), Ghaziabad, India, 22–23 February 2013. [Google Scholar]
- Yu, M.; Chen, X.; Zhang, W.; Liu, Y. AGs-Unet: Building Extraction Model for High Resolution Remote Sensing Images Based on Attention Gates U Network. Sensors 2022, 22, 2932. [Google Scholar] [CrossRef]
- Liu, Y.; Zhang, W.; Chen, X.; Yu, M.; Sun, Y.; Meng, F.; Fan, X. Landslide Detection of High-Resolution Satellite Images Using Asymmetric Dual-Channel Network. In Proceedings of the 2021 IEEE International Geoscience and Remote Sensing Symposium IGARSS, Brussels, Belgium, 11–16 July 2021; pp. 4091–4094. [Google Scholar] [CrossRef]
- Liu, Y.; Zhou, J.; Qi, W.; Li, X.; Gross, L.; Shao, Q.; Zhao, Z.; Ni, L.; Fan, X.; Li, Z. ARC-Net: An Efficient Network for Building Extraction From High-Resolution Aerial Images. IEEE Access 2020, 8, 154997–155010. [Google Scholar] [CrossRef]
- Boonpook, W.; Tan, Y.; Xu, B. Deep learning-based multi-feature semantic segmentation in building extraction from images of UAV photogrammetry. Int. J. Remote Sens. 2020, 42, 1–19. [Google Scholar] [CrossRef]
- Trevisiol, F.; Lambertini, A.; Franci, F.; Mandanici, E. An Object-Oriented Approach to the Classification of Roofing Materials Using Very High-Resolution Satellite Stereo-Pairs. Remote Sens. 2022, 14, 849. [Google Scholar] [CrossRef]
- Yuan, J. Learning Building Extraction in Aerial Scenes with Convolutional Networks. IEEE Trans. Pattern Anal. Mach. Intell. 2018, 40, 2793–2798. [Google Scholar] [CrossRef] [PubMed]
- Vakalopoulou, M.; Karantzalos, K.; Komodakis, N.; Paragios, N. Building Detection in Very High Resolution Multispectral Data with Deep Learning Features. In Proceedings of the 2015 IEEE International Geoscience and Remote Sensing Symposium (IGARSS), Milan, Italy, 26–31 July 2015. [Google Scholar]
- Touzani, S.; Granderson, J. Open Data and Deep Semantic Segmentation for Automated Extraction of Building Footprints. Remote Sens. 2021, 13, 2578. [Google Scholar] [CrossRef]
- Chen, J.; Yuan, Z.; Peng, J.; Chen, L.; Huang, H.; Zhu, J.; Liu, Y.; Li, H. DASNet: Dual Attentive Fully Convolutional Siamese Networks for Change Detection in High-Resolution Satellite Images. IEEE J. Sel. Top. Appl. Earth Obs. Remote Sens. 2021, 14, 1194–1206. [Google Scholar] [CrossRef]
- Long, J.; Shelhamer, E.; Darrell, T. Fully Convolutional Networks for Semantic Segmentation. In Proceedings of the IEEE Conference on Computer Vision and Pattern Recognition (CVPR), Boston, MA, USA, 7–12 June 2015; pp. 3431–3440. [Google Scholar]
- Badrinarayanan, V.; Kendall, A.; Cipolla, R. Segnet: A deep convolutional encoder-decoder architecture for image segmentation. IEEE Trans. Pattern Anal. Mach. Intell. 2017, 39, 2481–2495. [Google Scholar] [CrossRef]
- Ronneberger, O.; Fischer, P.; Brox, T. U-Net: Convolutional Networks for Biomedical Image Segmentation. In Proceedings of the International Conference on Medical Image Computing and Computer-Assisted Intervention, Munich, Germany, 5–9 October 2015; pp. 234–241. [Google Scholar]
- Romera, E.; Alvarez, J.M.; Bergasa, L.M.; Arroyo, R. ERFNet: Efficient Residual Factorized ConvNet for Real-Time Semantic Segmentation. IEEE Trans. Intell. Transp. Syst. 2017, 19, 263–272. [Google Scholar] [CrossRef]
- Liu, Y.; Gross, L.; Li, Z.; Li, X.; Fan, X.; Qi, W. Automatic Building Extraction on High-Resolution Remote Sensing Imagery Using Deep Convolutional Encoder-Decoder With Spatial Pyramid Pooling. IEEE Access 2019, 7, 128774–128786. [Google Scholar] [CrossRef]
- Konstantinidis, D.; Argyriou, V.; Stathaki, T.; Grammalidis, N. A modular CNN-based building detector for remote sensing images. Comput. Netw. 2020, 168, 107034. [Google Scholar] [CrossRef]
- Zhang, X. Village-Level Homestead and Building Floor Area Estimates Based on UAV Imagery and U-Net Algorithm. ISPRS Int. J. Geo-Inf. 2020, 9, 403. [Google Scholar] [CrossRef]
- Liao, C.; Hu, H.; Li, H.; Ge, X.; Chen, M.; Li, C.; Zhu, Q. Joint Learning of Contour and Structure for Boundary-Preserved Building Extraction. Remote Sens. 2021, 13, 1049. [Google Scholar] [CrossRef]
- Xiao, X.; Guo, W.; Chen, R.; Hui, Y.; Wang, J.; Zhao, H. A Swin Transformer-Based Encoding Booster Integrated in U-Shaped Network for Building Extraction. Remote Sens. 2022, 14, 2611. [Google Scholar] [CrossRef]
- Li, H.; Qiu, K.; Chen, L.; Mei, X.; Hong, L.; Tao, C. SCAttNet: Semantic Segmentation Network With Spatial and Channel Attention Mechanism for High-Resolution Remote Sensing Images. IEEE Geosci. Remote Sens. Lett. 2021, 18, 905–909. [Google Scholar] [CrossRef]
- Wei, R.; Fan, B.; Wang, Y.; Zhou, A.; Zhao, Z. MBNet: Multi-Branch Network for Extraction of Rural Homesteads Based on Aerial Images. Remote Sens. 2022, 14, 2443. [Google Scholar] [CrossRef]
- Jing, W.; Lin, J.; Lu, H.; Chen, G.; Song, H. Learning holistic and discriminative features via an efficient external memory module for building extraction in remote sensing images. Build. Environ. 2022, 222, 109332. [Google Scholar] [CrossRef]
- Li, H.; Li, Y.; Zhang, G.; Liu, R.; Huang, H.; Zhu, Q.; Tao, C. Global and Local Contrastive Self-Supervised Learning for Semantic Segmentation of HR Remote Sensing Images. IEEE Trans. Geosci. Remote Sens. 2022, 60, 5618014. [Google Scholar] [CrossRef]
- Lin, J.; Jing, W.; Song, H.; Chen, G. ESFNet: Efficient Network for Building Extraction from High-Resolution Aerial Images. IEEE Access 2019, 7, 54285–54294. [Google Scholar] [CrossRef]
- Elhassan, M.A.; Huang, C.; Yang, C.; Munea, T.L. DSANet: Dilated spatial attention for real-time semantic segmentation in urban street scenes. Expert Syst. Appl. 2021, 183, 115090. [Google Scholar] [CrossRef]
- Li, G.; Yun, I.; Kim, J.; Kim, J. Dabnet: Depth-wise asymmetric bottleneck for real-time semantic segmentation. arXiv 2019, arXiv:1907.11357. [Google Scholar]
- Ma, N.; Zhang, X.; Zheng, H.-T.; Sun, J. Shufflenet v2: Practical Guidelines for Efficient Cnn Architecture Design. In Proceedings of the European Conference on Computer Vision (ECCV), Munich, Germany, 8–14 September 2018; pp. 116–131. [Google Scholar]
- Zhang, X.; Zhou, X.; Lin, M.; Sun, J. Shufflenet: An Extremely Efficient Convolutional Neural Network for Mobile Devices. In Proceedings of the IEEE Conference on Computer Vision and Pattern Recognition (CVPR), Salt Lake City, UT, USA, 18–23 June 2018; pp. 6848–6856. [Google Scholar]
- Sandler, M.; Howard, A.; Zhu, M.; Zhmoginov, A.; Chen, L.-C. Mobilenetv2: Inverted Residuals and Linear Bottlenecks. In Proceedings of the IEEE Conference on Computer Vision and Pattern Recognition (CVPR), Salt Lake City, UT, USA, 18–23 June 2018; pp. 4510–4520. [Google Scholar]
- He, K.; Zhang, X.; Ren, S.; Sun, J. Delving Deep into Rectifiers: Surpassing Human-Level Performance on Imagenet Classification. In Proceedings of the International Conference on Computer Vision, Las Condes, Chile, 11–18 December 2015; pp. 1026–1034. [Google Scholar]
- Fu, J.; Liu, J.; Tian, H.; Li, Y.; Bao, Y.; Fang, Z.; Lu, H. Dual Attention Network for Scene Segmentation. In Proceedings of the IEEE/CVF Conference on Computer Vision and Pattern Recognition (CVPR), Long Beach, CA, USA, 15–20 June 2019; pp. 3146–3154. [Google Scholar]
- Yu, M.; Zhang, W.; Chen, X.; Liu, Y.; Niu, J. An End-to-End Atrous Spatial Pyramid Pooling and Skip-Connections Generative Adversarial Segmentation Network for Building Extraction from High-Resolution Aerial Images. Appl. Sci. 2022, 12, 5151. [Google Scholar] [CrossRef]
- De Boer, P.-T.; Kroese, D.P.; Mannor, S.; Rubinstein, R.Y. A Tutorial on the Cross-Entropy Method. Ann. Oper. Res. 2005, 134, 19–67. [Google Scholar] [CrossRef]
- Zhang, Z.; Wang, Y. JointNet: A Common Neural Network for Road and Building Extraction. Remote Sens. 2019, 11, 696. [Google Scholar] [CrossRef] [Green Version]
- Krause, S.; Sanders, T.G.M.; Mund, J.-P.; Greve, K. UAV-Based Photogrammetric Tree Height Measurement for Intensive Forest Monitoring. Remote Sens. 2019, 11, 758. [Google Scholar] [CrossRef]
- Kameyama, S.; Sugiura, K. Effects of Differences in Structure from Motion Software on Image Processing of Unmanned Aerial Vehicle Photography and Estimation of Crown Area and Tree Height in Forests. Remote Sens. 2021, 13, 626. [Google Scholar] [CrossRef]
- Karantzalos, K.; Koutsourakis, P.; Kalisperakis, I.; Grammatikopoulos, L. Model-based building detection from low-cost optical sensors onboard unmanned aerial vehicles. ISPRS Int. Arch. Photogramm. Remote Sens. Spat. Inf. Sci. 2015, XL-1/W4, 293–297. [Google Scholar] [CrossRef] [Green Version]
- Gevaert, C.; Persello, C.; Nex, F.; Vosselman, G. A deep learning approach to DTM extraction from imagery using rule-based training labels. ISPRS J. Photogramm. Remote Sens. 2018, 142, 106–123. [Google Scholar] [CrossRef]
- Özcan, A.H.; Ünsalan, C.; Reinartz, P. Ground filtering and DTM generation from DSM data using probabilistic voting and segmentation. Int. J. Remote Sens. 2018, 39, 2860–2883. [Google Scholar] [CrossRef]
- Serifoglu Yilmaz, C.; Gungor, O. Comparison of the performances of ground filtering algorithms and DTM generation from a UAV-based point cloud. Geocarto Int. 2018, 33, 522–537. [Google Scholar] [CrossRef]
- Shukla, A.; Jain, K. Automatic extraction of urban land information from unmanned aerial vehicle (UAV) data. Earth Sci. Inform. 2020, 13, 1225–1236. [Google Scholar] [CrossRef]
- Chen, L.-C.; Papandreou, G.; Kokkinos, I.; Murphy, K.; Yuille, A. DeepLab: Semantic Image Segmentation with Deep Convolutional Nets, Atrous Convolution, and Fully Connected CRFs. IEEE Trans. Pattern Anal. Mach. Intell. 2018, 40, 834–848. [Google Scholar]
- Zhu, Q.; Liao, C.; Hu, H.; Mei, X.; Li, H. MAP-Net: Multiple Attending Path Neural Network for Building Footprint Extraction from Remote Sensed Imagery. IEEE Trans. Geosci. Remote. Sens. 2020, 59, 6169–6181. [Google Scholar] [CrossRef]


| Parameters | Value |
|---|---|
| Takeoff Weight | 1280 g |
| Image Size | 4608 × 3456 |
| Flight Duration | 27 min |
| Focal Length | 15 mm |
| Ground Sample Distance | 0.23 cm |
| Spectral Range | 0.38–0.76 μm |
| Working Temperature | 0–40° |
| Maximum Flight Altitude | 6000 m |
| Maximum Horizontal Flight Speed | 18 m/s |
| GPS Module | GPS/GLONASS dual mode |
| Image Coordinate System | WGS 84/UTM Zone 49N |
| UAV Flight Permission | Needed |
| Stage | Type | Filters |
|---|---|---|
| Input | ||
| Stage 1 | 3 × 3 Conv | 32 |
| Stage 2 | Down-sample | 64 |
| Stage 3 | Down-sample | 128 |
| Stage 4 | Building block | 128 |
| Models | OA | Precision | Recall | F1 | IoU |
|---|---|---|---|---|---|
| SegNet | 0.740 | 0.759 | 0.698 | 0.723 | 0.568 |
| UNet | 0.876 | 0.774 | 0.939 | 0.848 | 0.738 |
| Deeplabv3+ | 0.899 | 0.813 | 0.946 | 0.872 | 0.777 |
| AGs-Unet | 0.907 | 0.864 | 0.911 | 0.887 | 0.798 |
| MAP-Net | 0.916 | 0.877 | 0.888 | 0.891 | 0.799 |
| ARC-Net | 0.929 | 0.876 | 0.921 | 0.902 | 0.822 |
| EDSANet | 0.939 | 0.949 | 0.887 | 0.916 | 0.8481 |
| Parameter | Threshold | Class |
|---|---|---|
| Brightness | ≤60 | Vegetation |
| Height | ≤1 m | Courtyard |
| Height | 1 m ≤ nDSM ≤ 4 m | One floor |
| Height | 4 m ≤ nDSM ≤ 8 m | Two floors |
| Height | 8 m ≤ nDSM ≤ 12 m | Three floors |
| Prediction | |||||
|---|---|---|---|---|---|
| Courtyard | Courtyard | Courtyard | Courtyard | ||
| Actual | Courtyard | 1 | 0 | 0 | 0 |
| One floor | 0 | 3 | 0 | 0 | |
| Two floors | 0 | 1 | 11 | 0 | |
| Three floors | 0 | 0 | 0 | 1 | |
| Models | OA | Precision | Recall | F1 | IoU |
|---|---|---|---|---|---|
| Backbone | 0.911 | 0.862 | 0.907 | 0.883 | 0.783 |
| Backbone + SEM (atrous convolution) | 0.905 | 0.855 | 0.889 | 0.870 | 0.771 |
| Backbone + DAM | 0.906 | 0.847 | 0.899 | 0.870 | 0.773 |
| Backbone + AFRM | 0.914 | 0.878 | 0.882 | 0.879 | 0.787 |
| Backbone + SEM (atrous convolution) + DAM + AFRM | 0.939 | 0.949 | 0.887 | 0.916 | 0.8481 |
Publisher’s Note: MDPI stays neutral with regard to jurisdictional claims in published maps and institutional affiliations. |
© 2022 by the authors. Licensee MDPI, Basel, Switzerland. This article is an open access article distributed under the terms and conditions of the Creative Commons Attribution (CC BY) license (https://creativecommons.org/licenses/by/4.0/).
Share and Cite
Zhou, J.; Liu, Y.; Nie, G.; Cheng, H.; Yang, X.; Chen, X.; Gross, L. Building Extraction and Floor Area Estimation at the Village Level in Rural China Via a Comprehensive Method Integrating UAV Photogrammetry and the Novel EDSANet. Remote Sens. 2022, 14, 5175. https://doi.org/10.3390/rs14205175
Zhou J, Liu Y, Nie G, Cheng H, Yang X, Chen X, Gross L. Building Extraction and Floor Area Estimation at the Village Level in Rural China Via a Comprehensive Method Integrating UAV Photogrammetry and the Novel EDSANet. Remote Sensing. 2022; 14(20):5175. https://doi.org/10.3390/rs14205175
Chicago/Turabian StyleZhou, Jie, Yaohui Liu, Gaozhong Nie, Hao Cheng, Xinyue Yang, Xiaoxian Chen, and Lutz Gross. 2022. "Building Extraction and Floor Area Estimation at the Village Level in Rural China Via a Comprehensive Method Integrating UAV Photogrammetry and the Novel EDSANet" Remote Sensing 14, no. 20: 5175. https://doi.org/10.3390/rs14205175