Article

Estimation of Potato Above-Ground Biomass Based on Vegetation Indices and Green-Edge Parameters Obtained from UAVs

1
Key Laboratory of Quantitative Remote Sensing in Agriculture of Ministry of Agriculture and Rural Affairs, Information Technology Research Center, Beijing Academy of Agriculture and Forestry Sciences, Beijing 100097, China
2
Key Lab of Smart Agriculture System, Ministry of Education, China Agricultural University, Beijing 100083, China
3
Key Laboratory of Agricultural Information Acquisition Technology, Ministry of Agriculture and Rural Affairs, China Agricultural University, Beijing 100083, China
4
College of Agriculture, Nanjing Agricultural University, Nanjing 210095, China
5
College of Information and Management Science, Henan Agricultural University, Zhengzhou 450002, China
6
Institute of Crop Sciences, Chinese Academy of Agricultural Sciences/Key Laboratory of Crop Physiology and Ecology, Ministry of Agriculture, Beijing 100081, China
*
Author to whom correspondence should be addressed.
These authors contributed equally to this work.
Remote Sens. 2022, 14(21), 5323; https://doi.org/10.3390/rs14215323
Submission received: 25 September 2022 / Revised: 19 October 2022 / Accepted: 22 October 2022 / Published: 24 October 2022
(This article belongs to the Special Issue Recent Progress in UAV-AI Remote Sensing)

Abstract

:
Aboveground biomass (AGB) is an important indicator to evaluate crop growth, which is closely related to yield and plays an important role in guiding fine agricultural management. Compared with traditional AGB measurements, unmanned aerial vehicle (UAV) hyperspectral remote sensing technology has the advantages of being non-destructive, highly mobile, and highly efficient in precision agriculture. Therefore, this study uses a hyperspectral sensor carried by a UAV to obtain hyperspectral images of potatoes in stages of tuber formation, tuber growth, starch storage, and maturity. Linear regression, partial least squares regression (PLSR), and random forest (RF) based on vegetation indices (Vis), green-edge parameters (GEPs), and combinations thereof are used to evaluate the accuracy of potato AGB estimates in the four growth stages. The results show that (i) the selected VIs and optimal GEPs correlate significantly with AGB. Overall, VIs correlate more strongly with AGB than do GEPs. (ii) AGB estimates made by linear regression based on the optimal VIs, optimal GEPs, and combinations thereof gradually improve in going from the tuber-formation to the tuber-growth stage and then gradually worsen in going from the starch-storage to the maturity stage. Combining the optimal GEPs with the optimal VIs produces the best estimates, followed by using the optimal VIs alone, and using the optimal GEPs produces the worst estimates. (iii) Compared with the single-parameter model, which uses the PLSR and RF methods based on VIs, the combination of VIs with the optimal GEPs significantly improves the estimation accuracy, which gradually improves in going from the tuber-formation to the tuber-growth stage, and then gradually deteriorates in going from the starch-storage to the maturity stage. The combination of VIs with the optimal GEPs produces the most accurate estimates. (iv) The PLSR method is better than the RF method for estimating AGB in each growth period. Therefore, combining the optimal GEPs and VIs and using the PLSR method improves the accuracy of AGB estimates, thereby allowing for non-destructive dynamic monitoring of potato growth.

1. Introduction

As the basis of organic matter accumulation, aboveground biomass (AGB) is often used to evaluate crop growth and farmland productivity [1,2]. As a result, knowing the spatial-temporal dynamic variations in AGB is critical for field decision-making and yield prediction [3]. Fast and accurate access to AGB information not only helps to tap into production potential and boost crop yield [4,5] but also helps to formulate macro agricultural trade policies and implement digital agriculture [6]. AGB measurement is traditionally done mostly by manual destructive sampling, which requires significant time and effort, is only applicable to small areas, and is difficult to scale up [7,8].
Because of its high throughput, rapidity, and wide sensing range, remote-sensing technology offers a new technical method for nondestructive dynamic monitoring of crop growth over large areas. It can establish a relationship between the acquired crop canopy spectral information and growth parameters, which allows for the analysis of periodic quantitative variations in crop parameters, which has become a hot spot in agricultural quantitative remote-sensing research [9,10]. In recent years, remote-sensing platforms based on the ultralow-altitude unmanned aerial vehicles (UAVs) carrying various microsensors have been widely implemented in precision agricultural management because of their high mobility, low cost, high operational efficiency, and capacity to acquire crop canopy images with higher temporal and spatial resolution beneath cloud cover [11,12,13]. Currently, hyperspectral imaging spectrometers carried by UAVs can capture copious detailed spectral information of crop canopies due to their vast number of wavebands, allowing them to better monitor crop-growth metrics [14,15].
The crop growth model, the semi-mechanical model, and the empirical statistical model are the three main models for estimating AGB [16,17,18]. Crop-growth models, such as WOFOST [19], CROPSYST [20], and CERES [21], are extremely mechanistic. However, these models require as input a large number of parameters that affect crop growth, such as soil moisture, meteorological data, physiological and biochemical parameters, and other indicators, which are often difficult to obtain, limiting the wide application of the model in crop AGB monitoring [22,23]. The semi-mechanical model (also known as the parametric model) involves the light-energy utilization model [24]. Variations in AGB are obtained by simulating crop growth based on photosynthesis in the canopy leaves, but this model is affected by geographical restrictions and some parameters are difficult to simulate quantitatively [25]. The empirical statistical model directly establishes the regression relationship between remote sensing factors and crop parameters. Because of its simple form, easy operation, and high efficiency, it is widely applicable in crop growth monitoring. For example, Yuri et al. [26] and Mansaray et al. [27] used vegetation indices (VIs) to estimate the AGB of sugarcane and rice.
VIs are usually combined mathematically with two or more spectral bands to reduce or eliminate the impact of background noise on crop canopy spectral information, thereby enhancing estimates of vegetation structure [28,29]. For example, Zhang et al. [30], Devia et al. [31], and Han et al. [32] estimated the AGB of winter wheat, maize, and rice at different growth stages using five, six, and seven vegetation indices, respectively. Although these studies use UAV remote-sensing technology to obtain accurate AGB estimates, there are some shortcomings. The model easily saturates when only the original spectral information of the crop canopy is used to build the VIs to estimate AGB in multiple growth periods of crops [33,34]. To solve this problem, researchers use three main methods to improve the accuracy of AGB estimates: (i) Various regression techniques are used, such as multiple linear regression [35], partial least squares regression (PLSR) [36], random forests (RF) [28], support vector machines [37], and artificial neural networks [38]. (ii) Spectral transformation techniques are used, such as spectral differentiation [39], wavelet analysis [40], band-depth analysis [41], and Fourier transforms [42]. (iii) Finally, to improve AGB estimates, new model factors are introduced such as crop height [43,44], texture features [45,46,47], crop coverage [48,49], and red-edge parameters [15].
Previous research has thus used UAV remote-sensing technology to estimate the growth parameters of wheat, rice, corn, soybean, and other crops in different phases. However, the structure and dry-matter accumulation process of potatoes differs significantly from that of other common crops, so additional research is required to accurately estimate potato AGB. Multiband crop canopy spectral information can be obtained through hyperspectral sensors with many narrow bands carried by UAVs, and the sensitivity of reflectance information and growth parameters varies across the different spectral bands. Therefore, AGB can be estimated by extracting characteristic spectral parameters. Due to the influence of the characteristics and the internal structure of crop leaves, the spectral reflectance of the crop canopy slowly increases and peaks within the 502–554 nm green-edge region, which differs significantly from the background features. Therefore, the sensitivity of characteristic spectral parameters in this area should be thoroughly examined to improve the accuracy of growth-parameter estimates.
No research has yet been conducted to extract the green-edge parameters (GEPs) from potato canopy hyperspectral images, nor to combine them with traditional VIs and apply regression techniques to evaluate the accuracy of AGB estimates for multiple growth periods, as is required for monitoring potato growth. The main purpose of this study is thus to evaluate the applicability of VIs, GEPs, and combinations thereof to estimate potato AGB over multiple growth stages. Specifically, we evaluate the use of PLSR and RF techniques to estimate AGB based on VIs, GEPs, and combinations thereof and determine the best model for AGB estimation in each growth period.

2. Experiment and Methods

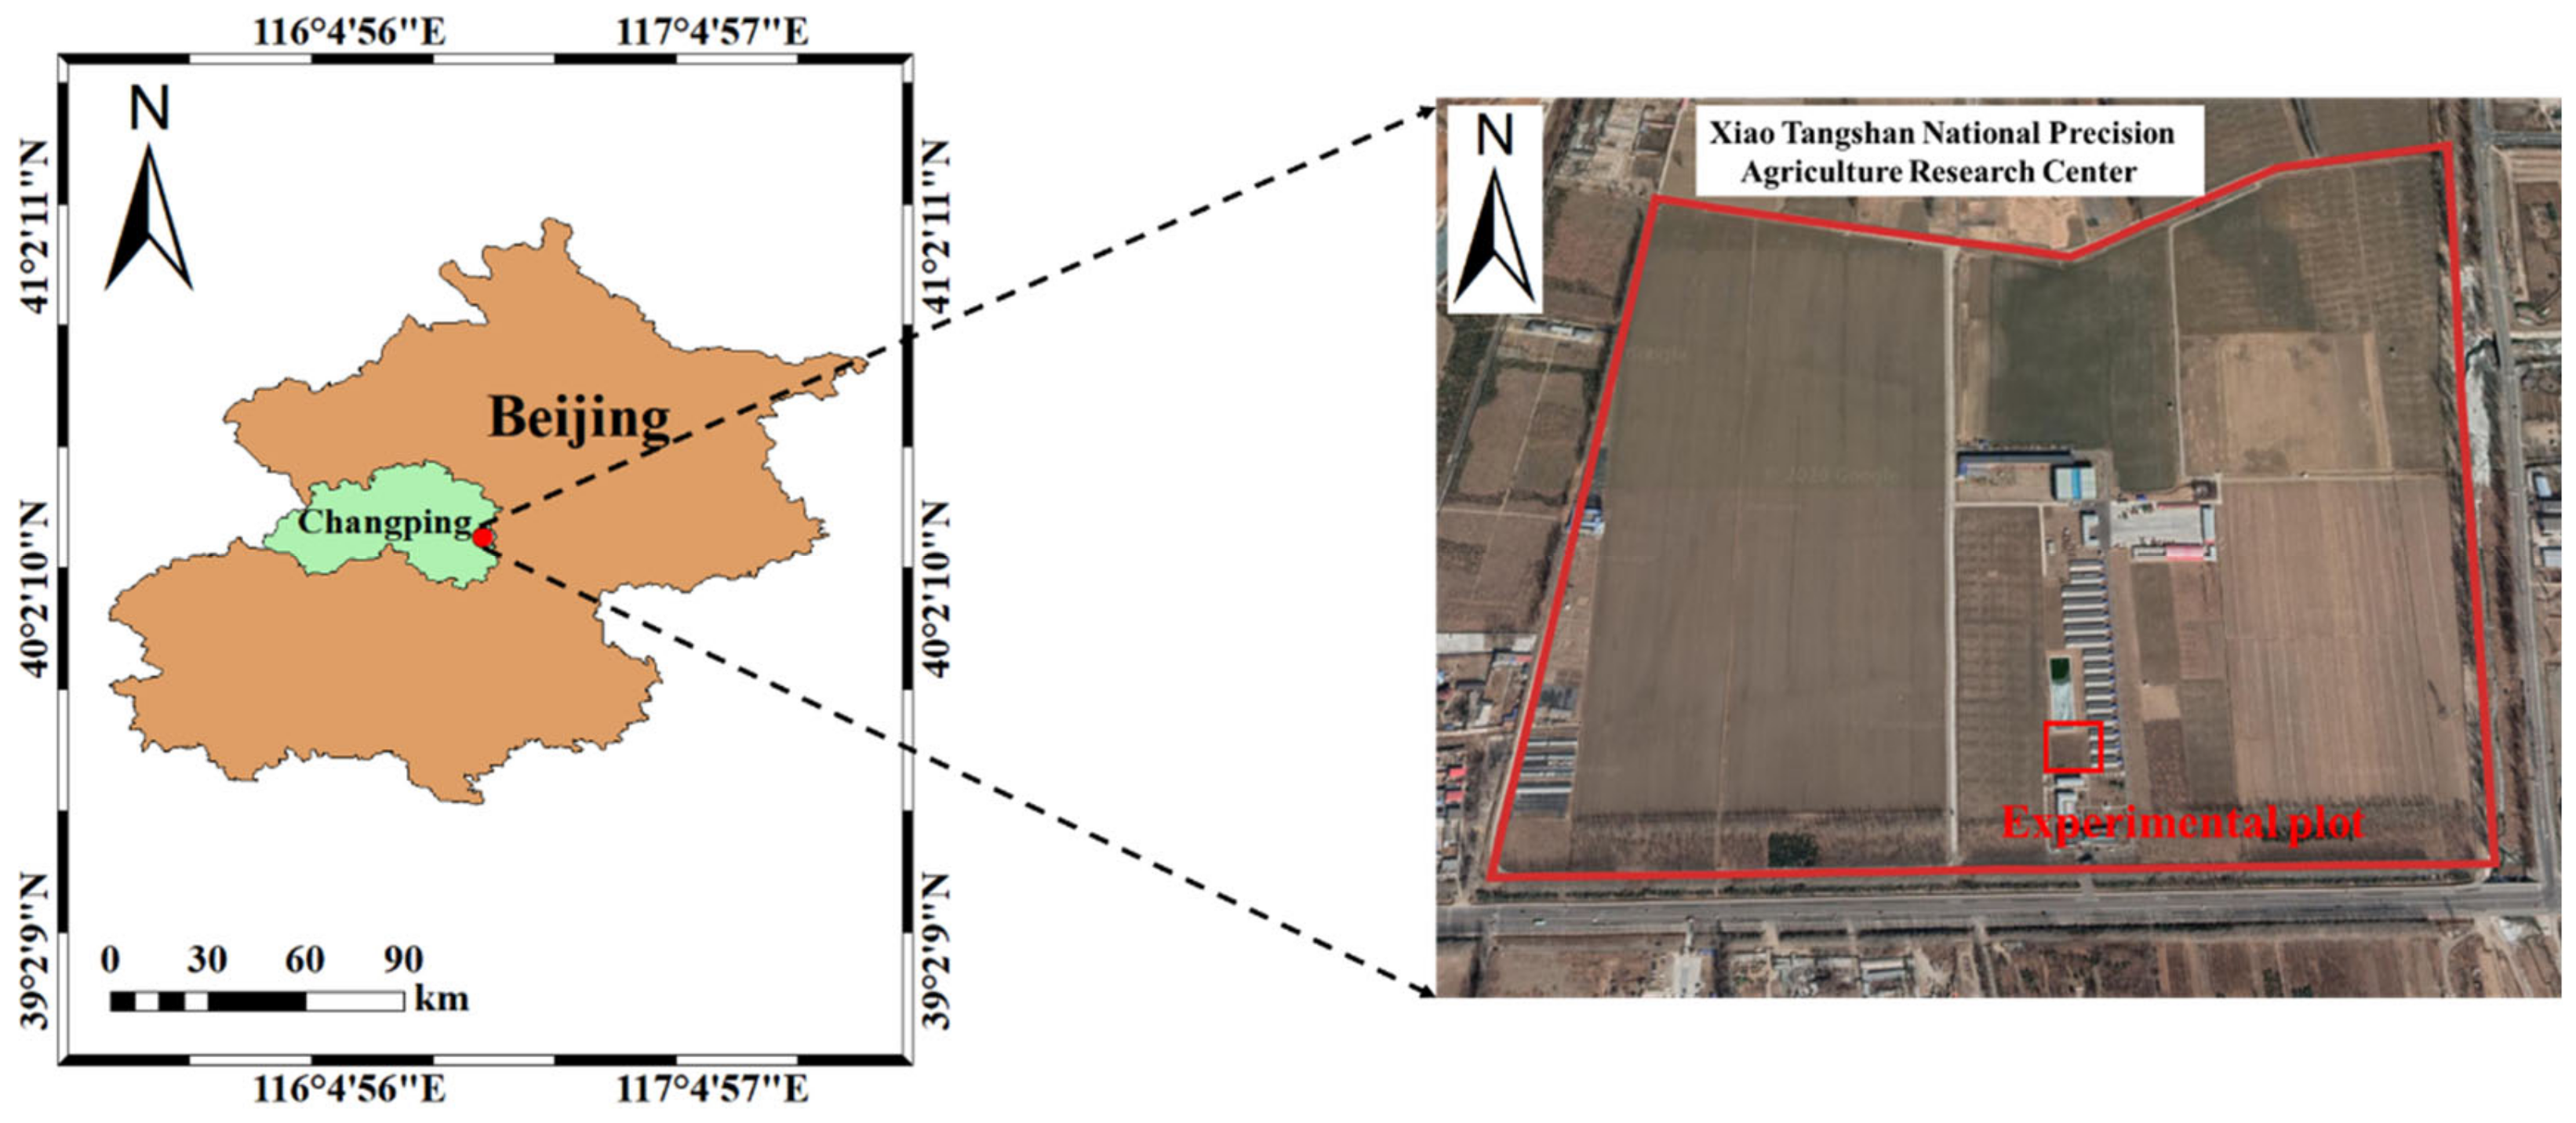
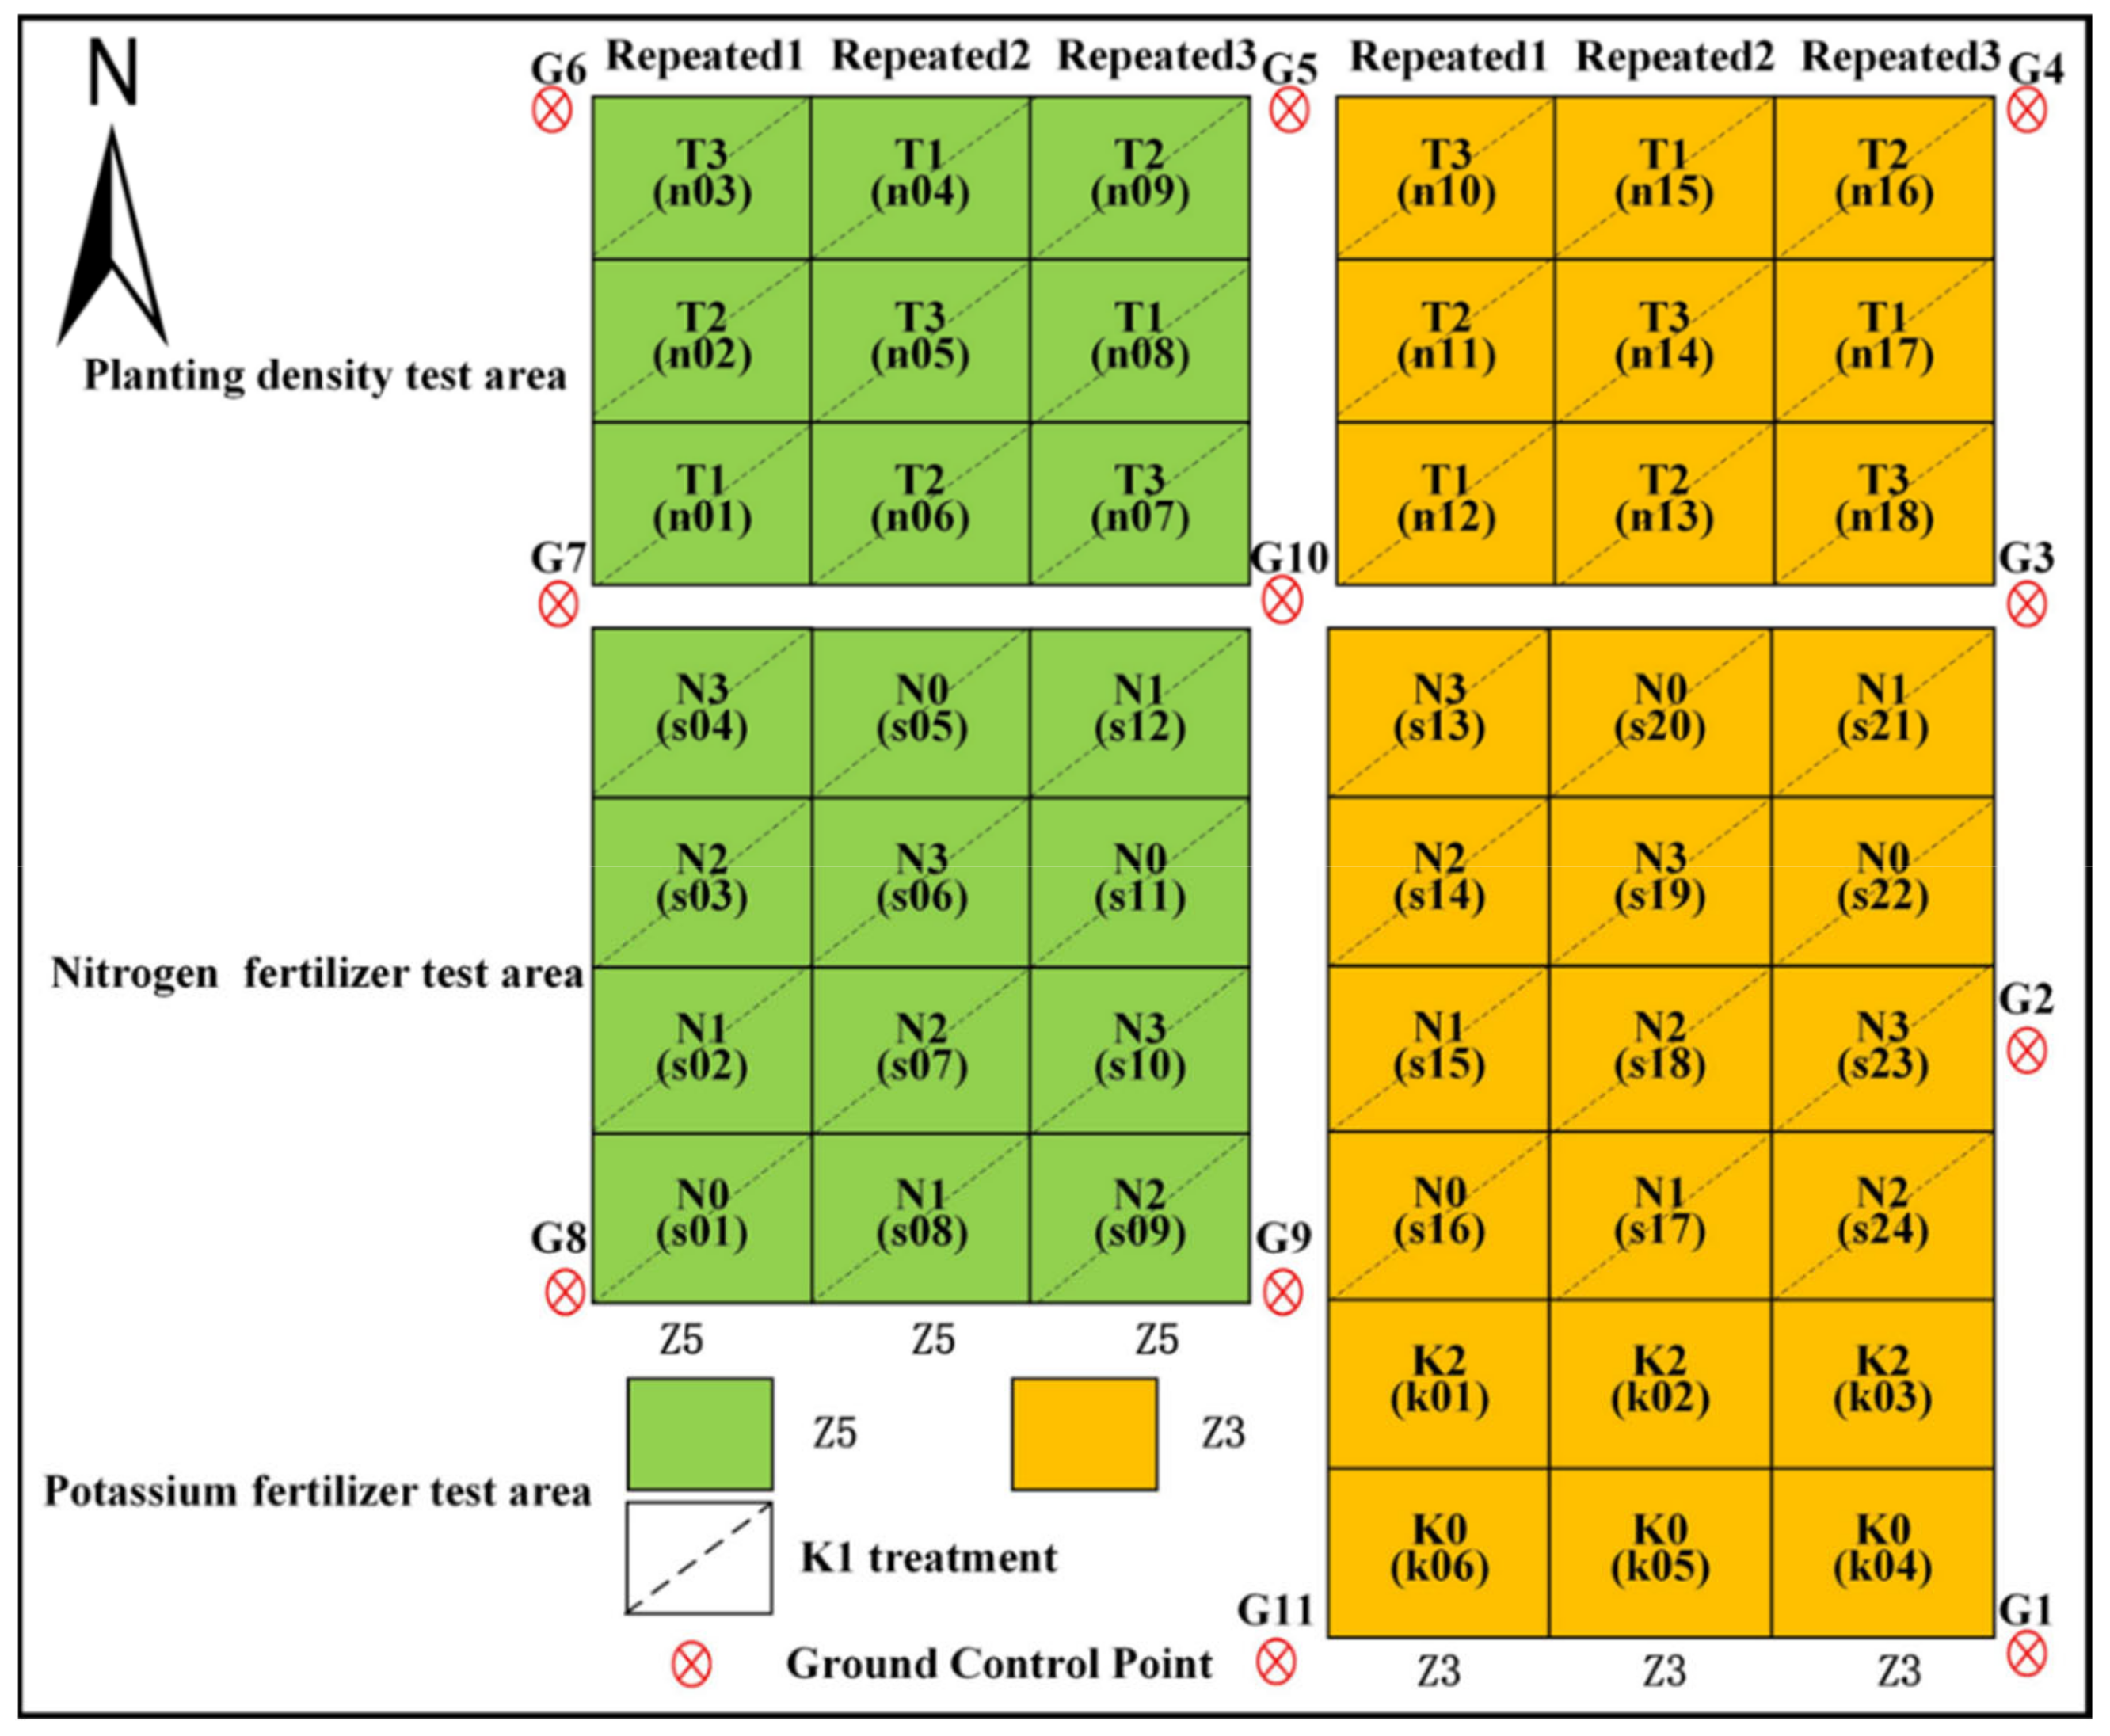
2.1. Overview of Study Area and Experimental Design

From March to July 2019, experimentation was carried out in the experimental potato field of the National Precision Agriculture Research Demonstration Base in Xiaotangshan Town, Changping District, Beijing, China. This area is located in the east of Xiaotangshan Town (40°10′34″N, 116°26′39″E), with an average altitude of about 36 m, an average annual precipitation of about 600 mm, an average annual temperature of about 11 ℃, and an average annual frost-free period of 200 days. The climate of the study area is warm temperate semi-humid continental monsoon. The location of the test area is shown in Figure 1.
Two early maturing potato varieties, Zhongshu 5 (Z5) and Zhongshu 3 (Z3), were planted in the experimental field at different planting densities and with different treatments of nitrogen and potassium fertilizers. The planting density test area had 18 plots, which were planted at three densities: 60,000 plants/hm2 (T1), 72,000 plants/hm2 (T2), and 84,000 plants/hm2 (T3). There were 24 plots in the nitrogen test area, which underwent four fertilization treatments: 0 kg/hm2 urea (N0), 244.65 kg/hm2 urea (N1), 489.15 kg/hm2 urea (N2, normal treatment, 15 kg pure nitrogen), and 733.5 kg/hm2 urea (N3). There were six plots in the potassium fertilizer test area, which underwent two potassium fertilization treatments: 0 kg/hm2 potassium fertilizer (K0) and 1941 kg/hm2 potassium fertilizer (K2). A treatment of 970.5 kg/hm2 potassium fertilizer (K1) was applied to the planting density and nitrogen test area. There was a total of 48 test plots, each with an area of 32.5 m2. Eleven ground control points were uniformly arranged around the test area to calibrate the hyperspectral images acquired by UAVs. The specific test scheme appears in Figure 2.

2.2. Ground Data Acquisition and Processing

AGB data were obtained during the four key stages of potato growth: tuber formation (28 May 2019), tuber growth (10 June 2019), starch storage (20 June 2019), and maturity (3 July 2019). The specific process of AGB acquisition in each growth period was to select three plant samples in each plot that represent the growth level of the entire plot. After artificial destructive sampling, they were packaged and then quickly taken to the laboratory. After separating the stems and leaves, they were washed in running water, then placed in an oven for one hour at 105 °C, then at 80 °C to dry for over 48 h until obtaining constant mass. The dry mass of stems and leaves was weighed by using a high-precision balance (accuracy of 0.001 g). The dry mass of the stems was added to that of the leaves to obtain the dry mass of the sample. Finally, the potato AGB in each plot was obtained based on the population density and the dry mass of the sample.

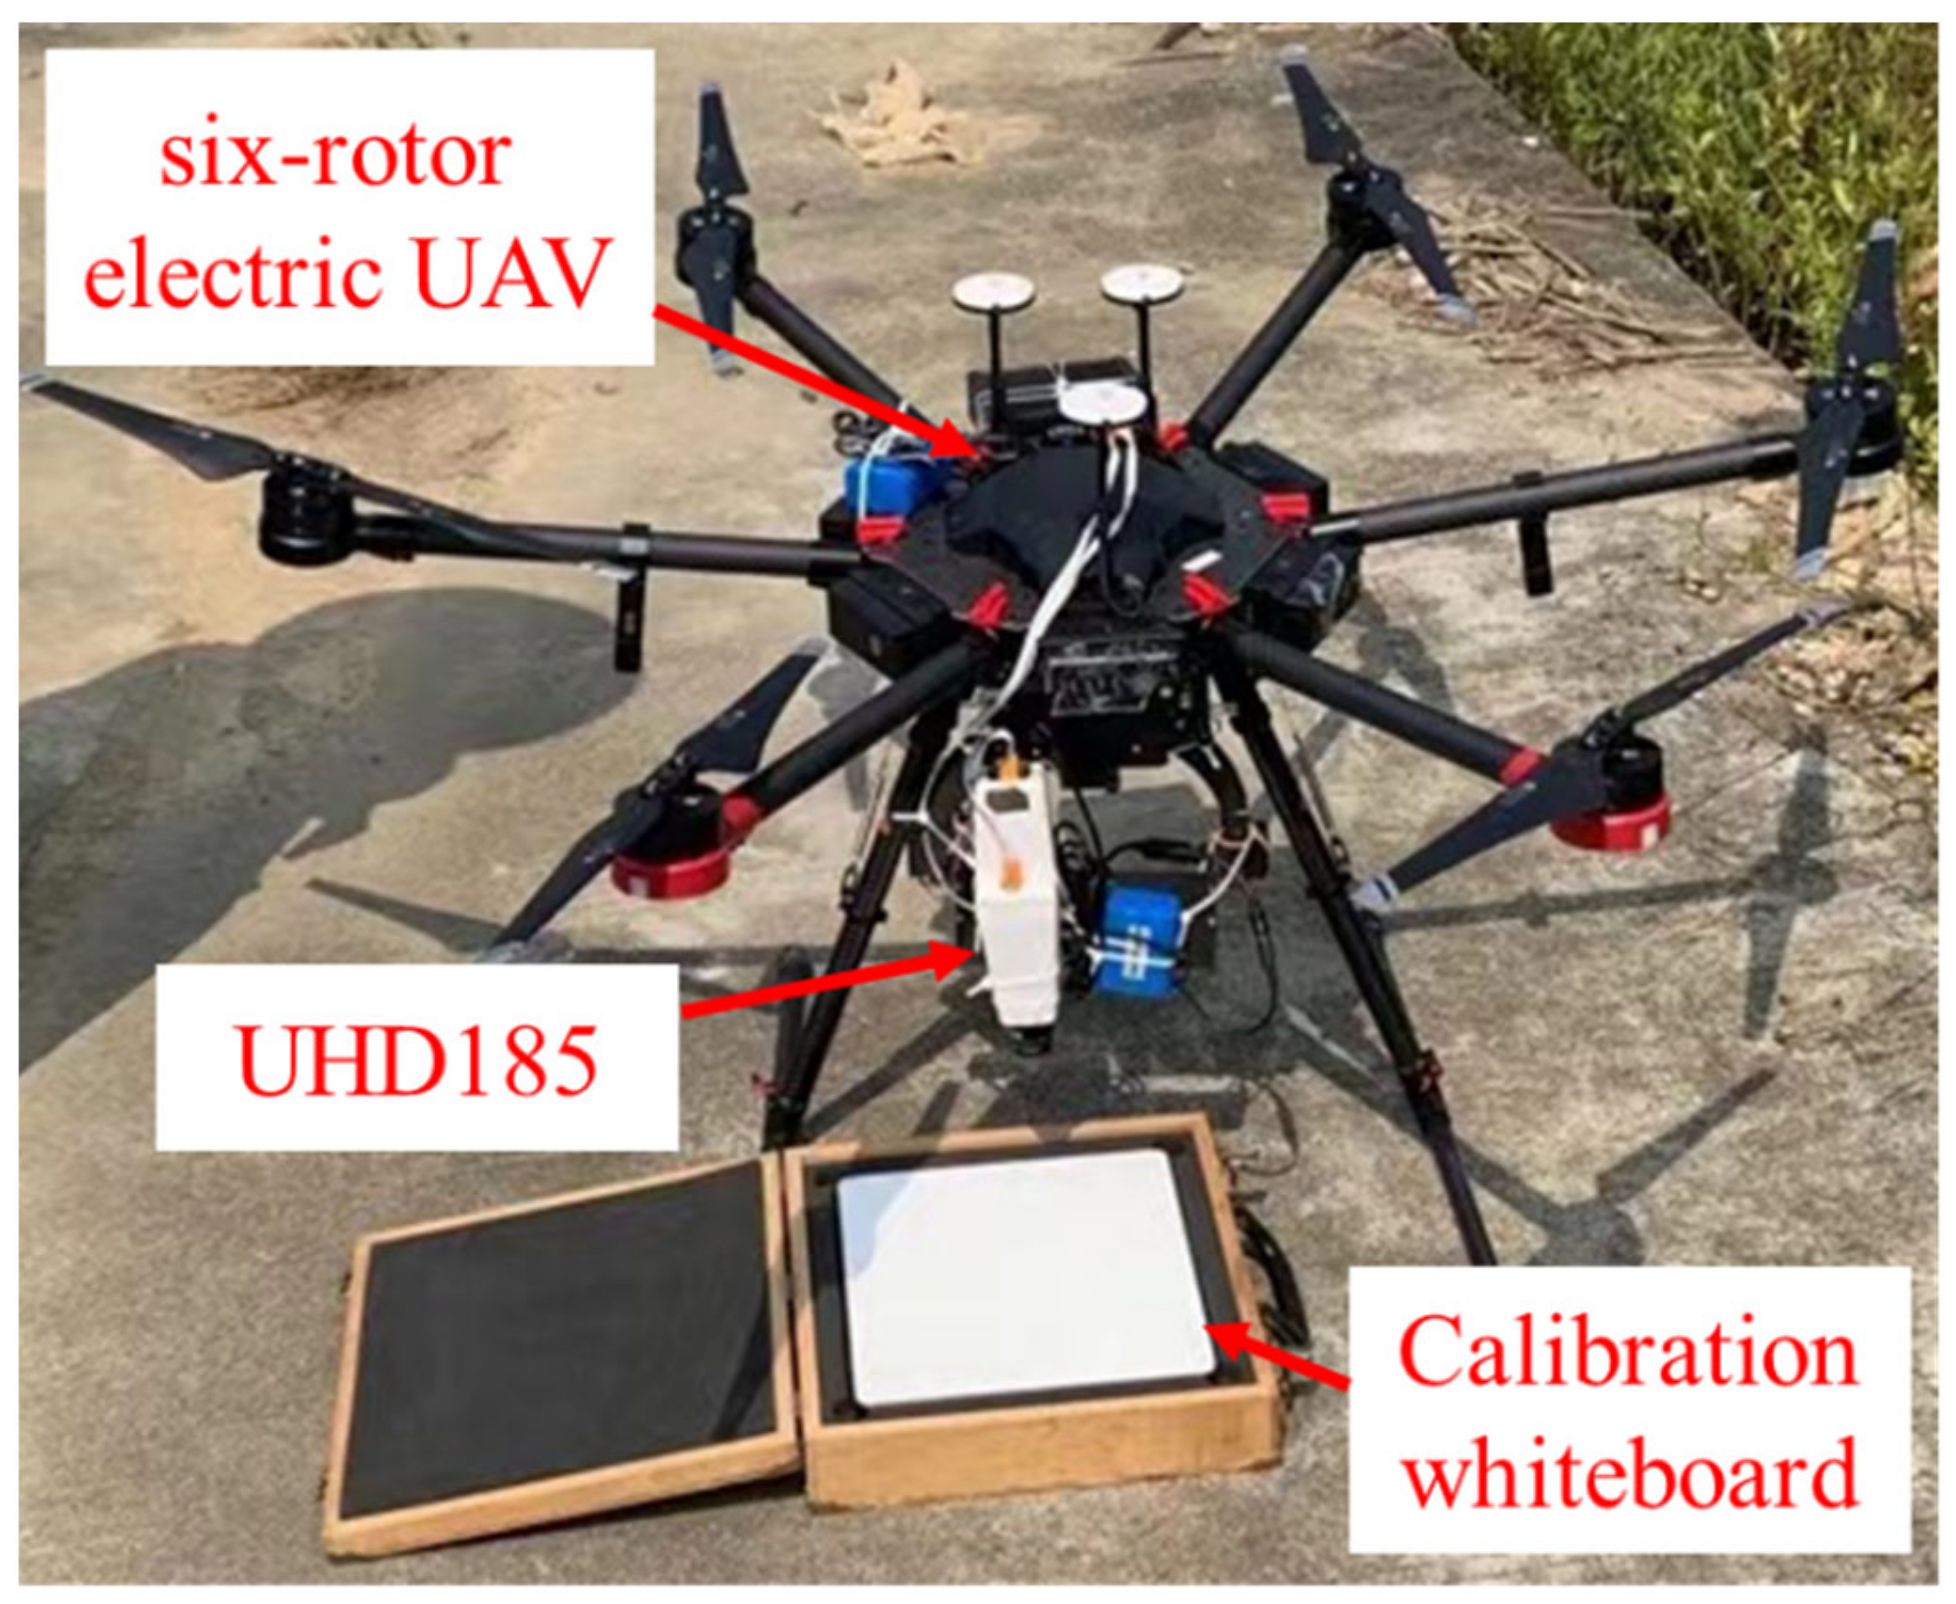
2.3. UAV Hyperspectral Data Acquisition and Processing

UAV hyperspectral remote-sensing operation and ground data acquisition were carried out simultaneously. A six-rotor electric UAV equipped with a UHD185 Firefly imaging spectrometer was used to obtain canopy hyperspectral data during the four potato growth periods (Figure 3). The UHD185 sensor is a non-scanning, full frame, real-time-imaging airborne spectrometer that measures 195 mm × 67 mm × 60 mm, weighs 470 g, and detects over a spectral range of 450–950 nm with 125 spectral channels, 4 nm per spectral sampling interval, 8 nm spectral resolution, and 12-bit digital resolution. All UAV flights were conducted under windless and cloudless conditions from 11:30 to 12:30 because the sun shines directly on the ground at this time and the light intensity is stable. The UAV flew at 20 m (the transect width was 6 m) and had a speed of about 1.5 m/s. To obtain high-quality hyperspectral images, the UAV’s heading and lateral overlap rates were 85% and 93%, respectively. The image capture interval was set to one second. The ground resolution of the resulting images was about 1.3 cm. Before each UAV took off, a black and white panel was used to radiometrically correct the canopy spectral reflectance.
UAV hyperspectral image data processing mainly includes four parts: geometric correction, image stitching, image fusion, and spectral extraction. Before stitching, we radiometrically calibrated the image digital values to surface reflectance. First, the selected grayscale images and 11 ground control points in the flight zone were imported into the PhotoScan software, and the three-dimensional coordinate information of the ground control points was used to correct the images for the terrain. The correction error in each period was less than 2 cm. Second, the grayscale images were stitched through the dense point cloud generated by the motion structure algorithm. Hyperspectral cube and grayscale images were then fused by using Cubert-Pilot software to obtain complete hyperspectral images. Finally, vector data for each plot were plotted based on the maximum boundaries by using ArcGIS 10.2 software, and ENVI 5.3 software was used to extract the average hyperspectral reflectance from the region of interest (Figure 4). To evaluate the performance of different spectra to estimate AGB, we analyzed the correlation between potato canopy spectra and AGB (Figure 5). Finally, we found that the spectral regions sensitive to AGB were mainly located in the red edge and near-infrared range, which provided a basis for a reasonable selection of VIs.

2.4. Selection of Vegetation Indices

According to previous research results, fifteen VIs were selected for this study. The specific names and mathematical expressions are shown in Table 1.

2.5. Selection of Green-Edge Parameters

This work uses the maximum reflectivity of the green edge (Rmax), the sum of the reflectance of the green edge (Rsum), the area of the green edge (SDr), the amplitude of the green edge (Dr), the minimum amplitude (Drmin), and the ratio Dr/Drmin. Rmax and Rsum are the maximum reflectance and total reflectance of the original spectrum of the green edge area, respectively. SDr is the sum of the first-order differential spectral reflectance of the green edge area, and Dr is the maximum of the first-order differential spectrum of the green-edge region. Drmin is the minimum of the first-order differential spectrum of the green-edge region.

2.6. Analysis Methods

PLSR is a combination of multiple linear regression and principal component analysis. It can provide a many-to-many regression model on the basis of fully considering the multicollinearity between independent variables. Especially when the number of independent variables is large, and there is a certain degree of autocorrelation with a small number of dependent variables, the model built by PLSR is more accurate than the traditional regression analysis, which allows us to make estimates based on a small number of factors. RF was first proposed by Breiman as a machine-learning algorithm [15]. Through bootstrap sampling, some of the original samples are recycled for multiple sampling to form a training set, then multiple decision trees are combined to predict the dependent variables, and the prediction results are determined by voting. In this study, PLSR and RF were implemented by using MATLAB2018a software.
To estimate the potato AGB for each growth stage, this study used repeat 2 and repeat 3 data (32 groups) as the calibration set, and repeat 1 data (16 groups) as the validation set. The coefficient of determination (R2), root mean square error (RMSE), and normalized root mean square error (NRMSE) were used to evaluate the accuracy of the model.

3. Results and Analysis

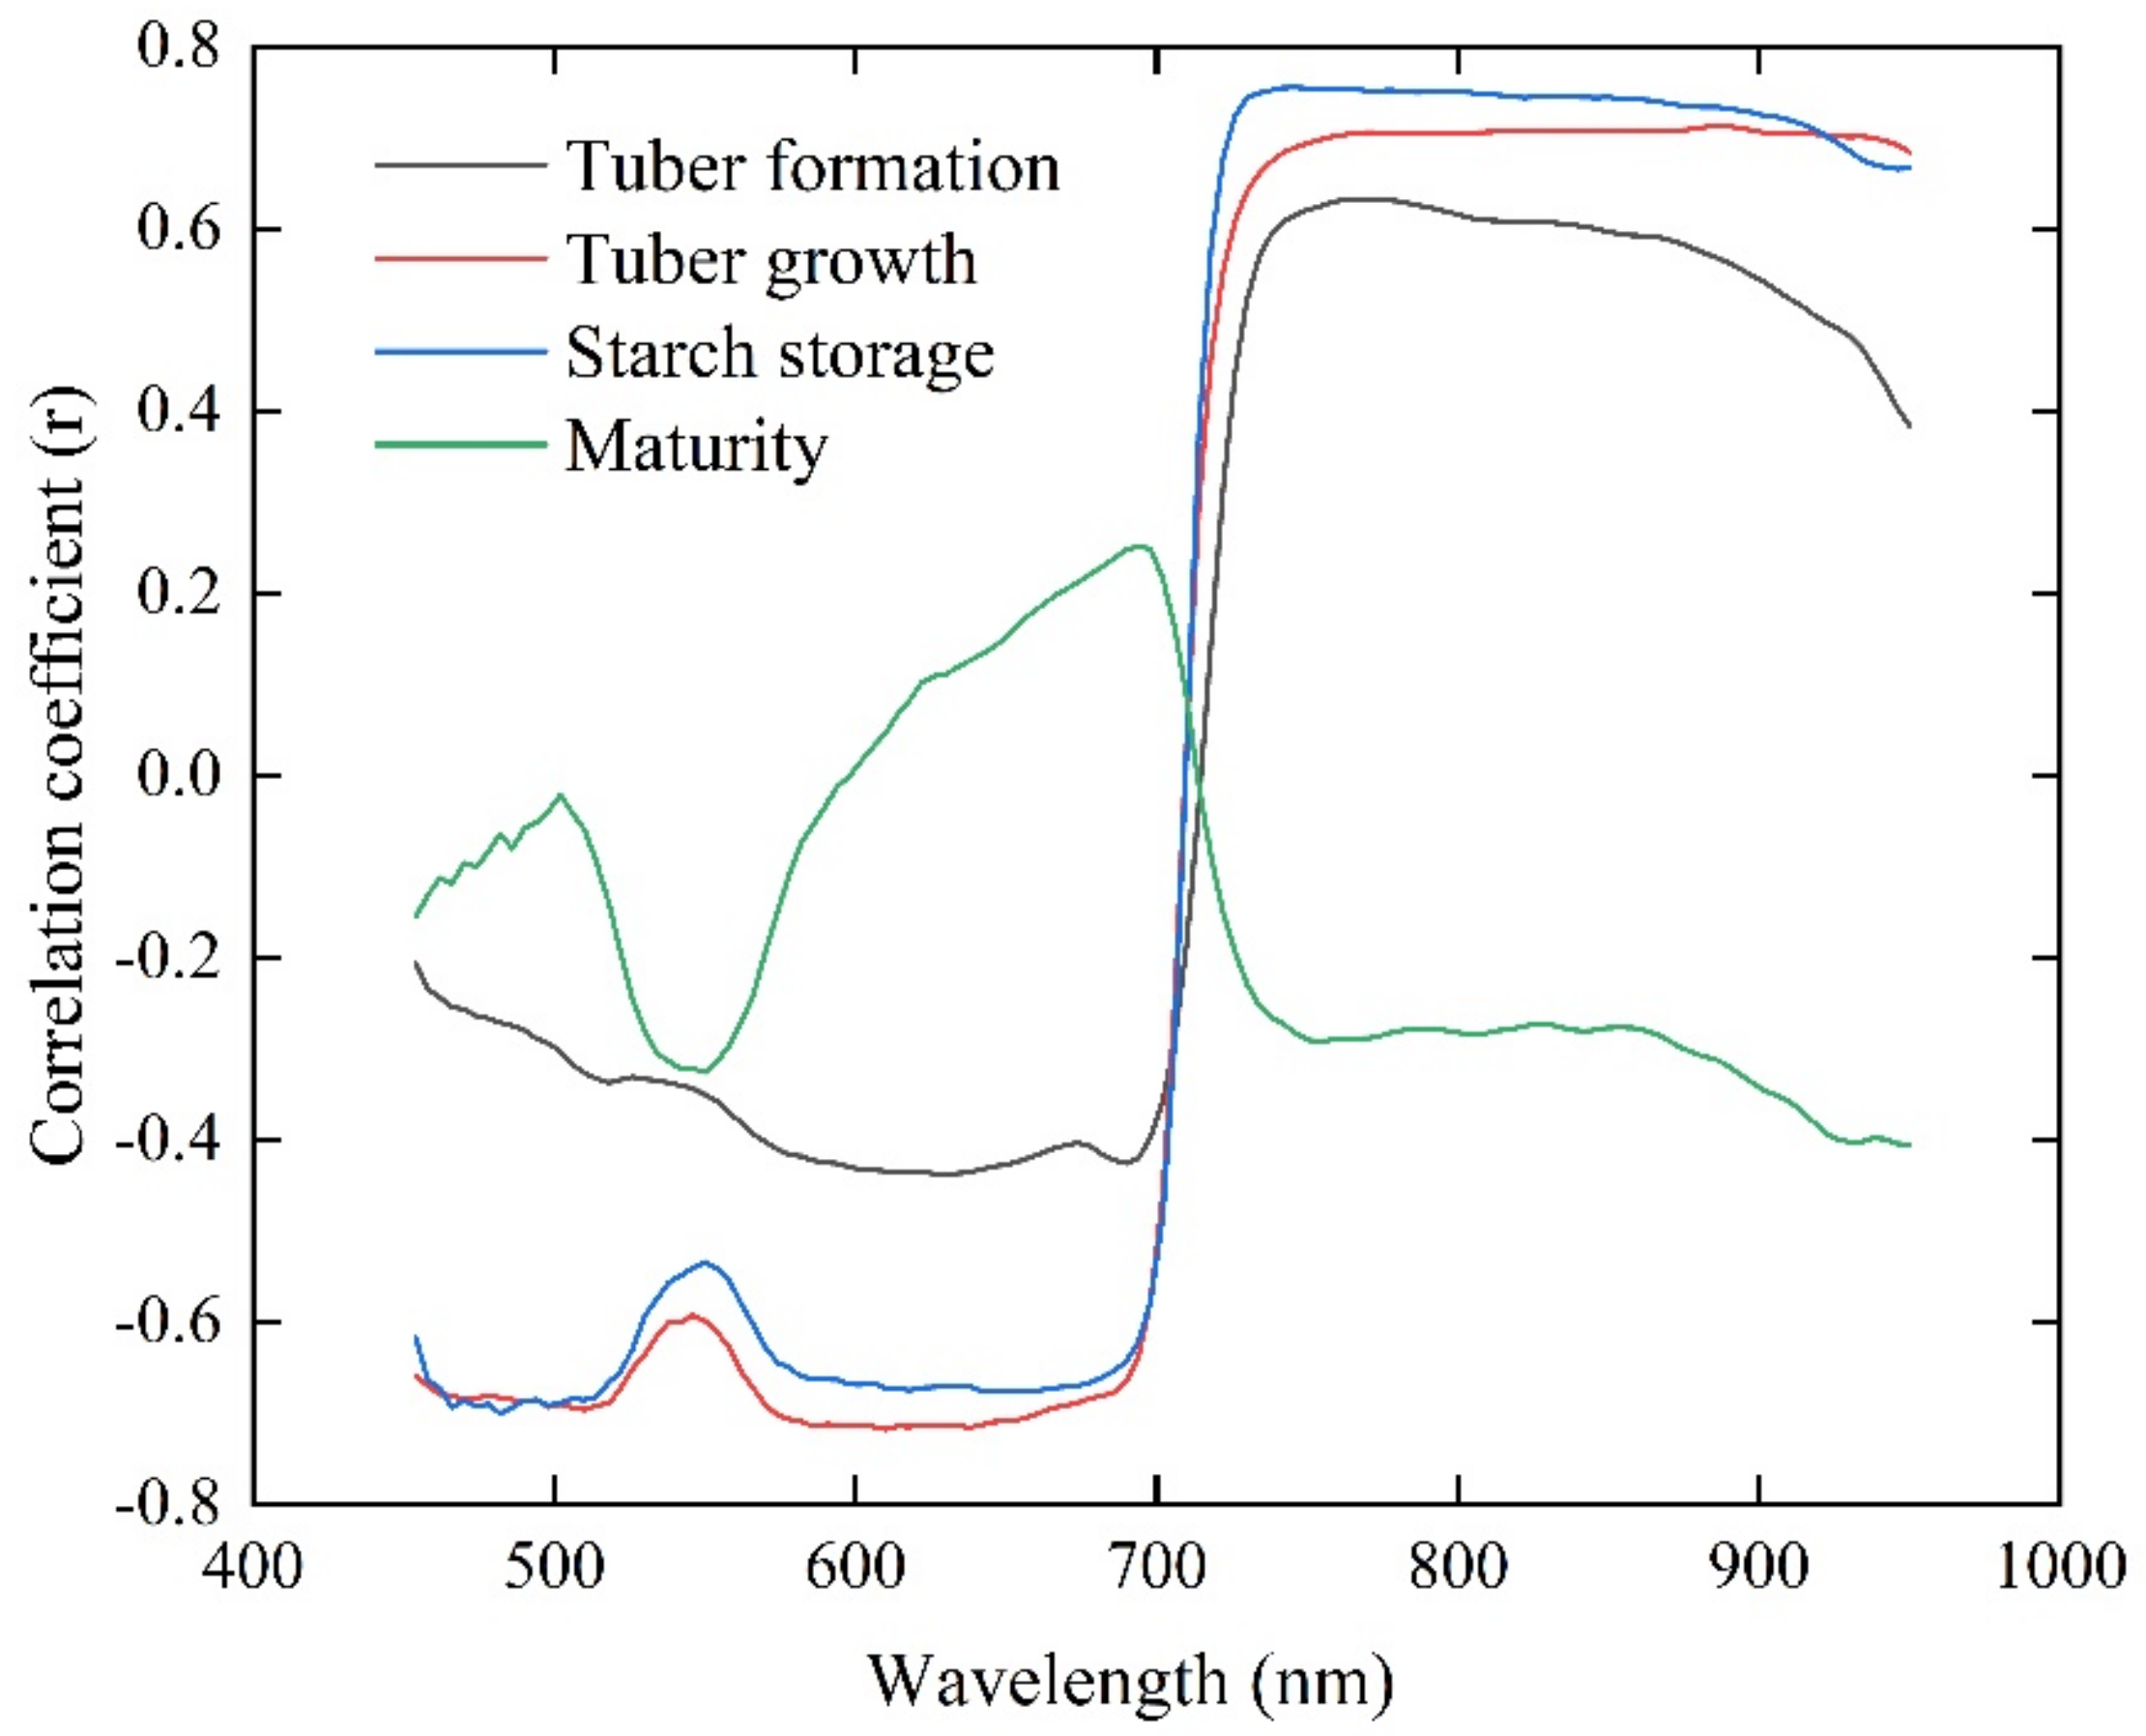
3.1. Correlation between VIs, GEPs, and AGB

Table 2 shows the correlation coefficients between (i) fifteen VIs and six GEPs and (ii) the AGB for each potato growth period. According to Table 2, most of the correlations between twenty-one spectral parameters and AGB reach a significance level of 0.01. The correlation coefficient between spectral parameters and AGB in each growth stage fluctuates, and the difference is obvious. The correlation increases in going from the tuber-formation stage to the tuber-growth stage and decreases in going from the starch-storage stage to the mature stage. Overall, the VIs are more strongly correlated with AGB than are the GEPs.
During tuber formation, the most highly correlated VIs and GEPs are PSRI and Drmin, respectively. In the tuber-growth stage, VIs and GEPs are more strongly correlated with AGB than in the other three growth stages, and the most strongly correlated VIs and GEPs are PBI and Rsum, respectively. During the starch-storage period, all spectral parameters and the AGB reach a significance level of 0.01, but the correlation weakens. The VIs and GEPs most strongly correlated with AGB are LCI and Rsum, respectively. During the mature stage, the correlation between spectral parameters and AGB is the weakest. Only six VIs (PSRI, TVI, TCARI, DVI, OSAVI, and LCI) and two GEPs (SDr and Dr) reach a significance level of 0.01 with AGB, with the best VIs and GEPs being PSRI and SDr, respectively.

3.2. Relationship of Optimal VIs and GEPs with AGB

3.2.1. Relationship between Optimal GEPs and AGB

Based on the optimal GEPs selected in each growth period (Table 2), the AGB estimation models for the four growth periods were established by using linear regression, and the R2, RMSE, and NRMSE of the models in each growth period were obtained through modeling and validation (Table 3). From the tuber-formation stage to the tuber-growth stage, the modeling set R2 increases from 0.31 to 0.37, the RMSE decreases from 325.37 to 332.83 kg/hm2, and the NRMSE decreases from 25.24% to 22.94%. Similarly, the validation set R2 increases continuously from 0.40 to 0.52, and the RMSE and NRMSE decreases continuously. The accuracy of the AGB estimation model gradually increases in these two growth periods. From the starch-storage stage to the mature stage, the R2 range of the modeling set ranges from 0.23 to 0.21, and the RMSE and NRMSE range from 404.96 to 428.87 kg/hm2 and 29.11% to 35.12%, respectively. The variation in the precision obtained with the validation set is consistent with that of the modeling set. R2 continues to decrease (from 0.38 to 0.27), and RMSE and NRMSE continue to increase (from 259.51 to 279.39 kg/hm2 and 28.57% to 32.39%, respectively). The precision obtained from the models for these two growth periods gradually decreases, and the estimates worsen.

3.2.2. Relationship between Optimal VIs and AGB

The model for estimating potato AGB at different growth stages was established by linear regression, and the R2, RMSE, and NRMSE of each model are shown in Table 4. AGB estimates gradually improve in going from the tuber-formation to the tuber-growth stage. R2 for the modeling set ranges from 0.43 to 0.48, and the RMSE and NRMSE range from 301.88 to 300.51 kg/hm2 and 23.42% to 20.71%, respectively. R2 for the validation set increases from 0.59 to 0.62, and the RMSE and NRMSE decrease gradually from 226.59 to 207.16 kg/hm2 and 22.24% to 19.27%, respectively. In going from the starch-storage stage to the mature stage, AGB estimates gradually deteriorate. The modeling set R2 decreases from 0.38 to 0.26, and the RMSE and NRMSE increase from 349.76 to 376.33 kg/hm2 and 25.14% to 30.82%, respectively. The validation set R2 also decreases continuously from 0.46 to 0.36, and the RMSE and NRMSE increase from 208.98 to 240.49 kg/hm2 and from 23.01% to 27.88%, respectively. Analysis of the four growth-stage model accuracy-evaluation indicators (Table 3 and Table 4) shows that the optimal-VIs estimate of potato AGB is more accurate than the optimal-GEPs estimate.

3.2.3. Relationship of Optimal VIs and Optimal GEPs with AGB

Table 5 shows the accuracy of AGB estimates made by using linear regression combined with the optimal VIs and the optimal GEPs for each growth period. The results show that the optimal VIs combined with the optimal GEPs significantly improves the accuracy of AGB estimates in each growth period (Table 3, Table 4 and Table 5). The increase during the tuber-formation stage and the tuber-growth stage is small: R2 increases by 16% and 20% at the highest, and NRMSE decreases by 35% and 31% at the highest. During the starch accumulation and maturity stages, R2 increases by 25% and 29% at the highest, and NRMSE decreases by 43% and 33% at the highest.
It can be seen from the comprehensive modeling set and verification set (Table 3, Table 4 and Table 5) that the variation in the accuracy of AGB estimates throughout the growth stage is consistent with the optimal VIs and the optimal GEPs. The estimation effect gradually improves from the tuber-formation stage to the tuber-growth stage. The modeling-set R2 increases from 0.48 to 0.54, and the NRMSE decreases from 21.68% to 19.09%. R2 for the verification set increases from 0.62 to 0.65, and the NRMSE decreases from 19.39% to 17.46%. The estimation effect thus worsens in going from the starch-storage stage to the maturity stage. R2 for the modeling set ranges from 0.40 to 0.39, and the NRMSE ranges from 23.12% to 27.13%. The accuracy of AGB estimates based on the validation set is like that of the modeling set. R2 continues to decrease, RMSE and NRMSE continue to increase, and the model accuracy worsens.

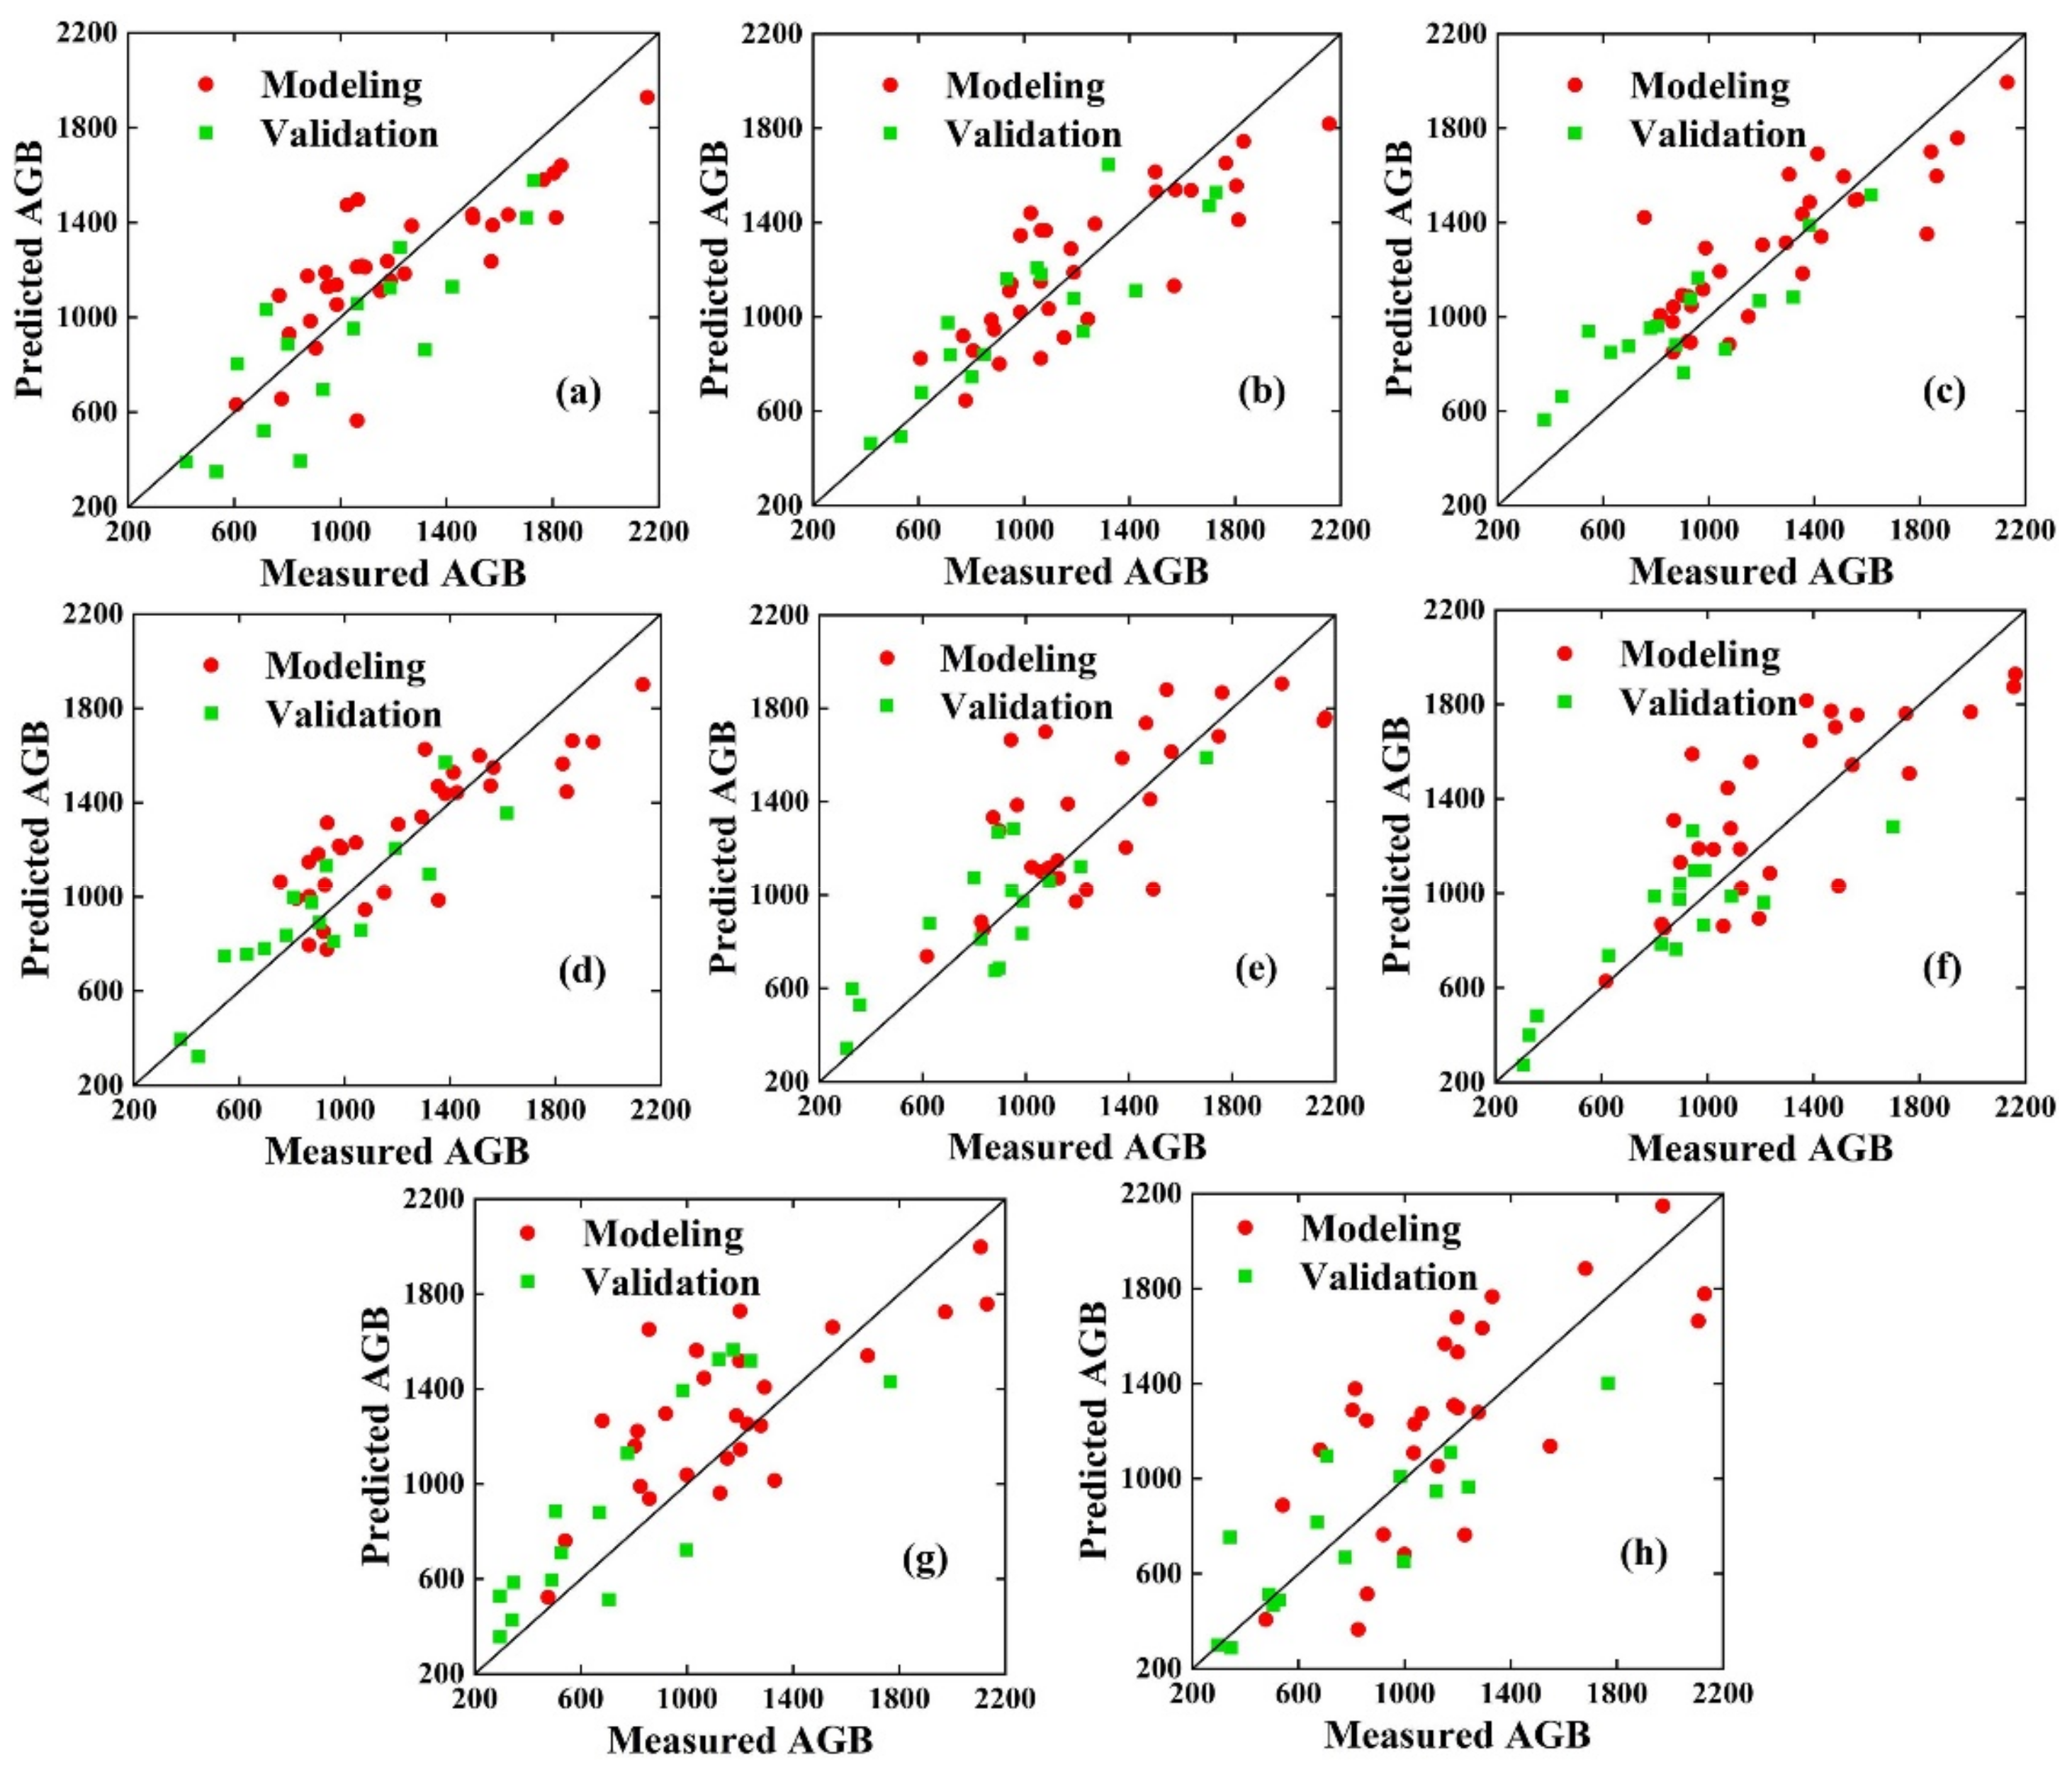
3.3. Estimation of AGB Using VIs, Optimal GEPs Combined with PLSR and RF Methods

To improve the accuracy and stability of the AGB estimation model, this study selects the top six VIs and optimal GEPs based on the correlation ranking in Table 2. For example, ranking correlation from best to worst in the tuber-formation stage gives PSRI, SPVI, SRI, LCI, TVI, OSAVI, and Drmin. Doing the same in the tuber-growth stage gives PBI, SPVI, MSAVI, RDVI, SAVI, OSAVI, and Rsum. Doing the same in the starch-storage stage gives LCI, PBI, DVI, RDVI, SAVI, MSAVI, and Rsum. Finally, doing the same in the mature stage gives PSRI, TVI, TCARI, DVI, OSAVI, LCI, and SDr. Based on the spectral parameters obtained at different growth stages, the PLSR and RF methods are used to estimate the potato AGB over the different growth stages.
Table 6 and Table 7 show the VIs combined with the optimal GEPs using PLSR and RF regression to estimate the potato AGB over different growth stages, respectively. These results show that, based on the VIs, the PLSR and RF methods produce the most accurate potato AGB estimates for the tuber growth stage. For PLSR modeling, R2 = 0.72, RMSE = 254.63 kg/hm2, and NRMSE = 17.55%. For RF modeling, R2 = 0.69, RMSE = 265.22 kg/hm2, and NRMSE = 18.28%. However, the use of PLSR or RF regression techniques combined with VIs and optimal GEPs produce more accurate estimates of potato AGB at each growth stage, with the best estimate being for the tuber growth stage. The best R2 for PLSR is 0.74 (RMSE = 210.55 kg/hm2, NRMSE = 14.51%), and the best R2 for RF is 0.71 (RMSE = 234.92 kg/hm2, NRMSE = 16.19%). The accuracy of the AGB estimation model constructed by the PLSR or RF method based on VIs and VIs combined with the optimal GEPs as the variable first increase and then decrease with progressing growth periods. The estimates gradually improve in going from the tuber-formation stage to the tuber-growth stage and then deteriorate in going from the starch-storage stage to the maturity stage.
The validation dataset was used to verify the AGB estimate based on VIs and VIs combined with optimal GEPs using PLSR and RF. Figure 6 and Figure 7 show the relationship between measured and estimated AGB at different potato growth stages. The results show that the accuracy of the model constructed from the PLSR and RF methods is consistent with the accuracy of the modeling set. The larger the R2 value for modeling and verification, the smaller the NRMSE, indicating that the model gains in stability and fits the data better, and the estimation accuracy is reasonable. Compared with estimating AGB based only on VIs (Table 6 and Table 7 and Figure 6 and Figure 7), the estimation accuracy obtained by combining VIs and the optimal GEPs is greater, and the model is more stable. Compared with estimating AGB by using only the optimal GEPs (Table 3), optimal VIs (Table 4), or VIs combined with the optimal GEPs (Table 5), the estimation accuracy obtained by using the PLSR and RF methods is significantly improved. In addition, the comprehensive analysis and comparison of the evaluation indexes of model accuracy for the four potato growth stages show that using the PLSR method produces more accurate AGB estimates than using the RF method.

3.4. Spatial Distribution of AGB

Comparing the accuracy indicators of each model (Table 3, Table 4, Table 5, Table 6 and Table 7) allows us to make the final selection based on VIs combined with the optimal GEPs and using the PLSR method to obtain the spatial distribution of potato AGB during tuber formation, tuber growth, starch storage, and maturity (Figure 8). During tuber formation, the AGBs of the plots differ significantly, with the overall distribution varying from 0 to 2400 kg/hm2. However, the AGB of most plots falls between 0 and 1600 kg/hm2. Repeat 1 and 2 plots have higher AGBs than repeat 3 plots, with repeat 2 plots having the highest AGB. During tuber growth, potato stems and leaves grow wildly, so this stage has the highest AGB of all stages. At this time, the overall AGB of each plot exceeds 1600 kg/hm2, and the AGB of repeat 1 and 2 plots is even as high as 2400 kg/hm2. Repeat 2 plots have the highest AGB and repeat 3 plots have the lowest. During starch storage, the AGB of each plot begins to decrease, falling mainly between 800 and 1600 kg/hm2. Similarly, the AGB of the repeat 1 and 2 plots exceeds that of the repeat 3 plot, with the repeat 2 plot having the highest AGB. During the mature stage, the edge of the experimental area saw relatively good growth, but the AGB of the three replicate plots is the lowest of all the growth stages (mainly below 1600 kg/hm2). In general, ranking the potato growth over the four growth periods from strong to weak gives repeat 2, repeat 1, and repeat 3. The spatial distribution of AGB in Figure 8 is consistent with the measured results, indicating that the selected optimal model produces good inversion.

4. Discussion

4.1. AGB Estimation Based on Spectral Parameters

Before building the AGB-estimation model for each potato growth stage, we analyze the correlation between VIs, GEPs, and AGB. The correlation between these two spectral parameters (VIs and GEPs) and AGB first increases and then decreases over the growth period. This is because, from the tuber-formation stage to the tuber-growth stage, to maintain their own life activities, the vegetative organs such as stem nodes and leaves grow faster, the potato gradually grows better, and the vegetation coverage of the crop canopy increases, thus making the extracted canopy spectral information less vulnerable to the effect of ground soil and more closely linked to AGB. From the starch-storage stage to the maturity stage, the assimilates accumulated by photosynthesis must be continuously transported to the underground tubers. Because of the rainy season, the above-ground stems and leaves continuously wither and yellow, and the canopy vegetation coverage gradually decreases. Spectral information is interfered by the soil background, which worsens the relationship between spectral parameters and AGB. The results also show that the correlation between GEPs and AGB is weaker than that of the VIs, which is consistent with the results of Kasim et al. [50]. This result may be related to the range of the bands and the spectral resolution of the sensor.
Based on the optimal VIs and the optimal GEPs selected at each growth stage, the optimal VIs at the tuber-formation stage and the maturity stage is PSRI, the optimal GEPs is Drmin and SDR, respectively, and the optimal VIs at the tuber-growth and starch-storage stages is PBI and LCI, respectively. The optimal GEPs is Rsum, indicating that the spectral parameters are closely related to the crop growth stage. However, some spectral parameters cannot accurately estimate AGB due to saturation [15,34], so it is important to determine the spectral parameters and AGB sensitivity at different growth stages for monitoring potato growth.
Estimating AGB in each growth period based on the optimal GEPs is not as accurate as doing it based on the optimal VIs (Table 3 and Table 4), but combining the VIs can improve the estimation accuracy (Table 5), which is consistent with the results of Zhang et al. [37] and Zheng et al. [47], who reached the same conclusion from estimating the AGB of sugar beet and rice, indicating that the GEPs more strongly affects AGB estimates during the crop growth stage. Therefore, deep mining of the sensitive spectral parameters in the green-edge region helps improve the accuracy of AGB estimates. The study found that AGB estimates based on the optimal VIs, the optimal GEPs, and combinations thereof gradually improve in going from the tuber-formation stage to the tuber-growth stage, and gradually deteriorate in going from the starch-storage stage to the maturity stage, which is related to the early spectral parameters being more correlated with AGB than the later spectral parameters (Table 2). Based on the single-variable estimation model, the maximum R2 in each growth period is less than 0.55, which indicates that AGB estimates based only on the optimal spectral parameters are insufficient, so multiple sensitive spectral variables must be combined to improve the accuracy of AGB estimates and thereby monitor the growth of potato crops.
A sensitivity analysis of the spectral parameters and AGB indicates that the first six VIs and the optimal GEPs are strongly correlated in each growth period, so these are selected as model factors to estimate AGB. The selected VIs and potato AGB reach a significance level of 0.01 in the first three growth stages and a significance level of 0.05 in the mature stage. However, the optimal GEPs selected at each growth stage reaches a significance level of 0.01 for AGB, but the correlation weakens in the later stage, which is attributed to the potato crop growth cycle and dry matter distribution [51]. We used PLSR and RF based on VIs alone and VIs combined with the optimal GEPs to estimate AGB at each growth stage and analyzed the accuracy of each model. The results show that the accuracy of AGB estimates obtained from the same model with different variables gradually increases in going from the tuber-formation to the tuber-growth stage, and then gradually decreases in going from the starch-storage to the mature stage, which is consistent with the AGB estimates based on the optimal VIs, the optimal GEPs, and the combination thereof (Table 3, Table 4, Table 5, Table 6 and Table 7). Estimating AGB based on VIs alone or on VIs combined with the optimal GEPs is more accurate than doing so based on a single model factor, which is consistent with the results obtained by Han et al. [32] and Zhu et al. [35] for estimating corn AGB, indicating that it is particularly important to use multiple VIs with high sensitivity to improve the accuracy of AGB estimates. Estimating the AGB of each growth period based on VIs and the optimal GEPs is the most accurate approach, which shows that adding GEPs can improve the accuracy of the model. The green edge contains special band information for hyperspectral remote sensing and is highly sensitive to crop parameters, so further research is needed to understand its relationship with growth parameters.

4.2. AGB Estimation Based on Regression Technique

We use PLSR and RF based on VIs alone and on VIs combined with the optimal GEPs to construct AGB estimation models of potatoes at different growth stages, which produces more accurate AGB estimates (Table 6 and Table 7), indicating that it is feasible to estimate crop parameters by using models based on PLSR and RF. In addition, the PLSR technique based on VIs combined with the optimal GEPs produces the most accurate AGB estimates in each growth period, whereas estimating AGB with the RF technique is relatively inaccurate. Comparing the precision of the validation set and modeling set (Table 6 and Table 7; Figure 6 and Figure 7) shows that the validation results are consistent with the modeling results, indicating that the AGB estimation model built from the PLSR technique is more stable and more accurate than the RF model, which is consistent with the results obtained by Tao et al. [15] and Yue et al. [46] for estimating winter wheat AGB. This is because there is a certain degree of autocorrelation between input variables. The PLSR technique uses principal component analysis to better solve the problem of collinearity between variables. It thus makes full use of spectral information to estimate AGB [15,46,52]. However, using RF techniques produces inaccurate AGB estimates, mainly because machine learning methods are designed for larger datasets and perform poorly with smaller data sets. This study involves 32 modeling-set data and 16 validation-set data, which are small data sets. Second, the spectral variables selected in this study are multicollinear, and the RF algorithm is not sensitive to multicollinearity, so models built on the RF method produce less accurate AGB estimates [11,29].

4.3. Spatial Distribution of AGB

The optimal model constructed by the PLSR method is used to draw the spatial distribution of AGB for each potato growth period. The AGB over the entire growth period first increases and then decreases (Figure 8), which is consistent with the measured results and with the potato growth law. From the tuber-formation to the tuber-growth stage, the vegetative organs such as stems and leaves develop gradually under their own metabolic activity, whereas potato AGB is mainly contained in the stems and leaves, so the AGB of a single potato plant continues to increase in the early stage. From the starch-storage stage to the maturity stage, the organic matter accumulated on the ground must be continuously transported to the underground tubers, which limits plant growth. At the same time, the late-growth stage is subject to continuous rainy weather, resulting in rapid withering and yellowing of the stems and leaves above the ground, which gradually reduces the AGB. In the spatial distribution of potato AGB in the four growth stages (Figure 8), the AGB values of different growth stages differ significantly, as do the AGB values of different experimental plots in the same growth stage. This result may be related to the growth of potato plants themselves, differences in the field, and the influence of external environmental factors. Although this study uses UAV hyperspectral sensors to obtain crop canopy spectral information which is expensive, and the data structure is complex compared with multispectral sensors, it can provide more crop canopy spectral information with the high spectral resolution (narrowband) and multiple bands, which can provide an opportunity to mine and extract spectral parameters (such as green edges) related to crop growth information. In this study, the advantages of UAV hyperspectral remote sensing were used to extract the VIs and GEPs used to characterize crop growth, and potato AGB monitoring was successfully realized.

5. Conclusions

This study uses linear regression, PLSR, and RF methods to estimate the AGB of potatoes during tuber-formation, tuber-growth, starch-storage, and maturity stages based on VIs, GEPs, and combinations thereof. The results show that the correlation between (i) VIs and GEPs and (ii) AGB gradually increase in going from the tuber-formation stage to the tuber-growth stage and decrease in going from the starch-storage stage to the mature stage. In addition, the VIs correlate more strongly with AGB than do the GEPs. AGB estimates based on the optimal VIs, the optimal GEPs, and combinations thereof improve in going from the tuber-formation stage to the tuber-growth stage and worsen in going from the starch-storage stage to the maturity stage. AGB estimates based on the combination of the optimal VIs and the optimal GEPs are the most accurate, and estimates based on the optimal VI and the optimal GEP are the worst. VIs combined with the optimal GEPs using PLSR and RF methods produce more accurate AGB estimates at each growth stage than do methods based on a single optimal VIs, a single optimal GEPs, or combinations thereof. Using the same method with different variables produces AGB estimates that gradually improve in going from the tuber-formation stage to the tuber-growth stage and then gradually worsen in going from the starch-storage stage to the mature stage. The model constructed by the PLSR method with the combination of VIs and the optimal GEPs produces the most accurate and stable AGB estimates for each growth period.

Author Contributions

H.F., Y.L., G.Y. and J.Y. designed the experiments. H.F., Y.L., Y.F. and X.S. collected the AGB and UAV hyperspectral images. Y.L. and H.F. analyzed the data and wrote the manuscript. X.J. and H.Y. made comments and revised the manuscript. All authors have read and agreed to the published version of the manuscript.

Funding

This study was supported by the Key scientific and technological projects of Heilongjiang province (2021ZXJ05A05), the National Natural Science Foundation of China (41601346), the Platform Construction Funded Program of Beijing Academy of Agriculture and Forestry Sciences (No.PT2022-24), and the Key Field Research and Development Program of Guangdong Province (2019B020216001).

Data Availability Statement

Not applicable.

Acknowledgments

The authors thank Bo Xu, Hong Chang, Weiguo Li, Yang Meng, and Yu Zhao for field management and data collection. The authors also thank the National Precision Agriculture Experiment Station for providing the test site and employees.

Conflicts of Interest

The authors declare no conflict of interest.

References

  1. Liu, Y.; Feng, H.; Yue, J.; Li, Z.; Yang, G.; Song, X.; Yang, X.; Zhao, Y. Remote-sensing estimation of potato above-ground biomass based on spectral and spatial features extracted from high-definition digital camera images. Comput. Electron. Agric. 2022, 198, 107089. [Google Scholar] [CrossRef]
  2. Brocks, S.; Bareth, G. Estimating barley biomass with crop surface models from Oblique RGB imagery. Remote Sens. 2018, 10, 268. [Google Scholar] [CrossRef] [Green Version]
  3. Bendig, J.; Yu, K.; Aasen, H.; Bolten, A.; Bennertz, S.; Broscheit, J.; Gnyp, M.L.; Bareth, G. Combining UAV-based plant height from crop surface models, visible, and near infrared vegetation indices for biomass monitoring in barley. Int. J. Appl. Earth Obs. Geoinf. 2015, 39, 79–87. [Google Scholar] [CrossRef]
  4. Gnyp, M.L.; Miao, Y.; Yuan, F.; Ustin, S.L.; Yu, K.; Yao, Y.; Huang, S.; Bareth, G. Hyperspectral canopy sensing of paddy rice aboveground biomass at different growth stages. Field Crops Res. 2014, 155, 42–55. [Google Scholar] [CrossRef]
  5. Li, W.; Niu, Z.; Chen, H.; Li, D.; Wu, M.; Zhao, W. Remote estimation of canopy height and aboveground biomass of maize using high-resolution stereo images from a low-cost unmanned aerial vehicle system. Ecol. Indic. 2016, 67, 637–648. [Google Scholar] [CrossRef]
  6. Zhu, W.; Sun, Z.; Peng, J.; Huang, Y.; Li, J.; Zhang, J.; Yang, B.; Liao, X. Estimating maize above-ground biomass using 3D point clouds of multi-source unmanned aerial vehicle data at multi-spatial scales. Remote Sens. 2019, 11, 2678. [Google Scholar] [CrossRef] [Green Version]
  7. Walter, J.D.C.; Edwards, J.; McDonald, G.; Kuchel, H. Estimating biomass and canopy height with LiDAR for field crop breeding. Front. Plant Sci. 2019, 10, 1145–1157. [Google Scholar] [CrossRef] [PubMed] [Green Version]
  8. Fu, Y.; Yang, G.; Wang, J.; Song, X.; Feng, H. Winter wheat biomass estimation based on spectral indices, band depth analysis and partial least squares regression using hyperspectral measurements. Comput. Electron. Agric. 2014, 100, 51–59. [Google Scholar] [CrossRef]
  9. Yue, J.; Feng, H.; Jin, X.; Yuan, H.; Li, Z.; Zhou, C.; Yang, G.; Tian, Q. A comparison of crop parameters estimation using images from UAV-mounted snapshot hyperspectral sensor and high-definition digital camera. Remote Sens. 2018, 10, 1138. [Google Scholar] [CrossRef] [Green Version]
  10. Greaves, H.E.; Vierling, L.A.; Eitel, J.U.H.; Boelman, N.T.; Magney, T.S.; Prager, C.M.; Griffin, K.L. Estimating aboveground biomass and leaf area of low-stature Arctic shrubs with terrestrial LiDAR. Remote Sens. Environ. 2015, 164, 26–35. [Google Scholar] [CrossRef]
  11. Jin, X.; Liu, S.; Baret, F.; Hemerlé, M.; Comar, A. Estimates of plant density of wheat crops at emergence from very low altitude UAV imagery. Remote Sens. Environ. 2017, 198, 105–114. [Google Scholar] [CrossRef] [Green Version]
  12. Schirrmann, M.; Hamdorf, A.; Garz, A.; Ustyuzhanin, A.; Dammer, K.-H. Estimating wheat biomass by combining image clustering with crop height. Comput. Electron. Agric. 2016, 121, 374–384. [Google Scholar] [CrossRef]
  13. Chen, Y.; Li, L.; Lu, D.; Li, D. Exploring bamboo forest above ground biomass estimation using sentinel-2 Data. Remote Sens. 2019, 11, 7. [Google Scholar] [CrossRef] [Green Version]
  14. Duan, B.; Fang, S.; Gong, Y.; Peng, Y.; Wu, X.; Zhu, R. Remote estimation of grain yield based on UAV data in different rice cultivars under contrasting climatic zone. Field Crop. Res. 2021, 267, 108148–108166. [Google Scholar] [CrossRef]
  15. Tao, H.; Feng, H.; Xu, L.; Miao, M.; Long, H.; Yue, J.; Li, Z.; Yang, G.; Yang, X.; Fan, L. Estimation of crop growth parameters using UAV-based hyperspectral remote sensing data. Sensors 2020, 20, 1296–1317. [Google Scholar] [CrossRef] [PubMed] [Green Version]
  16. Kross, A.; McNairn, H.; Lapen, D.; Sunohara, M.; Champagne, C. Assessment of RapidEye vegetation indices for estimation of leaf area index and biomass in corn and soybean crops. Int. J. Appl. earth Obs. 2015, 34, 235–248. [Google Scholar] [CrossRef] [Green Version]
  17. Ma, G.N.; Huang, J.X.; Wu, W.B.; Fan, J.L.; Zou, J.Q.; Wu, S.J. Assimilation of MODIS-LAI into the WOFOST model for forecasting regional winter wheat yield. Math. Comput. Model. 2013, 58, 634–643. [Google Scholar] [CrossRef]
  18. Zhao, Y.; Chen, S.; Shen, S. Assimilating remote sensing information with crop model using Ensemble Kalman Filter for improving LAI monitoring and yield estimation. Ecol. Model. 2013, 270, 30–42. [Google Scholar] [CrossRef]
  19. Zhou, G.; Liu, X.; Liu, M. Assimilating remote sensing phenological information into the WOFOST model for rice growth simulation. Remote Sens. 2019, 11, 268. [Google Scholar] [CrossRef] [Green Version]
  20. Montoya, F.; Camargo, D.; Domínguez, A.; Ortega, J.; Córcoles, J. Parametrization of Cropsyst model for the simulation of a potato crop in a Mediterranean environment. Agric. Water Manag. 2018, 203, 297–310. [Google Scholar] [CrossRef]
  21. Lobell, D.B.; Ortiz-Monasterio, J.I. Regional importance of crop yield constraints: Linking simulation models and geostatistics to interpret spatial patterns. Ecol. Model. 2005, 196, 173–182. [Google Scholar] [CrossRef]
  22. Chahbi, A.; Zribi, M.; Lili-Chabaane, Z.; Duchemin, B.; Shabou, M.; Mougenot, B.; Boulet, G. Estimation of the dynamics and yields of cereals in a semi-arid area using remote sensing and the SAFY growth model. Int. J. Remote Sens. 2014, 35, 1004–1028. [Google Scholar] [CrossRef] [Green Version]
  23. Choudhury, M.R.; Das, S.; Christopher, J.; Apan, A.; Chapman, S.; Menzies, N.W.; Dang, Y.P. Improving biomass and grain yield prediction of wheat genotypes on sodic soil using integrated high-resolution multispectral, hyperspectral, 3D point cloud, and machine learning techniques. Remote Sens. 2021, 13, 3482. [Google Scholar] [CrossRef]
  24. Berger, K.; Atzberger, C.; Danner, M.; D’Urso, G.; Mauser, W.; Vuolo, F.; Hank, T.; Berger, K.; Atzberger, C.; Danner, M.; et al. Evaluation of the PROSAIL model capabilities for future hyperspectral model environments: A review study. Remote Sens. 2018, 10, 85. [Google Scholar] [CrossRef] [Green Version]
  25. Xiao, X.; Zhang, Q.; Braswell, B.; Urbanski, S.; Boles, S.; Wofsy, S.; Moore, B.; Ojima, D. Modeling gross primary production of temperate deciduous broadleaf forest using satellite images and climate data. Remote Sens. Environ. 2004, 91, 256–270. [Google Scholar] [CrossRef]
  26. Shendryk, Y.; Sofonia, J.; Garrard, R.; Rist, Y.; Skocaj, D.; Thorburn, P. Fine-scale prediction of biomass and leaf nitrogen content in sugarcane using UAV LiDAR and multispectral imaging. Int. J. Appl. Earth Obs. 2020, 92, 102177–102191. [Google Scholar] [CrossRef]
  27. Mansaray, L.R.; Kanu, A.S.; Yang, L.; Huang, J.; Wang, F. Evaluation of machine learning models for rice dry biomass estimation and mapping using quad-source optical imagery. GISci. Remote Sens. 2020, 57, 785–796. [Google Scholar] [CrossRef]
  28. Suarez, L.A.; Robson, A.; McPhee, J.; O’Halloran, J.; Van Sprang, C. Accuracy of carrot yield forecasting using proximal hyperspectral and satellite multispectral data. Precis. Agric. 2020, 21, 1304–1326. [Google Scholar] [CrossRef]
  29. Jin, X.; Li, Z.; Feng, H.; Ren, Z.; Li, S. Deep neural network algorithm for estimating maize biomass based on simulated Sentinel 2A vegetation indices and leaf area index. Crop J. 2020, 8, 87–97. [Google Scholar] [CrossRef]
  30. Zhang, L.X.; Chen, Y.Q.; Li, Y.X.; Ma, J.C.; Zheng, F.X.; Sun, Z.F. Estimating above ground biomass of winter wheat at early growth stages based on visual spectral. Spectrosc. Spect. Anal. 2018, 39, 2501–2506. [Google Scholar]
  31. Devia, C.A.; Rojas, J.P.; Petro, E.; Martinez, C.; Mondragon, I.F.; Patino, D.; Rebolledo, M.C.; Colorado, J. High-throughput biomass estimation in rice crops using UAV multispectral imagery. J. Intell. Robot. Syst. 2019, 96, 573–589. [Google Scholar] [CrossRef]
  32. Han, L.; Yang, G.; Dai, H.; Xu, B.; Yang, H.; Feng, H.; Li, Z.; Yang, X. Modeling maize above-ground biomass based on machine learning approaches using UAV remote-sensing data. Plant Methods 2019, 15, 10–24. [Google Scholar] [CrossRef] [PubMed] [Green Version]
  33. Asari, N.; Suratman, M.N.; Jaafar, J. Modelling and mapping of above ground biomass (AGB) of oil palm plantations in Malaysia using remotely-sensed data. Int. J. Remote Sens. 2017, 38, 4741–4764. [Google Scholar] [CrossRef]
  34. Yue, J.; Yang, G.; Li, C.; Li, Z.; Wang, Y.; Feng, H.; Xu, B. Estimation of winter wheat above-ground biomass using unmanned aerial vehicle-based snapshot hyperspectral sensor and crop height improved models. Remote Sens. 2017, 9, 708. [Google Scholar] [CrossRef] [Green Version]
  35. Zhu, Y.; Zhao, C.; Yang, H.; Yang, G.; Han, L.; Li, Z.; Feng, H.; Xu, B.; Wu, J.; Lei, L. Estimation of maize above-ground biomass based on stem-leaf separation strategy integrated with LiDAR and optical remote sensing data. PeerJ 2019, 7, 7593–7614. [Google Scholar] [CrossRef] [PubMed] [Green Version]
  36. Nguyen, H.T.; Lee, B.-W. Assessment of rice leaf growth and nitrogen status by hyperspectral canopy reflectance and partial least square regression. Eur. J. Agron. 2006, 24, 349–356. [Google Scholar] [CrossRef]
  37. Zhang, J.; Tian, H.; Wang, D.; Li, H.; Mouazen, A.M. A novel approach for estimation of above-ground biomass of sugar beet based on wavelength selection and optimized support vector machine. Remote Sens. 2020, 12, 620–638. [Google Scholar] [CrossRef] [Green Version]
  38. Yue, J.; Feng, H.; Yang, G.; Li, Z. A Comparison of regression techniques for estimation of above-ground winter wheat biomass using near-surface spectroscopy. Remote Sens. 2018, 10, 66. [Google Scholar] [CrossRef] [Green Version]
  39. Sun, Q.; Gu, X.; Chen, L.; Xu, X.; Wei, Z.; Pan, Y.; Gao, Y. Monitoring maize canopy chlorophyll density under lodging stress based on UAV hyperspectral imagery. Comput. Electron. Agric. 2022, 193, 106671–106685. [Google Scholar] [CrossRef]
  40. Yao, X.; Si, H.; Cheng, T.; Jia, M.; Chen, Q.; Tian, Y.; Zhu, Y.; Cao, W.; Chen, C.; Cai, J.; et al. Hyperspectral estimation of canopy leaf biomass phenotype per ground area using a continuous wavelet analysis in wheat. Front. Plant Sci. 2018, 9, 1360–1374. [Google Scholar] [CrossRef] [Green Version]
  41. Tian, H.; Shi, S.; Wang, H.; Li, F.; Li, Z.; Alva, A.; Zhang, Z. Estimation of sugar beet aboveground biomass by band depth optimization of hyperspectral canopy reflectance. J. Indian Soc. Remote 2017, 45, 795–803. [Google Scholar] [CrossRef]
  42. Chen, H.Y.H.; Luo, Y.; Reich, P.B.; Searle, E.B.; Biswas, S.R. Climate change—Associated trends in net biomass change are age dependent in western boreal forests of Canada. Ecol. Lett. 2016, 19, 1150–1158. [Google Scholar] [CrossRef] [PubMed]
  43. Bendig, J.; Bolten, A.; Bennertz, S.; Broscheit, J.; Eichfuss, S.; Bareth, G. Estimating biomass of barley using crop surface models (CSMs) derived from UAV-based RGB imaging. Remote Sens. 2014, 6, 10395–10412. [Google Scholar] [CrossRef] [Green Version]
  44. Banerjee, B.; Spangenberg, G.; Kant, S. Fusion of spectral and structural information from aerial images for improved biomass estimation. Remote Sens. 2020, 12, 3164. [Google Scholar] [CrossRef]
  45. Liu, Y.; Liu, S.; Li, J.; Guo, X.; Wang, S.; Lu, J. Estimating biomass of winter oilseed rape using vegetation indices and texture metrics derived from UAV multispectral images. Comput. Electron. Agric. 2019, 166, 105026–105036. [Google Scholar] [CrossRef]
  46. Yue, J.; Yang, G.; Tian, Q.; Feng, H.; Xu, K.; Zhou, C. Estimate of winter-wheat above-ground biomass based on UAV ultrahigh-ground-resolution image textures and vegetation indices. ISPRS J. Photogramm. Remote Sens. 2019, 150, 226–244. [Google Scholar] [CrossRef]
  47. Zheng, H.B.; Cheng, T.; Zhou, M.; Li, D.; Yao, X.; Tian, Y.C.; Cao, W.X.; Zhu, Y. Improved estimation of rice aboveground biomass combining textural and spectral analysis of UAV imagery. Precis. Agric. 2019, 20, 611–629. [Google Scholar] [CrossRef]
  48. Quirós Vargas, J.J.; Zhang, C.; Smitchger, J.A.; McGee, R.J.; Sankaran, S. Phenotyping of plant biomass and performance traits using remote sensing techniques in pea. Sensors 2019, 19, 2031. [Google Scholar] [CrossRef] [Green Version]
  49. Sankaran, S.; Zhou, J.; Khot, L.R.; Trapp, J.J.; Mndolwa, E.; Miklas, P.N. High-throughput field phenotyping in dry bean using small unmanned aerial vehicle based multispectral imagery. Comput. Electron. Agric. 2018, 151, 84–92. [Google Scholar] [CrossRef]
  50. Kasim, N.; Shi, Q.D.; Wang, J.Z.; Sawut, R.; Nurmemet, I.; Isak, G. Estimation of spring wheat chlorophyll content based on hyperspectral features and PLSR model. Trans. Chin. Soc. Agric. Eng. 2017, 33, 208–215. [Google Scholar]
  51. Li, B.; Xu, X.; Zhang, L.; Han, J.; Bian, C.; Li, G.; Liu, J.; Jin, L. Above-ground biomass estimation and yield prediction in potato by using UAV-based RGB and hyperspectral imaging. ISPRS J. Photogramm. Remote Sens. 2020, 162, 161–172. [Google Scholar] [CrossRef]
  52. Li, X.; Zhang, Y.; Bao, Y.; Luo, J.; Jin, X.; Xu, X.; Song, X.; Yang, G. Exploring the best hyperspectral features for LAI estimation using partial least squares regression. Remote Sens. 2014, 6, 6221–6241. [Google Scholar] [CrossRef]
Figure 1. Location of experimental area.
Remotesensing 14 05323 g001
Figure 2. Experimental design.
Remotesensing 14 05323 g002
Figure 3. Components of the UHD 185 hyperspectral system.
Remotesensing 14 05323 g003
Figure 4. Canopy spectral reflectance of potato in four key growth stages.
Remotesensing 14 05323 g004
Figure 5. Correlation coefficient between potato canopy spectra and AGB.
Remotesensing 14 05323 g005
Figure 6. Relationship between measured and PLSR-estimated potato AGB (kg/hm2) at different growth stages: (a) VIs, (b) VIs and optimal GEPs (tuber form stage); (c) VIs, (d) VIs and GEPs (tuber growth stage); (e) VIs, (f) VIs and GEPs (starch storage stage); (g) VIs, (h) VIs and GEPs (maturity stage).
Remotesensing 14 05323 g006
Figure 7. Relationship between measured and RF-estimated potato AGB (kg/hm2) at different growth stages: (a) VIs, (b) VIs and optimal GEPs (tuber form stage); (c) VIs, (d) VIs and optimal GEPs (tuber growth stage); (e) VIs, (f) VIs and optimal GEPs (starch storage stage); (g) VIs, (h) VIs and optimal GEPs (maturity stage).
Remotesensing 14 05323 g007
Figure 8. RGB images of potato canopy (left) and distribution (right) of the estimated AGB (kg/hm2) in the 48 study plots obtained by combining VIs and the optimal GEPs and using the PLSR method: (a) tuber formation, (b) tuber growth, (c) starch storage, (d) maturity.
Remotesensing 14 05323 g008
Table 1. VIs used in this study.
Vegetation IndicesDefinitionReferences
MSR (modified simple ratio index)(R800/R670 − 1)/(R800/R670 + 1)1/2[15]
MSAVI (modified soil adjusted vegetation index)0.5 × [2 × R800 + 1 − ((2×R800 + 1)2 – 8 × (R800 − R670))1/2][34]
OSAVI (optimizing soil adjusted vegetation index)1.16 × (R800 − R670)/(R800 + R670 + 0.16)[15]
PSRI (plant senescence reflectance index)(R680 − R500)/R750[46]
RDVI (renormalized difference vegetation index)(R800 − R670)/(R800 + R670)1/2[15]
TCARI (transformed chlorophyll absorption ratio index)3 × [(R710 − R680) − 0.2 × (R700 − R560)(R710/R680)][15]
TVI (triangular vegetation index)0.5 × [120 × (R750-R550) − 200×(R670 − R550)][15]
SPVI (spectral polygon vegetation index)0.4 × [3.7 × (R800-R670) − 1.2×|R550 − R670|][34]
DVI (difference vegetation index)R890-R670[15]
MCARI (modified chlorophyll absorption ratio index)((R700 − R670) − 0.2 × (R700-R550))(R700/R670)[34]
NDVI (normalized difference vegetation index)(R800 − R680)/(R800 + R680)[29]
PBI (plant biochemical index)R810/R560[38]
LCI (linear combination index)(R850 − R710)/(R850 + R670)1/2[38]
SRI (simple ratio vegetation index)R800/R680[45]
SAVI (soil adjusted vegetation index)(1 + 0.5) × (R800 − R670)/(R800 + R670 + 0.5)[45]
Table 2. Correlation coefficients between (i) VIs and GEPs and (ii) AGB for the four potato growth stages.
Spectral
Parameters
AGB
Tuber Form StageTuber Growth StageStarch Store StageMaturity Stage
VIsMSR0.6360.7330.724−0.237
MSAVI0.6510.7480.729−0.266
OSAVI0.6550.7420.717−0.291
PSRI−0.727−0.682−0.6960.396
RDVI0.6420.7460.731−0.270
TCARI0.4100.6860.641−0.304
TVI0.6590.7410.714−0.314
SPVI0.6730.7560.728−0.256
DVI0.6500.7420.733−0.302
MCARI0.2200.6760.581−0.197
NDVI0.5800.7330.729−0.255
PBI0.6540.7570.745−0.047
LCI0.6610.7250.751−0.284
SRI0.6620.7260.715−0.238
SAVI0.6390.7460.731−0.270
GEPsRmax−0.367−0.613−0.546−0.311
Rsum−0.342−0.668−0.644−0.236
SDr0.0230.4710.462−0.447
Dr−0.2840.3210.401−0.415
Drmin−0.545−0.509−0.3820.196
Dr/Drmin0.1220.5810.491−0.260
Note: A correlation coefficient with an absolute value greater than 0.361 indicates a significance level of 0.01.
Table 3. Linear regression between optimal GEPs and potato AGB for the four growth stages.
Growth StagesOptimal GEPsModelingValidation
R2RMSE (kg/hm2)NRMSE (%)R2RMSE (kg/hm2)NRMSE (%)
Tuber formDrmin0.31325.3725.240.40256.1525.16
Tuber growthRsum0.37332.8322.940.52229.9621.39
Starch storeRsum0.23404.9629.110.38259.5128.57
MaturitySDr0.21428.8735.120.27279.3932.39
Table 4. Linear regression relationship between optimal VIs and AGB of potato for the four growth stages.
Growth StagesOptimal VIModelingValidation
R2RMSE (kg/hm2)NRMSE (%)R2RMSE (kg/hm2)NRMSE (%)
Tuber formPSRI0.43301.8823.420.59226.5922.24
Tuber growthPBI0.48300.5120.710.62207.1619.27
Starch storeLCI0.38349.7625.140.46208.9823.01
MaturityPSRI0.26376.3330.820.36240.4927.88
Table 5. Linear regression between (i) optimal VIs and optimal GEPs and (ii) potato AGB over the four growth stages.
Growth StagesOptimal
VIs, GEPs
ModelingValidation
R2RMSE (kg/hm2)NRMSE (%)R2RMSE (kg/hm2)NRMSE (%)
Tuber formPSRI, Drmin0.48279.4621.680.62197.4319.39
Tuber growthPBI, Rsum0.54277.0319.090.65187.7017.46
Starch storeLCI, Rsum0.40321.6423.120.55191.3321.07
MaturityPSRI, SDr0.39331.2927.130.48221.8825.71
Table 6. PLSR-based estimates of potato AGB at different growth stages.
Growth StagesDataModelingValidation
R2RMSE (kg/hm2)NRMSE (%)R2RMSE (kg/hm2)NRMSE (%)
Tuber formVIs0.65275.7421.390.71187.0218.37
VIs, Drmin0.68244.0118.930.75169.9316.68
Tuber growthVIs0.72254.6317.550.74162.2315.09
VIs, Rsum0.74210.5514.510.78131.9112.27
Starch storeVIs0.62312.0322.430.69190.3820.96
VIs, Rsum0.66268.6519.310.72171.3718.87
MaturityVIs0.58315.5525.840.67205.1223.78
VIs, SDr0.62290.9823.830.7186.4921.62
Table 7. RF-based estimates of potato AGB at different growth stages.
Growth StagesDataModelingValidation
R2RMSE (kg/hm2)NRMSE (%)R2RMSE (kg/hm2)NRMSE (%)
Tuber formVIs0.63289.422.450.69194.3519.09
VIs, Drmin0.66263.8620.470.72175.9517.27
Tuber growthVIs0.69265.2218.280.71192.01217.86
VIs, Rsum0.71234.9216.190.75152.12214.15
Starch storeVIs0.59324.2723.310.65196.10521.59
VIs, Rsum0.64285.920.550.68180.3719.86
MaturityVIs0.55327.1526.790.62216.85325.14
VIs, SDr0.61300.8724.640.64197.36322.88
Publisher’s Note: MDPI stays neutral with regard to jurisdictional claims in published maps and institutional affiliations.

