Article

Single-Pass UAV-Borne GatorEye LiDAR Sampling as a Rapid Assessment Method for Surveying Forest Structure

by
Gabriel Atticciati Prata
1,*,
Eben North Broadbent
1,
Danilo Roberti Alves de Almeida
1,2,
Joseph St. Peter
3,
Jason Drake
3,4,
Paul Medley
3,4,
Ana Paula Dalla Corte
1,5,
Jason Vogel
6,
Ajay Sharma
7,
Carlos Alberto Silva
6,8,
Angelica Maria Almeyda Zambrano
9,
Ruben Valbuena
10 and
Ben Wilkinson
11
1
Spatial Ecology and Conservation (SPEC) Lab, School of Forest Resources and Conservation, University of Florida, Gainesville, FL 32611, USA
2
Department of Forest Sciences, “Luiz de Queiroz” College of Agriculture, University of São Paulo (USP/ESALQ), Piracicaba, SP 13418-900, Brazil
3
Center for Spatial Ecology and Restoration (CSER), School of the Environment, Florida A&M University, Tallahassee, FL 32307, USA
4
USDA Forest Service, National Forests in Florida, Tallahassee, FL 32303, USA
5
Department of Forest Engineering, Federal University of Paraná—UFPR, Curitiba, PR 80060-000, Brazil
6
School of Forest Resources and Conservation, University of Florida, Gainesville, FL 32611, USA
7
West Florida Research and Education Center, University of Florida, Milton, FL 32583, USA
8
Department of Geographical Sciences, University of Maryland, College Park, MD 20740, USA
9
Spatial Ecology and Conservation (SPEC) Lab, Center for Latin American Studies, University of Florida, Gainesville, FL 32611, USA
10
School of Natural Sciences, Bangor University, Bangor LL57 2UW, UK
11
Geomatics Program, School of Forest Resources and Conservation, University of Florida, Gainesville, FL 32611, USA
*
Author to whom correspondence should be addressed.
Remote Sens. 2020, 12(24), 4111; https://doi.org/10.3390/rs12244111
Submission received: 12 November 2020 / Revised: 11 December 2020 / Accepted: 15 December 2020 / Published: 16 December 2020
(This article belongs to the Special Issue Drones for Ecology and Conservation)

Abstract

:
Unmanned aerial vehicles (UAV) allow efficient acquisition of forest data at very high resolution at relatively low cost, making it useful for multi-temporal assessment of detailed tree crowns and forest structure. Single-pass flight plans provide rapid surveys for key selected high-priority areas, but their accuracy is still unexplored. We compared aircraft-borne LiDAR with GatorEye UAV-borne LiDAR in the Apalachicola National Forest, USA. The single-pass approach produced digital terrain models (DTMs), with less than 1 m differences compared to the aircraft-derived DTM within a 145° field of view (FOV). Canopy height models (CHM) provided reliable information from the top layer of the forest, allowing reliable treetop detection up to wide angles; however, underestimations of tree heights were detected at 175 m from the flightline, with an error of 2.57 ± 1.57. Crown segmentation was reliable only within a 60° FOV, from which the shadowing effect made it unviable. Reasonable quality threshold values for LiDAR products were: 195 m (145° FOV) for DTMs, 95 m (110° FOV) for CHM, 160 to 180 m (~140° FOV) for ITD and tree heights, and 40 to 60 m (~60° FOV) for crown delineation. These findings also support the definition of mission parameters for standard grid-based flight plans under similar forest types and flight parameters.

1. Introduction

Changes in forest canopy structure due to natural disturbances, such as storms and hurricanes, can be monitored with high accuracy from active remote sensors such as LiDAR [1]. The most common LiDAR data, able to perform large area ecosystem characterization, are acquired from aircraft platforms that demand a high operating cost and dependence on specialized companies and require medium-term planning, which often leads to long delays in data becoming available to decision makers. These shortcomings considerably burden its efficacy for rapid response to natural disasters, which is a significant drawback for practical applications of airborne LiDAR [2]. In contrast, unmanned aerial vehicles (UAV) are autonomous alternatives that allow rapid logistical planning and data collection over relatively large areas (hundreds to thousands of hectares) [3]. One of the main limitations of battery-powered UAV systems is the low flight efficiency due to their dependence on battery capacity [4]. It is, thus, of critical importance to develop sampling methods based on UAV single-pass surveys, which allow rapid large area assessment by concentrating in sampling locations of timely interest only. While airborne LiDAR sampling has been widely developed for very large area assessments [5], no study has yet tested the efficiency of single-pass flight sampling designs, more suited for UAVs.
Many studies have proven the usefulness of LiDAR for monitoring forest health [6], natural disturbances such as wildland fire assessment [7,8,9], and meteorological disaster damages from storms and hurricanes [1,10,11]. Airborne LiDAR data acquired from aircrafts has the main advantage of scanning large areas in a short period of time, which allows surveys of entire landscapes with millions of hectares of area [1,12,13]. Only recent developments in LiDAR sensor miniaturization have allowed mature UAV-LiDAR systems [14,15,16,17,18,19]. UAV-LiDAR can collect only a few hundred or thousand hectares per day, but they are less expensive and allow greater autonomy, rapid planning and response, and more frequent data collection [20,21]. UAV-LiDAR can produce much higher return (or point) densities than aircraft-borne LiDAR, similar to those on terrestrial platforms [22,23,24], providing high-accuracy measurement of individual trees and understory vegetation [15,23,25,26]. UAV-LiDAR systems can, thus, greatly focus a monitoring approach by allowing for low-cost multi-temporal surveys with high spatial and temporal resolutions [20,27].
The characteristics of airborne LiDAR data follow the planning and design of the flightline, which influence point cloud properties such as pulse density (number of pulses/m2) [13,28]. Usually, grid-mode LiDAR data collection uses an overlapping approach, which allows collecting homogeneously distributed high density point clouds [23,29]. One potential method to make UAV flights more efficient in terms of the area collected is to use single-pass flights, which consist of rapid surveys without overlaps, where the point cloud density is still higher than those resulting from traditional aircraft LiDAR surveys. Single-pass methodologies have been used in high altitude aircraft surveys in Amazon studies [30,31,32]. These methods have also been used in UAVs to investigate point cloud generation, accuracy assessment, and applicability for forest change detection [20,21]. However, these works restricted scanning angles to a maximum of 30°, and thus, nothing is known on whether reliable information can be collected by single-pass surveys covering larger swaths of land, farther from the flightline. The efficiency of a single-pass UAV-LiDAR approach as a survey method and its feasibility towards wider angles is still unexplored.
The scan angle can severely impact forest structure metrics estimates, for example, leaf area index (LAI), gap fraction [33], foliage profile retrieval [34], and measurements of tree location, height, and crown width [21]. As the distance between the sensor and target is increased, generally less information is acquired, not only due to the shadowing effect on the far side of the trees [21], but also the increased effect of pitch/roll errors in combination with long scan ranges [35]. Thus, when the forest canopy is horizontally distant from the flight line, relatively lower density LiDAR returns are expected [36].
Here, we investigated the potential of single-pass UAV-LiDAR data to measure canopy structure information relevant to natural disaster assessments. More specifically we investigated the optimal scan angle and distance from the flightline for which the GatorEye UAV-LiDAR system would be capable to provide products of a reliability comparable to those provided by aircraft-LiDAR systems using grid-mode. We compared parameters such as the density of total returns and ground returns, and the differences between Digital Terrain Model (DTM), Canopy Height Model (CHM), tree individualization height, and crown area, in a longleaf pine forest.

2. Materials and Methods
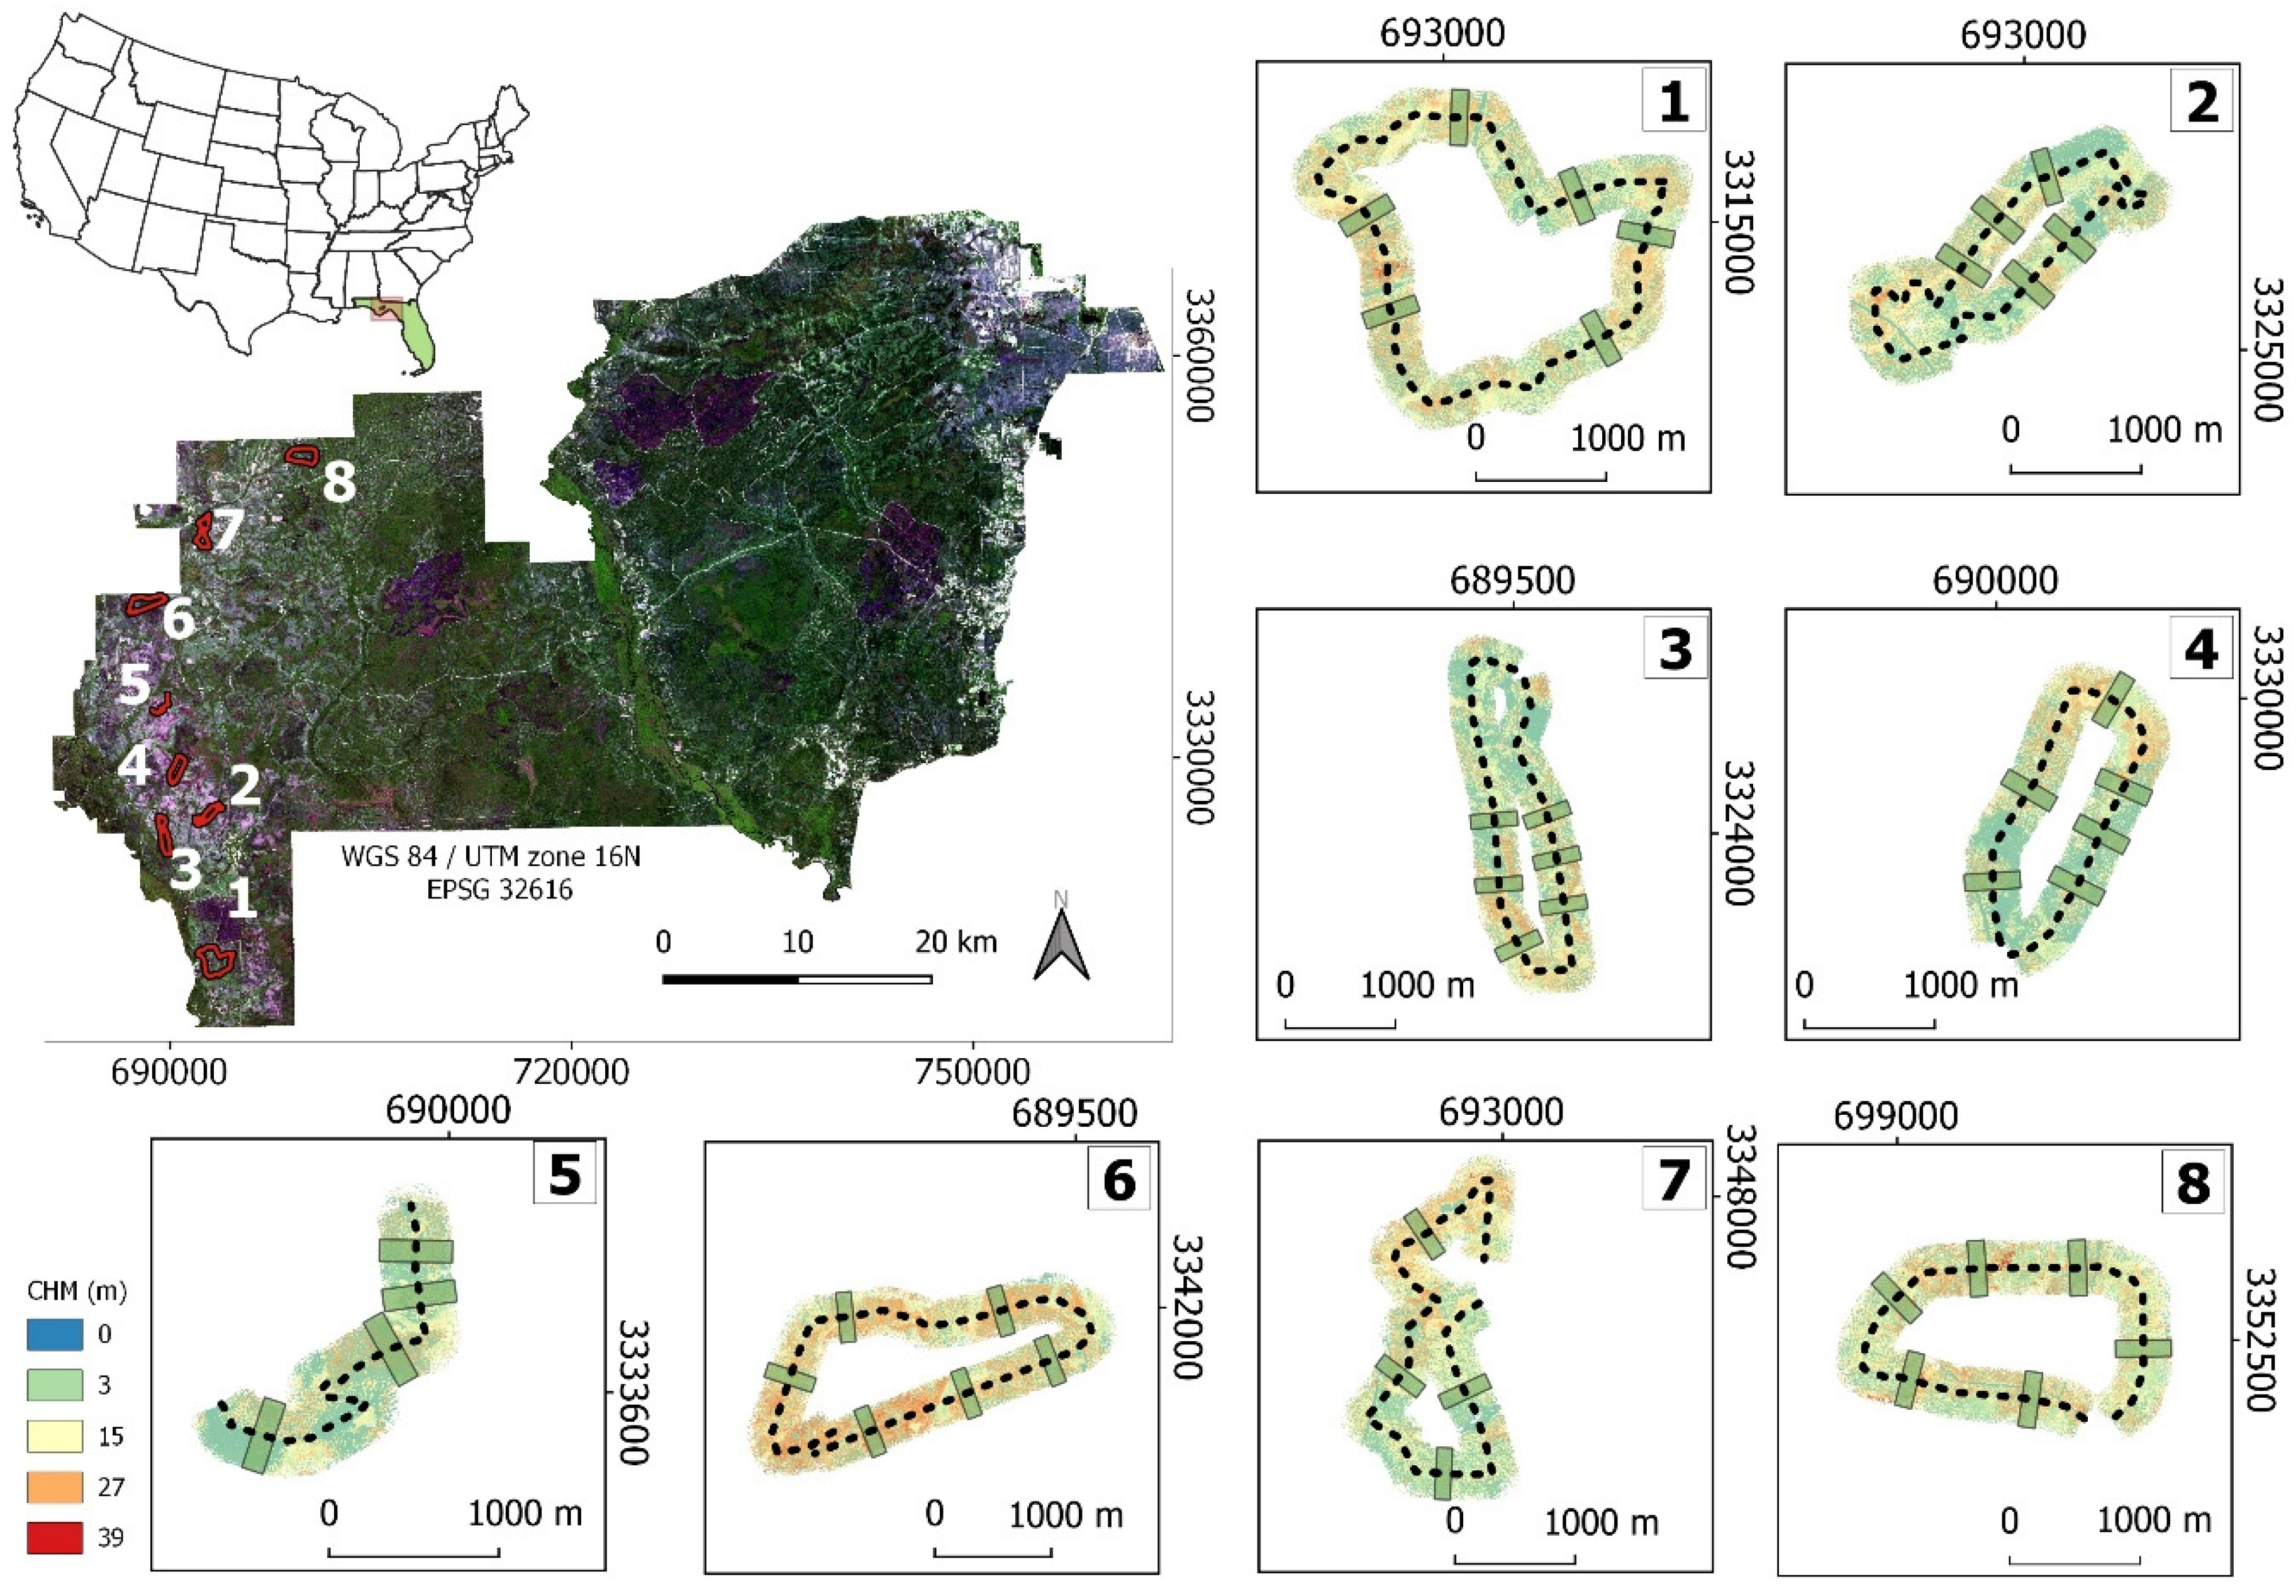
2.1. Study Area

The study area is in the Apalachicola National Forest, a public land in the sandhills of Florida Panhandle, that covers approximately 233,000 hectares in northwestern Florida, USA (Figure 1). Located in a humid subtropical climate zone and flat topography, the Apalachicola National Forest is managed in accordance with the Forest Service management plan (USDA Forest Service 1999). It abounds with cypress, oak, and magnolias trees and is one of the few remaining large and contiguous areas of longleaf pine (Pinus palustris Mill.) in the United States [37]. For planning LiDAR missions, we focused on an area that received mild impact from Hurricane Michael in 2018 [38,39], presenting few damaged and fallen trees verified in prior field works, so we could establish and test the methodology in a multi-temporal approach.

2.2. LiDAR Data

Two (UAV and aircraft) LiDAR datasets (Figure 2) were collected for the study area within a 1.5-year span, using different types of sensors: (i) a Piper PA-31 Navajo outfitted with a Riegl VQ-1560i LiDAR system; and (ii) the GatorEye UAV-LiDAR system, composed of the Phoenix LiDAR sensor suite, onboard the DJI Matrice 600 Pro hexacopter multi-rotor RPAS, with L1/L2 dual-frequency GNSS (PPK mode—Post Processing Kinematic). This system consists of a Velodyne VLP-16 dual-return laser scanner head, capable of 600,000 pulses per second, with Phoenix live and post-processing software [40] (more details in Table 1).
The aircraft LiDAR data were obtained from the “FL Panhandle LiDAR Project,” conducted between 3 March and 10 May 2018, which flew over 26 counties, and had the primary purpose to support Northwest Florida water resource planning, flood control, and the Federal Emergency Management Agency’s Risk MAP program. Aircraft’s point cloud has a vertical accuracy of 15.1 cm and a horizontal accuracy of 18.2 cm at 95% confidence level.
In November 2019, using the single-pass flight plan, we flew over eight areas with the GatorEye UAV-LiDAR. Missions were planned in UGCS software. Each of the eight mission were one flight, fully autonomous from take-off to landing. These missions were used to select the areas of interest from the aircraft survey. GatorEye’s point clouds accuracy is around 5 cm. Relative accuracy among a collected point cloud is higher, due to postprocessing alignment using the point clouds and flight trajectories, enabling extremely well-matched point clouds for multitemporal datasets.

2.3. Data Processing

Data processing involved point cloud preprocessing, plots allocation, and generation of LiDAR products and metrics to perform sensor comparison (Figure 3). A total of 82 aircraft LiDAR tiles were overlaid with corresponding GatorEye missions and used to perform the analysis. The GatorEye single-pass was acquired within a range of 180°, which corresponds to a width of approximately 215 m of scanned area (each side) from the flightline. With this information and the flightline vectors shapefiles, polygons with 215 m buffers were created and used to clip the original aircraft point clouds corresponding to the eight GatorEye missions, using the package lidR, function “clip_roi.” After merging and clipping the point clouds, we derived eight final point clouds for each sensor, which we will refer to as LiDAR missions henceforth.
As the LiDAR surveys were acquired in different datums (horizontal and vertical), the first step was to reproject the datasets to the same projection. For horizontal reprojection, we used the GatorEye coordinate reference system (UTM WGS-84) as reference and reprojected all the NAD83 (2011) aircraft point clouds. For the vertical reprojection, the Florida Permanent Reference Network datasheet from the Carabelle site was used as a reference for the reprojection. This reprojection was accomplished by identifying the difference between the reference height (either geoid or ellipsoid) from each dataset, and adding this value (28.689 m) to the point cloud to be converted, using the Quick Terrain Modeler software v8.2.0. In this step, the reference sensor was from the aircraft, and the datum ITRF 2014 (ellipsoid height) from the UAV was transformed to NAVD88 (orthometric height—geoid).
The comparisons between point clouds were performed at the plot level. Within the eight LiDAR missions, we allocated 43 rectangular plots (130 m × 430 m), in a way that the center of the rectangle was placed over the flightline and extending approximately 215 m to each side. Four to six plots were produced for each mission. Each plot was set up to cover forested areas where there was no overlap from the UAV scan, avoiding the few areas with overlap.
For each plot we processed the LiDAR data and compared the results between sensors using rasters and point cloud products. The initial processing was done with the software lastools [41]. The first step of the point cloud processing was the ground classification using lasground with the default parameters of the algorithm, the “wilderness mode,” and computing height. With the ground returns, we generated the 1-m resolution digital terrain model (DTM) and we derived the normalized point cloud, using lasheight, by the difference between DTM and non-ground returns elevation. Finally, the normalized point clouds were used to create the canopy height model (CHM), using the grid_metrics function from the “lidR” [42] package, in the R environment [43], computing the highest elevation value for each pixel.

2.4. Data Analysis

Point cloud density, ground returns, and returns profiles along with the distance to the flightline and scan angle were used to compare each sensor. For density and ground returns, we used the function “grid_density,” from the lidR package, to rasterize total returns and ground returns and obtain the respective density in a one-meter resolution pixel. To produce the returns density profile, returns were aggregated into one-meter vertical height classes, from which the returns density (returns per square meter) along the height were calculated.
We performed a pixel-based comparison between sensors using the DTMs and CHMs by subtracting the aircraft from GatorEye’s raster and plotting the pixel value differences as a function of the flightline distance and scan angle. This step was performed using the R package “raster” [44], where the method was first applied to the raster DTMs to find the elevation difference between them. This difference was then applied to the CHMs in order to remove the ground elevation differences in the CHM. This meant that when we calculated the difference between the CHMs, that difference was only due to canopy height and not due to any ground elevation dissimilarity. In this analysis we evaluated the pixel differences and empty values.
To understand how these empty values are spread throughout the canopy height layers and its distribution along flightline distance and scan angle, we stratified the point cloud into four vertical strata (0–5 m, 5–15 m, 15–25 m, and 25–35 m) and, for each stratum, we analyzed the absence of returns per voxel. Voxel size was 1 m × 1 m × strata height, in meters.
For individual tree detection and crown delineation (ITDD), we generated a smoothed CHM with a 3 × 3 matrix using the function “focal” from the raster package and with the function “median” as an argument, and applied smoothing filters to help eliminate spurious error and limit the number of local maxima detected, thus increasing the accuracy of the algorithm [45]. We used an algorithm inspired by [46], which is based on a local maximum filter and a defined window size (ws), implemented in the lidR package, by the function lmf with a minimum height filter of 8 m and a 2 pixels ws. After detecting trees, their crown boundaries were delimited using the Voronoi tessellation-based algorithm developed by [47], also implemented in lidR and applied in the original CHM. After obtaining the crown delineation, we calculated individual tree crown area per plot. The main result aimed in this step is the understanding of the optimal scan angle and distance to the flightline that provide reliable crown delineation and its possible approaches.

3. Results

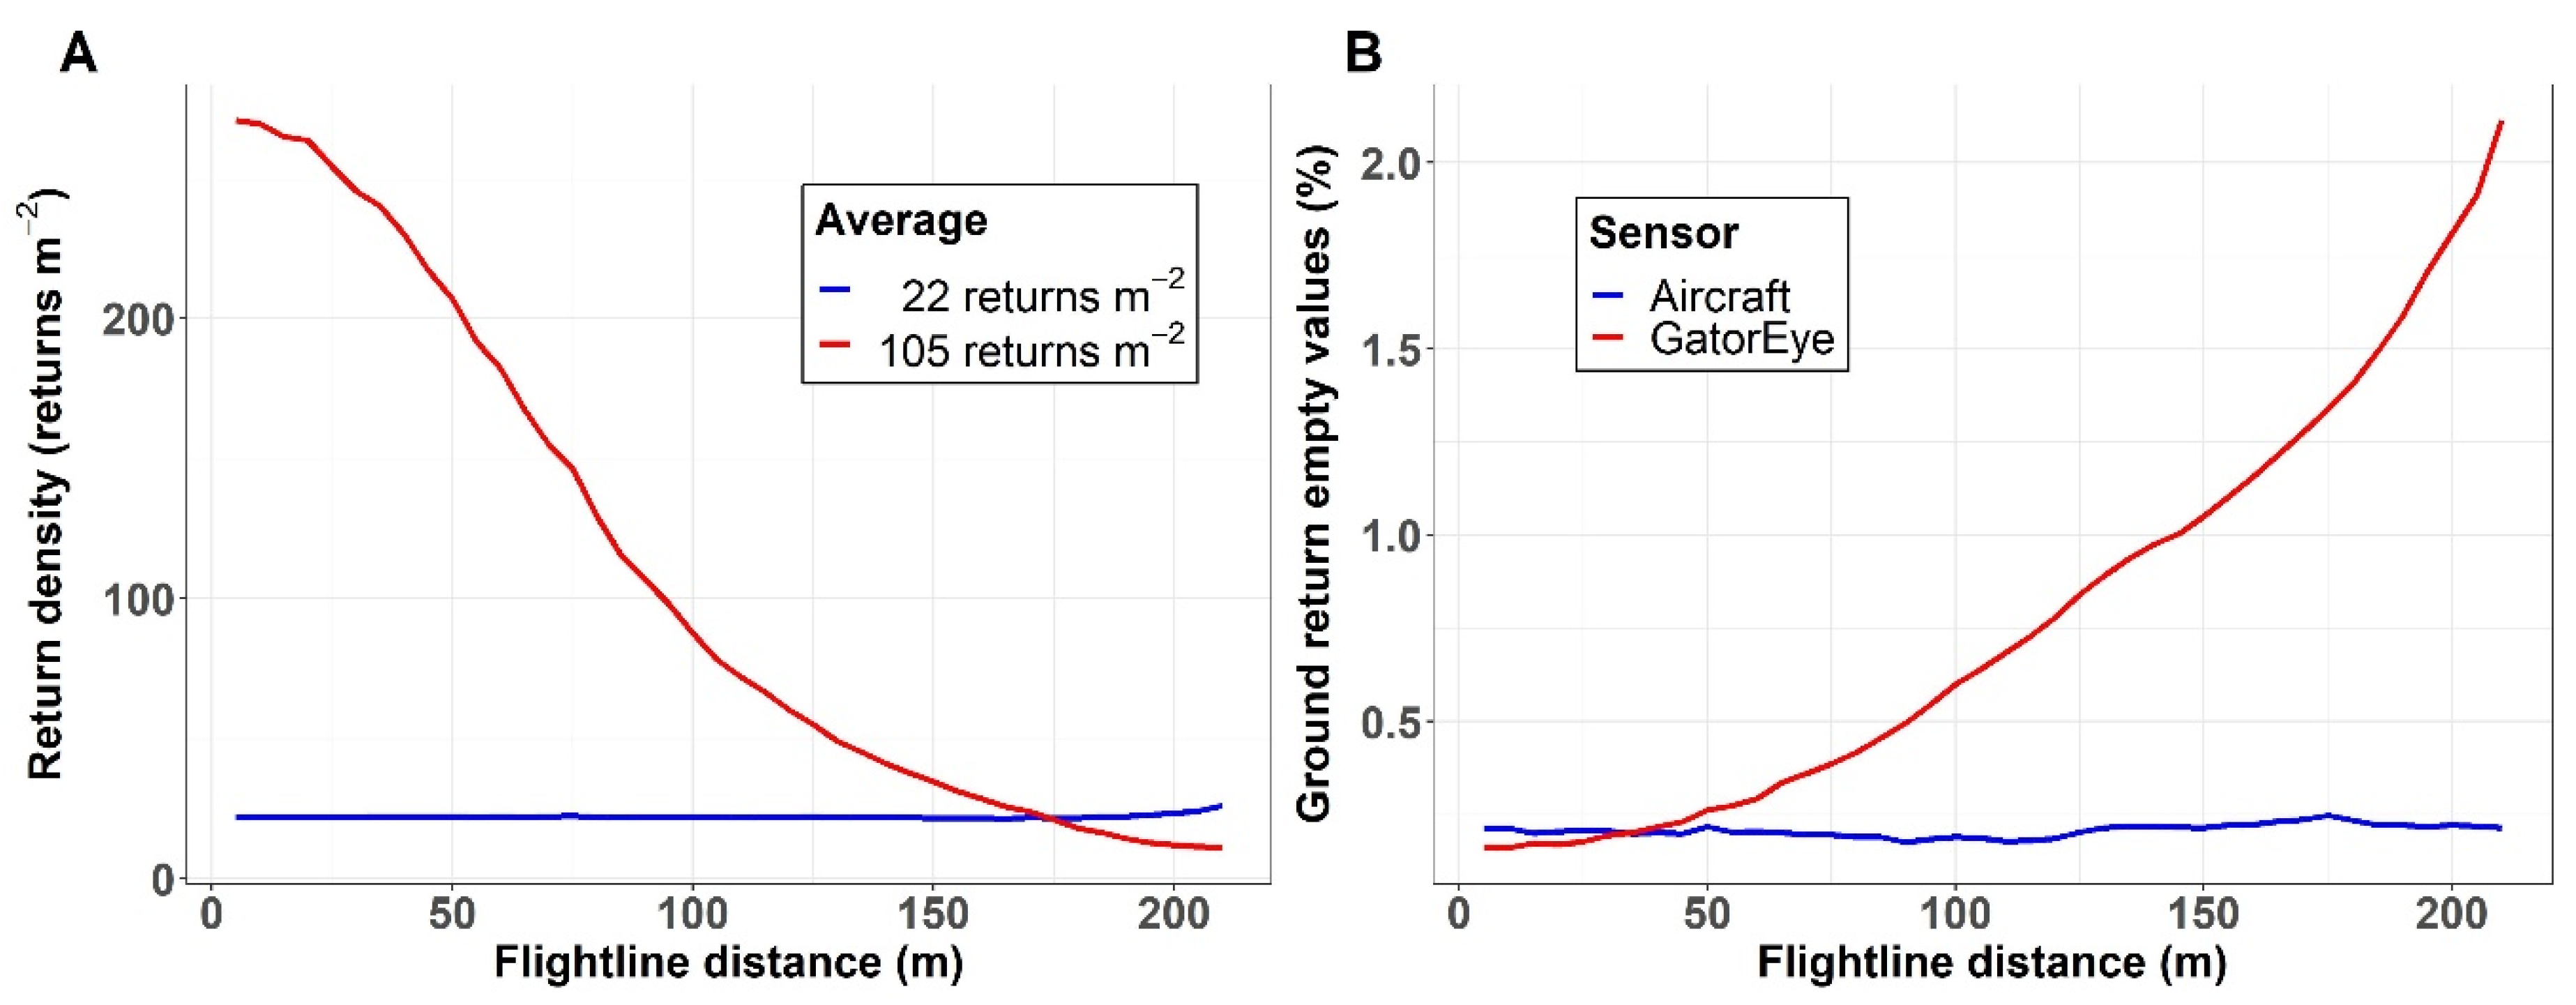
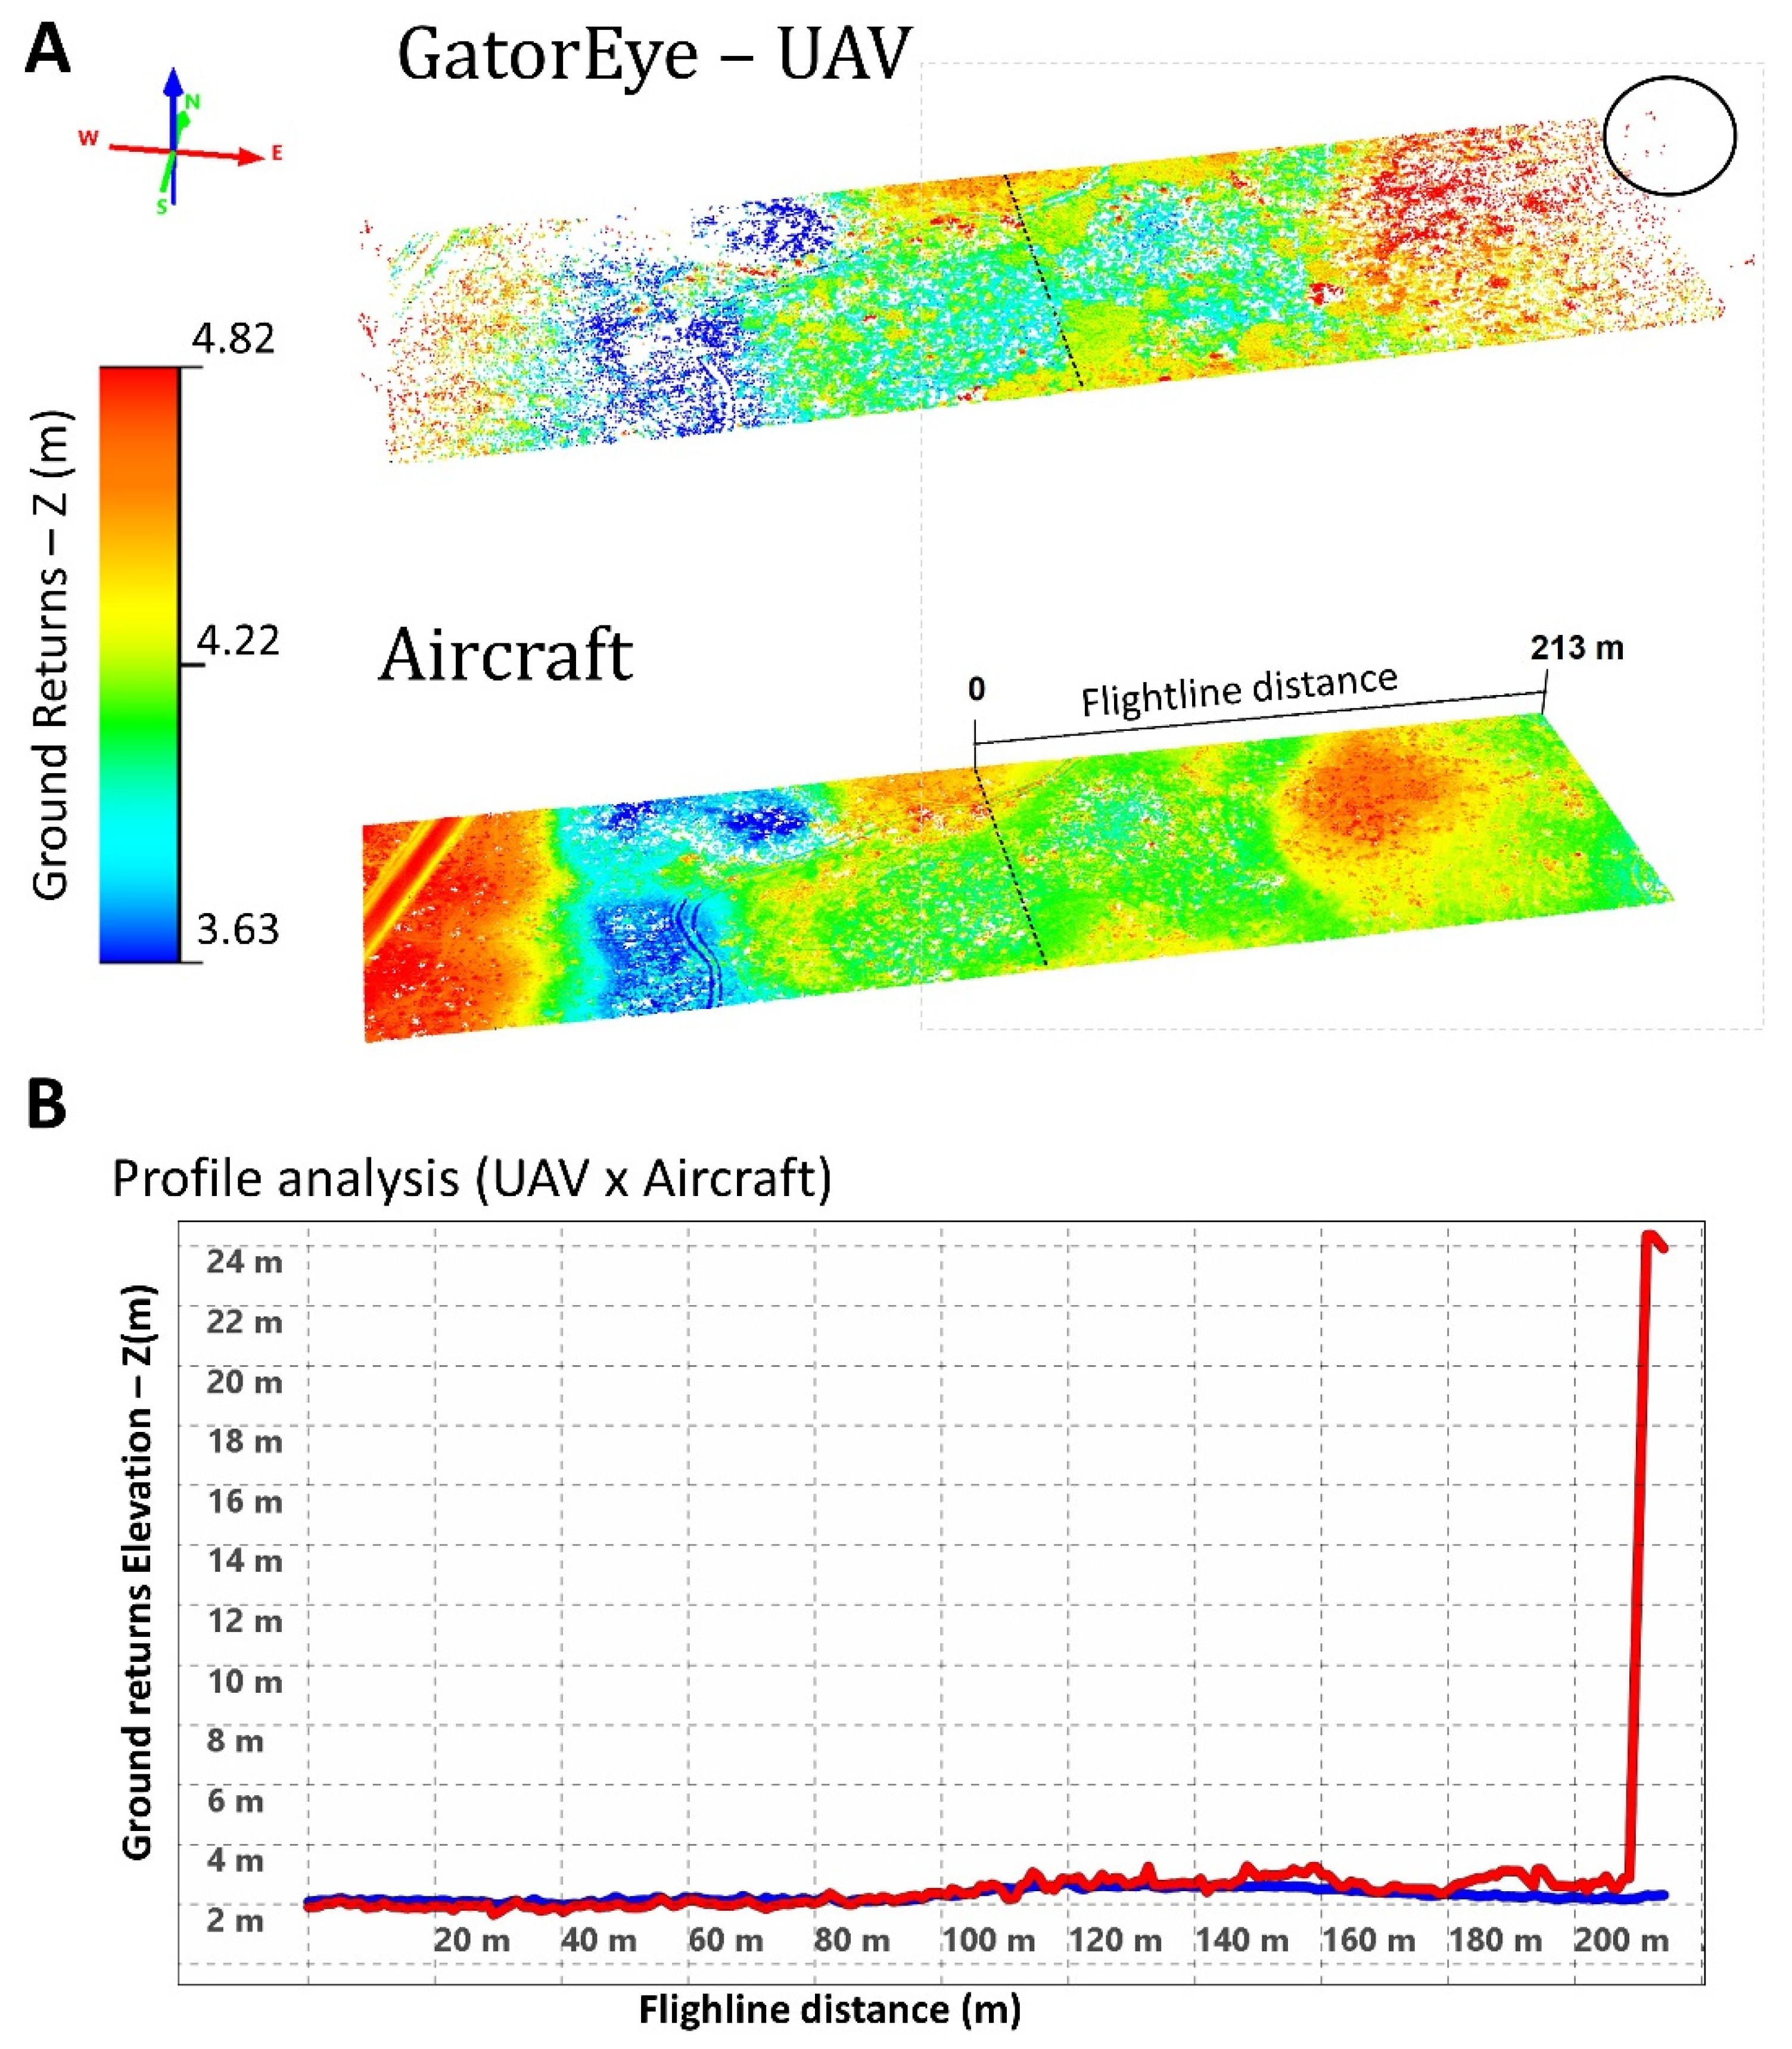
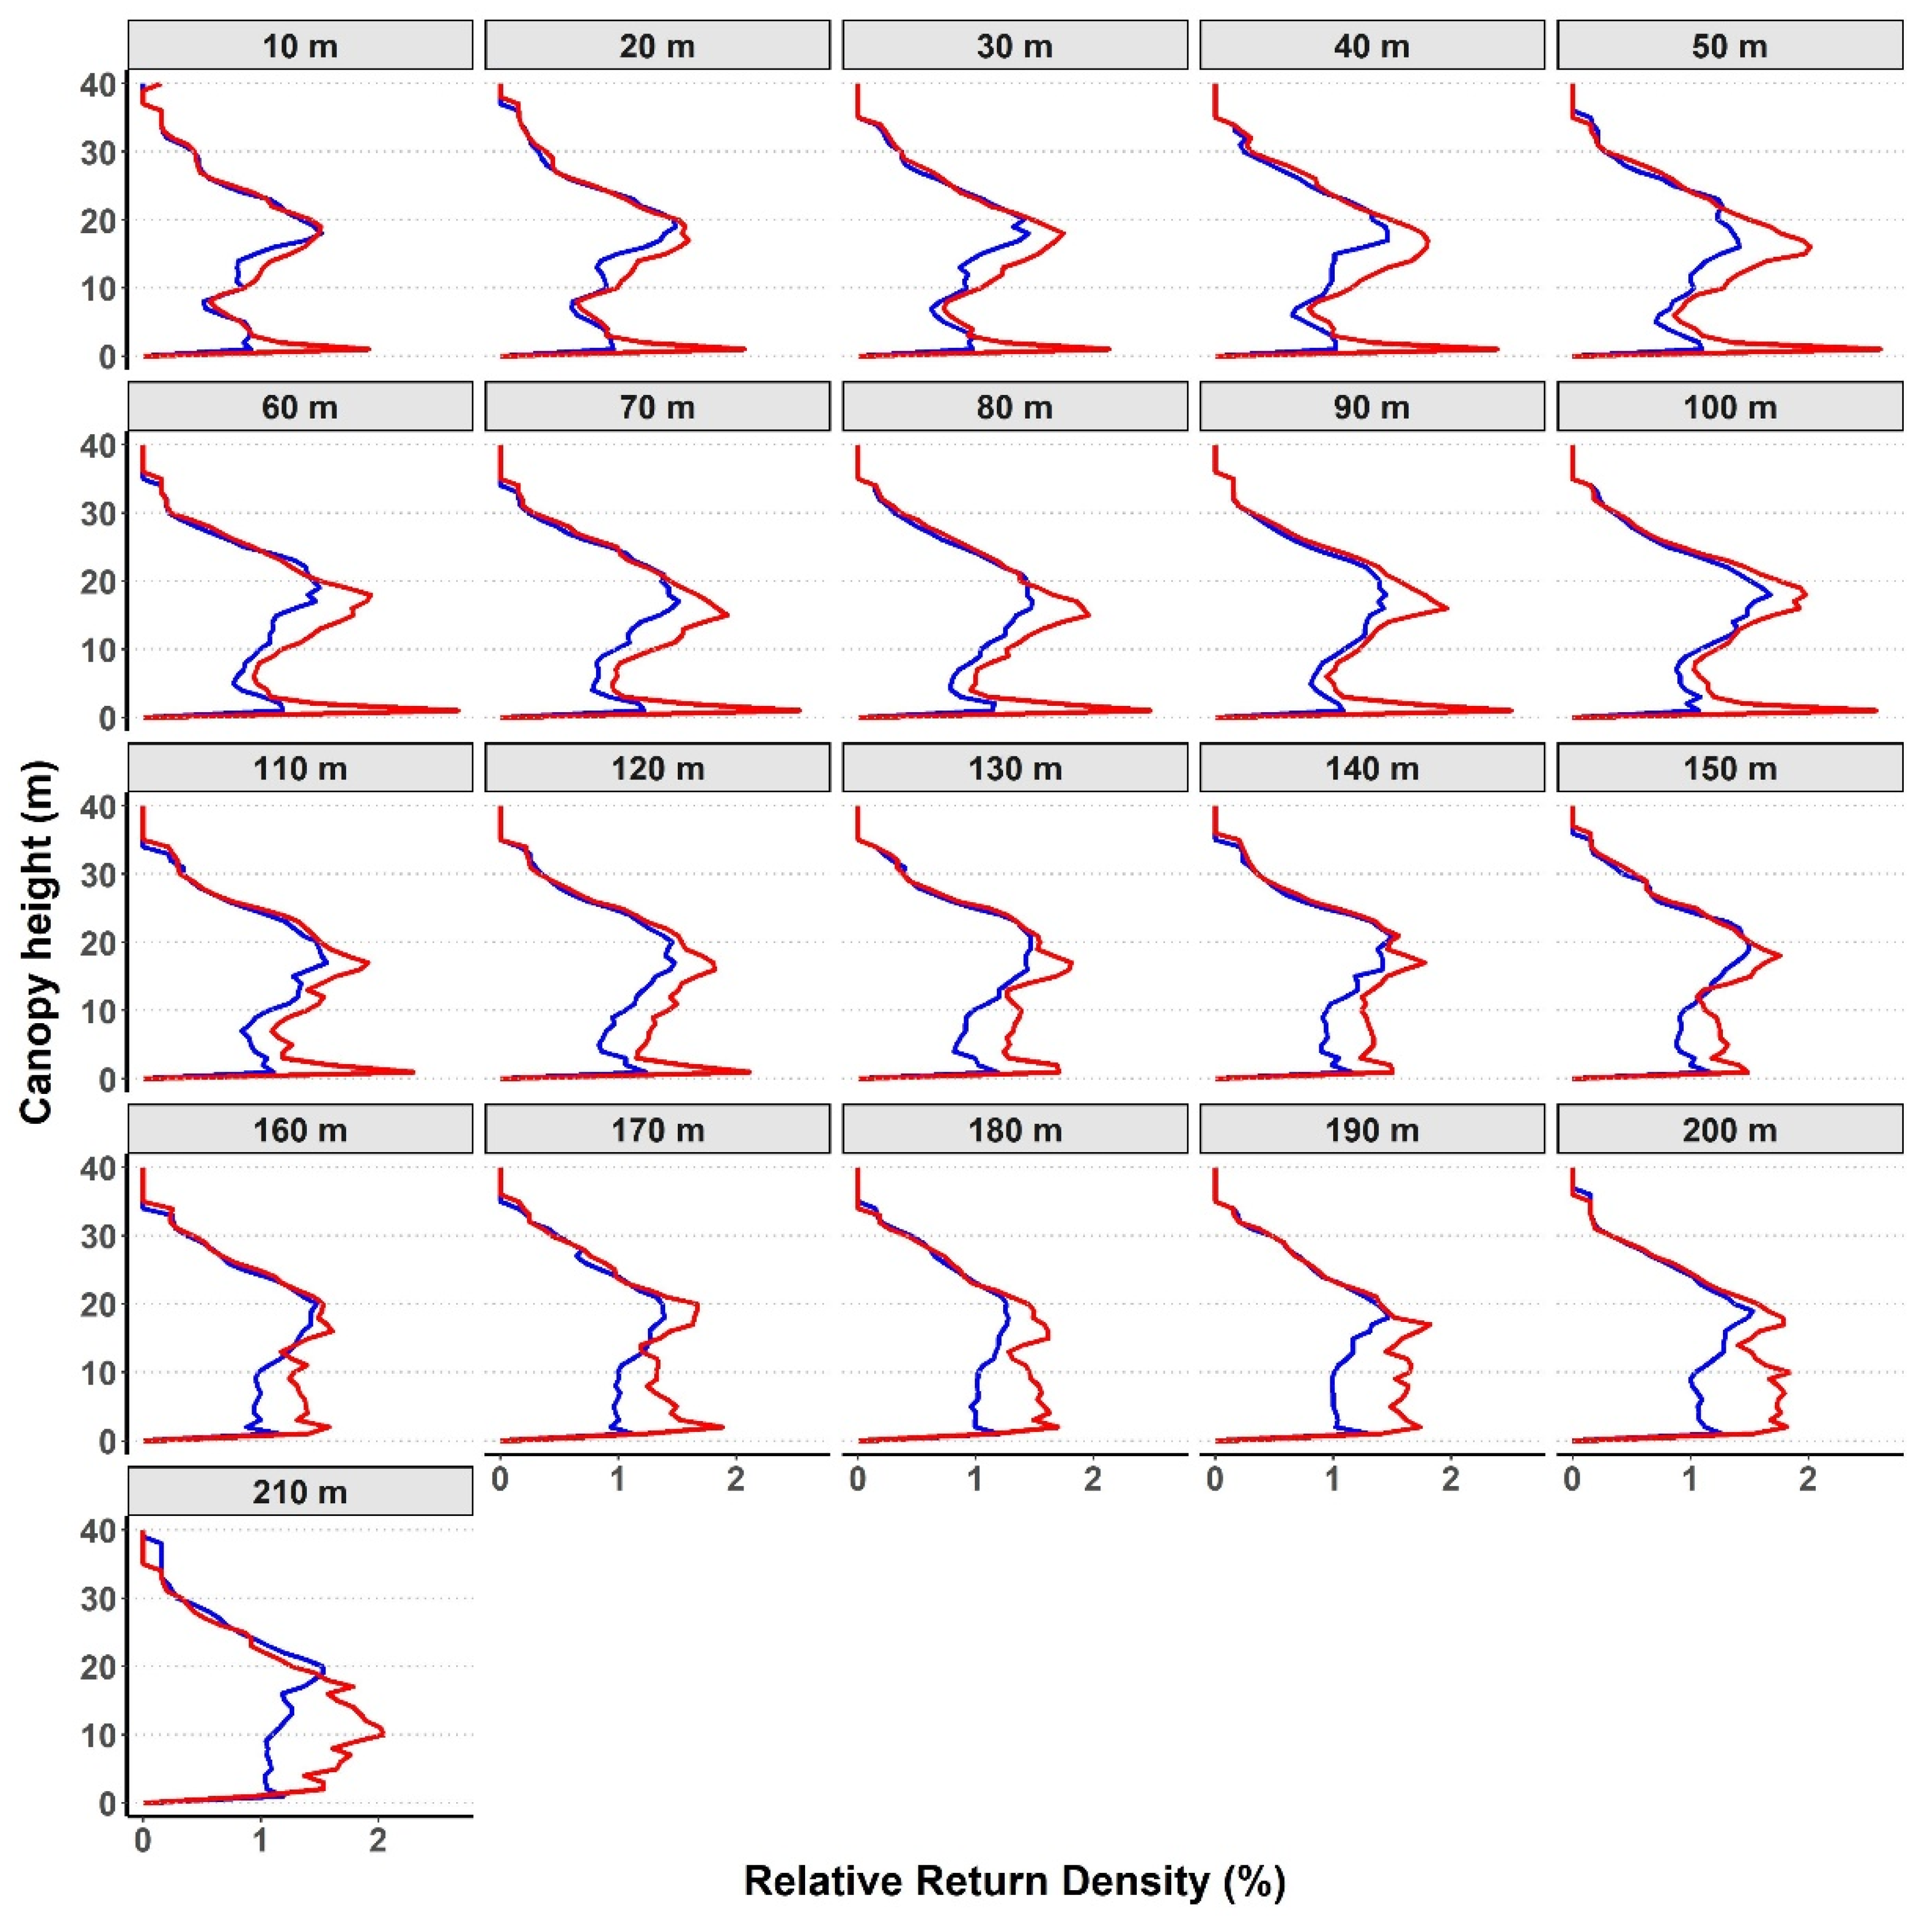
3.1. Point Cloud Comparison

The UAV-LiDAR shows a decreasing return density as the scanning angle increases and the pulses are further from the flightline, starting from 270 returns m−2 at angles close to nadir, and fewer than 10 returns m−2 at 210 m of distance from flightline. The aircraft resulted in the same return density average along the profile (Figure 4A). Along the flightline distance, a similar trend in an inverse order is observed for the absence of ground returns within the plots, which fluctuated from 0.16% to 2.1% for GatorEye and remained stable between 0.21% ± 0.02% (mean ± standard deviation) for the aircraft (Figure 4B). As the distance increases from the flightline, the ground classifier algorithm for the UAV LiDAR classified tree returns as ground (Figure 5). This pattern can be seen clearly in flat topography such as the Apalachicola National Forest.
Besides the differences in point cloud density, both sensors have shown similar behavior patterns for the returns profiles (Figure 6 and Figure 7), which are basically defined by first returns, except the ground returns, in which the high-density returns are shared with the second return (Figure S1). This pattern is most apparent within a 120 m distance of the flightline, where the relative return density curve starts to change between heights of 5 to 15 m. After this threshold, the GatorEye curves start to flatten, and aircraft return density keeps the same pattern across all flighline distances (Figure 7). The GatorEye point cloud had a higher return density within 1 m height, where it observed more than 50 pts·m−2 up to 30 m distant from the flightline, compared with the aircraft LiDAR’s average of 1.25 pts·m−2, which is more than 40 times the average density for the same height and distance (Figure 6). This is the major difference between sensors as seen in the 12 first charts of Figure 7, where the proportion of returns close to the ground is always greater in the GatorEye system. The behavior shown in Figure 6 reinforces the disparity in return density between the sensors, also shown in Figure 4A, with the added context of how these returns are spread throughout the canopy height.

3.2. Raster Comparison

Compared to the DTM derived from aircraft sensor data, GatorEye single-pass derived DTM presented underestimated mean ground elevation by 0.29 ± 0.17 m at 5 m flightline distance and then followed no trend until 140 m, where the difference between sensors mean pixel value was found to be −0.02 ± 0.37 m, growing to 0.02 ± 0.39 at 145 m, 0.35 ± 0.71 m at 170 m, 0.94 ± 1.17 m at 195 m, and 1.56 ± 2.34 m at 200 m from the flightline. After this, GatorEye overestimation became much higher, as much as 9.20 ± 5.04 m at 215 m (Figure 8A). In the 1 m pixel resolution, CHM analysis sensors presented differences of the mean pixel value of about 0.25 ± 1.13 m at 5 m flightline distance and −0.98 ± 1.29 m at 95 m. GatorEye begins to underestimate the canopy height at 120 m compared to the CHM derived from aircraft sensor data, with 1.62 ± 1.45 m differences. This underestimation trend continues with differences of 2.57 ± 1.57 at 175 m, 3.35 ± 1.96 at 200 m, and 9.03 ± 5.07 at 215 m distance from the flightline (Figure 8A). The aircraft CHM did not present empty pixels, while the percentage of empty pixels in the GatorEye CHM increases exponentially with flightline distance. At 100 m, the percentage of empty pixels start to increase from around 0% to around 2% at 120 m, and then to greater than 40% at 200 m (Figure 8B).
By separating the GatorEye empty voxels by height strata (Figure 9), we see how the missing values are spread along the canopy layers. We determined that the first strata of the canopy (0 to 5 m) and the top strata (25 to 35 m) show fewer empty voxels near the flightline as opposed to the intermediate layers. While the first three strata show an abrupt increase in rate of empty voxels after 100 m, the top strata presented the slowest rate of increase and fewer empty voxels overall.

3.3. Individual Tree Detection and Crown Delineation

Since the study area was damaged, however lightly, by Hurricane Michael, the number of tree detection between sensors in this multi-temporal approach was expected to show some differences, which were well captured from the single-pass survey, as shown in Figure 10 (A1,A2 vs. B1,B2), where both sensors could find many of the same trees, but fewer individuals were observed from the GatorEye ITD. This figure also illustrates smaller crowns at wide angles, far from the flightline, and the absence of returns that resulted in empty CHM pixels (Figure 10, A2 vs. B2 and A4 vs. B4).
The comparison in all 43 plots did not bring an accurate value for the single-pass tree detection (Figure 11A), but allowed finding maximum angles thresholds to obtain the tree heights and crown area, assuming that the aircraft survey is the most reliable because of the type of data collection in a grid mode. Aircraft LiDAR presented consistent values of tree heights and crown area varying from 12.5 m to 27.5 m (Figure 11B) and from 25 m2 to 40 m2 (Figure 11C), respectively. The GatorEye found similar tree height ranges up to the flightline distance interval of (160, 180) m (Figure 11B) and similar crown area ranges up to the interval of (40, 60) m (Figure 11C).

4. Discussion

The results of this paper allow us to determine which LiDAR products and at which distance the UAV-borne single-pass approach is able to provide similar quality products compared with the complete area and overlapping data collection methods used by aircraft-borne LiDAR. The products we analyzed include digital terrain and canopy height models (DTM and CHM), a detailed representation of forest structure, and individual tree detection and crown delineation (ITDD). To the best of our knowledge, this is the first study to explore, in detail, the single-pass approach as a method for obtaining LiDAR-derived products.
We found that the return density profile shape follows a similar pattern for each sensor (Figure 6, Figure 7 and Figure S1A). The same result was highlighted by [22], in their comparison between GatorEye UAV-LiDAR and aircraft LiDAR, but in an Amazon forest. In our research, the dual return LiDAR sensor presented a return density profile basically defined by first returns, except the ground returns, in which the high-density returns are shared with the second (last) return (Figure S1C). This pattern was also observed in the aircraft LiDAR point cloud, even if the sensor can produce 7+ returns. There were only a few third and fourth returns compared to first and second returns for the aircraft system (Figure S1B). Nevertheless, our results about the behavior of returns number density in areas of longleaf pine were quite different from those presented by [22] in the Amazon, where second returns were more representative along canopy height (5–25 m), with much fewer ground returns. In areas with dense vegetation the percent increase of second and third returns is observed [21]. The results described in this study should vary among forest ecosystem types, which vary in stem density and leaf area density.
Unlike the single-pass approach, in a grid mode, UAV-LiDAR point clouds can achieve 60 pts·m−2 [26], 160 pts·m−2 [48], 380 pts·m−2 [22], and up to 1400 pts·m−2 [23], while aircraft LiDAR density ranges between 5 and 30 pts·m−2 [25,29,49]. Our results showed that the single-pass survey can still achieve more dense point clouds compared to aircraft, from 270 to 80 pts·m−2 within 120 m and around 20 pts·m−2 up to 175 m distant from the flightline, corresponding respectively to 120° FOV (around 60° scan angle view—Figures S2 and S3) and 150° FOV, with high allocation of returns close to the surface, reaching more than 40 pts·m−2 close to the flightline. Accurate ground returns are achieved up to 170 m from the flightline, where only around 0.5% of the scanned area is not covered by ground returns.
The main limitation to produce reliable DTMs is the ground returns density [28], and because of the high rate of returns that hit the ground, the DTM from single-pass is accurate up to around 195 m from the flightline (approximately 145° FOV, Table S1), with at least 1 m of agreement (0.94 ± 1.17), compared to aircraft DTM at 1 m resolution. These results are similar to [22], which showed a 99% agreement between the DTMs from both systems. In the CHM high-resolution (1 m × 1 m) pixel level comparison, sensors presented differences throughout the scanned area. GatorEye heights were underestimated from −0.98 ± 1.29 m at 95 m, 1.62 ± 1.45 m at 120 m, 2.57 ± 1.57 at 175 m, 3.35 ± 1.96 at 200 m, and 9.03 ± 5.07 at 215 m. These findings demonstrate that this kind of comparison, at the pixel level in a multi-temporal approach, is not recommended at fine scales, such as 1-m sized pixels or smaller. These differences are likely due to natural canopy changes over time, which is even greater after a hurricane, which can cause large differences in canopy shapes. Moreover, in these divergences between sensors, analyzing only the GatorEye CHM, our results show less than 2% of empty pixels up to 120 m from the flightline, which assures the high return density up to this distance, as a signal of accuracy of GatorEye CHM using the single-pass approach. At a further distance from the flightline, the number of empty pixels increases and heights tend to be underestimated due the increased lack of data, caused by the shadowing effect on the far side of the trees [21].
To understand how the GatorEye CHM missing values are spread along the canopy’s layers, we stratified the point cloud through vertical strata and determined that the top layer of the forest, represented by the 25–35 m strata, is the least affected, with less than 5% of empty voxels up to 175 m from the flightline. The accuracy of the CHM highest values can assure the reliability of canopy first layer treetop detection up to this distance (175 m and around 140° FOV). On the other hand, we saw an increase of empty voxels in middle height strata, caused by the occlusion effect of canopy height, highlighting that ITDD of understory trees are not as effective as overstory trees [50]. Further from the flightline the CHM top height strata get close to 10% of empty pixels, which can lead to under-detection of treetops, even in the overstory, resulting in an under-segmentation error [51]. The difference in the number of trees detected between sensors were not the focus of this study, as we did not have a ground truth to validate and our study area experienced (even with low impact) a hurricane between surveys. We could find the maximum distance and scan angle that allowed getting reliable tree heights (around 180 m and 140° FOV, Figure 11B), which is directly related to the CHM top layer accuracy determined in this study, and to which we can assume reliability of tree detection. We identified reliability of the tree’s crown area until the interval distance of 40 m to 60 m, corresponding to around 60° FOV. After this, shadow effects increase, and crown points decrease [21], affecting the performance of crown delineation, with trees beginning to appear to have less crown area when compared to those close to the flightline. This suggests that the single-pass approach is not recommended for obtaining crown metrics, except when using very narrow angles, which means less than 60 m from the flightline (Figure 11C and Figure S3, Table S1).
Spatial information of hurricanes’ disturbance of a forest are essential for managers and scientists to perform efficient management practices. Remote sensing plays an important role in providing this spatial information, especially in conditions that are very difficult to access with field crews. Single-pass surveys can be more than 10 times faster than a grid-mode approach, depending on the characteristics of the flight plan, and rapid surveys allow rapid response after a natural disaster, with enough accuracy to provide valuable information for forest operations such as timber salvage, fuel hazards reduction, etc. Though an in-depth hurricane damage assessment was not the objective of this work, we could understand the accuracy thresholds for a variety of LiDAR products, showing the possibility of this flight design as an option for post disaster management. Our results showed that this analysis is pertinent, for example, in the identification of fallen trees, clearly noticed between pre- and post-images, as shown in Figure 10 (A1 × B1 and A3 × B3), but this should be limited to 175 m from the flightline.
The flightline distance’s thresholds found for each LiDAR product described in this work can be recommended as an optimum distance between flight lines in a grid-mode flight plan for obtaining the respective desired product, even disregarding the overlap of LiDAR pulses that increases the point density. For example, if the purpose of the LiDAR mission is to obtain just a DTM, a grid-mode can be planned with 195 m between flightline.
UAV-LiDAR point clouds’ attributes vary based on flight parameters, with flight altitude being the most important variable reporting significant effects to point cloud density [24]. Changing the flight altitude should not significantly influence the DTM, but will affect the frequency of returns per crown, resulting in changes of CHM, ITD, and crown area [13]. With higher altitudes, an even wider angle of reliable LiDAR product is expected, but with decreased point cloud density. While lower flight heights would decrease the effective angle, they result in a higher return density per square meter. The results obtained in this study can be extended and used for similar flight designs and forest types.

5. Conclusions

In our research, we measured the efficiency of single-pass UAV LiDAR derived products in relation to flightline distance and scan angle, and, according to our flight parameters and for a predominant longleaf pine environment, the quality the LiDAR products achieve at wide angles.
The single-pass UAV survey can still achieve more dense point clouds compared to aircraft up to 175 m from the flightline. Accurate ground returns are achieved up to 170 m from the flightline, where only around 0.5% of the scanned area is not covered by ground returns. Besides the differences in point cloud density, in general, both sensors have shown similar behavior patterns for the returns profile. In general, UAV-LiDAR single-pass derived DTM presented overestimated mean value, with less than 1 m differences compared to the aircraft-derived DTM up to 195 m from the flightline. On the other hand, CHM showed underestimated mean value, with less than 1 m differences up to 95 m from the flightline (110° FOV). UAV-LiDAR single-pass could detect reliable tree heights up to 140° FOV, but as it gets farther from the flightline, tree crowns appeared smaller than the actual size. This suggests that the single-pass approach is not recommended for obtaining crown metrics, except when using very narrow angles, which means less than 60° FOV or approximately less than 60 m from flightline.
An important contribution of these results is not only to demonstrate the capabilities for rapid assessment, but also for designing more efficient flight plans in grid mode, by covering larger areas in the same mission. This methodology is a valuable tool for comparing the results from older LiDAR missions.

Supplementary Materials

The following are available online at https://www.mdpi.com/2072-4292/12/24/4111/s1, Figure S1: (A) GatorEye (red) and Aircraft (blue) LiDAR points density profile (pts·m−2). (B) Points density profile for all returns for aircraft (1–4) and (C) for GatorEye (2). Figure S2: Relation between distance from flightline and scan angle, combining 10 thousand sample points from each of the 43 plots. Figure S3: Relation between distance from the flightline and scan angle. Black line is the mean value of the observed angles and grey lines are plus and minus the standard deviations. Red lines show the main thresholds found, at 40 m, 60 m, 95 m, 120 m, and 175 m, and the corresponding approximated angle, 30°, 40°, 55°, 60°, and 70°, respectively. Table S1. GatorEye’s products best quality thresholds for the single-pass approach.

Author Contributions

G.A.P. and E.N.B.: conceptualization, field data collection, formal analysis, investigation, project administration, resources, and writing—original draft. D.R.A.d.A. and A.P.D.C.: conceptualization and writing—original draft. C.A.S.: conceptualization and analysis and writing—review. J.S.P., J.D., and P.M.: conceptualization, data curation, and writing—review. R.V.: conceptualization, writing—original draft. J.V., A.S., A.M.A.Z., and B.W.: writing—review. All authors have read and agreed to the published version of the manuscript.

Funding

This research was funded by the Gulf Coast Ecosystem Restoration Council (RESTORE Council) through an interagency agreement with the USDA Forest Service (17-IA-11083150-001) for the Apalachicola Tate’s Hell Strategy 1 project. Additional funding from grant USDA-NIFA 2020-67030-30714 supported E.N.B. and J.V. in the maintenance of the GatorEye system. D.R.A.d.A. was supported by the São Paulo Research Foundation (#2018/21338-3 and #2019/14697-0). A.P.D.C. was financed in part by the Coordenação de Aperfeiçoamento de Pessoal de Nível Superior—Brasil (CAPES)—Finance Code 001 (88887.373249/2019-00) and MCTIC/CNPq No. 28/2018 (408785/2018-7).

Acknowledgments

We acknowledge the Spatial Ecology and Conservation (SPEC) Lab at the University of Florida, who funded and collected the GatorEye Unmanned Flying Laboratory lidar data, the FAMU Center for Spatial Ecology and Restoration at the Florida Agricultural and Mechanical University, who made part of the paper conceptualization and shared the FL Panhandle Lidar Project aircraft data, and all the researchers from these labs.

Conflicts of Interest

The authors declare no conflict of interest.

References

  1. Lefsky, M.A.; Cohen, W.B.; Parker, G.G.; Harding, D.J. Lidar Remote Sensing for Ecosystem Studies. Bioscience 2002, 52, 19–30. [Google Scholar] [CrossRef]
  2. Kwan, M.P.; Ransberger, D.M. LiDAR assisted emergency response: Detection of transport network obstructions caused by major disasters. Comput. Environ. Urban Syst. 2010, 34, 179–188. [Google Scholar] [CrossRef]
  3. Lin, Y.; Hyyppa, J.; Jaakkola, A. Mini-UAV-Borne LIDAR for Fine-Scale Mapping. IEEE Geosci. Remote Sens. Lett. 2011, 8, 426–430. [Google Scholar] [CrossRef]
  4. Guerra-Hernández, J.; Cosenza, D.N.; Rodriguez, L.C.E.; Silva, M.; Tomé, M.; Díaz-Varela, R.A.; González-Ferreiro, E. Comparison of ALS- and UAV(SfM)-derived high-density point clouds for individual tree detection in Eucalyptus plantations. Int. J. Remote Sens. 2018, 39, 5211–5235. [Google Scholar] [CrossRef]
  5. Wulder, M.A.; White, J.C.; Nelson, R.F.; Næsset, E.; Ørka, H.O.; Coops, N.C.; Hilker, T.; Bater, C.W.; Gobakken, T. Lidar sampling for large-area forest characterization: A review. Remote Sens. Environ. 2012, 121, 196–209. [Google Scholar] [CrossRef] [Green Version]
  6. Lausch, A.; Erasmi, S.; King, D.J.; Magdon, P.; Heurich, M. Understanding forest health with Remote sensing-Part II-A review of approaches and data models. Remote Sens. 2017, 9, 129. [Google Scholar] [CrossRef] [Green Version]
  7. Gelabert, P.J.; Montealegre, A.L.; Lamelas, M.T.; Domingo, D. Forest structural diversity characterization in Mediterranean landscapes affected by fires using Airborne Laser Scanning data. GISci. Remote Sens. 2020, 57, 497–509. [Google Scholar] [CrossRef]
  8. Klauberg, C.; Hudak, A.T.; Silva, C.A.; Lewis, S.A.; Robichaud, P.R.; Jain, T.B. Characterizing fire effects on conifers at tree level from airborne laser scanning and high-resolution, multispectral satellite data. Ecol. Modell. 2019, 412, 108820. [Google Scholar] [CrossRef]
  9. Alonzo, M.; Morton, D.C.; Cook, B.D.; Andersen, H.-E.; Babcock, C.; Pattison, R. Patterns of canopy and surface layer consumption in a boreal forest fire from repeat airborne lidar. Environ. Res. Lett. 2017, 12, 065004. [Google Scholar] [CrossRef]
  10. Sherman, D.J.; Hales, B.U.; Potts, M.K.; Ellis, J.T.; Liu, H.; Houser, C. Impacts of Hurricane Ike on the beaches of the Bolivar Peninsula, TX, USA. Geomorphology 2013, 199, 62–81. [Google Scholar] [CrossRef]
  11. Meredith, A.; Eslinger, D.; Aurin, D. An Evaluation of Hurricane Induced Erosion Along the North Carolina Coast Using Airborne LIDAR Surveys; Technical Report NOAA/CSC/99031-PUB; NOAA Coastal Services Center: Charleston, SC, USA, 1999. [Google Scholar]
  12. Næsset, E. Predicting forest stand characteristics with airborne scanning laser using a practical two-stage procedure and field data. Remote Sens. Environ. 2002, 80, 88–99. [Google Scholar] [CrossRef]
  13. Goodwin, N.R.; Coops, N.C.; Culvenor, D.S. Assessment of forest structure with airborne LiDAR and the effects of platform altitude. Remote Sens. Environ. 2006, 103, 140–152. [Google Scholar] [CrossRef]
  14. Almeida, D.R.A.; Almeyda Zambrano, A.M.; Broadbent, E.N.; Wendt, A.L.; Foster, P.; Wilkinson, B.E.; Salk, C.; Papa, D.d.A.; Stark, S.C.; Valbuena, R.; et al. Detecting successional changes in tropical forest structure using GatorEye drone-borne lidar. Biotropica 2020, 1–13. [Google Scholar] [CrossRef]
  15. Almeida, D.R.A.; Broadbent, E.N.; Zambrano, A.M.A.; Wilkinson, B.E.; Ferreira, M.E.; Chazdon, R.; Meli, P.; Gorgens, E.B.; Silva, C.A.; Stark, S.C.; et al. Monitoring the structure of forest restoration plantations with a drone-lidar system. Int. J. Appl. Earth Obs. Geoinf. 2019, 79, 192–198. [Google Scholar] [CrossRef]
  16. Elkind, K.; Sankey, T.T.; Munson, S.M.; Aslan, C.E. Invasive buffelgrass detection using high-resolution satellite and UAV imagery on Google Earth Engine. Remote Sens. Ecol. Conserv. 2019, 5, 318–331. [Google Scholar] [CrossRef]
  17. Kellner, J.R.; Armston, J.; Birrer, M.; Cushman, K.C.; Duncanson, L.; Eck, C.; Falleger, C.; Imbach, B.; Král, K.; Krůček, M.; et al. New Opportunities for Forest Remote Sensing Through Ultra-High-Density Drone Lidar. Surv. Geophys. 2019, 40, 959–977. [Google Scholar] [CrossRef] [Green Version]
  18. Liu, K.; Shen, X.; Cao, L.; Wang, G.; Cao, F. Estimating forest structural attributes using UAV-LiDAR data in Ginkgo plantations. ISPRS J. Photogramm. Remote Sens. 2018, 146, 465–482. [Google Scholar] [CrossRef]
  19. Sankey, T.; Donager, J.; McVay, J.; Sankey, J.B. UAV lidar and hyperspectral fusion for forest monitoring in the southwestern USA. Remote Sens. Environ. 2017, 195, 30–43. [Google Scholar] [CrossRef]
  20. Wallace, L.O.; Lucieer, A.; Watson, C.S. Assessing the feasibility of uav-based lidar for high resolution forest change detection. ISPRS Int. Arch. Photogramm. Remote Sens. Spat. Inf. Sci. 2012, XXXIX-B7, 499–504. [Google Scholar] [CrossRef] [Green Version]
  21. Wallace, L.; Lucieer, A.; Watson, C.; Turner, D. Development of a UAV-LiDAR system with application to forest inventory. Remote Sens. 2012, 4, 1519–1543. [Google Scholar] [CrossRef] [Green Version]
  22. D’Oliveira, M.V.N.; Broadbent, E.N.; Oliveira, L.C.; Almeida, D.R.A.; Papa, D.A.; Ferreira, M.E.; Zambrano, A.M.A.; Silva, C.A.; Avino, F.S.; Prata, G.A.; et al. Aboveground Biomass Estimation in Amazonian Tropical Forests: A Comparison of Aircraft- and GatorEye UAV-borne LiDAR Data in the Chico Mendes Extractive Reserve in Acre, Brazil. Remote Sens. 2020, 12, 1754. [Google Scholar] [CrossRef]
  23. Dalla Corte, A.P.; Rex, F.E.; Almeida, D.R.A.D.; Sanquetta, C.R.; Silva, C.A.; Moura, M.M.; Wilkinson, B.; Zambrano, A.M.A.; Cunha Neto, E.M.D.; Veras, H.F.P.; et al. Measuring Individual Tree Diameter and Height Using GatorEye High-Density UAV-Lidar in an Integrated Crop-Livestock-Forest System. Remote Sens. 2020, 12, 863. [Google Scholar] [CrossRef] [Green Version]
  24. Sofonia, J.J.; Phinn, S.; Roelfsema, C.; Kendoul, F.; Rist, Y. Modelling the effects of fundamental UAV flight parameters on LiDAR point clouds to facilitate objectives-based planning. ISPRS J. Photogramm. Remote Sens. 2019, 149, 105–118. [Google Scholar] [CrossRef]
  25. Almeida, D.R.A.; Stark, S.C.; Shao, G.; Schietti, J.; Nelson, B.W.; Silva, C.A.; Gorgens, E.B.; Valbuena, R.; Papa, D.d.A.; Brancalion, P.H.S. Optimizing the Remote Detection of Tropical Rainforest Structure with Airborne Lidar: Leaf Area Profile Sensitivity to Pulse Density and Spatial Sampling. Remote Sens. 2019, 11, 92. [Google Scholar] [CrossRef] [Green Version]
  26. Wallace, L.; Watson, C.; Lucieer, A. Detecting pruning of individual stems using airborne laser scanning data captured from an Unmanned Aerial Vehicle. Int. J. Appl. Earth Obs. Geoinf. 2014, 30, 76–85. [Google Scholar] [CrossRef]
  27. Colomina, I.; Molina, P. Unmanned aerial systems for photogrammetry and remote sensing: A review. ISPRS J. Photogramm. Remote Sens. 2014, 92, 79–97. [Google Scholar] [CrossRef] [Green Version]
  28. Lee, C.C.; Wang, C.K. Effect of flying altitude and pulse repetition frequency on laser scanner penetration rate for digital elevation model generation in a tropical forest. GISci. Remote Sens. 2018, 55, 817–838. [Google Scholar] [CrossRef]
  29. Jin, C.; Oh, C.Y.; Shin, S.; Njungwi, N.W.; Choi, C. A comparative study to evaluate accuracy on canopy height and density using UAV, ALS, and fieldwork. Forests 2020, 11, 241. [Google Scholar] [CrossRef] [Green Version]
  30. Tejada, G.; Görgens, E.B.; Espírito-Santo, F.D.B.; Cantinho, R.Z.; Ometto, J.P. Evaluating spatial coverage of data on the aboveground biomass in undisturbed forests in the Brazilian Amazon. Carbon Balance Manag. 2019, 14, 11. [Google Scholar] [CrossRef] [Green Version]
  31. De Almeida, C.T.; Galvão, L.S.; Aragão, L.E.D.O.C.; Ometto, J.P.H.B.; Jacon, A.D.; Pereira, F.R.D.S.; Sato, L.Y.; Lopes, A.P.; Graça, P.M.L.D.A.; Silva, C.V.D.J.; et al. Combining LiDAR and hyperspectral data for aboveground biomass modeling in the Brazilian Amazon using different regression algorithms. Remote Sens. Environ. 2019, 232, 111323. [Google Scholar] [CrossRef]
  32. Gorgens, E.B.; Motta, A.Z.; Assis, M.; Nunes, M.H.; Jackson, T.; Coomes, D.; Rosette, J.; Aragão, L.E.O.C.; Ometto, J.P. The giant trees of the Amazon basin. Front. Ecol. Environ. 2019, 17, 373–374. [Google Scholar] [CrossRef] [Green Version]
  33. Liu, J.; Skidmore, A.K.; Jones, S.; Wang, T.; Heurich, M.; Zhu, X.; Shi, Y. Large off-nadir scan angle of airborne LiDAR can severely affect the estimates of forest structure metrics. ISPRS J. Photogramm. Remote Sens. 2018, 136, 13–25. [Google Scholar] [CrossRef]
  34. Qin, H.; Wang, C.; Xi, X.; Tian, J.; Zhou, G. Simulating the effects of the airborne lidar scanning angle, flying altitude, and pulse density for forest foliage profile retrieval. Appl. Sci. 2017, 7, 712. [Google Scholar] [CrossRef] [Green Version]
  35. Pilarska, M.; Ostrowski, W.; Bakuła, K.; Górski, K.; Kurczyński, Z. The potential of light laser scanners developed for unmanned aerial vehicles—The review and accuracy. Int. Arch. Photogramm. Remote Sens. Spat. Inf. Sci. ISPRS Arch. 2016, 42, 87–95. [Google Scholar] [CrossRef] [Green Version]
  36. Baltsavias, E.P. Airborne laser scanning: Basic relations and formulas. ISPRS J. Photogramm. Remote Sens. 1999, 54, 199–214. [Google Scholar] [CrossRef]
  37. Brockway, D.G.; Outcalt, K.W.; Tomczak, D.J.; Johnson, E.E. Restoration of Longleaf Pine Ecosystems; General Technical Report; U.S. Department of Agriculture, Forest Service, Southern Research Station: Asheville, NC, USA, 2005; Volume 83, pp. 1–34.
  38. Zampieri, N.E.; Pau, S.; Okamoto, D.K. The impact of Hurricane Michael on longleaf pine habitats in Florida. Sci. Rep. 2020, 10, 8483. [Google Scholar] [CrossRef]
  39. Peter, J.; Anderson, C.; Drake, J.; Medley, P. Spatially quantifying forest loss at landscape-scale following a major storm event. Remote Sens. 2020, 12, 1138. [Google Scholar] [CrossRef] [Green Version]
  40. Broadbent, E.N.; Zambrano, A.M.A.; Omans, G.; Adler, A.; Alonso, P.; Naylor, D.; Chenevert, G.; Murtha, T.; Vogel, J.; Almeida, D.R.A.; et al. In Prep. The GatorEye Unmanned Flying Laboratory: Sensor Fusion for 4D Ecological Analysis through Custom Hardware and Algorithm Integration. Available online: http://www.gatoreye.org (accessed on 10 September 2020).
  41. Isenburg, M. LAStools—Efficient LiDAR Processing Software. (Version 191111 Licensed). Available online: http://rapidlasso.com/LAStools (accessed on 9 August 2020).
  42. Roussel, J.; Auty, D. Airborne LiDAR Data Manipulation and Visualization for Forestry Applications; R Package Version 3.0.4; 2019; Available online: https://cran.r-project.org/package=lidR (accessed on 9 August 2020).
  43. R Core Team. A Language and Environment for Statistical Computing. In R Foundation for Statistical Computing; Vienna, Austria; Available online: https://www.R-project.org/2020 (accessed on 9 August 2020).
  44. Hijmans, R.J. Raster: Geographic Data Analysis and Modeling; R Package Version 3.4-5; 2020; Available online: https://CRAN.R-project.org/package=raster (accessed on 9 August 2020).
  45. Lindberg, E.; Hollaus, M. Comparison of Methods for Estimation of Stem Volume, Stem Number and Basal Area from Airborne Laser Scanning Data in a Hemi-Boreal Forest. Remote Sens. 2012, 4, 1004–1023. [Google Scholar] [CrossRef] [Green Version]
  46. Popescu, S.C.; Wynne, R.H. Seeing the trees in the forest: Using lidar and multispectral data fusion with local filtering and variable window size for estimating tree height. Photogramm. Eng. Remote Sens. 2004, 70, 589–604. [Google Scholar] [CrossRef] [Green Version]
  47. Silva, C.A.; Hudak, A.T.; Vierling, L.A.; Loudermilk, E.L.; O’Brien, J.J.; Hiers, J.K.; Jack, S.B.; Gonzalez-Benecke, C.; Lee, H.; Falkowski, M.J.; et al. Imputation of Individual Longleaf Pine (Pinus palustris Mill.) Tree Attributes from Field and LiDAR Data. Can. J. Remote Sens. 2016, 42, 554–573. [Google Scholar] [CrossRef]
  48. Wu, X.; Shen, X.; Cao, L.; Wang, G.; Cao, F. Assessment of individual tree detection and canopy cover estimation using unmanned aerial vehicle based light detection and ranging (UAV-LiDAR) data in planted forests. Remote Sens. 2019, 11, 908. [Google Scholar] [CrossRef] [Green Version]
  49. Rex, F.E.; Silva, C.A.; Dalla Corte, A.P.; Klauberg, C.; Mohan, M.; Cardil, A.; Silva, V.S.D.; de Almeida, D.R.A.; Garcia, M.; Broadbent, E.N.; et al. Comparison of Statistical Modelling Approaches for Estimating Tropical Forest Aboveground Biomass Stock and Reporting Their Changes in Low-Intensity Logging Areas Using Multi-Temporal LiDAR Data. Remote Sens. 2020, 12, 1498. [Google Scholar] [CrossRef]
  50. Hamraz, H.; Contreras, M.A.; Zhang, J. Forest understory trees can be segmented accurately within sufficiently dense airborne laser scanning point clouds. Sci. Rep. 2017, 7, 1–9. [Google Scholar] [CrossRef] [PubMed] [Green Version]
  51. Yin, D.; Wang, L. Individual mangrove tree measurement using UAV-based LiDAR data: Possibilities and challenges. Remote Sens. Environ. 2019, 223, 34–49. [Google Scholar] [CrossRef]
Figure 1. Location of study sites in north of the State of Florida, southeastern region of the United States at the Apalachicola National Forest (Sentinel-2 true color composite satellite image). The red polygons in the satellite image are the eight GatorEye UAV-LiDAR single-pass survey locations. Each box (1 to 8) corresponds to a location and is colored with the canopy height models (CHM). Dashed strips are each flightline and the green boxes are the plots (130 m × 430 m), in a total of 43 plots.
Remotesensing 12 04111 g001
Figure 2. Examples of GatorEye UAV-LiDAR (up) and aircraft LiDAR (bottom) point cloud profiles. Returns colored by height. Quick Terrain Modeler software’s visualization.
Remotesensing 12 04111 g002
Figure 3. Methods workflow, from raw data to LiDAR products sensor comparisons. In red, GatorEye’s and, in blue, aircraft LiDAR data pre-processing.
Remotesensing 12 04111 g003
Figure 4. GatorEye UAV-LiDAR (red) and aircraft LiDAR (blue) return density (A) and ground returns (B) along the flightline distance.
Remotesensing 12 04111 g004
Figure 5. (A) Example of one rectangle plot (130 m × 430 m) showing GatorEye UAV-LiDAR and aircraft LiDAR ground returns along flightline distance, and misclassification for GatorEye in wide angles (highlighted by the black circle). (B) Ground return profile analysis (Red = UAV, Blue = aircraft), and the abrupt increase in the GatorEye ground elevation return after 200 m from the flightline. Rectangle plots, scales, and profile analysis charts were captured from the Quick Terrain Modeler software.
Remotesensing 12 04111 g005
Figure 6. Returns density profile behavior per flightline distance. (A) GatorEye UAV-LiDAR profile in red tint color palette and the aircraft LiDAR in blue dashed. The red tint curves grow from left to right, with a respective distance of 210 m to 30 m. (B) Magnified aircraft system profile of the blue dashed line from the left chart.
Remotesensing 12 04111 g006
Figure 7. GatorEye UAV-LiDAR (red) and aircraft LiDAR (blue) relative return density along the distance from the flightline. Each chart is titled with the respective distance from the flightline that the point cloud was filtered, varying from 10 to 210 m. The X axis brings the relative returns density that floats from 0 to approximately 3%. The Y axis presents the height of the canopy, ranging from 0 to almost 40 m.
Remotesensing 12 04111 g007
Figure 8. (A) DTM and CHM pixel level comparison between aircraft and GatorEye UAV-LiDAR sensors. (B) Quantity of empty pixels for GatorEye CHM images.
Remotesensing 12 04111 g008
Figure 9. Percent of empty voxels from GatorEye UAV-LiDAR stratified CHM by flightline distance for four height strata.
Remotesensing 12 04111 g009
Figure 10. (A) GatorEye UAV-LiDAR post-hurricane Michael (low impact area) and (B) aircraft LiDAR pre hurricane CHM with trees detected. (A1,A2,B1,B2) Tree detections locations and crowns delineation. (A3,A4,B3,B4) point clouds corresponding to each location.
Remotesensing 12 04111 g010
Figure 11. GatorEye (red) and aircraft LiDAR (blue). (A) Difference in the numbers of tree detection between sensors along flightline distance. (B) Average of trees’ heights along the distance from the flightline. (C) Average of trees’ crown area along the distance.
Remotesensing 12 04111 g011
Table 1. Aircraft and UAV system parameters for this data collection.
ParameterAircraft LiDARGatorEye UAV-LiDAR
SystemRiegl VQ-1560iVelodyne VLP-32c
Number of Lasers132
Altitude (AGL meters)160080
Approx. Flight Speed (m/s)82.312
Scanner Pulse Rate (kHz)20000.6
Swath Width (m)1848420
Swath Overlap (%)300
Field of view—FOV (degree) sideways60180
Sensor Scan Angle (degrees) front-back0−25 to +20
Returns per Square Meter (average)22105
Maximum Number of Returns per Pulse7+2
Publisher’s Note: MDPI stays neutral with regard to jurisdictional claims in published maps and institutional affiliations.

